

Abstract
Objective:
Various continuous quality improvement (CQI) approaches have been used to improve quality of cardiopulmonary resuscitation (CPR) delivered at the scene of out-of-hospital cardiac arrest. We evaluated a post-event, self-assessment, CQI feedback form to determine its impact on delivery of CPR quality metrics.
Methods:
This before/after retrospective review evaluated data from a CQI program in a midsized urban emergency medical services (EMS) system using CPR quality metrics captured by Zoll Medical Inc. X-series defibrillators in adult patients (≥18 years old) with non-traumatic out-of-hospital cardiac arrest. Two nine-month periods, one before and one after implementation of the feedback form on December 31, 2013 were evaluated. Metrics included the mean and percent of goal achievement for chest compression depth (goal: >5 centimeters [cm]; > 90%/episode), rate (goal: 100-120 compressions/minute [min]), chest compression fraction (goal: ≥75%), and preshock pause (<10 seconds [sec]). The feedback form was distributed to all EMS providers involved in the resuscitation within 72 hours for self-review.
Results:
A total of 439 encounters before and 621 encounters after were evaluated including basic life support (BLS) and advanced life support (ALS) providers. The Before Group consisted of 408 patients with an average age of 61 ±17 years, 61.8% male, and race distribution of: 43.4% White, 25.3% Black, 3.7% Hispanic, 1.5% Asian, 0.3% Other, and 26.0% Unknown. The After Group consisted of 556 patients with an average age of 61 ±17 years, 58.3% male, and race distribution of: 55.6% White, 33.0% Black, 0% Hispanic, 2.4% Asian, 0.7% Other, and 8.0% Unknown. Overall, combining BLS and ALS encounters, the mean CPR metric values before and after were: chest compression depth (5.0 cm vs 5.5 cm; p<0.001), rate (109.6/min vs 114.8/min; p<0.001), fraction (79.2% vs 86.4%; p<0.001), and preshock pause (18.8 sec vs 11.8 sec; p<0.001), respectively. Overall, the percent goal achievement before and after were: chest compression depth (48.5% vs 66.6%; p<0.001), rate (71.8% vs 71.7%, p = 0.78), fraction (68.1% vs 91.0%; p<0.001), and preshock pause (24.1% vs 59.5%; p<0.001), respectively.
Conclusion:
This post-event, self-assessment CQI feedback form was associated with significant improvement in delivery of out-of-hospital CPR quality metrics.
Keywords: Emergency Medical Services, Cardiac Arrest, CPR, Out of Hospital Cardiac Arrest, continuous quality improvement
Introduction
According to a recently published Institute of Medicine (IOM) report titled, “Strategies to Improve Cardiac Arrest Survival: A Time to Act”, approximately 395,000 cases of cardiac arrest occur outside of a hospital setting each year in the United States.1 On average, less than 6 percent survive, resulting in over 360,000 deaths per year, representing the third leading cause of death in the United States.1,2
The quality of CPR provided at the scene of cardiac arrest has been shown to be associated with survival, including chest compression depth, rate, chest compression fraction, and preshock pause.3–7 Despite this, it has also been shown that less than half of patients treated in the out-of-hospital setting receive CPR within recommended guidelines, even in the most sophisticated emergency medical services (EMS) systems, likely significantly contributing to overall poor survival rates.8 For these reasons, the IOM report recommended EMS systems adopt continuous quality improvement programs to ensure consistent delivery of high performance resuscitation care through improved CPR quality.1
On December 31, 2013, a continuous quality improvement (CQI) program was initiated by Milwaukee County Emergency Medical Services (MCEMS) to provide post-event CPR feedback forms to all basic life support (BLS) and advanced life support (ALS) providers who participated in an out-of-hospital cardiac arrest resuscitation. This 1-page feedback form included the quality CPR metrics of chest compression depth, rate, chest compression fraction, and preshock pause, indicated benchmark goals, and highlighted achievement of and failure to achieve these CPR quality benchmarks. The feedback form was distributed to all EMS providers involved in the resuscitation within 72 hours of the event, exclusively for self-review.
A small, initial pilot study demonstrated promising but inconclusive results.9 The purpose of this study was to evaluate a much larger sample size over a longer period of time to reliably determine the association (if any) of this post-event self-assessment CQI feedback form on achievement of out-of-hospital CPR quality benchmarks.
Methods
Milwaukee County is a midsized, metropolitan area consisting of multiple municipalities with a total population of about 950,000 The separate fire departments of these municipalities comprise Milwaukee County EMS (MCEMS), a two-tiered fire-based EMS system that includes both first responding basic life support (BLS) and second responding advanced life support (ALS) providers. Depending on the circumstances and availability, care may be provided by BLS providers only, ALS providers only, or, most frequently, a combination of both BLS and ALS providers. CPR quality metrics were captured by ZOLL Medical, Inc. X-series monitors, which are used by both BLS and ALS providers. Real time rate and depth feedback were provided at the scene to all EMS providers throughout the before and after study periods by visual display only on the defibrillator monitor as CPR audio prompts are not used by the City of Milwaukee EMS system. EMS providers participated in the Resuscitation Outcomes Consortium (ROC) Amiodarone, Lidocaine, and Placebo (ALPS) Trial and the Continuous Chest Compression (CCC) Trial throughout the before and after study periods. 10,11 For the CCC Trial, individual agencies within MCEMS were cluster-randomized in a ratio of 1:1 to administer either continuous chest compressions versus 30 compressions followed by 2 ventilations for only the first 6 minutes of CPR (until placement of an advanced airway).11 The MCEMS CQI program applied CPR quality benchmarks to the entire episode of CPR; these benchmarks remained the same throughout the study periods and were independent of participation in these clinical trials.
This study was a before/after, retrospective, quality improvement case series. Inclusion criteria comprised all cases of non-traumatic out-of hospital cardiac arrest in adult patients (≥18 years old) who received CPR from the Milwaukee Fire Department BLS and/or ALS providers with at least 5-6 minutes of CPR data electronically captured on the ZOLL Medical, Inc. X-series monitor. Exclusion criteria included patients < 18 years old, cardiac arrest caused by blunt, penetrating, or burn-related injury, or < 5-6 minutes of electronically captured CPR data. The CPR feedback form was implemented December 31, 2013. A 9-month period was analyzed before (September 15, 2012 through June 15, 2013) and after (September 15, 2014 through June 15, 2015) implementation of the CPR feedback form. A 9-month run-in period following implementation of the feedback form was imposed prior to collection of after data to ensure sufficient time for the CQI process to be comprehensively incorporated by the EMS system and providers. Regarding the CCC Trial, the same clusters of EMS agencies were assigned to the same type of CPR in both Before and After study periods.
Data was acquired from the EMS run report and the Zoll Medical, Inc. RescueNet Code Review® software program. Chest compression depth was defined as the number of millimeters of chest compression delivered from baseline for each chest compression. Chest compression rate was defined as the number of chest compressions delivered/minute (min). Chest compression fraction was defined as the proportion of resuscitation time without spontaneous circulation during which chest compressions were performed. Pre-shock pause was defined as the time from the last recorded chest compression to the time of defibrillation in seconds (sec). CPR quality benchmarks were defined as a chest compression depth of >5 centimeters (cm)/compression and > 90% of compressions ≥5 cm/episode, chest compression rate between 100-120 compressions/minute, chest compression fraction ≥75%/entire episode, and preshock pause <10 seconds. The chest compression depth, individual episodes with ≥90% of goal chest compression depth, and chest compression rate were determined as documented in the RescueNet Code Review® report. Chest compression fraction and preshock pause intervals were determined by manual review of the RescueNet Code Review®. The percent of episodes achieving >5 cm chest compression depth > 90% throughout the entire episode, rate between 100-120 compressions/minute throughout the entire episode, and chest compression fraction ≥75% throughout the entire episode was determined by dividing those episodes by the total number of episodes. The percent of preshock pauses ≤10 seconds was determined by dividing the number of preshock pauses <10 seconds by the total number of preshock pauses for each group. The mean of each CPR benchmark was also determined. Each Zoll ECG file was considered a separate encounter and identified as BLS providers only, ALS providers only, or both BLS and ALS providers. To account for the potential confounding affect of CPR randomization by the CCC Trial, the number of patients randomized to each CPR type was compared between the Before and After study periods.
EMS providers downloaded RescueNet Code Review® data to a central server and notified personnel immediately on returning to the station that they treated an out-of-hospital cardiac arrest. Personnel reviewed each cardiac arrest the same day Monday-Friday. All cardiac arrests occurring on the weekend were reviewed on Monday. Following acquisition of data from a single encounter, personnel generated a single page, CQI CPR feedback form. (Figure 1) Generation of all data and completion of the CQI feedback form required approximately 20 minutes time/form. The form included the values for each CPR quality benchmark (chest compression depth, rate, fraction, and preshock pause) and whether or not each benchmark had been achieved. The CQI feedback form was distributed to all BLS and ALS providers involved in the resuscitation attempt within 72 hours of the event. Irrespective of CPR performance, no further interaction or intervention occurred. The CQI feedback form was distributed to each provider involved in the resuscitation exclusively for independent self-assessment.
Figure 1:
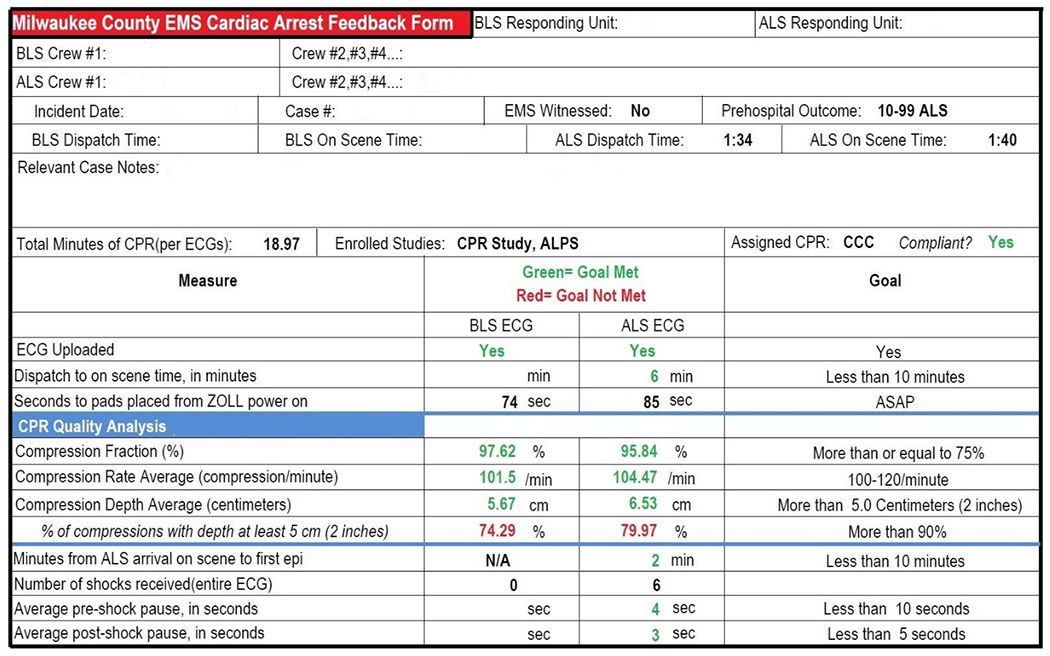
CPR Feedback Form
Patient demographics and arrest characteristics were described with the use of frequencies for categorical variables and mean (standard deviation) and median (range) for quantitative variables separately for the Before and After Groups. The association was assessed with chi-square tests for categorical variables and t-tests for quantitative variables. The difference between the Before and After Groups in compression depth, compression fraction, compression rate and preshock pause, was evaluated using multivariable regression models controlling for age, gender and race. Specifically, linear regression was used for mean difference and logistic regression for goal achievement. P-values of 0.05 or less were considered to indicate statistical significance. SAS version 9.4 (SAS Institute, Cary, NC, USA) was utilized to perform the analyses.
This study was approved by the Institutional Review Board at the Medical College of Wisconsin.
Results
The Before Group consisted of 439 total patient encounters, 82 from BLS providers only, 357 from ALS providers only, and 408 individual patients. The After Group consisted of 621 total patient encounters, 106 from BLS providers only, 515 from ALS providers only, and 556 individual patients.
Patient demographics and cardiac arrest characteristics of the Before and After Groups are shown in Table 1. Age, gender, rate of initial type of cardiac arrest rhythm, and CPR type randomization (CCC Trial) did not differ between groups. The race/ethnicity was unknown in more patients in the Before Group and more patients were EMS witnessed in the After Group.
Table 1:
Patient Demographics and Cardiac Arrest Characteristics
| Characteristic | Before Group | After Group | P-value | |
|---|---|---|---|---|
| N=408 (%) | N=556 (%) | |||
| Age | Mean ± SD | 61.3 ± 17.25 | 61.4 ± 17.0 | 0.928 |
| Median (min - max) | 62.0(19-96) | 62.0 (19-100) | ||
| Gender | Female | 156 (38.2) | 232 (41.7) | 0.275 |
| Male | 252 (61.8) | 324 (58.3) | ||
| Race/ethnicity | American Indian | 0 (0.0) | 3 (0.5) | < 0.001 |
| Asian | 6 (1.5) | 12 (2.3) | ||
| Black | 103 (25.3) | 183 (32.9) | ||
| Hispanic | 15 (3.7) | 0 (0.0) | ||
| White | 177 (43.4) | 309 (55.6) | ||
| Other | 1 (0.3) | 4 (0.7) | ||
| Unknown | 106 (26.0) | 44 (7.9) | ||
| EMS Witnessed | No | 375 (91.9) | 485 (87.2) | 0.022 |
| Yes | 33 (8.1) | 71 (12.8) | ||
| Initial Cardiac Arrest Rhythm | Asystole | 235 (57.6) | 327 (58.8) | 0.865 |
| PEA | 79 (19.4) | 94 (16.9) | ||
| VF/VT | 84 (20.6) | 131 (23.6) | ||
| Unknown | 10 (2.5) | 4 (0.7) | ||
| CPR Type Randomization (CCC Trial11) | 30:2 | 92 (22.5) | 130 (23.4) | 0.762 |
| CCC | 316 (77.5) | 426 (77.0) |
N=number; SD=standard deviation; %=percent; min=minimum; max=maximum; EMS=emergency medical services; PEA=pulseless electrical activity; VF=ventricular fibrillation; VT=ventricular tachycardia; CPR= Cardiopulmonary Resuscitation; CCC= Continuous Chest Compressions; 30:2=30 Compressions to 2 Ventilations
The mean compression depth and compression depth goal achievement for all encounters in the Before and After Groups is shown in Table 2. Overall, combining BLS and ALS encounters, the mean CPR chest compression depth was 5.0 ± 1.2 cm in the Before Group versus (vs) 5.5 ± 1.0 cm in the After Group, p<0.001. Overall, combining BLS and ALS encounters, the percent of encounters achieving 5 cm depth > 90% of the entire episode were 48.5% in the Before Group vs 66.6% in the After Group, p<0.001. The BLS Only encounters and ALS Only encounters had similar statistically significant improvements in mean chest compression depth and the percent of encounters achieving 5 cm depth > 90% of the entire episode comparing Before vs After Groups, p < 0.001, respectively. (Table 2)
Table 2:
Mean Compression Depth and Compression Depth Goal Achievement
| Encounters | Mean Compression Depth (cm [SD]) | % of Episodes that Met Goal Compression Depth > 5cm greater than 90% of time | ||||||
|---|---|---|---|---|---|---|---|---|
| Before | After | Before | After | P-value* | Before | After | P-value** | |
| BLS | 82 | 106 | 4.8 (1.1) | 5.3 (1.0) | < 0.001 | 45.9% | 63.5% | < 0.001 |
| ALS | 357 | 515 | 5.0 (1.2) | 5.6 (1.0) | < 0.001 | 49.0% | 67.3% | < 0.001 |
| BLS+ALS | 439 | 621 | 5.0 (1.2) | 5.5 (1.0) | < 0.001 | 48.5% | 66.6% | < 0.001 |
cm=centimeters; SD=standard deviation; %=percent; BLS=basic life support only; ALS=advanced life support only; BLS+ALS=both basic life support and advanced life support
mean difference p-values were obtained from a linear regression model adjusted for age, gender and race
goal achievement p-values were obtained from a logistic regression model adjusted for age, gender and race
The mean compression rate and compression rate goal achievement for all encounters in the Before and After Groups is shown in Table 3. Overall, combining BLS and ALS encounters, the mean chest compression rate was 109.6 ± 11.0 compressions/minute (min) in the Before Group vs 114.8 ± 9.5 compressions/min in the After Group, p < 0.001. Overall, combining BLS and ALS encounters, the percent of encounters achieving goal compression rate for the entire encounter was 71.8% in the Before Group vs 71.7% in the After Group, p = 0.779. The BLS Only encounters and ALS Only encounters had similar statistically significant improvements in mean chest compression rate and no statistically significant difference in the chest compression rate goal achievement comparing the Before vs After Groups. (Table 3)
Table 3:
Mean Compression Rate and Compression Rate Goal Achievement
| Encounters | Mean Compression Rate (/min [SD]) | % of Episodes that Met Goal Compression Rate 100-120/min | ||||||
|---|---|---|---|---|---|---|---|---|
| Before | After | Before | After | P-value* | Before | After | P-value** | |
| BLS | 82 | 106 | 109.1 (9.5) | 112.6 (8.8) | < 0.001 | 73.2% | 74.5% | 0.694 |
| ALS | 357 | 515 | 109.7 (11.3) | 115.2 (9.6) | < 0.001 | 71.4% | 71.1% | 0.642 |
| BLS+ALS | 439 | 621 | 109.6 (11.0) | 114.8 (9.5) | < 0.001 | 71.8% | 71.7% | 0.779 |
SD=standard deviation; min=minute; BLS=basic life support only; ALS=advanced life support only; BLS+ALS=both basic life support and advanced life support;
mean difference p-values were obtained from a linear regression model adjusted for age, gender and race
goal achievement p-values were obtained from a logistic regression model adjusted for age, gender and race
The mean compression fraction and percent compression fraction goal achievement for all encounters in the Before and After Groups is shown in Table 4. Overall, combining BLS and ALS encounters, the mean chest compression fraction was 79.2 ± 13.4 % in the Before Group vs 86.4 ± 8.6 % in the After Group, p < 0.001. Overall, combining BLS and ALS encounters, the percent of encounters achieving chest compression fraction goal achievement was 68.1% in the Before Group vs 91.0% in the After Group, p< 0.001. The BLS Only encounters and ALS Only encounters had similar statistically significant improvements in mean compression fraction and the percent of encounters achieving chest compression fraction ≥ 75% of the entire episode comparing Before vs After Groups, p < 0.001, respectively. (Table 4)
Table 4:
Mean Compression Fraction and Compression Fraction Goal Achievement
| Encounters | Mean Compression Fraction (% [SD]) | % Episodes that Met Goal Compression Fraction (≥ 75%) | ||||||
|---|---|---|---|---|---|---|---|---|
| Before | After | Before | After | P-value* | Before | After | P-value** | |
| BLS | 82 | 106 | 79.7 (11.6) | 83.6 (7.8) | < 0.001 | 68.3% | 87.7% | < 0.001 |
| ALS | 357 | 515 | 79.1 (13.8) | 87.0 (8.6) | < 0.001 | 68.1% | 91.7% | < 0.001 |
| BLS+ALS | 439 | 621 | 79.2 (13.4) | 86.4 (8.6) | < 0.001 | 68.1% | 91.0% | < 0.001 |
SD=standard deviation; min=minute; BLS=basic life support only; ALS=advanced life support only; BLS+ALS=both basic life support and advanced life support;
mean difference p-values were obtained from a linear regression model adjusted for age, gender and race
goal achievement p-values were obtained from a logistic regression model adjusted for age, gender and race
The mean preshock pause and percent of all preshock pauses attaining goal achievement in the Before and After Groups is shown in Table 5. Overall, combining BLS and ALS encounters, the mean preshock pause was 18.8 ± 11.5 sec in the Before Group vs 11.8 ± 15.0 sec in the After Group, p < 0.001. Overall, combining BLS and ALS encounters, the percent of all preshock pauses achieving the preshock pause goal was 24.1% in the Before Group vs 59.5% in the After Group, p< 0.001. The BLS Only encounters and ALS Only encounters had similar statistically significant improvements in mean preshock pause and the percent of all preshock pauses ≤ 10 seconds comparing Before vs After Groups. (Table 5)
Table 5:
Mean Preshock Pause and Preshock Pause Goal Achievement
| Encounters | Mean Preshock Pause (sec [SD]) | % Episodes that Met Goal Preshock Pause <10 sec | ||||||
|---|---|---|---|---|---|---|---|---|
| Before | After | Before | After | P-value* | Before | After | P-value** | |
| BLS | 18 | 41 | 17.3 (10.5) | 2.4 (2.2) | 0.018 | 16.7% | 97.6% | < 0.001 |
| ALS | 115 | 169 | 19.0 (11.7) | 14.1 (15.8) | 0.016 | 25.2% | 50.3% | < 0.001 |
| BLS+ALS | 133 | 210 | 18.8 (11.5) | 11.8 (15.0) | < 0.001 | 24.1% | 59.5% | < 0.001 |
SD=standard deviation; min=minute; BLS=basic life support only; ALS=advanced life support only; BLS+ALS=both basic life support and advanced life support;
mean difference p-values were obtained from a linear regression model adjusted for age, gender and race
goal achievement p-values were obtained from a logistic regression model adjusted for age, gender and race
Discussion
The over-riding principle in development of this post-event CPR feedback form was simplicity. The form was designed to be quickly reviewed by the EMS provider while delivering easily understood performance feedback and reinforcing CPR quality metric goals. Time and effort involved in generation of the form was also a major consideration. The form required approximately 20 minutes to generate. With about 800 EMS-treated cardiac arrests/year in this EMS system, only 266 hours/year or about 0.1 full time equivalent personnel were required to sustain this CQI program. Rapid generation of the form was also essential to provide feedback in closest proximity to the cardiac arrest event as possible (targeting no later than 72 hours) to assure EMS personnel could recall the specific circumstances of the event to incorporate into their learning process. Further, the entire CQI program was specifically designed for exclusive self-review in a non-punitive fashion, promoting excellence in delivery of care, consistent with the culture of the Milwaukee County EMS system.
We found that this approach was associated with statistically significant improvements in achieving the CPR quality metric goals of chest compression depth, chest compression fraction, and preshock pause. Both mean values as well as goal achievement were considered statistically significant and clinically meaningful in this EMS system. Although the mean compression rate significantly increased, the before and after values were within goal range and a clinically meaningful improvement in this category was not possible.
Previous studies have demonstrated the benefits of training sessions and feedback on CPR performance. Real time audio and visual feedback, typically provided by the cardiac monitor/defibrillator, has been shown to improve resuscitation quality metrics.12–15 The addition of scenario-based simulation training and just-in-time training sessions has also been shown to improve CPR performance.16 Post-event, live debriefing or the provision of more personalized debriefing information in conjunction with training classes has also been shown to improve the quality of future CPR encounters. 17–22
Our post-event, self-assessment feedback form has benefits compared with the previously studied methods. It requires minimal personnel time to generate and little to no time commitment from the EMS medical director and/or EMS administrators. Simultaneously, however, it sends the clear message to all EMS personnel that high performance CPR is an important priority of EMS leadership. The feedback is nonjudgmental, allowing the EMS provider time for unsupervised self-reflection of their performance and team improvement through discussion with colleagues. Further, the program has fostered an ongoing sense of healthy competition among individuals, stations, and agencies.
Depending on the size, resources, and type of emergency medical system, implementation of this post-event self-assessment feedback form may encounter challenges. Initiation of such a program requires the ability to acquire and collect electronic CPR performance data. Infrastructure must be in place to analyze the data and rapidly distribute it. Additionally, should a trend in performance gaps be noted within a system, the resources and willpower must be present to affect change. Despite these potential challenges, we believe this feedback system would be amenable to adoption by a variety of emergency medical systems.
This study has limitations. The study is subject to all of the limitations of a before/after study design including regression to the mean and unmeasured confounders. The EMS education received and knowledge accumulated by the EMS providers, general trends and changes in EMS practice, ROC trial participation, and the Hawthorne effect may be confounding factors. In patients who were treated by BLS + ALS, it was not possible to know with certainty which type of provider performed CPR at any given time. Nonetheless, our goal was to evaluate the association of the feedback form with overall CPR quality, demonstrated in all three groups of providers studied. Our study was not powered to evaluate survival. Further research with a larger sample size is required to determine any association between this post-event self-assessment feedback form and improved survival from cardiac arrest .
Conclusion
This post-event, self-assessment CQI feedback form was associated with significant improvement in delivery of out-of-hospital CPR quality metrics.
Acknowledgements
All authors meet criteria for authorship and have declared no conflicts of interest with this investigation. This project was supported by the National Institute on Aging of the National Institutes of Health, Award Number T35AG-29793 and by the National Center for Advancing Translational Sciences, National Institutes of Health, Award Number UL1TR001436. The content is solely the responsibility of the author(s) and does not necessarily represent the official views of the NIH. The authors wish to thank Milwaukee County EMS and the Milwaukee Office of Emergency Management for their continued work to improve health and health outcomes in our community.
Footnotes
Declaration of Interest
The authors report no conflicts of interest. The authors alone are responsible for the content and writing of this paper.
References
- 1.Committee on the Treatment of Cardiac Arrest: Current Status and Future Directions, Board on Health Sciences Policy, Institute of Medicine. No title. 2015. [Google Scholar]
- 2.Go AS, Mozaffarian D, Roger VL, et al. Heart disease and stroke statistics−-2014 update: A report from the american heart association. Circulation. 2014;129(3):e28–e292. [DOI] [PMC free article] [PubMed] [Google Scholar]
- 3.Cheskes S, Schmicker RH, Verbeek PR, et al. The impact of peri-shock pause on survival from out-of-hospital shockable cardiac arrest during the resuscitation outcomes consortium PRIMED trial. Resuscitation. 2014;85(3):336–342. [DOI] [PMC free article] [PubMed] [Google Scholar]
- 4.Christenson J, Andrusiek D, Everson-Stewart S, et al. Chest compression fraction determines survival in patients with out-of-hospital ventricular fibrillation. Circulation. 2009;120(13):1241–1247. [DOI] [PMC free article] [PubMed] [Google Scholar]
- 5.Edelson DP, Abella BS, Kramer-Johansen J, et al. Effects of compression depth and pre-shock pauses predict defibrillation failure during cardiac arrest. Resuscitation. 2006;71(2):137–145. [DOI] [PubMed] [Google Scholar]
- 6.Idris AH, Guffey D, Pepe PE, et al. Chest compression rates and survival following out-of-hospital cardiac arrest. Crit Care Med. 2015;43(4):840–848. [DOI] [PubMed] [Google Scholar]
- 7.Stiell IG, Brown SP, Christenson J, et al. What is the role of chest compression depth during out-of-hospital cardiac arrest resuscitation? Crit Care Med. 2012;40(4):1192–1198. [DOI] [PMC free article] [PubMed] [Google Scholar]
- 8.Yannopoulos D, Aufderheide TP, Abella BS, et al. Quality of CPR: An important effect modifier in cardiac arrest clinical outcomes and intervention effectiveness trials. Resuscitation. 2015;94:106–113. [DOI] [PubMed] [Google Scholar]
- 9.Weston BW, Jasti J, Lerner EB, Szabo A, Aufderheide TP, Colella MR. Does an individualized feedback mechanism improve quality of out-of-hospital CPR? Resuscitation. 2017;113:96–100. [DOI] [PubMed] [Google Scholar]
- 10.Kudenchuk PJ, Brown SP, Daya M, et al. Amiodarone, lidocaine, or placebo in out-of-hospital cardiac arrest. N Engl J Med. 2016;374(18):1711–1722. [DOI] [PubMed] [Google Scholar]
- 11.Nichol G, Leroux B, Wang H, et al. Trial of continuous or interrupted chest compressions during CPR. N Engl J Med. 2015;373(23):2203–2214. [DOI] [PubMed] [Google Scholar]
- 12.Abella BS, Edelson DP, Kim S, et al. CPR quality improvement during in-hospital cardiac arrest using a real-time audiovisual feedback system. Resuscitation. 2007;73(1):54–61. [DOI] [PubMed] [Google Scholar]
- 13.Hostler D, Everson-Stewart S, Rea TD, et al. Effect of real-time feedback during cardiopulmonary resuscitation outside hospital: Prospective, cluster-randomised trial. BMJ. 2011;342:d512. [DOI] [PMC free article] [PubMed] [Google Scholar]
- 14.Kramer-Johansen J, Myklebust H, Wik L, et al. Quality of out-of-hospital cardiopulmonary resuscitation with real time automated feedback: A prospective interventional study. Resuscitation. 2006;71(3):283–292. [DOI] [PubMed] [Google Scholar]
- 15.Yeung J, Meeks R, Edelson D, Gao F, Soar J, Perkins GD. The use of CPR feedback/prompt devices during training and CPR performance: A systematic review. Resuscitation. 2009;80(7):743–751. [DOI] [PubMed] [Google Scholar]
- 16.Cheng A, Brown LL, Duff JP, et al. Improving cardiopulmonary resuscitation with a CPR feedback device and refresher simulations (CPR CARES study): A randomized clinical trial. JAMA Pediatr. 2015;169(2):137–144. [DOI] [PubMed] [Google Scholar]
- 17.Bleijenberg E, Koster RW, de Vries H, Beesems SG. The impact of post-resuscitation feedback for paramedics on the quality of cardiopulmonary resuscitation. Resuscitation. 2016;110:1–5. [DOI] [PubMed] [Google Scholar]
- 18.Bobrow BJ, Vadeboncoeur TF, Stolz U, et al. The influence of scenario-based training and real-time audiovisual feedback on out-of-hospital cardiopulmonary resuscitation quality and survival from out-of-hospital cardiac arrest. Ann Emerg Med. 2013;62(1):47-56.e1. [DOI] [PubMed] [Google Scholar]
- 19.Crowe C, Bobrow BJ, Vadeboncoeur TF, et al. Measuring and improving cardiopulmonary resuscitation quality inside the emergency department. Resuscitation. 2015;93:8–13. [DOI] [PubMed] [Google Scholar]
- 20.Dine CJ, Gersh RE, Leary M, Riegel BJ, Bellini LM, Abella BS. Improving cardiopulmonary resuscitation quality and resuscitation training by combining audiovisual feedback and debriefing. Crit Care Med. 2008;36(10):2817–2822. [DOI] [PubMed] [Google Scholar]
- 21.Edelson DP, Litzinger B, Arora V, et al. Improving in-hospital cardiac arrest process and outcomes with performance debriefing. Arch Intern Med. 2008;168(10):1063–1069. [DOI] [PubMed] [Google Scholar]
- 22.Lyon RM, Clarke S, Milligan D, Clegg GR. Resuscitation feedback and targeted education improves quality of pre-hospital resuscitation in scotland. Resuscitation. 2012;83(1):70–75. [DOI] [PubMed] [Google Scholar]