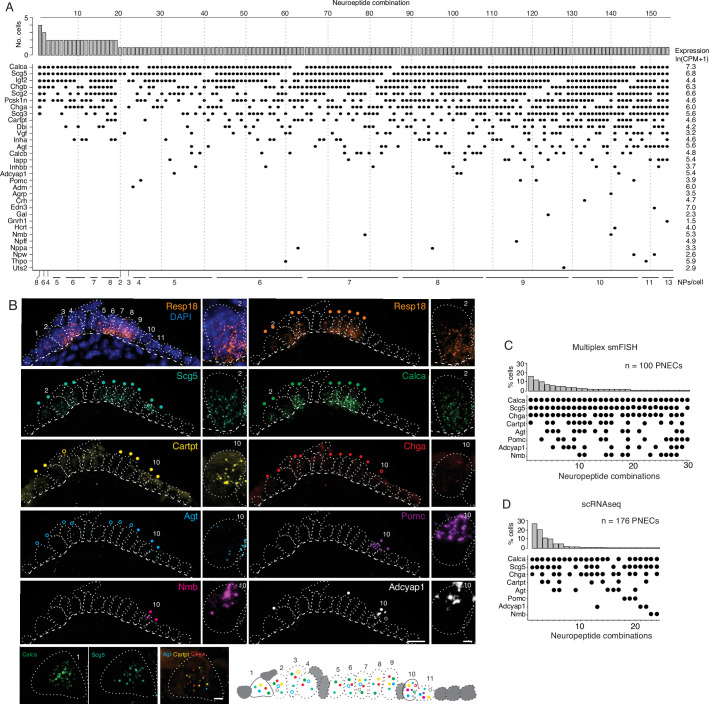
Figure 2. PNECs express myriad combinations of peptidergic genes.
(A) Peptidergic genes expressed in individual PNECs (n=176) from scRNA-seq. Histogram (top) shows number of PNECs expressing each of the 154 observed combinations of expressed peptidergic (NP) genes (dots, bottom). Values at right are average expression level of peptidergic genes among expressing cells; values at bottom are number of expressed peptidergic genes for each combination (NPs/cell). Each PNEC expressed 7.2±1.9 (mean ± SD) peptidergic genes (range 2–13, median 7, mode 6). (B) Micrograph of NEB from adult PN155 wild type mouse lung probed by multiplex smFISH (RNAscope) for PNEC marker Resp18 and the indicated peptidergic genes including ones detected by scRNA-seq in most (Scg5, Calca), some (Cartpt, Chga), or rare (Agt, Pomc, Nmb, Adcyap1) PNECs. Epithelial cells are outlined (white dots), basement membrane is indicated by dashed line, and individual PNECs numbered (n=11) with close-up of the indicated PNEC shown at right and PNEC 1 at bottom. Scale bar, 2μm. Filled colored circles above cells, PNECs with high expression of gene (≥5 puncta; filled circles); open circles, PNECs with low expression of gene (1–4 puncta, open circles). Schematic (bottom) shows summary of expression of the eight peptidergic genes (using colored circles as above) in the 11 PNECS in this NEB optical plane. Grey cells, other (non-PNEC) epithelial cells in field of view. Bar, 10μm. (C) Percent of PNECs expressing each of the 30 observed combinations of the eight peptidergic genes probed by smFISH (n=100 PNECs scored in NEBs from two wild-type mice). Filled circles, expressed peptidergic gene. (D) Percent of PNECs expressing each of the 24 observed combinations of the same eight peptidergic genes in scRNA-seq dataset (n=176 PNECs).


