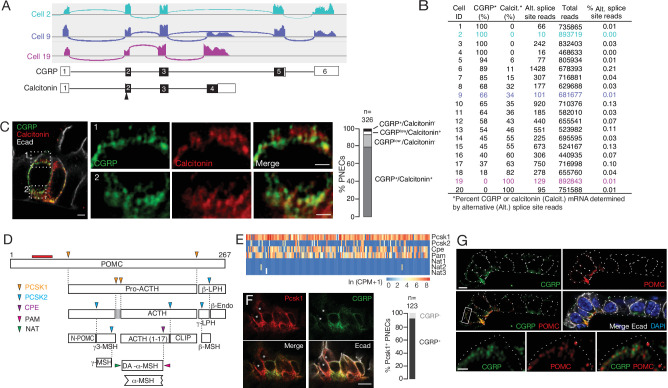
Figure 3. Additional PNEC peptidergic diversity from post-transcriptional processing.
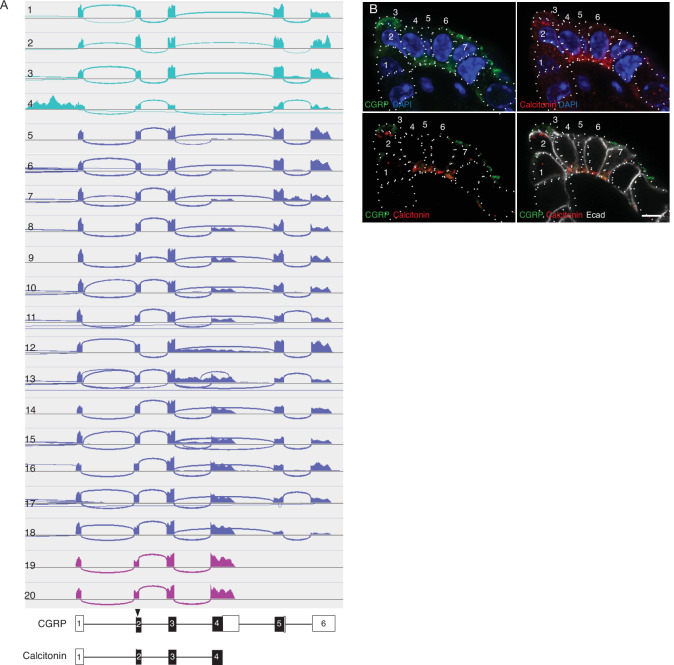
(A) Sashimi plots (top) showing mapped scRNA-seq reads for Calca gene and deduced alternative splicing patterns for three representative PNECs (cells 2, 9 and 19 in B), and the resultant mRNAs structures (bottom) encoding either CGRP or calcitonin, with exons numbered (black fill, coding exons). Arrowhead, translation start site. Note cell 2 expresses only CGRP, cell 19 expresses only calcitonin mRNA, and cell 9 expresses both. (B) Quantification of alternative splicing of Calca mRNA as above for 20 randomly selected Calca-expressing PNECs (sashimi plots in Figure 3—figure supplement 1). (C) Fluorescence super-resolution (AiryScan SR) confocal micrograph (left) of neighboring PNECs in adult PN68 wild type mouse lung immunostained for CGRP (green), calcitonin (red), and E-cadherin (Ecad, white) to show epithelial cell boundaries, with DAPI nuclear counterstain (blue). Close-ups of boxed regions (right) show split and merged channels of apical (1) and basal (2) regions of a PNEC. Most PNECs express both of these peptides (see quantification at right), but note that the neuropeptide (CGRP) and hormone (calcitonin) localize to separate vesicles. Scale bar, 2μm (inset 2μm). Right, quantification of immunostaining (n=326 PNECs scored in 3mice). (D) Classical post-translational processing scheme for pro-opiomelanocortin (POMC) in anterior pituitary, showing cleavage sites (arrowheads) of endopeptidases proprotein convertase subtilisin/kexin type 1 (PCSK1, orange) and PCSK2 (blue), and carboxypeptidase E (CPE, purple), and modification sites (arrowheads) of peptidyl-glycine–amidating monooxygenase (PAM amidation site, red) and N-acetyltransferase (NAT acetylation site, green) (Harno et al., 2018). ACTH, adrenocorticotrophic hormone; β-LPH, lipotropin, MSH, melanocyte stimulating hormone, Endo, endorphin. Gray box, junctional peptide; red bar, antigen (residues 27–52) of POMC antibody in panel G. In pituitary, other PCSK2 cleavage events produce additional peptides (γ3-MSH, ACTH (1-17), γ-LPH, β-endorphin) although γ−MSH and β-MSH are likely not produced in mouse due to absence of those dibasic cleavage sites. (E) Heatmap of expression of POMC processing genes in individual PNECs (n=176) from scRNA-seq dataset. Note expression of Pcsk1, Cpe, and Pam in most (94%, 65%, 74%), Pcsk2 in some (16%), and Nat2 and Nat3 in rare (1%) PNECs; none expressed Nat1. This predicts production of all the major pituitary peptides in PNECs, with individual PNECs producing different sets of POMC peptides due to differential expression of the processing enzymes. (F) Micrograph of NEB in adult PN90 wild type (CD-1) mouse lung immunostained for PCSK1 (red), CGRP (green), and E-cadherin (Ecad, white). Right, quantification of immunostaining (n=123 PNECs scored in three mice). Most PNECs co-express PCSK1 and CGRP, although rare PNECs (~10%) express only PCSK1 (asterisks in micrograph). Scale bar, 10μm. (G) Super-resolution confocal micrograph of NEB in adult PN155 wild type (CD-1) mouse lung immunostained for CGRP (green), POMC (red), and E-cadherin (Ecad, white), with DAPI counterstain (blue). Bottom panel, close-up of boxed region showing separate POMC and CGRP puncta. Quantification (n=347 distinct puncta scored in 8 PNECs co-expressing CGRP and POMC) showed 157 CGRP+ puncta, 190 POMC+ puncta, and no puncta with co-localization of the two. Bar, 10μm (inset 2μm).


