Abstract
Although Candida glabrata has emerged in recent years as a major fungal pathogen, there have been no reports demonstrating that it undergoes either the bud-hypha transition or high-frequency phenotypic switching, two developmental programs believed to contribute to the pathogenic success of other Candida species. Here it is demonstrated that C. glabrata undergoes reversible, high-frequency phenotypic switching between a white (Wh), light brown (LB), and dark brown (DB) colony phenotype discriminated on an indicator agar containing 1 mM CuSO4. Switching regulates the transcript level of the MT-II metallothionein gene(s) and a newly discovered gene for a hemolysin-like protein, HLP. The relative MT-II transcript levels in Wh, LB, and DB cells grown in the presence of CuSO4 are 1:27:81, and the relative transcript levels of HLP are 1:20:35. The relative MT-II and HLP transcript levels in cells grown in the absence of CuSO4 are 1:20:30 and 1:20:25, respectively. In contrast, switching has little or no effect on the transcript levels of the genes MT-I, AMT-I, TRPI, HIS3, EPAI, and PDHI. Switching of C. glabrata is not associated with microevolutionary changes identified by the DNA fingerprinting probe Cg6 and does not involve tandem amplification of the MT-IIa gene, which has been shown to occur in response to elevated levels of copper. Finally, switching between Wh, LB, and DB occurred in all four clinical isolates examined in this study. As in Candida albicans, switching in C. glabrata may provide colonizing populations with phenotypic plasticity for rapid responses to the changing physiology of the host, antibiotic treatment, and the immune response, through the differential regulation of genes involved in pathogenesis. More importantly, because C. glabrata is haploid, a mutational analysis of switching is now feasible.
Candida glabrata has emerged as one of the three most common Candida species colonizing humans (8, 12). C. glabrata now represents the second-most-common Candida species causing bloodstream infections (36) and, at least in the Detroit area, one of the prevalent species responsible for yeast vaginitis (42, 52). A dramatic increase in the carriage of C. glabrata has also been demonstrated in dentate individuals over 80 years of age, and the proportion of elderly individuals with dentures carrying C. glabrata in one study was found to be greater than 50% (23). What is most worrisome about the recent emergence of C. glabrata as a major Candida pathogen and commensal is that it is naturally resistant to azole drug therapy (3, 9, 14, 27).
The success of the most prevalent Candida pathogen, C. albicans, depends in part on its phenotypic plasticity. C. albicans exhibits two developmental programs that provide a portion of its phenotypic plasticity, the bud-hypha transition (11, 44) and high-frequency phenotypic switching (45–47). Transition to a hyphal growth form provides C. albicans with the capacity to penetrate tissue and disseminate (35), and mutants of C. albicans that do not form hyphae exhibit a reduction in virulence in animal models (20, 37, 43). High-frequency phenotypic switching involves the combinatorial regulation of phase-specific genes (45–47), several of which appear to facilitate pathogenesis, including secreted aspartyl proteinases (15, 32, 33, 55) and drug resistance genes (1). Misexpression of phase-specific genes in the wrong phase alters the specificity of virulence in different animal models (18, 19). Surprisingly, C. glabrata has never been reported to undergo either the bud-hypha transition or high-frequency phenotypic switching. How, then, has C. glabrata achieved its recent success both as a commensal and as a pathogen? One possible answer is that the developmental plasticity afforded by the bud-hypha transition and high-frequency phenotypic switching is really not important in the overall pathogenesis of an infectious yeast. An alternative answer is that although these two developmental programs are important to C. albicans (45) and other highly related species (50; S. O. Soll, S. R. Lockhart, and D. R. Soll, unpublished observations), they may not be important for the pathogenesis of C. glabrata. C. glabrata may have developed alternative mechanisms that generate the plasticity that these developmental programs provide for rapid responses to environmental challenges. Here, we report results which demonstrate that C. glabrata possesses at least one of these two developmental programs. We demonstrate for the first time that C. glabrata indeed undergoes high-frequency phenotypic switching that involves the regulation of phase-specific genes, including a metallothionein gene and a newly discovered hemolysin gene. Because C. glabrata is haploid, it provides for the first time a system that is amenable to a mutational analysis of the switching process.
MATERIALS AND METHODS
Yeast isolates and maintenance.
The C. glabrata isolates used in this study were either collected in a study of oral carriage as a function of age (23) or obtained from bloodstream infections in the University of Iowa Hospitals and Clinics. Each isolate was typed as C. glabrata by sugar assimilation pattern and by hybridization to the C. glabrata-specific probes Cg6 and Cg12 (21); then a clone was stored at room temperature on a YPD agar slant (2% glucose, 2% Bacto Peptone, 1% yeast extract, 2% agar; Difco Laboratories, Detroit, Mich.) in a capped tube. The switch phenotypes were propagated on YPD agar plates containing 1 mM CuSO4 at 25°C. Each of the phenotypes was also stored at −80°C in glycerol.
Measurements of phenotypic switching.
To assess the frequency of variant phenotypes in a clonal population of C. glabrata, cells from a single 3-day-old colony exhibiting a homogeneous colony phenotype were inoculated into YPD liquid medium containing 1 mM CuSO4 and grown at 25°C for approximately 6 to 8 h to a density of 5 × 10⁶ cells per ml. Cells were then diluted and plated at a density of approximately 50 cells per agar plate. Plates were incubated at 25°C for 5 days, and the colony phenotypes were scored.
Growth kinetics.
Cells from a 3-day-old single colony exhibiting a homogeneous phenotype were inoculated into 10 ml of YPD liquid medium containing 1 mM CuSO4 in a 30-ml test tube and incubated until the concentration reached 107 cells per ml. Then 5 × 10⁶ cells were inoculated into a 250-ml Erlenmyer flask containing 50 ml of fresh YPD liquid medium plus 1 mM CuSO4 and rotated at 25°C for 48 h. Samples were removed every 2 h over a 48-h period and vortexed, and the concentration of spheres was measured in a hemocytometer.
PCR amplification of C. glabrata genes.
To amplify the C. glabrata metallothionein genes MT-I and MT-IIa (28, 29) and the C. glabrata transcription factor gene AMT-I, which is involved in the regulation of metallothionein genes (58, 59), the following primers were used: for MT-I, MT-I-N5′GCTAACGATTGCAAATGTCCT3′ and MT-I-C5′CTTGCACTCACACTTGTCACC3′; for MT-IIa, MT-II-N5′CCTGAACAAGTCAACTGCCAA3′ and MT-II-C5′GCACTTGCATGTTTGACACTT3′; and for AMT1, AMT-N5′ATGGTAGTAATCAACGGGGT3′ and AMT-C5′ACTAGTGTCATTGCAATTTAA3′. To amplify SLF1, a gene involved in copper homeostasis in Saccharomyces cerevisiae (57), the primers used were SLF1-N5′ATGTCATCGCAAAACCTCAAT3′ and SLF1-C5′CTGCCTGCTAATTTCACCTTG3′. To amplify the C. glabrata adhesin gene EPA1 (5), the primers used were EPA1-N5′GCGGGGCCCGGTCCCTATGTTCATCACTA3′ and EPA1-C5′GCGCGCGGATGATTTTAAATCCAGCTCT3′. To amplify the C. glabrata drug resistance gene PDH1 (31), the primers used were PDH1-N5′GCACAGCAGCAACGAAGTATCCC3′ and PDH1-C5′GACCTTTGTGTCTCTTGTGTGGG3′. PCR products were generated in 100 μl of a reaction mixture containing 10 mM buffer B (Fischer Scientific, St. Louis, Mo.), 1.2 mM MgCl2, 100 μM deoxynucleoside triphosphate, 50 μM each 5′ primer and 3′ primer, and 2.5 U of Taq polymerase (Fischer Scientific). Conditions for PCR cycling of MT-I, MT-IIa, and AMT-I included 40 cycles of denaturation at 92°C for 1 min, annealing at 40°C for 1.5 min, and extension at 68°C for 1.5 min. To amplify SLFI, the annealing temperature was changed to 37°C. Conditions for PCR cycling of EPA1 differed in that the annealing temperature for the first 3 cycles was 45°C and that for the final 35 cycles was 50°C. PCR products were gel purified and used as templates for generating radioactive probes. The PCR product obtained with primers based on the SLFI gene of S. cerevisiae (57) was cloned in Escherichia coli and sequenced in both directions, using an ABI model 373A automatic sequencing system and fluorescent BigDye terminator chemistry (Perkin-Elmer/Applied Biosystems Inc., Foster City, Calif.). The alignment of nucleotide sequences and comparison with sequences in the databases were performed with the BLASTX-BEAUTY analysis program (10, 56). Plasmids pCgACT-14 and pCgSCH-3, generous gifts from K. Kitada, Nippon Roche Research Center, Kamakura, Japan, were used to generate radioactive probes for the C. glabrata TRPI and HIS3 genes, respectively (17).
DNA fingerprinting and Southern blot analysis.
DNA fingerprinting was performed as described elsewhere (40, 47a) with the complex DNA fingerprinting probes Cg6 and Cg12 (21). In brief, total genomic DNA from each of the C. glabrata switch phenotypes was prepared by the method of Scherer and Stevens (39). Approximately 1 μg of total genomic DNA was digested with EcoRI (4 U/μg of DNA), and the resulting fragments were electrophoresed at 35 V for 15 h in a 0.65% (wt/vol) agarose gel. DNA was transferred by capillary blotting (24) to a Hybond N+ nylon membrane (Amersham Pharmacia Biotech, Buckinghamshire, England), hybridized with randomly primed [32P]dCTP-labeled probe, and autoradiographed as previously described (40). For Southern blot analyses performed for purposes other than DNA fingerprinting, DNA was digested with SalI, the digestion fragments were resolved in a 0.8% (wt/vol) agarose gel, and the Southern blots were hybridized with randomly primed [32P]dCTP-labeled probes.
Slot blot and Northern analysis of transcripts.
Total cellular RNA was isolated by methods previously described (53), with the following modifications: pellets of 3 × 10⁸ washed cells from 3-day-old colonies were frozen, mixed with an equal volume of acid-washed glass beads (400-μm diameter) and 450 μl of RNA extraction buffer from a RNAeasy Mini kit (Qiagen Inc., Valencia, Calif.), and agitated with a bead beater device (Biospec Products, Bartlesville, Okla.). Two micrograms of total cell RNA was immobilized on a Zetabind nylon membrane (CUNO, Inc., Meriden, Conn.) in a slot blot apparatus (model PR648; Hoefer Pharmacia Biotech Inc., San Francisco, Calif.), hybridized with randomly primed 32P-labeled probe, and autoradiographed. Hybridization intensities were compared by scanning the slot blots with the “densitometry of lanes” option of the DENDRON software package version 2.0 (Solltech Inc., Iowa City, Iowa). To perform successive hybridizations of the slot blot with different probes, the previous probe was stripped as previously described (6). Northern blot hybridization was performed according to methods previously described (19).
Nucleotide sequence accession number.
The nucleotide sequence of the HLP gene fragment has been deposited in the DDBJ under accession no. AF196836.
RESULTS
C. glabrata switches spontaneously, reversibly, and at high frequency between three major colony phenotypes.
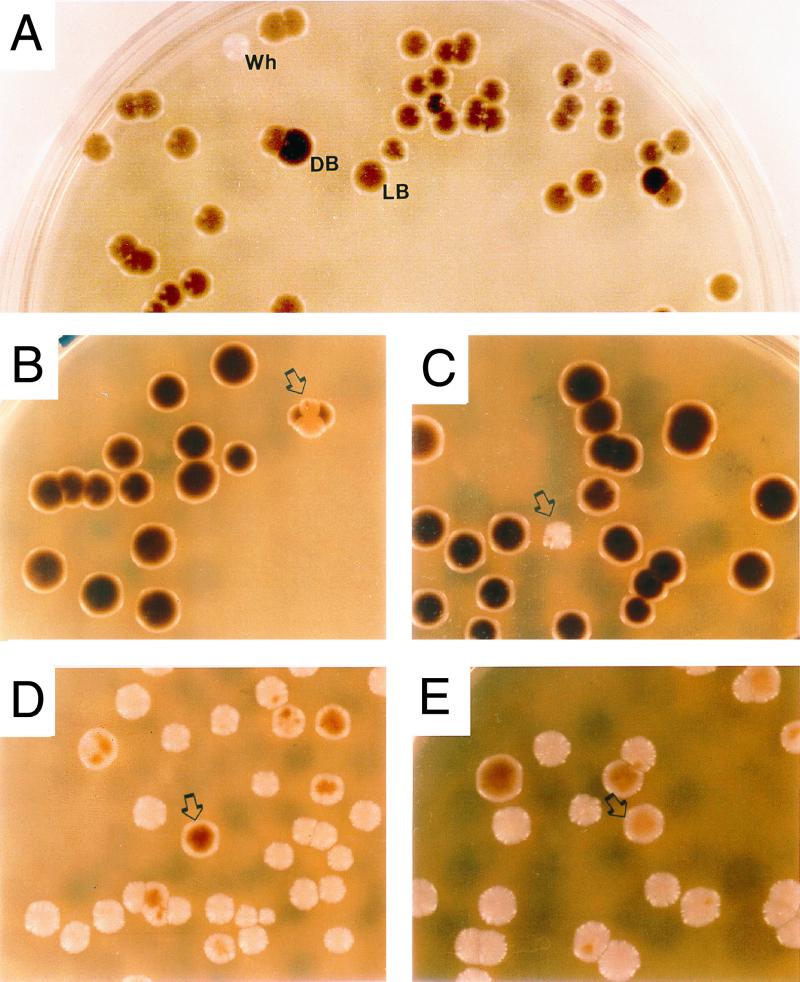
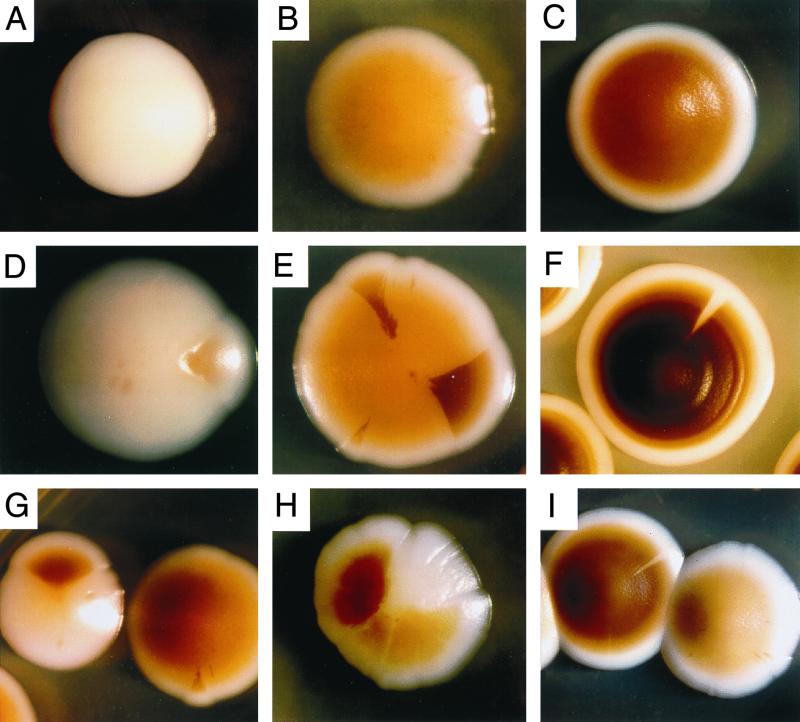
In analyzing the sensitivity of a stock culture of C. glabrata 35B11 to increasing concentrations of Cu2+ (4, 29), we observed colonies with different shades of brown on agar containing the same concentration of CuSO4. Since the stock culture originated from a single clonal colony, this observation suggested that C. glabrata may be undergoing high-frequency phenotypic switching. Cells of the same stock culture were subsequently plated on YPD agar containing 1 mM CuSO4, and colony phenotypes were scored after 5 days at 25°C. While the majority of 5-day-old colonies were light brown (LB) (Fig. 1A), a minority were either dark brown (DB) or white (Wh) (Fig. 1A). Some of the LB colonies contained Wh or DB sectors (Fig. 1A). The presence of sectors of varying size suggested that spontaneous switching occurred from LB to DB and from LB to Wh during colony growth. The results of this original plating experiment, therefore, suggested that C. glabrata switched reversibly and at high frequency between three major colony phenotypes, Wh (Fig. 2A), LB (Fig. 2B), and DB (Fig. 2C).
FIG. 1.
Switching of Candida glabrata 35B11. (A) Colony phenotypes in the original plating of the stock culture on YPD agar containing 1 mM CuSO4. Note that although the dominant phenotype is LB, there are a few Wh and DB colonies as well. (B) An LB colony with DB sectors (arrow) among a majority of DB colonies upon plating cells from a homogeneous DB colony. (C) A Wh colony (arrow) among a majority of DB colonies upon plating cells from a homogeneous DB colony. (D) A DB colony (arrow) among a majority of Wh colonies upon plating cells from a homogeneous Wh colony. (E) An LB colony (arrow) among a majority of Wh colonies upon plating cells from a Wh colony. Colonies were incubated for 5 days (A to C) or 7 days (D and E). Average colony size was 5 mm.
FIG. 2.
Examples of individual colony phenotypes and sectored colonies at high resolution. (A) Wh colony; (B) LB colony; (C) DB colony; (D) Wh colony with LB sector; (E) LB colony with DB sectors; (F) DB colony with Wh sector; (G) Wh colony with dark brown sector; (H) one-third DB, one-third LB, one-third Wh colony; (I) DB colony with Wh sector. Times of incubation were 8 days for panel F and 5 days for all other panels. Average colony size was 5 mm.
To test whether switching between the three colony phenotypes was reversible and to obtain an estimate of the number of cells expressing alternative phenotypes in clonal populations of each colony phenotype, cells from single colonies grown at 25°C and exhibiting a homogeneous phenotype were inoculated into liquid YPD medium containing 1 mM CuSO4 and grown for 6 h. Cells were then vortexed to separate clumps and plated at low density on YPD agar containing 1 mM CuSO4. Colony phenotypes were assessed after 5 days at 25°C. The results of this study are presented in Table 1. Cells from LB colonies formed DB colonies at a mean frequency of 2 × 10⁻² and Wh colonies at a mean frequency of 4 × 10⁻³ (Table 1). Cells from LB colonies formed LB colonies with DB sectors (Fig. 2E) and Wh sectors (Fig. 2H) at a combined mean frequency of 10−1 (Table 1). Cells from DB colonies formed LB colonies (Fig. 1B) and Wh colonies (Fig. 1C) at mean frequencies of 3 × 10⁻³ and 5 × 10⁻⁴, respectively (Table 1). Cells from DB colonies formed DB colonies with Wh sectors (Fig. 2F and I) and LB sectors at a combined mean frequency of 2 × 10⁻³ (Table 1). Cells from Wh colonies formed both DB colonies (Fig. 1D) and LB colonies (Fig. 1E) at mean frequencies of 2 × 10⁻¹ and 5 × 10⁻², respectively (Table 1). Cells from Wh colonies formed Wh colonies with LB sectors and DB sectors (Fig. 2D and G) at a combined mean frequency of 3 × 10⁻¹ (Table 1). In all cases, colonies exhibiting alternative phenotypes also sectored, especially when incubated for periods in excess of 5 days (data not shown), demonstrating sequential switching between the three colony phenotypes. Cells removed from colonies of the three switch phenotypes and examined microscopically all exhibited a round budding cell phenotype and were indistinguishable (data not shown).
TABLE 1.
Frequency of alternative phenotypes in Wh, LB, and DB colonies
| Original phenotype | Clone | No. of colonies | Frequency of colonies
|
|||
|---|---|---|---|---|---|---|
| DB | LB | Wh | Sectoreda | |||
| LB | 1 | 1,234 | 3 × 10⁻² | 3 × 10⁻³ | 4 × 10⁻¹ | |
| 2 | 1,425 | 2 × 10⁻² | 6 × 10⁻³ | 4 × 10⁻¹ | ||
| 3 | 1,833 | 3 × 10⁻² | 7 × 10⁻³ | 3 × 10⁻¹ | ||
| 4 | 1,223 | 1 × 10⁻² | <10−3 | 5 × 10⁻¹ | ||
| Mean | 2 × 10⁻² | 4 × 10⁻³ | 1 × 10⁻¹ | |||
| (±SD) | (±1 × 10⁻²) | (±3 × 10⁻³) | (±1 × 10⁻¹) | |||
| DB | 1 | 6,418 | 8 × 10⁻³ | <2 × 10⁻⁴ | 3 × 10⁻³ | |
| 2 | 2,897 | 3 × 10⁻⁴ | 1 × 10⁻³ | 1 × 10⁻³ | ||
| 3 | 2,719 | 9 × 10⁻³ | 4 × 10⁻⁴ | 2 × 10⁻³ | ||
| Mean | 3 × 10⁻³ | 5 × 10⁻⁴ | 2 × 10⁻³ | |||
| (±SD) | (±5 × 10⁻³) | (±5 × 10⁻⁴) | (±1 × 10⁻³) | |||
| Wh | 1 | 792 | 4 × 10⁻¹ | 6 × 10⁻² | 6 × 10⁻¹ | |
| 2 | 725 | 4 × 10⁻¹ | 7 × 10⁻² | 6 × 10⁻¹ | ||
| 3 | 1,509 | 4 × 10⁻² | 5 × 10⁻² | 2 × 10⁻¹ | ||
| 4 | 928 | 2 × 10⁻² | 3 × 10⁻² | 5 × 10⁻² | ||
| 5 | 1,422 | 5 × 10⁻² | 4 × 10⁻² | 9 × 10⁻² | ||
| Mean | 2 × 10⁻¹ | 5 × 10⁻² | 3 × 10⁻¹ | |||
| (±SD) | (±2 × 10⁻¹) | (±2 × 10⁻²) | (±3 × 10⁻¹) | |||
In each case, the frequencies of sectors exhibiting all alternative phenotypes are combined.
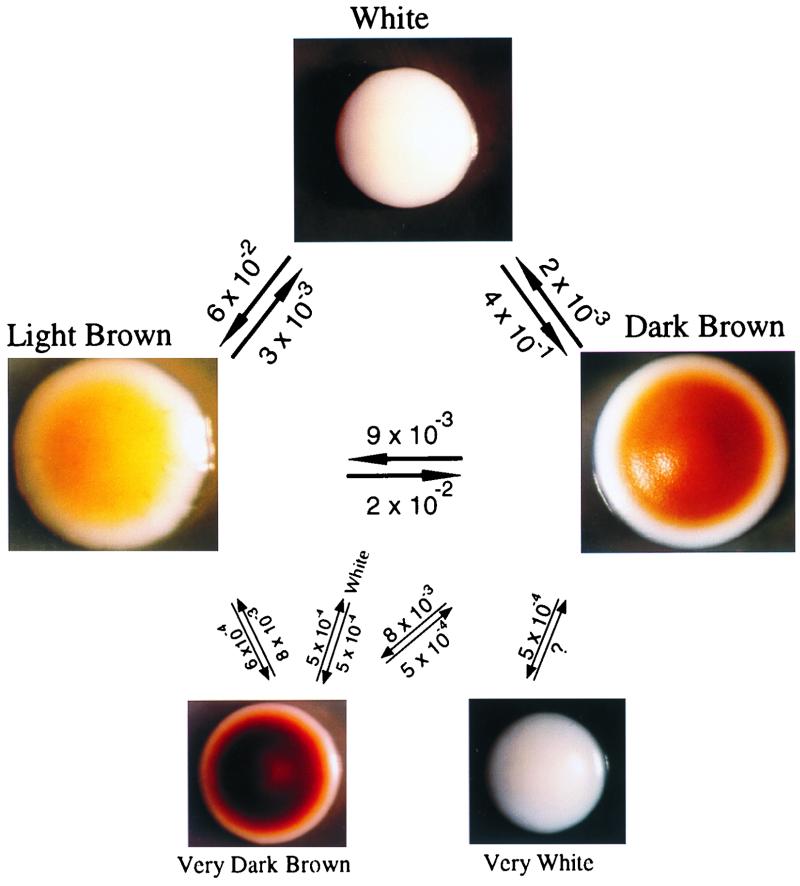
The frequencies of alternative colony-forming phenotypes in the cell populations of Wh, LB, and DB colonies have been placed over vectors in the summary diagram of switching in Fig. 3. These frequencies, however, are not meant to represent the rates or frequencies of switch events (see Discussion; also see references 2, 38, and 45). Rather, they represent the proportion of alternative CFU that accumulate in 5-day-old colonies with apparently homogeneous phenotypes. It should be noted that the proportion of alternative CFU increased with colony age (data not shown), as is the case for the accumulation of opaque-phase cells in white-phase colonies (48), making it even more difficult to extract true switching frequencies from the data in Table 1. Even so, the data in Table 1 suggest that Wh cells switch to alternative phenotypes with the highest frequencies and therefore represent the least stable phenotype; LB cells switch to alternative phenotypes at the next-highest frequencies, and DB cells switch to alternative phenotypes at the lowest frequencies. The order of the mean frequencies for alternative colony phenotypes is therefore Wh > LB > DB. The same order was observed in the mean frequencies of sectored colonies (Table 1).
FIG. 3.
Switching repertoire of C. glabrata. Frequencies above vectors refer to proportion of cells forming variant phenotypes in each basic colony phenotype from which the vector emanates. These frequencies are not to be interpreted as accurate rates of switching, although they are believed to reflect relative rates. Time of incubation was 5 days (Wh, LB, and DB) or 4 days (vDB and vWh).
Two additional phenotypes were observed to arise in LB and DB colonies, very dark brown (vDB) and very white (vWh) (Fig. 3). vDB colonies contained Wh, LB, and DB colony-forming cells at frequencies of 5 × 10⁻⁴, 8 × 10⁻³, and 5 × 10⁻⁴, respectively (Fig. 3). In the studies that follow, however, only the three major colony phenotypes Wh, LB, and DB are compared.
The growth kinetics of Wh, LB, and DB cells are similar.
Cells from individual Wh, LB, and DB colonies were inoculated into separate growth flasks containing YPD liquid medium plus 1 mM CuSO4 and grown to 5 × 10⁶ cells per ml. Cells from each of the three flasks were reinoculated into fresh medium, and the growth kinetics of each population were monitored. Cells of all three phenotypes grew with a generation time of 2 h. All three cultures reached stationary phase at a concentration of 3 × 10⁹ cells per ml. Aliquots were removed at stationary phase and plated on agar to assess phenotype. While over 95% of LB and DB cells expressed LB and DB phenotypes, respectively, after 15 generations, only 60% of Wh cells expressed the Wh phenotype. This latter observation was consistent with the respective switching frequencies of the three phenotypes.
Switching of C. glabrata is not associated with microevolution identified by the DNA fingerprinting probe Cg6.
To verify that the three major switch phenotypes represented the same strain and to test whether switching was associated with microevolution, the DNA of cells from Wh, LB, and DB colonies was individually digested with EcoRI, the digestion products were separated in a 0.65% agarose gel, and Southern blots were incubated with the C. glabrata-specific probes Cg6 and Cg12 (21). Hypervariability in the Cg6 pattern of a strain over time has been demonstrated to be a strong indicator of microevolution (21). The hybridization patterns for Wh, LB, and DB probed with Cg6 were identical, as were the patterns with Cg12 (data not shown). DNA polymorphisms were not evident in the 4- to 6-kb range in the Cg6 patterns (data not shown), which is the molecular mass range in which microevolutionary changes are identified with this probe (21). These results not only verified that Wh, LB, and DB cells represent switch phenotypes of the same strain but also demonstrated that microevolutionary changes identified by Cg6 (21) are not associated with switching.
Switching involves the regulation of a metallothionein gene.
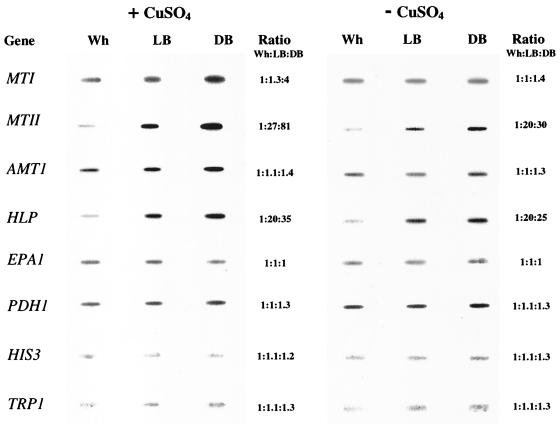
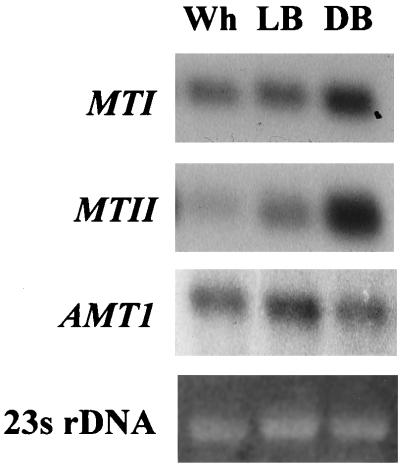
Detoxification of copper is accomplished in C. glabrata primarily through expression of three metallothionein genes, MT-I, a single-copy gene, MT-IIa, a tandemly amplified gene, and MT-IIb, a single-copy gene with a coding region identical to that of MT-IIa (30). Since the transcripts of MT-IIa and MT-IIb are indistinguishable, we will refer to their transcripts simply as MT-II transcripts, as has been done in the past in analyses of transcription regulation (30, 60). To test whether these genes were under the regulation of switching, slot blots of total cell RNA extracted from Wh, LB, and DB cells grown on 1 mM CuSO4 were probed with either the cloned MT-I or MT-IIa gene. The levels of MT-I transcript were similar in Wh and LB cells and slightly higher in DB cells (Fig. 4). Densitometric scans of the slot blots probed with MT-I provided relative ratios of 1.0:1.3:4.0 for Wh:LB:DB cells (Fig. 4). In contrast, the levels of MT-II transcripts were very low in Wh cells, far higher in LB cells, and highest in DB cells grown in the presence of CuSO4 (Fig. 4). Densitometric scans of the slot blots probed with MT-IIa provided relative transcript ratios of 1:27:81 for Wh:LB:DB (Fig. 4). Northern blots probed with MT-I and MT-IIa (Fig. 5) verified similar levels of MT-I and increasing levels of MT-II transcript in Wh:LB:DB cells, as demonstrated in slot blots (Fig. 4).
FIG. 4.
Transcript levels of genes MT-I, MT-II (MT-IIa plus MT-IIb), AMT-I, HLP, EPAI, PDHI, HIS3, and TRPI in the Wh, LB, and DB phases of C. glabrata switching. Slot blots of total cell RNA were probed with radioactive probes. Relative ratios (Ratio Wh:LB:DB) of transcript levels were assessed by densitometric tracings. The backgrounds bordering the slots have been subtracted from the digitized slot blot images by computer-assisted methods. The grey scale intensities of the slots, however, are unmodified.
FIG. 5.
Northern blots of total cell RNA of Wh, LB, and DB cells probed with MTI, MTII, and AMTI. Ethidium bromide-stained 23S rDNA is presented at the bottom to assess loading.
Because the levels of MT-I and MT-II transcripts were originally demonstrated to be regulated by CuSO4 (28), slot blots of total cell RNA purified from Wh, LB, and DB cells grown in the absence of CuSO4 were also probed with the cloned MT-I and MT-IIa genes. Hybridization signals were either not evident or barely evident in preparations of Wh, LB, and DB cells grown in the absence of CuSO4 at exposure times sufficient to visualize MT-I and MT-IIa hybridization in preparations from cells grown in the presence of CuSO4. However, at increased exposure times for both genes, signals were evident for all three phenotypes grown in the absence of CuSO4 (Fig. 4). Densitometric scans of the slot blots probed with MT-I provided relative ratios of 1.0:1.0:1.4 for Wh:LB:DB, indicating no regulation by switching at the level of transcription. In contrast, densitometric scans of the slot blots probed with MT-IIa provided relative ratios of 1:20:25 for Wh:LB:DB, indicating that switching also regulates MT-II transcript levels in the absence of CuSO4.
Both in the presence and in the absence of CuSO4, the lowest hybridization signals with MT-IIa were in Wh cells. Since the Wh cell phenotype was the most unstable, each analyzed Wh cell population contained a significant number of DB and LB cells (Fig. 3; Table 1). To minimize this problem, we used young colonies (3 days, 25°C) that had, on average, accumulated fewer cells with alternative colony-forming phenotypes. Even so, we could not discriminate between the possibility that the low but measurable level of MT-II transcript in white-phase cell populations (Fig. 4) was due to a low level of MT-II transcript in white-phase cells or to MT-II transcripts in contaminating DB and LB cells resulting from the high frequency of switching by Wh cells. The combined results unambiguously demonstrate, however, that the level of MT-II transcript is regulated by switching as well as CuSO4.
Switching does not affect transcript levels of the transcription factor gene AMT-I.
The copper-dependent transcription factor Amt1p plays a role in the activation of MT-I and MT-II transcription (58). To test whether the transcript levels of AMT-I are regulated by switching, slot blots of total RNA from Wh, LB, and DB cells grown in 1 mM CuSO4 were probed with the cloned AMT-I gene. The levels of transcript in Wh, LB, and DB cells were similar. Densitometry scans of the slot blots provided ratios of 1:1:1.4 for Wh:LB:DB (Fig. 4). Northern blots probed with AMT-I (Fig. 5) verified the slot blot results. The levels of AMT-I transcript in Wh, LB, and DB cells grown in the absence of CuSO4 were also similar (Fig. 4), and the levels were similar for cells of each phenotype grown in the presence and absence of CuSO4 (Fig. 4). The transcript level of AMT-I is, therefore, not regulated by switching. We assume that the apparently constitutive level of AMT-I transcript in YPD medium not supplemented with CuSO4 reflects induction by the low levels of residual CuSO4. This sensitivity was suggested by results of previously reported experiments in which 25 μM CuSO4 induced near-maximum levels of AMT-I transcript (60).
HLP, a gene for a hemolysin-like protein, is also regulated by switching.
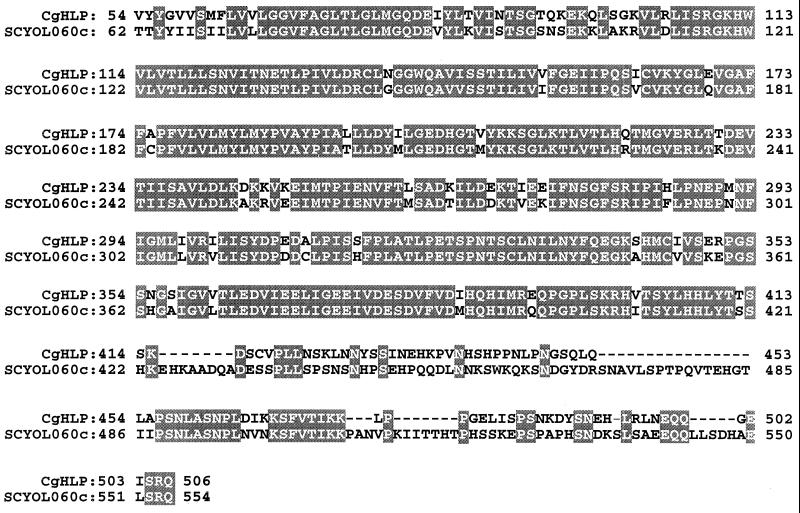
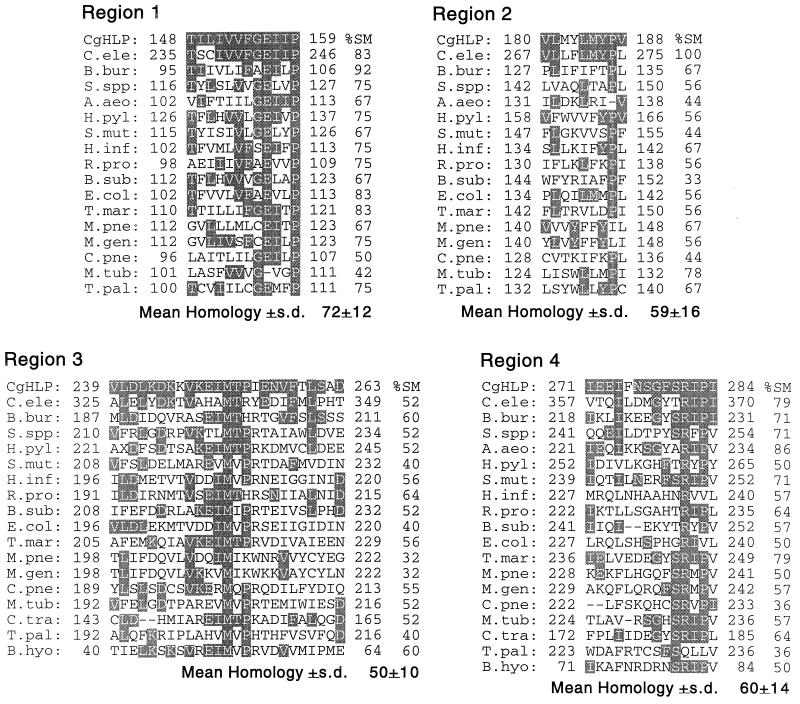
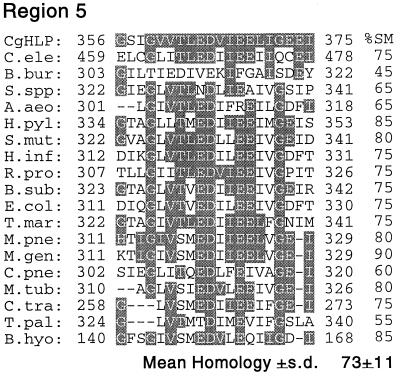
Using gene-specific primers for the S. cerevisiae SLF1 gene (57), we performed a PCR with C. glabrata genomic DNA as a template and serendipitously cloned a partial DNA fragment of a C. glabrata homolog of the S. cerevisiae gene YOL060c (25), which encodes a putative protein with three transmembrane domains. The cloned DNA fragment was 1,586 nucleotides in length. The deduced primary sequence of 508 amino acids exhibited 75% identity and 85% similarity to the corresponding region of the S. cerevisiae YOL060c gene product (Fig. 6). Comparison of the deduced amino acid sequence of the fragment with entries in protein databases demonstrated similarity with hemolysins from a variety of pathogenic and nonpathogenic bacteria as well as eukaryotes (10, 56). In particular, comparison with databases revealed five regions with high similarity in both position and arrangements of amino acids between the cloned C. glabrata fragment and hemolysins from 17 bacteria and Caenorhabditis elegans (Fig. 7). The mean similarity of region 1 of the deduced C. glabrata protein sequence and hemolysins from 16 unrelated organisms was 72% ± 12%; similarity ranged between 42 and 92% (Fig. 7). The mean similarities of regions 2, 3, 4, and 5 of the deduced partial C. glabrata protein and the hemolysins of unrelated organisms were 59% ± 16%, 50% ± 10%, 60% ± 14%, and 73% ± 11%, respectively (Fig. 7). Furthermore, the relative positions of all five regions in the deduced partial C. glabrata protein were similar to those in the majority of hemolysins of other organisms. We therefore have named the partially cloned C. glabrata gene HLP, for “hemolysin-like protein.”
FIG. 6.
Comparison of homologous regions of deduced amino acid sequences of partial gene products of C. glabrata HLP (CgHLP) and S. cerevisiae YOL060c (SCYOL060c). Shaded regions represent identical amino acids; dashes represent amino acids absent in HLP.
FIG. 7.
Comparison of deduced amino acid sequences of five conserved regions of the partial C. glabrata HLP gene product (CgHLP) and hemolysin gene products from a variety of organisms. Identity (the same amino acid) is represented by shading. Percent similarity (%SM) to the deduced amino acid sequence of each region of the partial HLP protein is presented to the right of regions of the hemolysins of other organisms. Similarity is based on comparable charge and functional groups (10, 56). Abbreviations, organisms, and accession numbers for sequences: C.ele, Caenorhabditis elegans, U4158; B.bur, Borrelia burgdorferi, AE001130; S.spp, Synechocystis strain PCC6803, P74409; A.aeo, Aquifex aeolicus, AE000673; H.pyl, Helicobacter pylori, AE000647; S.mut, Streptococcus mutans, AF051356; H.inf, Haemophilus influenzae, 057017; R.pro, Rickettsia prowazekii, AJ235273; B.sub, Bacillus subtilis, 007585; E.coli, Escherichia coli, P37908; T.mar, Thermotoga maritima, AE001751; M.pne, Mycoplasma pneumoniae, P75586; M.gen, Mycoplasma genitalium, 049399; C.pne, Chlamydia pneumoniae, AE001623; M.tub, Mycobacterium tuberculosis, 005832; T.pal, Treponema pallidum, AE001188; B.hyo, Brachyspira hyodysenteriae, 054318; C.tra, Chlamydia trachomatis, AE001316.
The level of HLP transcript in the three switch phenotypes of C. glabrata was assessed by slot blot analysis. The levels of transcript were lowest in Wh cells, intermediate in LB cells, and highest in DB cells grown in CuSO4 (Fig. 4). Densitometric scans provided relative ratios of 1:20:35 for Wh:LB:DB (Fig. 4). Similar differences were observed in the absence of CuSO4. The ratios in the latter case were 1:20:25, respectively (Fig. 4). No differences, however, were observed between cells of each phenotype grown in the presence or absence of CuSO4 (Fig. 4). Therefore, the transcript level of HLP was regulated by switching in a manner similar to that of MT-II, but in contrast to MT-II, transcript levels of HLP were not regulated by CuSO4.
C. glabrata genes HIS3, TRPI, EPAI, and PDHI are not regulated by switching or CuSO4.
To assess the extent of gene regulation by high-frequency phenotypic switching, the same slot blot of total RNA from Wh, LB, and DB cells was probed successively with TRPI, which is involved in tryptophan metabolism (17), HIS3, which is involved in histidine metabolism (17), EPAI, encoding an adhesin that mediates adherence to epithelial cells (5), and PDHI, encoding an ABC transporter gene involved in drug resistance (31). The levels of transcript of each of the four genes were similar in Wh, LB, and DB cells grown in 1 mM CuSO4 (Fig. 4). Densitometry scans of the slot blots in all cases resulted in relative ratios of approximately 1:1:1 for Wh:LB:DB (Fig. 4). The levels of transcript of each of the four genes were also the same in the presence or absence of CuSO4 (Fig. 4). These results demonstrate that, like transcription of MT-I and AMT-I, transcription of TRPI, HIS3, EPAI, and PDHI is not regulated by switching.
MT-II expression is not regulated by amplification during switching.
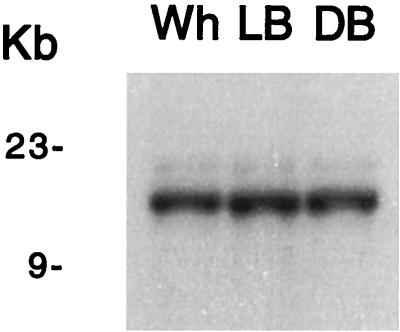
Mehra et al. (29) demonstrated that MT-IIa was amplified more than 30 times in tandem when C. glabrata cells were serially cultured in medium containing increasing concentrations of CuSO4. Since SalI restriction sites flank the MT-IIa tandem repeat region but are absent from the tandem MT-IIa sequences, the size of the SalI fragment containing MT-IIa reflects the number of tandem repeats. Total cell DNA preparations from Wh, LB, and DB cells were digested with SalI and probed in Southern blots with radiolabeled MT-IIa. The sizes and intensities of the hybridizing bands were similar for the three phenotypes (Fig. 8), demonstrating that the regulation of MT-II transcript levels during switching is not mediated by amplification of MT-IIa. Based on size estimates of the SalI fragment harboring the tandem MT-IIa repeats, the number of repeats was estimated to be nine in each of the three switch phenotypes.
FIG. 8.
The regulation of MT-II transcript levels by switching does not involve tandem gene amplification of MT-IIa as demonstrated by Southern blot analysis. Total cell DNA preparations from Wh, LB, and DB cells were digested with SalI, and Southern blots were probed with radioactive MT-IIa.
High-frequency switching occurs in all tested strains.
The experiments assessing switching and gene expression were performed on strain 35B11, an oral isolate from a healthy, elderly individual (23). To test whether high-frequency switching was a general characteristic of C. glabrata, switching was tested in three additional C. glabrata isolates, 65FLOP, 65TL1, and 75PLI. For each strain, cells from a single colony were first grown in YPD medium containing 1 mM CuSO4 and then plated at low density on YPD agar containing 1 mM CuSO4, and colony phenotypes were assessed after 5 days of incubation at 25°C. In every case, multiple phenotypes based on colony color (Wh, LB, or DB) were observed at frequencies (Table 2) roughly similar to those observed for strain 35B11 (Table 1). These results suggest that switching is a general characteristic of C. glabrata strains.
TABLE 2.
Switching in three additional pathogenic isolates of C. glabrata
| Strain | Original phenotype | No. of colonies | Frequency of colonies
|
||||
|---|---|---|---|---|---|---|---|
| Wha | LB | DB | Sectoredb | Variant | |||
| 65FLOP | LB | 3,775 | 5.8 × 10⁻³ | 5.8 × 10⁻³ | 9% | 1.2 × 10⁻² | |
| 65TL1 | LB | 2,330 | 4.0 × 10⁻⁴ | 5.4 × 10⁻² | >80% | 5.5 × 10⁻² | |
| 75PL1 | DB | 3,290 | 2.4 × 10⁻³ | 6.0 × 10⁻⁴ | 0.4% | 3.0 × 10⁻³ | |
Wh colonies were further subdivided into 8 normal smooth white and 14 conus smooth white.
In platings of both the 65FLOP and 65TL1 cells, the great majority of sectors in LB colonies were DB. In the DB colonies, six Wh sectors, two LB sectors, and seven vDB sectors were observed.
DISCUSSION
We found that when cells from a stock culture of C. glabrata 35B11 were plated on YPD agar containing CuSO4, they formed colonies that were predominantly LB, but they also formed colonies that were DB and Wh. When cells from a Wh, DB, or LB colony from this original plating were serially plated, they formed a minority of the two other colony phenotypes. Wh was the most unstable and DB was the most stable phenotype. Cells from 5-day-old Wh colonies contained approximately 20% DB and LB cells, while cells from 5-day DB colonies contained approximately 0.3% LB and Wh cells, representing a 70-fold difference in the proportion of alternative phenotypes. Differences in the proportions of alternative colony-forming cells in clonal populations of each phenotype most probably reflect differences in the rates of switching. However, the proportions cannot be converted directly to rates of switching without first determining the differential rates of growth of each phenotype on agar and competitive effects on growth in mixed populations. However, frequencies can be estimated either by applying the Luria-Delbrück fluctuation formula (38) or by monitoring single cell lineages microscopically (2, 48). The latter method depends on the capacity to discriminate switch phenotypes at the single-cell level and may be feasible with coloration used to discriminate between the different cell types of C. glabrata. The results obtained in this study, however, demonstrate that the frequency of switching in C. glabrata is high, that switching is reversible at high frequency, and that the general order of frequencies appears to be Wh > LB > DB.
We have demonstrated that in addition to the Wh, LB, and DB phenotypes, there exist vWh and vDB phenotypes that appear at lower but significant frequencies. In the case of the highly analyzed switching system in C. albicans WO-1, virtually all research into the molecular basis of switching has focused on the transition between the white phase and opaque phase (e.g., references 46 and 47), even though strain WO-1 also switches reversibly, but at lower frequencies, to three additional phenotypes that include two distinct fuzzy colony morphologies and an irregular wrinkled morphology (41). By analyzing only the major phenotypic transition between the white and opaque phases in C. albicans WO-1, significant progress has been made in elucidating the mechanisms that regulate switching and phase-specific gene regulation (22, 51, 53, 54). Similarly, concentrating on the transitions between the Wh, LB, and DB phenotypes may provide a similar paradigm for understanding switching in C. glabrata.
Because we have used the presumed reduction of CuSO4 to Cu2S (57) as an indicator of switching, and since the presence of CuSO4 in growth medium induces expression of the metallothionein genes MT-I and MT-II (28), we tested whether transcript levels of the metallothionein genes MT-I and MT-II were regulated by switching at the level of transcription. We have demonstrated that in addition to regulation by CuSO4, MT-II transcript levels are regulated by switching. The level of MT-II transcripts increased with the intensity of color, in the order DB > LB > Wh. In the presence of CuSO4, the respective transcript levels in LB and DB cells were 27 and 81 times higher than in Wh cells; in the absence of CuSO4, the respective transcript levels were 20 and 30 times higher than in Wh cells. The low level of expression of MT-II in the Wh phase was very likely due to LB and DB cell contamination as a result of the high frequency of Wh switching. The MT-IIa and MT-IIb genes may, in fact, be silent in the Wh phase. Alternatively, the very low level of MT-II transcript in Wh cells may reflect switching-insensitive expression of one of the two MT-II genes that accounts for the minority of MT-II transcripts, presumably MT-IIb (60). Since Mehra et al. (29) demonstrated that by culturing C. glabrata repeatedly in increasing concentrations of CuSO4, the cells became more resistant to CuSO4 and simultaneously underwent tandem amplification of the MT-IIa gene, we also entertained the possibility that switching involves MT-IIa amplification. This was not the case. Wh, LB, and DB cells of strain 35B11 each contained nine tandem copies of the MT-IIa gene.
The DNA fragment containing part of the hemolysin-like protein gene HLP was serendipitously cloned by using primers developed to amplify a C. glabrata homolog of the S. cerevisiae gene SLF1, which has been implicated in copper homeostasis (57). The fragment showed 76% identity at the deduced amino acid level to the S. cerevisiae gene YOL060c (25). It was also similar to hemolysin-like genes from a variety of organisms, ranging in complexity from bacteria to nematodes (Fig. 7). The deduced amino acid sequence of the fragment contained five hemolysin regions with amino acid similarities ranging from an average of 50% for the 25 amino acids in region 3 to 73% for the 20 amino acids in region 5. In addition, organization of the similar sequences was approximately the same as that in other hemolysin-like genes. There have been no previous reports of a hemolysin gene in the Candida species. Ebina et al. (7) identified a hemolysin gene in Aspergillus fumigatus, and Manns et al. (26) reported the release of a hemolytic factor from C. albicans when cells were grown on glucose-enriched blood agar. We have demonstrated here that expression of HLP is regulated by switching in a manner similar to that for MT-II, with the same order of transcript levels: DB > LB > Wh. However, in contrast to MT-II, HLP is not regulated by CuSO4. To test whether MT-II and HLP share common regulatory circuitry, a functional analysis of their promoters has been initiated. To verify that the levels of MT-II and HLP transcripts were in fact selectively regulated in Wh, LB, and DB colonies, the transcript levels of additional genes were analyzed. Transcript levels of MT-I (28), AMT-I (58), TRP1 (17), HIS3 (17), EPA-1 (5), and PDHI (31) were similar in Wh, LB, and DB cells grown in the presence or absence of 1 M CuSO4, supporting the conclusion that MT-II and HLP are selectively regulated by switching.
Finally, we have demonstrated that switching between Wh, LB, and DB occurs in all tested C. glabrata strains. Therefore, as in the case of C. albicans (34, 46, 47), the possibility should be entertained that switching in C. glabrata represents a general strategy for the combinatorial expression of genes encoding proteins involved in virulence and therefore that it represents a mechanism for phenotypic plasticity basic to pathogenesis. In C. albicans, switching has been demonstrated to occur at higher frequencies in isolates from deep versus superficial mycoses (16), at higher frequencies in infecting versus commensal isolates from the oral cavity (13), within sites of infection (49, 50), and within sites of commensalism (45). Switching has also been demonstrated to regulate virulence in alternative animal models (18). Similar studies must now be performed to test whether switching in C. glabrata also occurs at sites of carriage and infection, whether the switching frequencies of infecting strains are elevated, whether switching alters pathogenesis in different models, and whether putative virulence traits and genes other than HLP and MT-II are regulated by switching. More importantly, however, because C. glabrata is haploid, a mutational approach to the elucidation of high-frequency phenotypic switching in the fungi is now possible. This has not been feasible in C. albicans since it is diploid.
ACKNOWLEDGMENTS
We are indebted to S. R. Lockhart for the C. glabrata strains used in this study and C. Pujol for helpful suggestions.
This research was supported by Public Health Service grants DE10758 and AI39735.
REFERENCES
- 1.Balan I, Alareo A, Raymond M. The Candida albicans CDR3 gene codes for an opaque-phase ABC transporter. J Bacteriol. 1997;179:7210–7218. doi: 10.1128/jb.179.23.7210-7218.1997. [DOI] [PMC free article] [PubMed] [Google Scholar]
- 2.Bergen M, Voss E, Soll D R. Switching frequencies for the white-opaque transition. J Gen Microbiol. 1990;136:1925–1936. doi: 10.1099/00221287-136-10-1925. [DOI] [PubMed] [Google Scholar]
- 3.Blaschke-Hellmessen R. Fluconazole and intraconazole susceptibility testing with clinical yeast isolates and algae of the genus Prototheca by means of the E test. Mycoses. 1996;2:39–43. doi: 10.1111/j.1439-0507.1996.tb00526.x. [DOI] [PubMed] [Google Scholar]
- 4.Butt T R, Ecker D J. Yeast metallothionein applications in biotechnology. Microbiol Rev. 1987;51:351–364. doi: 10.1128/mr.51.3.351-364.1987. [DOI] [PMC free article] [PubMed] [Google Scholar]
- 5.Church G M, Gilbert W. Genomic sequencing. Proc Natl Acad Sci USA. 1984;81:1991–1995. doi: 10.1073/pnas.81.7.1991. [DOI] [PMC free article] [PubMed] [Google Scholar]
- 6.Cormack B P, Ghori N, Falkow S. An adhesion of the yeast pathogen Candida glabrata mediating adherence to human epithelial cells. Science. 1999;285:578–582. doi: 10.1126/science.285.5427.578. [DOI] [PubMed] [Google Scholar]
- 7.Ebina K, Sakagami H, Yokota K, Kondo H. Cloning and nucleotide sequence of cDNA encoding Asp-hemolysin from Aspergillus fumigatus. Biochim Biophys Acta. 1994;1219:148–150. doi: 10.1016/0167-4781(94)90258-5. [DOI] [PubMed] [Google Scholar]
- 8.Fidel P C, Vazquez J A, Sobel J D. Candida glabrata review of epidemiology, pathogenesis, and clinical disease with comparison to C. albicans. Clin Microbiol Rev. 1999;12:80–96. doi: 10.1128/cmr.12.1.80. [DOI] [PMC free article] [PubMed] [Google Scholar]
- 9.Fortun J, Lopez-San Roman A, Velasco J J, Sanchez-Sousa A, de Vicente E, Querda C, Barcena R, Monge G, Candela A, Honrubia A, Guerrero A. Selection of Candida glabrata strains with reduced susceptibility to azoles in four liver transplant patients with invasive candidiasis. Eur J Clin Microbiol Infect Dis. 1997;16:314–318. doi: 10.1007/BF01695638. [DOI] [PubMed] [Google Scholar]
- 10.Gish W, States D J. Identification of protein coding regions by database similarity search. Nat Genet. 1993;3:266–272. doi: 10.1038/ng0393-266. [DOI] [PubMed] [Google Scholar]
- 11.Gow N A. Germ tube growth in medical mycology. Curr Top Med Mycol. 1997;8:43–55. [PubMed] [Google Scholar]
- 12.Hazen K C. New and emerging yeast pathogens. Clin Microbiol Rev. 1995;8:462–478. doi: 10.1128/cmr.8.4.462. [DOI] [PMC free article] [PubMed] [Google Scholar]
- 13.Hellstein J, Vawter-Hugart H, Fotos P, Schmid J, Soll D R. Genetic similarity and phenotypic diversity of commensal and pathogenic strains of Candida albicans isolated from the oral cavity. J Clin Microbiol. 1993;31:3190–3199. doi: 10.1128/jcm.31.12.3190-3199.1993. [DOI] [PMC free article] [PubMed] [Google Scholar]
- 14.Hitchcock C A, Pye G W, Troke P F, Johnson E M, Warnock D W. Fluconazole resistance in Candida glabrata. Antimicrob Agents Chemother. 1993;37:1962–1965. doi: 10.1128/aac.37.9.1962. [DOI] [PMC free article] [PubMed] [Google Scholar]
- 15.Hube B, Monod M, Schofield D, Brown A, Gow N. Expression of seven members of the gene family encoding aspartyl proteinases in Candida albicans. Mol Microbiol. 1994;14:87–99. doi: 10.1111/j.1365-2958.1994.tb01269.x. [DOI] [PubMed] [Google Scholar]
- 16.Jones S, White G, Hunter P R. Increased phenotypic switching in strains of Candida albicans associated with invasive infections. J Clin Microbiol. 1994;32:2869–2870. doi: 10.1128/jcm.32.11.2869-2870.1994. [DOI] [PMC free article] [PubMed] [Google Scholar]
- 17.Kitada K, Yamaguchi E, Arisawa M. Cloning of the Candida glabrata TRP1 and HIS3 genes, and construction of their disruption strains by sequential integrative transformation. Gene. 1995;165:203–206. doi: 10.1016/0378-1119(95)00552-h. [DOI] [PubMed] [Google Scholar]
- 18.Kvaal C, Lachke S A, Srikantha T, Daniels K, McCoy J, Soll D R. Misexpression of the opaque phase-specific gene PEP1 (SAP1) in the white phase of Candida albicans confers increased virulence in a mouse model of cutaneous infection. Infect Immun. 1999;67:6652–6662. doi: 10.1128/iai.67.12.6652-6662.1999. [DOI] [PMC free article] [PubMed] [Google Scholar]
- 19.Kvaal C A, Srikantha T, Soll D R. Misexpression of the white-phase specific gene WH11 in the opaque phase of Candida albicans affects switching and virulence. Infect Immun. 1997;65:4468–4475. doi: 10.1128/iai.65.11.4468-4475.1997. [DOI] [PMC free article] [PubMed] [Google Scholar]
- 20.Lo H J, Kohler J R, DiDomenico B, Loebenberg D, Cacciapouti A, Fink G R. Nonfilamentous C. albicans mutants are avirulent. Cell. 1997;90:939–949. doi: 10.1016/s0092-8674(00)80358-x. [DOI] [PubMed] [Google Scholar]
- 21.Lockhart S R, Joly S, Pujol C, Sobel J, Pfaller M, Soll D R. Development and verification of fingerprinting probes for Candida glabrata. Microbiology. 1997;143:3733–3746. doi: 10.1099/00221287-143-12-3733. [DOI] [PubMed] [Google Scholar]
- 22.Lockhart S R, Nguyen M, Srikantha T, Soll D R. A MADS box protein consensus binding site is necessary and sufficient for activation of the opaque-phase-specific gene OP4 of Candida albicans. J Bacteriol. 1998;180:6607–6616. doi: 10.1128/jb.180.24.6607-6616.1998. [DOI] [PMC free article] [PubMed] [Google Scholar]
- 23.Lockhart S R, Joly S, Vargas K, Swails-Wenger J, Enger L, Soll D R. Natural defenses against Candida colonization breakdown in the oral cavities of the elderly. J Dent Res. 1999;78:857–868. doi: 10.1177/00220345990780040601. [DOI] [PubMed] [Google Scholar]
- 24.Maniatis T, Fritsch E F, Sambrook J. Molecular cloning: a laboratory manual. Cold Spring Harbor, N.Y: Cold Spring Harbor Laboratory; 1982. [Google Scholar]
- 25.Mannkaupt G, Vetter I, Schwarzlose C, Mitzel S, Feldmann H. Analysis of a 26 kb region on the left arm of yeast chromosome XV. Yeast. 1996;12:67–76. doi: 10.1002/(sici)1097-0061(199601)12:1<67::aid-yea884>3.0.co;2-f. [DOI] [PubMed] [Google Scholar]
- 26.Manns J M, Mosser D M, Buckley H R. Production of a hemolytic factor by Candida albicans. Infect Immun. 1994;62:5154–5156. doi: 10.1128/iai.62.11.5154-5156.1994. [DOI] [PMC free article] [PubMed] [Google Scholar]
- 27.Marichal P, Vandenbussche H, Odds F C, Nobels G, Warnock D W, Timmerman V, Van Broeckhoven C, Fay S, Mose-Larsen P. Molecular biological characteristics of an azole-resistant Candida glabrata isolate. Antimicrob Agents Chemother. 1997;41:2229–2237. doi: 10.1128/aac.41.10.2229. [DOI] [PMC free article] [PubMed] [Google Scholar]
- 28.Mehra R K, Garey J R, Butt T R, Gray W R, Winge D R. Candida glabrata metallothioneins cloning and sequence of the genes and characterization of proteins. J Biol Chem. 1989;264:19747–19753. [PubMed] [Google Scholar]
- 29.Mehra R K, Garey J R, Winge D R. Selective and tandem amplification of a member of the metallothionein gene family in Candida glabrata. J Biol Chem. 1990;265:6369–6375. [PubMed] [Google Scholar]
- 30.Mehra R K, Thorvaldsen J L, Macreadie I G, Winge I G. Disruption analysis of metallothionein-encoding genes in Candida glabrata. Gene. 1992;114:75–80. doi: 10.1016/0378-1119(92)90709-x. [DOI] [PubMed] [Google Scholar]
- 31.Miyazaki H, Miyazaki Y, Geber A, Parkinson T, Hitchcock C, Falconer D J, Ward D J, Marsden K, Bennett J E. Fluconazole resistance associated with drug efflux and increased transcription of a drug transporter gene, PDH1, in Candida glabrata. Antimicrob Agents Chemother. 1998;42:1695–1701. doi: 10.1128/aac.42.7.1695. [DOI] [PMC free article] [PubMed] [Google Scholar]
- 32.Morrow B, Srikantha T, Soll D R. Transcription of the gene for a pepsinogen, PEP1, is regulated by white-opaque switching in Candida albicans. Mol Cell Biol. 1992;12:2997–3005. doi: 10.1128/mcb.12.7.2997. [DOI] [PMC free article] [PubMed] [Google Scholar]
- 33.Morrow B, Srikantha T, Anderson J, Soll D R. Coordinate regulation of two opaque-specific genes during white-opaque switching in Candida albicans. Infect Immun. 1993;61:1823–1828. doi: 10.1128/iai.61.5.1823-1828.1993. [DOI] [PMC free article] [PubMed] [Google Scholar]
- 34.Odds F C. Candida and candidiasis. London, England: Baillière Tindall; 1988. [Google Scholar]
- 35.Odds F C. Switch of phenotype as an escape mechanism of the intruder. Mycoses. 1997;40(Suppl. 2):9–12. doi: 10.1111/j.1439-0507.1997.tb00556.x. [DOI] [PubMed] [Google Scholar]
- 36.Pfaller M A. Nosocomial candidiasis: emerging species, reservoirs and models of transmission. Clin Infect Dis. 1996;22(Suppl. 2):589–594. doi: 10.1093/clinids/22.supplement_2.s89. [DOI] [PubMed] [Google Scholar]
- 37.Richardson M D, Smith H. Production of germ tubes by virulent and attenuated strains of Candida albicans. J Infect Dis. 1981;144:565–569. doi: 10.1093/infdis/144.6.565. [DOI] [PubMed] [Google Scholar]
- 38.Rikkerink E H A, Magee B B, Magee P T. Opaque-white phenotypic transition: a programmed morphological transition in Candida albicans. J Bacteriol. 1988;170:895–899. doi: 10.1128/jb.170.2.895-899.1988. [DOI] [PMC free article] [PubMed] [Google Scholar]
- 39.Scherer S, Stevens D. Application of DNA typing methods to epidemiology and taxonomy of Candida species. J Clin Microbiol. 1987;25:675–679. doi: 10.1128/jcm.25.4.675-679.1987. [DOI] [PMC free article] [PubMed] [Google Scholar]
- 40.Schmid J, Voss E, Soll D R. Computer-assisted methods for assessing strain relatedness in Candida albicans by fingerprinting with the moderately repetitive sequence Ca3. J Clin Microbiol. 1990;28:1236–1243. doi: 10.1128/jcm.28.6.1236-1243.1990. [DOI] [PMC free article] [PubMed] [Google Scholar]
- 41.Slutsky B, Staebell M, Anderson J, Risen L, Pfaller M, Soll D R. “White-opaque transition”: a second high-frequency switching system in Candida albicans. J Bacteriol. 1987;169:189–197. doi: 10.1128/jb.169.1.189-197.1987. [DOI] [PMC free article] [PubMed] [Google Scholar]
- 42.Sobel J D. Candida vulvovaginitis. Semin Dermatol. 1996;15:17–28. doi: 10.1016/s1085-5629(96)80014-9. [DOI] [PubMed] [Google Scholar]
- 43.Sobel J D, Muller G, Buckley H R. Critical role of germ tube formation in the pathogenesis of candidal vaginitis. Infect Immun. 1984;44:576–580. doi: 10.1128/iai.44.3.576-580.1984. [DOI] [PMC free article] [PubMed] [Google Scholar]
- 44.Soll D R. The regulation of cellular differentiation in the dimorphic yeast Candida albicans. Bioessays. 1986;5:5–11. doi: 10.1002/bies.950050103. [DOI] [PubMed] [Google Scholar]
- 45.Soll D R. High-frequency switching in Candida albicans. Clin Microbiol Rev. 1992;5:183–203. doi: 10.1128/cmr.5.2.183. [DOI] [PMC free article] [PubMed] [Google Scholar]
- 46.Soll D R. The emerging molecular biology of switching in Candida albicans. ASM News. 1996;62:415–420. [Google Scholar]
- 47.Soll D R. Gene regulation during high frequency switching in Candida albicans. Microbiology. 1997;143:279–288. doi: 10.1099/00221287-143-2-279. [DOI] [PubMed] [Google Scholar]
- 47a.Soll, D. R. The “ins and outs” of DNA fingerprinting of infectious fungi. Clin. Microbiol. Rev., in press. [DOI] [PMC free article] [PubMed]
- 48.Soll D R, Anderson J, Bergen M. The developmental biology of the white-opaque transition in Candida albicans. In: Prasad R, editor. Candida albicans: cellular and molecular biology. Berlin, Germany: Springer-Verlag; 1991. pp. 20–45. [Google Scholar]
- 49.Soll D R, Langtimm C J, McDowell J, Hicks J, Galask R. High-frequency switching in Candida strains isolated from vaginitis patients. J Clin Microbiol. 1987;25:1611–1622. doi: 10.1128/jcm.25.9.1611-1622.1987. [DOI] [PMC free article] [PubMed] [Google Scholar]
- 50.Soll D R, Staebell M, Langtimm C J, Pfaller M, Hicks J, Rao T V G. Multiple Candida strains in the course of a single systemic infection. J Clin Microbiol. 1988;26:1448–1459. doi: 10.1128/jcm.26.8.1448-1459.1988. [DOI] [PMC free article] [PubMed] [Google Scholar]
- 51.Sonneborn A, Tebarth B, Ernst J F. Control of white-opaque phenotypic switching in Candida albicans by the Efg1p morphogenetic regulator. Infect Immun. 1999;67:4655–4660. doi: 10.1128/iai.67.9.4655-4660.1999. [DOI] [PMC free article] [PubMed] [Google Scholar]
- 52.Spinillo A, Capuzzo E, Egbe T, Baltaro F, Nicola S, Piazzi G. Torulopsis glabrata vaginitis. Obstet Gynecol. 1995;85:993–998. doi: 10.1016/0029-7844(95)00047-U. [DOI] [PubMed] [Google Scholar]
- 53.Srikantha T, Chandrasekhar A, Soll D. Functional analysis of the promoter of the phase-specific WH11 gene of Candida albicans. Mol Cell Biol. 1995;15:1797–1805. doi: 10.1128/mcb.15.3.1797. [DOI] [PMC free article] [PubMed] [Google Scholar]
- 54.Srikantha T, Tsai L, Soll D. The WH11 gene of Candida albicans is regulated in two distinct developmental programs through the same transcription activation sequences. J Bacteriol. 1997;179:3837–3844. doi: 10.1128/jb.179.12.3837-3844.1997. [DOI] [PMC free article] [PubMed] [Google Scholar]
- 55.White T, Miyasaki S, Agabian N. Three distinct secreted aspartyl proteinases in Candida albicans. J Bacteriol. 1993;175:6126–6133. doi: 10.1128/jb.175.19.6126-6133.1993. [DOI] [PMC free article] [PubMed] [Google Scholar]
- 56.Worley K C, Wiese B A, Smith R F. BEAUTY: an enhanced BLAST-based search tool that integrates multiple biological information resources into sequence similarity search results. Genome Res. 1995;5:173–184. doi: 10.1101/gr.5.2.173. [DOI] [PubMed] [Google Scholar]
- 57.Yu W, Farrell R A, Stillman D J, Winge D R. Identification of SLF1 as a new copper homeostasis gene involved in copper sulfide mineralization in Saccharomyces cerevisiae. Mol Cell Biol. 1996;16:2464–2472. doi: 10.1128/mcb.16.5.2464. [DOI] [PMC free article] [PubMed] [Google Scholar]
- 58.Zhou P, Thiele D J. Isolation of a metal-activated transcription factor gene from Candida glabrata by complementation in Saccharomyces cerevisiae. Proc Natl Acad Sci USA. 1991;88:6112–6116. doi: 10.1073/pnas.88.14.6112. [DOI] [PMC free article] [PubMed] [Google Scholar]
- 59.Zhou P, Szczypka M S, Sosinowski T, Thiele D J. Expression of a yeast metallothionein gene family is activated by a single metalloregulatory transcription factor. Mol Cell Biol. 1992;12:3766–3775. doi: 10.1128/mcb.12.9.3766. [DOI] [PMC free article] [PubMed] [Google Scholar]
- 60.Zhou P, Thiele D J. Rapid transcriptional autoregulation of a yeast metalloregulatory transcription factor is essential for high-level copper detoxification. Genes Dev. 1993;7:1824–1835. doi: 10.1101/gad.7.9.1824. [DOI] [PubMed] [Google Scholar]


