Keywords: intestinal ion transporters, ion transporters, miR-330-5p, miR-326, sodium hydrogen exchanger-3
Abstract
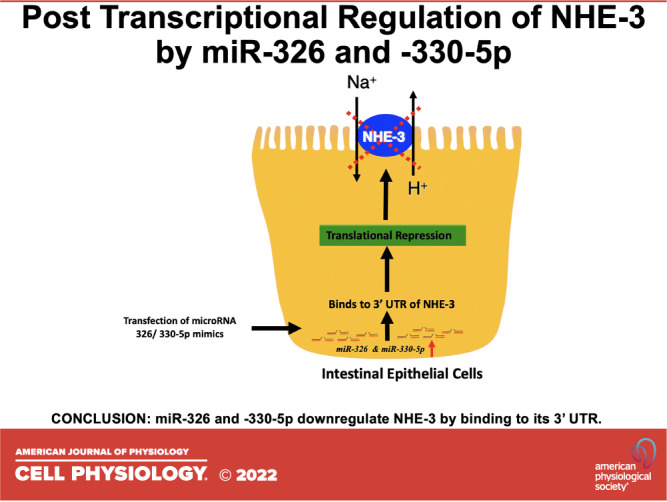
Na+/H+ exchanger-3 (NHE-3) is the major apical membrane transporter involved in vectorial Na+ absorption in the intestine. Dysregulation of NHE-3 expression and/or function has been implicated in pathophysiology of diarrhea associated with gut inflammation and infections. Therefore, it is critical to understand the mechanisms involved in the regulation of NHE-3 expression. MicroRNAs (miRNAs) are highly conserved small RNAs that can regulate gene expression at the posttranscriptional level. To date, however, very little is known about the regulation of NHE-3 expression by microRNAs. Therefore, current studies were undertaken to examine the potential miRNA candidates that can regulate the expression of NHE-3 in intestinal epithelial cells. In silico analysis, using different algorithms, predicted several miRNAs that target NHE-3. MicroRNAs with highest context and target score, miR-326, miR-744-5p, and miR-330-5p, were selected for the current study. Human NHE-3 gene 3′ untranslated region [3′UTR; 160 base pair (bp)] was cloned into pmirGLO vector upstream of luciferase reporter and transiently transfected with mimics of miR-326, miR-744-5p, and miR-330-5p into Caco-2, HT-29, and SK-CO15 cells. Cotransfection of NHE-3 3′ UTR with miR-326 and -miR-330-5p mimics resulted in a significant decrease in relative luciferase activity. Transfection of miR-326 and -330-5p mimics into SK-CO15 cells significantly decreased the NHE-3 protein expression, with no change in NHE-3 messenger ribonucleic acid (mRNA) levels. Our findings demonstrate a novel mechanism for posttranscriptional regulation of NHE-3 by miR-326 and -330-5p by translational repression. We speculate that miR-326 and -330-5p dependent pathways may be involved in modulating NHE-3 expression under physiological and pathophysiological conditions.
INTRODUCTION
Na+/H+ exchanger-3 (NHE-3, SLC9A3), a key cation exchanger expressed at the apical membrane of the intestinal epithelial cells, plays a major role in the transepithelial absorption of sodium and water. NHE-3 is often functionally coupled to the Cl−/ exchanger downregulated in adenoma (DRA, SLC26A3) in mediating electroneutral NaCl absorption in the intestine (1). Recessive mutations in SLC9A3 gene underlie congenital sodium diarrhea (2), a fatal genetic disease characterized by severe watery diarrhea, high concentrations of sodium, hyponatremia, and metabolic acidosis. Importance of NHE-3 in maintenance of intestinal/fluid homeostasis in the intestine is further highlighted by the studies in mice with genetic disruption of NHE-3. NHE-3 deficient mice exhibit modest diarrhea, metabolic acidosis, and impaired fluid homeostasis (3). These mice develop spontaneous, bacteria-mediated distal colitis (4) and exhibit enhanced susceptibility to dextran sulfate sodium (DSS)-mediated mucosal injury (5) and 2,4,6-trinitrobenzenesulfonic acid (TNBS)-induced colitis (6). Inhibition of electroneutral NaCl absorption plays a key role in the pathogenesis of inflammatory diarrhea. Therefore, it is critical to understand the molecular mechanisms involved in regulating NHE-3 expression. We have earlier shown that various transcription factors including hepatocyte nuclear factor 4 (HNF4), Sp1, Sp3, and AP2 are involved in the basal regulation of NHE-3 expression (7). However, mechanisms underlying posttranscriptional regulation of NHE-3 are not known.
MicroRNAs (short, 21–23 nucleotide RNAs) regulate gene expression by binding to sequences in the 3′ untranslated region (3′ UTR) of an expressed messenger ribonucleic acid (mRNA), resulting in either modulation of translational efficiency or degradation of the mRNA (8, 9). MiRNAs are known to regulate important cellular functions such as differentiation, proliferation, signal transduction, apoptosis, inflammation, and autophagy (10–12). In addition, microRNAs have been shown to regulate the expression of the intestinal ion and nutrient transporters such as DRA (13), cystic fibrosis transmembrane conductance regulator (CFTR; 14), PepT-1 (15), monocarboxylate transporter (MCT-1; 16), and putative anion transporter-1 (PAT1; 17). Furthermore, role of microRNAs in the pathogenesis of neurological, cardiovascular, autoimmune diseases, cancer, and inflammatory bowel diseases (IBD) has been implicated (18). Identification of altered expression of miRNA patterns in IBD, and their ability to regulate gene expression, has led to studies investigating the link between these miRNAs and the genes present in the IBD loci. In this regard, GWAS (genome-wide association studies) showed a strong link between NHE-3 gene locus and ulcerative colitis (UC; 19) and the results from mucosal biopsies of patients with UC and/or Crohn’s disease (CD) obtained from ileum and sigmoidal colon showed marked decrease in NHE-3 expression (6). Therefore, it is important to better understand the mechanisms underlying regulation of NHE-3 expression by miRNAs.
In the current study, we show for the first time, that miR-326 and miR-330-5p regulate NHE-3 expression in intestinal epithelial cells via translational repression. Inhibition of miRNAs that target NHE-3, may thus, serve as potential therapeutic targets in the treatment of IBD-associated diarrhea where NHE-3 expression and function are attenuated.
MATERIALS AND METHODS
Materials
Human intestinal cell lines Caco-2 and HT-29 were obtained from American Type Culture Collection (ATCC, Manassas, VA). SK-CO15 cells were a kind gift from Dr. Jun Sun, University of Illinois at Chicago. All the microRNA mimics used in the studies were obtained from Sigma (St. Louis, MO). Anti-rabbit polyclonal NHE-3 antibody was obtained from Alpha Diagnostic (San Antonio, TX) and glyceraldehyde 3-phosphate dehydrogenase (GAPDH) antibody from Sigma. Goat anti-mouse and goat anti-rabbit antibodies conjugated to horseradish peroxidase were obtained from Santa Cruz Biotechnology (Santa Cruz, CA). All restriction endonucleases and other modifying enzymes were obtained from New England Biolabs (Beverly, MA). pmirGLO dual Luciferase miRNA target expression vector and dual Luciferase assay system were obtained from Promega (Madison, WI). Lipofectamine RNAiMax transfection reagent was obtained from Invitrogen (Life Technologies, Carlsbad, CA). All other chemicals were of at least reagent grade and were obtained from either Sigma Chemical (St. Louis, MO) or Fisher Scientific (Pittsburgh, PA).
Cell culture.
Caco-2, HT-29, and SK-CO15 cells were cultured in Eagle’s minimum essential media (EMEM), McCoy’s 5a medium modified, and Dulbecco’s modified Eagle’s medium (DMEM; high glucose), respectively. The culture medium for all cell types was supplemented with 10% fetal bovine serum, 100 IU/mL penicillin, 100 μg/mL streptomycin, and 50 µg/mL gentamicin. The cells were maintained at 37°C in a 5% CO2, 95% air environment in T-75 (75 cm2) plastic flasks. The cells between passage 25 and 45 were utilized for the present study.
Cloning of 3′UTR-NHE-3.
A 160 bp fragment of the NHE-3 mRNA-3′UTR was custom synthesized (GenScript, Piscataway, NJ). Synthesized DNA fragments were verified for their sequences and then ligated in vector pmirGLO (Promega, Madison, WI). NheI-XhoI restriction enzymes were used for digesting the vector. The sequence of the product was verified by sequencing using the sequencing primers: M13F CGCCAGGGTTTTCCCAGTCACGAC, T7terTGCTAGTTATTGCTCAGCGG.
In silico analysis.
We used two algorithms 1) TargetScan (http://www.targetscan.org/; 20), and 2) miRDB (http://mirdb.org/miRDB/; 21), to predict the potential miRNAs that bind to NHE-3 3′UTR and selected two microRNAs from each algorithm according to their high context score and top rank (Fig. 1, A and B). We selected three microRNAs. In addition, miR-204 was selected based on the criteria that was shown to regulate NHE-3 recently (22) and proceeded with four microRNAs for the experiments.
Figure 1.
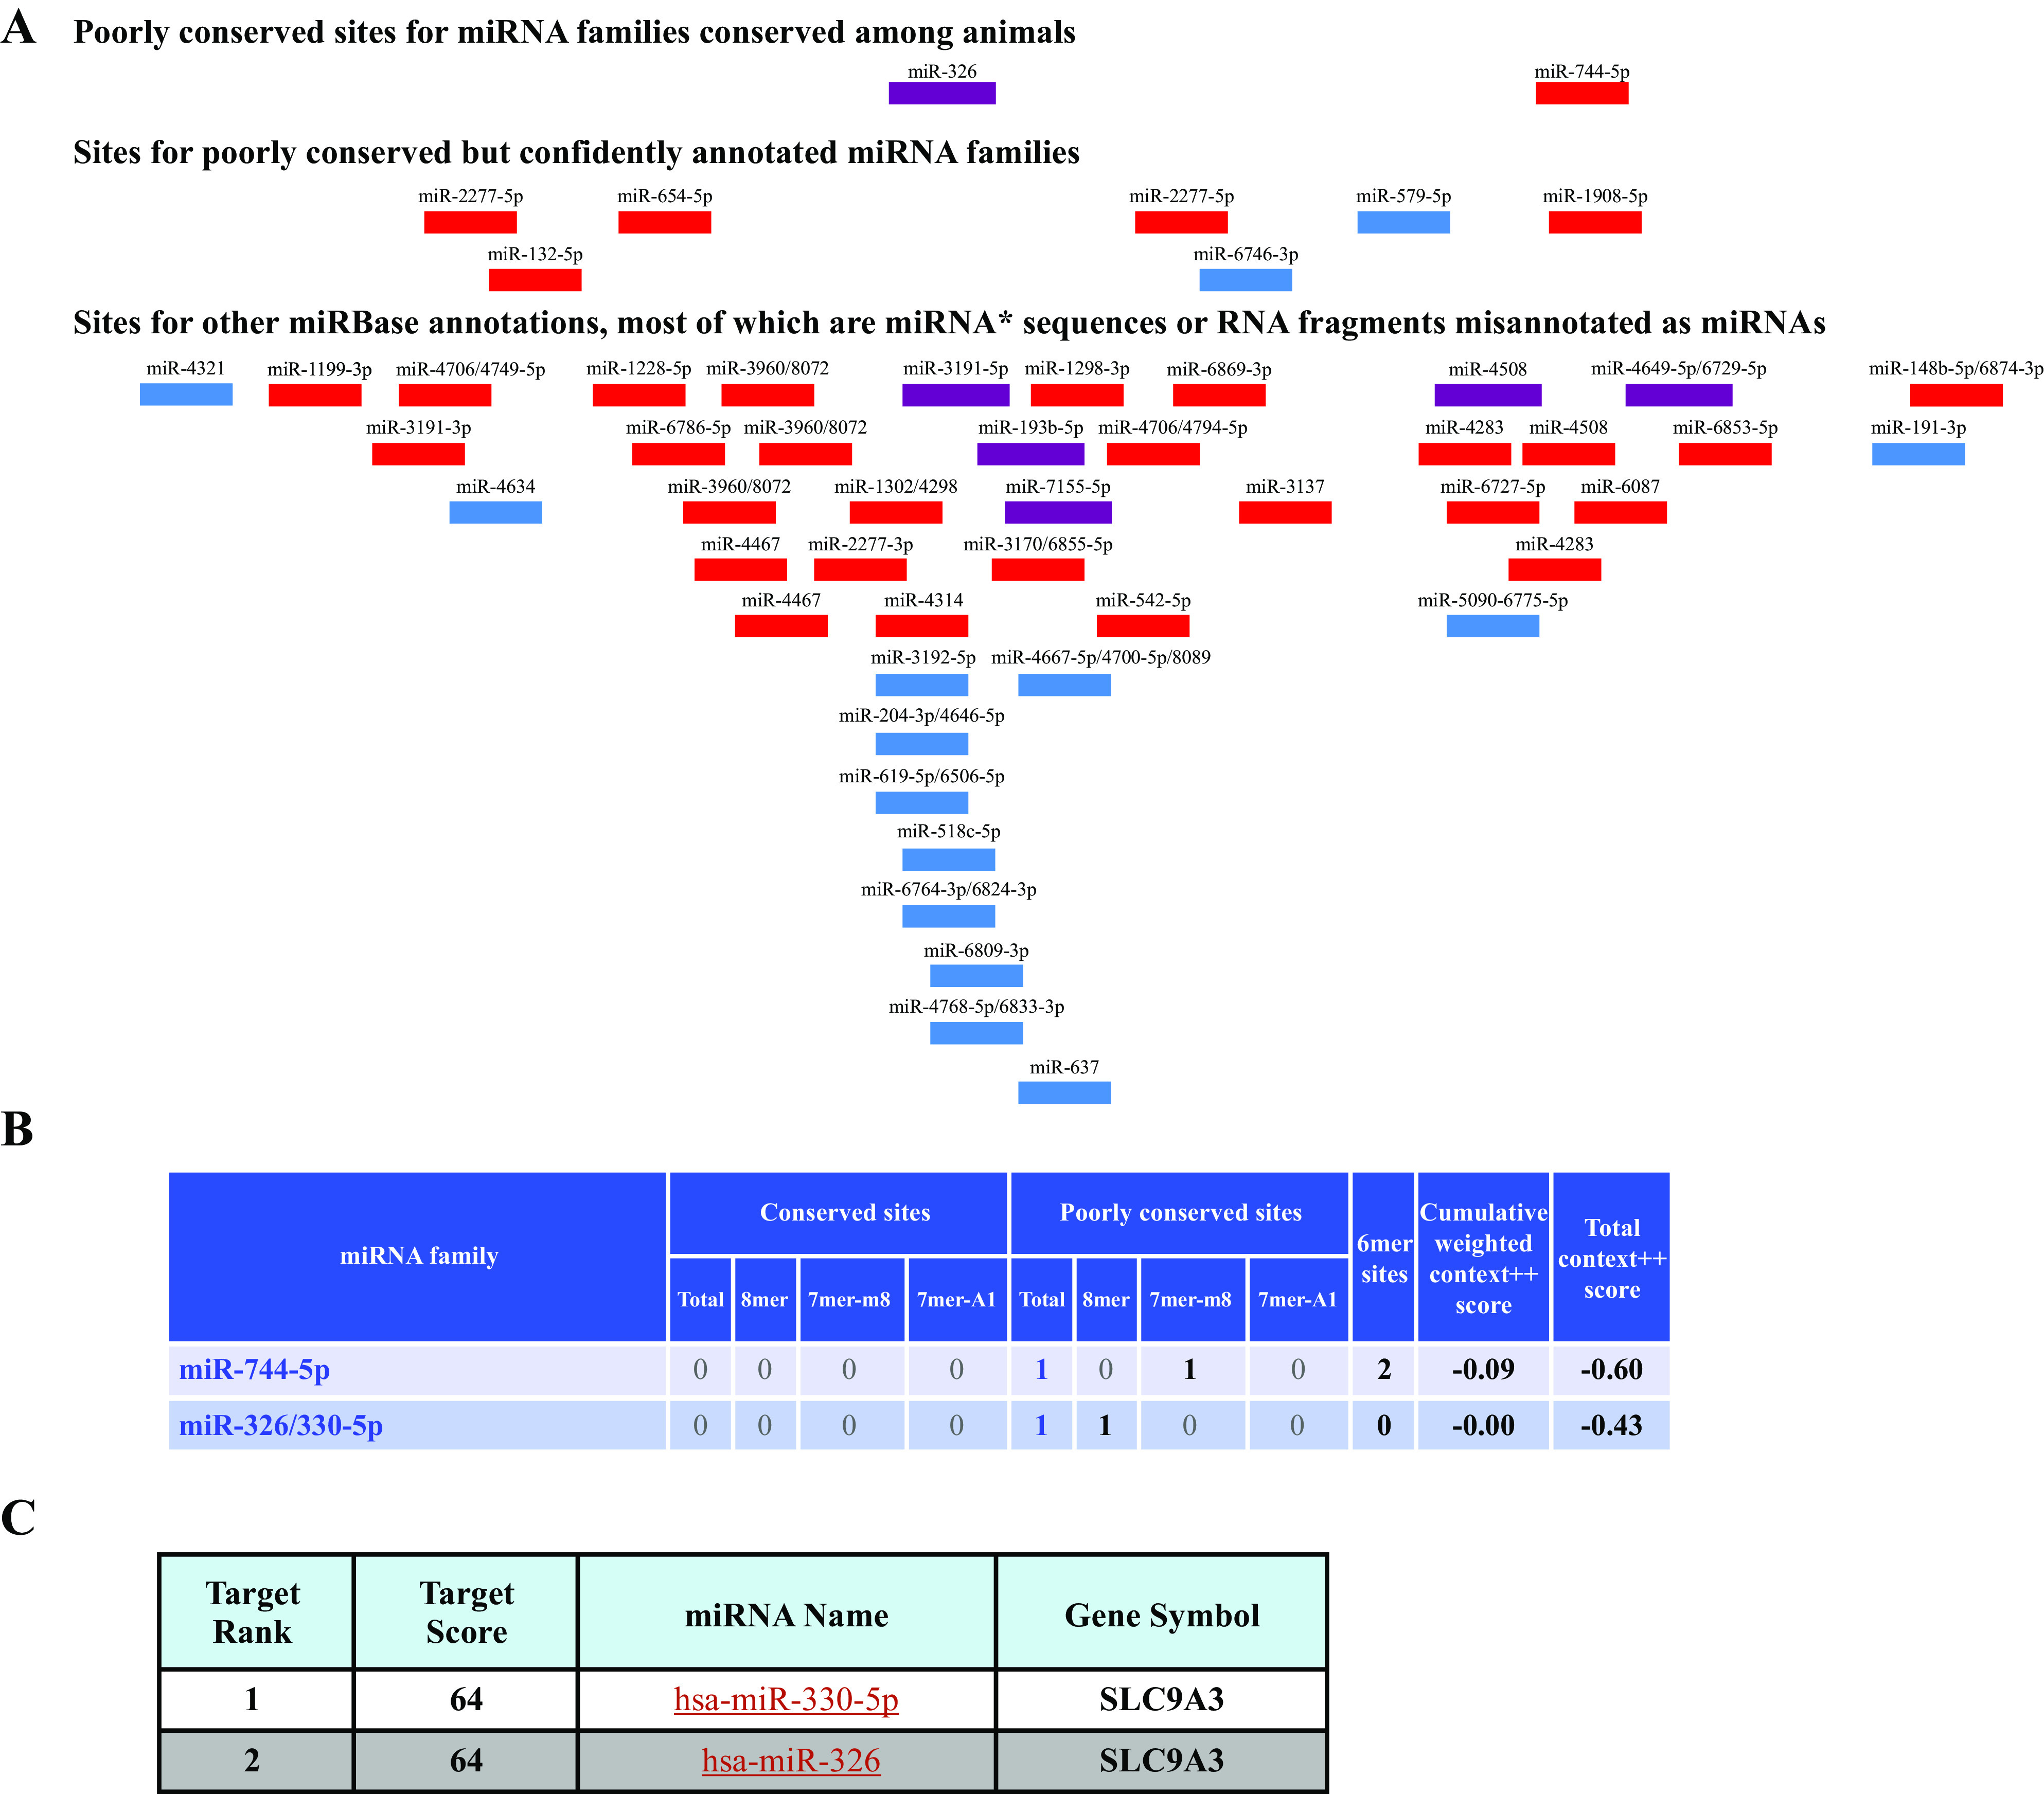
In silico analysis: list of microRNAs that potentially target 3′UTR of NHE-3 (A) microRNAs with context score more than −0.4; source http://www.targetscan.org Release 7.0 (20; B) microRNAs with target score above 60; source miRDB (http://mirdb.org/miRDB/) (21; C). Top two microRNAs from both the algorithms selected for experimental purpose. NHE-3, sodium hydrogen exchanger-3; 3′UTR, 3′ untranslated region.
Transient transfection and 3′UTR activity.
Caco2, HT-29, and SK-CO15 cells were transiently transfected with 1.5 µg of pmirGLO-3′UTR-NHE-3 alone or in combination with 20 nM of different microRNA mimics/negative control miRNA (Sigma, St. Louis, MO) as previously described (13). Briefly, trypsinized cell suspension in complete growth medium without antibiotic was transfected using 100 µL optiMEM, 2 µL of RNAiMax reagent, and 20 nM of mimic/negative control prepared according to the manufacturer’s instructions were plated into 24-well plates. We utilized Lipofectamine RNAiMax (Invitrogen Life Technologies, Carlsbad, CA). Forty-eight hours after transfection, cells were harvested and lysed in a passive lysis buffer (Promega). The luciferase activity was determined using the Dual Luciferase Assay Kit (Promega) and a GLOMAX 20/20 Luminometer (Promega) equipped with double injectors. Relative luciferase activity was calculated as a ratio of firefly luciferase to renilla luciferase and is expressed as % of control.
RNA extraction and real-time PCR.
To quantitate the NHE-3 mRNA, total RNA from SK-CO15 cells was extracted with Qiazol using miRNeasy mini kit (Qiagen, Frederick, MD) as previously described (13). Briefly, extracted RNA was amplified by Brilliant SYBR Green qRT-PCR Master Mix kit (Agilent Technologies, Santa Clara; CA) utilizing gene specific primers for NHE-3 and GAPDH (glyceraldehyde 3-phosphate dehydrogenase; Table 1). The relative mRNA levels of NHE-3 were obtained by normalizing with GAPDH as the internal control gene.
Table 1.
Primers used in the study
| Primers used for cloning 3´UTR-NHE-3 in pmirGLO vector: |
| Forward: 5′-ACTGCTAGCCACCGGCTCCGACACGCCGCTAAC-3′ |
| Reverse: 5′-ACTCTCGAGGGAGTTCTGCGCAGGCGCTGGCGT-3′ |
| Real time PCR primers: |
| NHE-3: |
| Forward: 5′-ACCTGTTCGTCAGCACCAC-3′. |
| Reverse: 5′-GCTCGCTCCTCTTCACCTT-3′ |
| GAPDH: |
| Forward: 5′-GAAATCCCATCACCATCTTCC-3′. |
| Reverse: 5′-AAATGAGCCCCAGCCTTCT-3′ |
| Forward primers used for quantifying microRNA expression: |
| hsa-miR-204: 5′-TTCCCTTTGTCATCCTATGCCT-3′ |
| hsa-miR-326: 5′-CCTCTGGGCCCTTCCTCCAG-3′ |
| hsa-miR-330-5P: 5′-TCTCTGGGCCTGTGTCTTAGGC-3′ |
| hsa-miR-744-5p: 5′-TGCGGGGCTAGGGCTAACAGCA-3′ |
| U6B: 5′-CGCAAGGATGACACGCAAATTCG-3′ |
| A common universal reverse primer provided in the kit was used |
NHE-3, sodium hydrogen exchanger-3; 3′UTR, 3′ untranslated region.
Quantification of mature miR expression.
Mature miRNA expression was quantified as described previously (13). Briefly, 1 µg of total RNA was reverse transcribed to produce cDNA using the NCode miRNA first-strand cDNA synthesis kit (Invitrogen). Specific microRNA forward primers for miR-204, miR-326, miR-330-5p, miR-744-5p, and small RNA U6 (used as housekeeping gene) were obtained from (Eurofins MWG Operon, Huntsville, AL) the primer sequences were listed in Table 1 and the universal reverse primer was provided in the same synthesis kit. Real-time PCR amplification and data capture were performed using the Stratagene Mx3005P (Agilent Technologies, Santa Clara, CA).
Western blotting.
Lysates were prepared from mimic transfected SK-CO15 cells using cell lysis buffer (Cell Signaling, Danvers, MA) as previously described (13). Briefly, 75–100 µg of cell lysates was loaded on 7.5% SDS-polyacrylamide gels and transblotted to nitrocellulose membranes to examine the protein levels of NHE-3 and GAPDH (loading control). Membranes were then blocked for 1 h using 5% nonfat dry milk and were then incubated with anti-rabbit polyclonal antibodies against NHE-3 (Alpha Diagnostic, San Antonio, TX, Cat. No. NHE31-A; 1:100) or GAPDH (Sigma-Aldrich, St Louis, MO, Cat. No. G9545; 1:3,000 dilution) antibodies. The membranes were washed four times with the wash buffer containing 1× PBS and 0.1% Tween-20 for 5 min. Later, the membranes were probed with horseradish peroxidase (HRP)-conjugated goat anti-rabbit IgG antibody (Promega, Madison, WI, Cat. No. W4018; 1:2,000 dilution) for 1 h, and the bands were visualized using enhanced chemiluminescence detection reagents (Biorad, Hercules, CA). Relative band intensities of total protein normalized to GAPDH were measured utilizing ImageJ software.
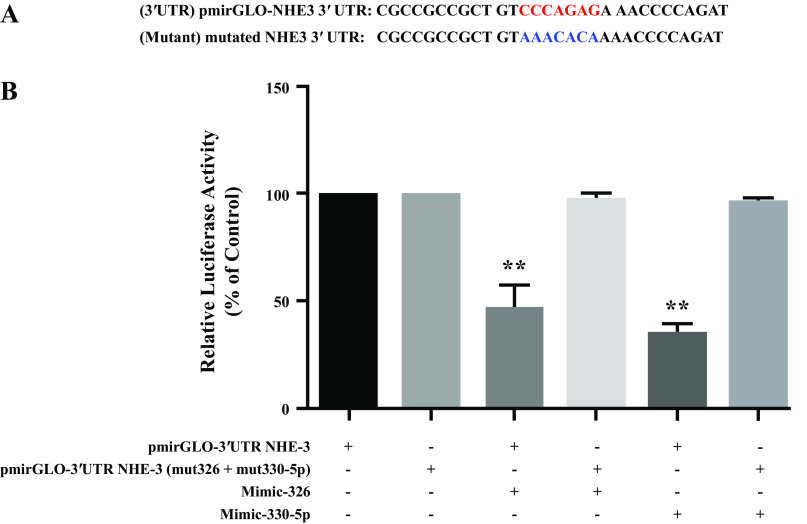
miR-326 and miR-330-5p binding region mutated 3′UTR-NHE-3 constructs.
NHE-3 3′UTR with mutations in the miR-326 and 330-5p binding seed sequence was custom synthesized by GenScript. The mutated sequence is shown in Fig. 6A. The primer sets used for site-directed mutagenesis are listed in Table 1. Desired mutations were confirmed by sequencing.
Figure 6.
Mutation of miR-326 and miR-330-5p binding regions in 3′UTR-of NHE-3 and their transfection in SK-CO15 cells nullifies the effect of respective mimic transfection on relative luciferase activity. MiR-326 and -330-5p binding regions in 3′UTR of NHE-3 is denoted in red color and respective mutated sequence in blue color (A) SK-CO15 cells were cotransfected with miR-326 and -330-5p mimics and pmirGLO-NHE-3 or pmirGLO-NHE-3 mut326 or pmirGLO-NHE-3 mut330-5p (B). Firefly luciferase activities were measured and normalized with respective renilla luciferase activities. Results are means ± SE of four independent experiments. **Significant difference between pmirGLO-3′UTR-NHE-3 with negative control vs. pmirGLO-3′UTR-NHE-3 + mimic-326 and pmirGLO-3′UTR-NHE-3 + mimic-330-5p (P < 0.01).
Statistical analyses.
Results are expressed as means ± SE and represent the data from 3 to 6 independent experiments. All data were analyzed by Prism (Prism Graph Pad Software). One-way ANOVA with Tukey’s multiple comparison test and unpaired t test was used for statistical analysis. P < 0.05 was considered as statistically significant.
RESULTS
Mapping of microRNAs That Target 3′ UTR of NHE-3
We utilized Targetscan algorithm to predict the potential microRNA candidates that can target 3′ UTR of NHE-3 Fig. 1A. Target scan predicted the potential microRNAs that bind to 3′ UTR of NHE-3, and we selected the top two microRNA candidates that possessed the highest context score, miR-744-5p (−0.60) and miR-326 (−0.43) Fig. 1B. We then used miRDB a recognized prediction tool, to select other two candidates with top two ranks, miR-330-5p (target score-64) and miR-326 (target score-64) Fig. 1C. During the course of these studies, we came across a study where miR-204 was shown to regulate NHE-3 expression (22), therefore we also included miR-204 in some of our experiments along with the aforementioned microRNAs.
Transient Transfection of 3′UTR of NHE-3 in Intestinal Epithelial Cells Decreased Luciferase Reporter Activity
3′ UTR of NHE-3 (160 bp) was cloned into the pmirGLO dual luciferase vector to obtain pmirGLO-3′UTR NHE-3. Caco-2, HT-29, and SK-CO15 cells were transiently transfected with pmirGLO-empty vector and pmirGLO-3′UTR NHE-3. Cells were harvested 48 h posttransfection and relative luciferase activity was measured. A significant decrease in relative luciferase activities in Caco-2 (40%), HT-29 (19%), and SK-CO15 (25%; Fig. 2) cells, clearly indicated that pmirGLO-3′UTR NHE-3 could possibly harbor binding sites for potential regulators of gene expression. As microRNAs and RNA binding proteins are the possible regulators that can interact with the 3′ UTR of NHE-3, we next investigated the possible microRNA candidates that can modulate NHE-3 expression.
Figure 2.

3′UTR of NHE-3 transfection decreased relative luciferase activity Caco-2 (A), HT-29 (B) and SK-CO15 cells (C). Results obtained after 48 h transient transfection shown as normalized luciferase activity in response to pmirGLO -3′UTR-NHE-3 compared with pmirGLO empty vector transfection. All the results are means ± SE of 3–6 independent experiments *P < 0.05, **P < 0.001, ***P < 0.0001, vs. pmiRGLO. NHE-3, sodium hydrogen exchanger-3; 3′UTR, 3′ untranslated region.
miRNAs 326 and 330-5p Target 3′UTR of NHE-3
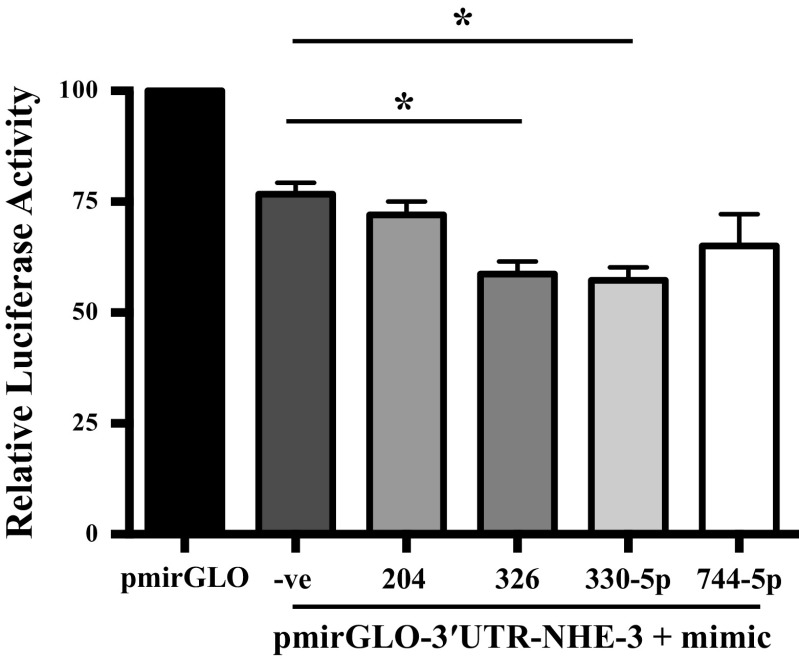
Utilizing in silico algorithm, we selected top three microRNA candidates that potentially target 3′UTR of NHE-3 (miR-326, miR-330-5p, and miR-744-5p). In addition, we took miR-204 which was shown to regulate NHE-3 expression in another study (22). Interestingly, the results obtained from the cotransfection of mimics of these microRNAs along with the 3′UTR of NHE-3 revealed that only miR-326 (23.5%) and miR-330-5p (25.2%) significantly decreased the relative luciferase activity compared with pmirGLO-3′UTR-NHE-3 with negative control for mimic (Fig. 3). These data indicate that miRNAs 326 and 330-5p directly bind to 3′UTR of NHE-3 and can possibly regulate NHE-3 gene expression.
Figure 3.
Cotransfection of microRNA mimics that targets NHE-3 3′UTR decreased luciferase reporter activity. Cotransfection of Caco-2 cells with microRNA mimics that target NHE-3 3′UTR or negative control along with pmirGLO-3′UTR-NHE-3 or pmirGLO. Forty-eight hours after cotransfection relative luciferase activities were measured as a ratio of fire fly luciferase to renilla luciferase activities. All the results are means ± SE of 3–5 independent experiments *P < 0.05 vs. pmiRGLO-3′UTR-NHE-3 + mimic −ve (negative control). NHE-3, sodium hydrogen exchanger-3; 3′UTR, 3′ untranslated region.
miR-326 and miR-330-5p Do Not Modulate NHE-3 mRNA Levels
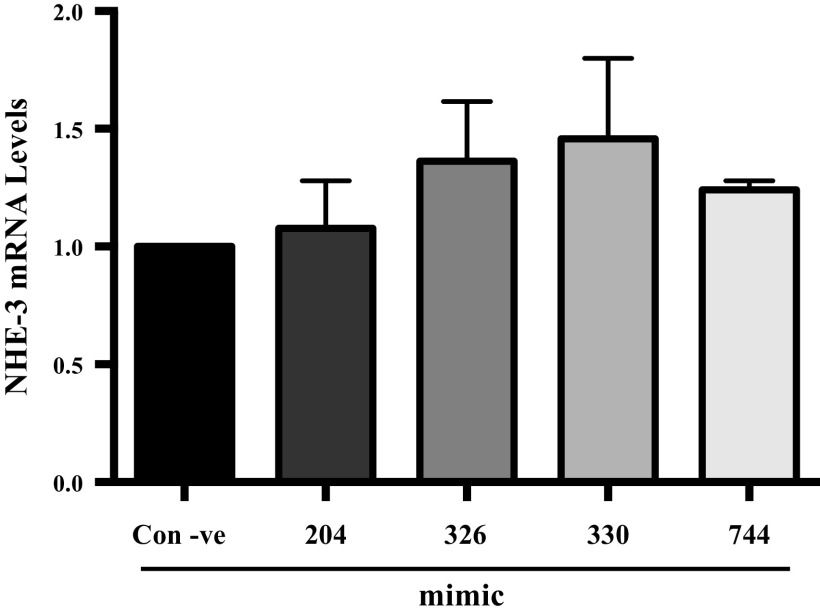
microRNAs are known to regulate gene expression of the target protein by either mRNA degradation or by translational repression (8, 9). To examine if miR-326 and miR-330-5p regulate the NHE-3 expression by modulating the mRNA levels, SK-CO15 cells were transfected with mimics of miR-326 and miR-330-5p or a negative control (containing a nontargeting sequence). RT-PCR data revealed that miR-326 and miR-330-5p transfection had no effect on NHE-3 mRNA levels (Fig. 4). Parallel to the results obtained for relative luciferase activity, miR-204 and miR744 had no effect on NHE-3 mRNA levels. These results demonstrate that: 1) binding between these microRNAs and 3′UTR of NHE-3 does not exhibit perfect complementarity; and 2) the phenomena of mRNA degradation is not involved in miRNA-mediated regulation of NHE-3.
Figure 4.
Transient transfection of mimics that target 3′UTR of NHE-3 did not alter mRNA expression in SK-CO15 Cells. RNA was extracted from SK-CO15 cells 48 h after transfection with microRNAs mimics that target 3′UTR of NHE-3. NHE-3 mRNA levels were measured by quantitative real-time PCR and were normalized against GAPDH mRNA levels. Results are means ± SE of four independent experiments. GAPDH, glyceraldehyde 3-phosphate dehydrogenase; NHE-3, sodium hydrogen exchanger-3; 3′UTR, 3′ untranslated region.
miR-326 and miR-330-5p Inhibit NHE-3 Protein Expression in SK-CO15 Cells
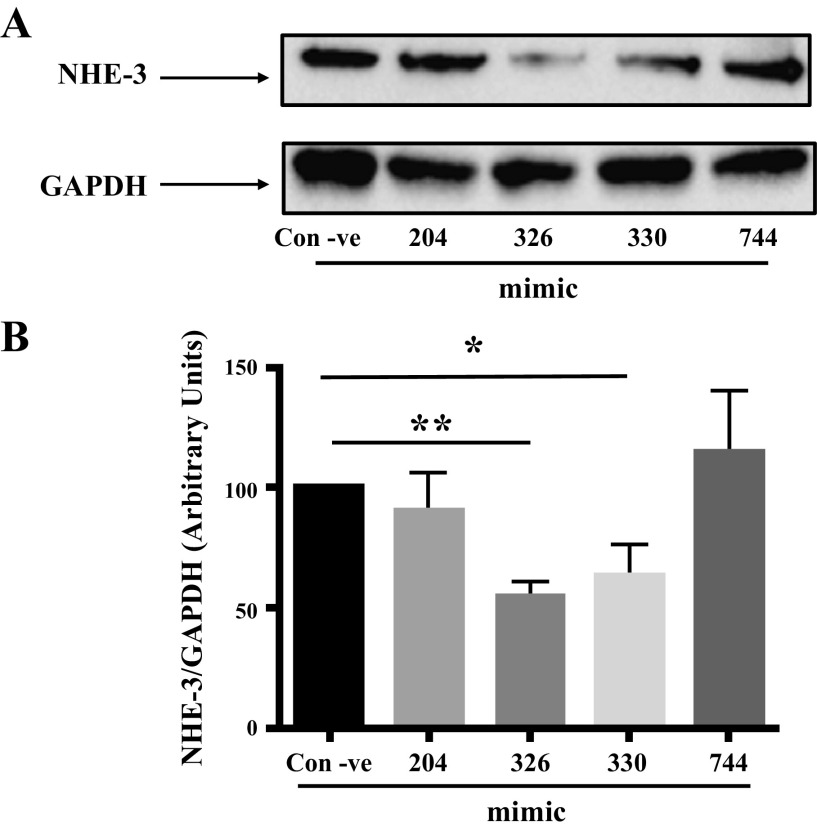
To examine if miR-326 and miR-330-5p regulate NHE-3 expression at the protein level, protein lysates obtained from mimic transfected SK-CO15 cells were subjected to Western blot analysis. As shown in Fig. 5A, miR-326 and miR-330-5p significantly decreased NHE-3 protein expression, whereas miR-204 and miR-744 had no effect. Densitometric analysis (Fig. 5B), revealed 44% decrease in NHE-3 protein level by miR-326 and 36% decrease by miR-330-5p compared with negative control. These results clearly indicate that miR-326 and miR-330-5p regulate the NHE-3 expression through translational repression.
Figure 5.
Protein expression of NHE-3 was decreased by mimic-326 and mimic-330-5p transfection in SK-CO15 cells. A: Western blot analysis showing blot probed with anti-NHE-3 or anti-GAPDH antibody from 48 h mimic transfected lysates. B: densitometric analysis of the relative band intensities NHE-3/GAPDH using imageJ. Results represent means ± SE of four independent experiments. **Significant differences between control negative vs. mimic-326 (P < 0.001) and * vs. mimc-330-5p transfected groups (P < 0.05). GAPDH, glyceraldehyde 3-phosphate dehydrogenase; NHE-3, sodium hydrogen exchanger-3; 3′UTR, 3′ untranslated region.
Mutating the Binding Region of miR-326 and miR-330-5p in NHE-3 3′UTR Abolished the Effects of microRNA Mimics-326 and -330-5p
To verify that miR-326 and miR-330-5p regulate NHE-3 expression by binding to the 3′UTR of NHE-3, we mutated the binding region of miR-326 and miR-330-5p in the 3′ UTR of NHE-3 shown in Fig. 6A in blue (red denotes the normal binding sequence). SK-CO15 cells were cotransfected with microRNA mimic-326 and -mimic-330-5p with either 3′UTR NHE-3 or mutated 3′UTR NHE-3. Cells were harvested after 48 h, and relative luciferase activity was measured. As expected, mutating the binding regions of miR-326 and miR-330-5p in 3′UTR of NHE-3 blocked the mimic-326 and mimic-330-5p mediated decrease in luciferase activity. Whereas, the cotransfection of mimic-326 and mimic-330-p with unmutated 3′UTR of NHE-3 showed a significant decrease in the relative luciferase activity Fig. 6B.
DISCUSSION
Dysregulation of NHE-3, the predominant isoform involved in Na+ absorption in the intestine, has been implicated in the pathophysiology of diarrhea associated with gut inflammation. However, very little is known about the molecular mechanisms involved in the downregulation of NHE-3 in diarrhea associated with intestinal inflammation. In this regard, our current study focused on the role of miRNAs, known to play a crucial role in the pathogenesis of IBD, in regulating NHE-3 expression.
To the best of our knowledge, this is the first study demonstrating the regulation of NHE-3 expression by miRNAs via translational repression. Our results show that 1) 3′UTR of NHE-3 harbors potential binding regions for several top scoring (context score/target score) microRNAs, particularly miR-744-5p, miR-326, and miR-330-5p as predicted by the in silico analysis; 2) reporter luciferase activity was significantly decreased in cells transiently transfected with NHE-3 3′UTR construct compared with empty vector; 3) overexpression of the miRs-326 and -330-5p, further decreased NHE-3 3′UTR activity and protein expression without altering the NHE-3 mRNA levels; and 4) mutating in the miRNA binding region of NHE-3-3′UTR abrogated the suppressive effects of miR-326 and miR-330-5p on NHE-3 protein expression.
MiRNA candidates -326, -330-5p, and 774-5p were chosen based on our in silico analysis using miRNA target prediction algorithms: miRDB and Targetscan. The Targetscan algorithm relies not only on the complementarity of pairing for miRNA-mRNA interactions but also provides with a “context score,” which is a sum of 14 additional parameters (such as stability of seed pairing, 3′-UTR length of the target mRNA, conservation in orthologous UTRs, target site abundance, free energy calculation, etc.; 23, 24). On the other hand, miRDB is an online database for prediction of functional miRNA targets including 3.5 million predicted targets regulated by 7,000 miRNAs in five species (25). It is important to note that both miRNAs 326 and -330-5p were predicted to 1) have 8mer seed match in NHE-3-3′-UTR [defined as an identical match to positions 2–8 (the seed + position 8) of the mature miRNA followed by an adenosine residue], and 2) a target score of 64 by miRDB algorithm. These parameters are suggestive of higher probability of in vivo functionality of miRNAs 326 and -330-5p in regulating the expression of NHE-3. We also included miR-204 in our experiments based on a published abstract (22) that reported an increase in miR-204 levels in response to aldosterone treatment, which negatively regulated NHE-3 mRNA levels and protein expression. However, it is important to note that neither Target scan nor miRDB predicted miR204 as a top miRNA candidate targeting NHE-3 in our studies. Further, transfection of miR-204 mimic did not alter NHE-3 protein expression in SKCO15 cells (Fig. 5, A and B).
In this study, the potential role of the 3′UTR in posttranscriptional regulation of NHE-3 gene expression was investigated in different intestinal cell lines (Caco2, SKCO15, or colonic HT29 cells) to rule out cell specificity of this effect. Interestingly, firefly luciferase activity normalized to Renilla luciferase activity decreased significantly in all the three-cell lines transiently transfected with 3′UTR-pmirGLO compared with pmirGLO empty vector-transfected cells (Fig. 2). This result not only indicated the functional importance of 3′UTR in regulating NHE-3 gene expression but also attested that inhibitory effect of 3′UTR are not cell type specific. However, the effect of miRNA mimics on NHE-3 mRNA and protein was only examined in SK-CO15 cells that have been shown to have very high endogenous NHE-3 expression as compared with Caco-2 cells (26).
Cotransfection with mimics-326 and 330-5p but not mimic-744 and -204 resulted in a further decrease in relative luciferase activity of NHE-3-3′UTR. These data confirmed that NHE-3 is a direct novel target of both miRs-326 and -330-5p. The binding of the miRs to the 3′UTR of their mRNA targets leads to either degradation of the transcript or inhibition of translation. Interestingly, miRs-326 and -330-5p overexpression resulted in attenuation of NHE-3 protein expression with no change in its mRNA levels, suggesting that both miRs-326 and -330-5p decrease NHE-3 expression by inhibiting translation of the mRNA rather than via effects on mRNA stability. It is important to note that the mode of action of miRNA is governed by nature of the promoter (9) or by the nature of the RNA-induced silencing complex (RISC), the functional protein complex involved in association between the miRNA and its target (27). During miRNA-mediated translational repression, the base pairing between the mRNA 3′-UTR and the target miRNA generates a translational inhibitory signal. As a result, translation initiation complex protein is inhibited, and the ribosomes run off from the mRNA translational machinery producing ribosome-free mRNA that undergoes storage (28). We anticipate the involvement of a similar phenomenon in miRs-326 and -330-5p mediated decrease in NHE-3 protein levels. Further, the inhibitory effect of miRs-326 and -330-5p on relative luciferase activity in the presence of NHE-3 3′UTR harboring mutations in the respective binding sites was completely abrogated (Fig. 6). These data validated the specificity and direct binding to miRs-326 and -330-5p and NHE-3-3′-UTR and established that these miRNAs are able to repress translation of NHE-3 mRNA.
In recent years, functional studies have confirmed miRNA dysregulation as a potential causative factor in a number of pathologies such as cardiovascular diseases, diabetes, cancer, and IBD. As a result, miRNA mimics and molecules targeted at miRNAs (antimiRs) have shown promise in preclinical therapeutic modality development. Interestingly, miR-326 is known to have a potential role in cell proliferation, tumor invasion, metastasis, and signaling pathways involved in various cancers (29). Of note, the expression levels of miR-326 have been shown to be upregulated in the colonic tissue of interleukin-10 (IL-10)−/− mice (30) suggestive of a potential increase of this miRNA under inflammatory conditions. Whereas miR-330-5p has been shown to act as an antimetastatic miRNA in CRC by regulating integrin α5 (ITGA5), where downregulation of ITGA5 leads to peritoneal dissemination of ovarian cancer cells and upregulation of ITGA5 promoted adhesion, invasion, and epithelial-mesenchymal transition of CRC (colorectal cancer) cells (31). Furthermore, miR-330-5p is also known to negatively regulate matrix metalloproteinase 1 (MMP1) and MMP7, which are known prognostic markers in esophageal cancer (32). Interestingly, both miR326-3p and miR330-5p, while expressed on different chromosomes (miR-326 on chromosome 19 and miR-330-5p on chromosome 11) belong to miR326 gene cluster and share more than 98% similarity in their gene targets (other transporter genes targeted as predicted by miRDB algorithm: SLC19A2, SLC22A12, SLC23A2, SLC24A3, SLC25A23 SLC25A34 SLC26A9 SLC27A4, SLC28A1, SLC2A1, SLC2A4, SLC35F1, SLC35F6, SLC38A2, SLC19A2, SLC22A12, SLC23A2, SLC24A3, SLC39A3, SLC5A3, SLC6A6, SLC7A14). However, to date, there have been no prior mechanistic studies investigating the role of miRNAs in regulating the intestinal expression of NHE-3.
In conclusion, we demonstrate that miRs-326 and -330-5p regulate NHE-3 protein expression by targeting the 3′-UTR of NHE-3 mRNA and inhibiting its translation process. Our study not only reveals a novel mechanism underlying the regulation of NHE-3 expression in the intestinal epithelial cells but also emphasizes that miRNA-based therapies may be of benefit for the management of diseases where NHE-3 expression is compromised.
GRANTS
These studies were supported by the Department of Veterans Affairs, Veterans Health Administration, Office of Research and Development, Biomedical Laboratory Research and Development: Merit Review Award: BX002011 (to P.K.D.), BX002867 (to S.S.), BX000152 (to W.A.A.), VA CDA2 Award BX004719 (to A.K.) and VA Senior Research Career Scientist Award: 1IK6BX005242 (to P.K.D.) and Research Career Scientist award BX005243 (to W.A.A.). The studies were also supported by NIH/NIDDK Grants, R01 DK54016 and DK92441 (to P.K.D.), and partially by R01 DK98170 (to R.K.G.) and R01 DK109709 (to W.A.A.).
DISCLOSURES
No conflicts of interest, financial or otherwise, are declared by the authors.
AUTHOR CONTRIBUTIONS
A.N.A. conceived and designed research; A.N.A., S.P., A.K., and D.J. performed experiments; A.N.A., S.P., A.K., and D.J. analyzed data; A.N.A., A.B., R.K.G., W.A.A., and S.S. interpreted results of experiments; A.N.A. prepared figures; A.N.A. drafted manuscript; A.N.A., R.K.G., W.A.A., P.K.D., and S.S. edited and revised manuscript; A.N.A. and P.K.D. approved final version of manuscript.
ACKNOWLEDGMENTS
This article is part of the special collection “Non-Coding RNAs in Cell Physiology.” Dr. Shizuka Uchida, PhD, served as Guest Editor of this collection.
REFERENCES
- 1. Zachos NC, Kovbasnjuk O, Donowitz M. Regulation of intestinal electroneutral sodium absorption and the brush border Na+/H+ exchanger by intracellular calcium. Ann N Y Acad Sci 1165: 240–248, 2009. doi: 10.1111/j.1749-6632.2009.04055.x. [DOI] [PMC free article] [PubMed] [Google Scholar]
- 2. Janecke AR, Heinz-Erian P, Yin J, Petersen BS, Franke A, Lechner S, Fuchs I, Melancon S, Uhlig HH, Travis S, Marinier E, Perisic V, Ristic N, Gerner P, Booth IW, Wedenoja S, Baumgartner N, Vodopiutz J, Frechette-Duval MC, De Lafollie J, Persad R, Warner N, Tse CM, Sud K, Zachos NC, Sarker R, Zhu X, Muise AM, Zimmer KP, Witt H, Zoller H, Donowitz M, Müller T. Reduced sodium/proton exchanger NHE3 activity causes congenital sodium diarrhea. Hum Mol Genet 24: 6614–6623, 2015. doi: 10.1093/hmg/ddv367. [DOI] [PMC free article] [PubMed] [Google Scholar]
- 3. Schultheis PJ, Clarke LL, Meneton P, Harline M, Boivin GP, Stemmermann G, Duffy JJ, Doetschman T, Miller ML, Shull GE. Targeted disruption of the murine Na+/H+ exchanger isoform 2 gene causes reduced viability of gastric parietal cells and loss of net acid secretion. J Clin Invest 101: 1243–1253, 1998. doi: 10.1172/JCI1249. [DOI] [PMC free article] [PubMed] [Google Scholar]
- 4. Laubitz D, Larmonier CB, Bai A, Midura-Kiela MT, Lipko MA, Thurston RD, Kiela PR, Ghishan FK. Colonic gene expression profile in NHE3-deficient mice: evidence for spontaneous distal colitis. Am J Physiol Gastrointest Liver Physiol 295: G63–G77, 2008. doi: 10.1152/ajpgi.90207.2008. [DOI] [PMC free article] [PubMed] [Google Scholar]
- 5. Kiela PR, Laubitz D, Larmonier CB, Midura-Kiela MT, Lipko MA, Janikashvili N, Bai A, Thurston R, Ghishan FK. Changes in mucosal homeostasis predispose NHE3 knockout mice to increased susceptibility to DSS-induced epithelial injury. Gastroenterology 137: 965–975.e1, 2009. doi: 10.1053/j.gastro.2009.05.043. [DOI] [PMC free article] [PubMed] [Google Scholar]
- 6. Sullivan S, Alex P, Dassopoulos T, Zachos NC, Iacobuzio-Donahue C, Donowitz M, Brant SR, Cuffari C, Harris ML, Datta LW, Conklin L, Chen Y, Li X. Downregulation of sodium transporters and NHERF proteins in IBD patients and mouse colitis models: potential contributors to IBD-associated diarrhea. Inflamm Bowel Dis 15: 261–274, 2009. doi: 10.1002/ibd.20743. [DOI] [PMC free article] [PubMed] [Google Scholar]
- 7. Malakooti J, Saksena S, Gill RK, Dudeja PK. Transcriptional regulation of the intestinal luminal Na+ and Cl− transporters. Biochem J 435: 313–325, 2011. doi: 10.1042/BJ20102062. [DOI] [PMC free article] [PubMed] [Google Scholar]
- 8. Doench JG, Sharp PA. Specificity of microRNA target selection in translational repression. Genes Dev 18: 504–511, 2004. doi: 10.1101/gad.1184404. [DOI] [PMC free article] [PubMed] [Google Scholar]
- 9. Kong YW, Cannell IG, de Moor CH, Hill K, Garside PG, Hamilton TL, Meijer HA, Dobbyn HC, Stoneley M, Spriggs KA, Willis AE, Bushell M. The mechanism of micro-RNA-mediated translation repression is determined by the promoter of the target gene. Proc Natl Acad Sci USA 105: 8866–8871, 2008. doi: 10.1073/pnas.0800650105. [DOI] [PMC free article] [PubMed] [Google Scholar]
- 10. Ambros V. The functions of animal microRNAs. Nature 431: 350–355, 2004. doi: 10.1038/nature02871. [DOI] [PubMed] [Google Scholar]
- 11. Xu J, Wang Y, Tan X, Jing H. MicroRNAs in autophagy and their emerging roles in crosstalk with apoptosis. Autophagy 8: 873–882, 2012. doi: 10.4161/auto.19629. [DOI] [PMC free article] [PubMed] [Google Scholar]
- 12. Brest P, Lapaquette P, Souidi M, Lebrigand K, Cesaro A, Vouret-Craviari V, Mari B, Barbry P, Mosnier JF, Hébuterne X, Harel-Bellan A, Mograbi B, Darfeuille-Michaud A, Hofman P. A synonymous variant in IRGM alters a binding site for miR-196 and causes deregulation of IRGM-dependent xenophagy in Crohn's disease. Nat Genet 43: 242–245, 2011. doi: 10.1038/ng.762. [DOI] [PubMed] [Google Scholar]
- 13. Anbazhagan AN, Priyamvada S, Kumar A, Maher DB, Borthakur A, Alrefai WA, Malakooti J, Kwon JH, Dudeja PK. Translational repression of SLC26A3 by miR-494 in intestinal epithelial cells. Am J Physiol Gastrointest Liver Physiol 306: G123–G131, 2014. doi: 10.1152/ajpgi.00222.2013. [DOI] [PMC free article] [PubMed] [Google Scholar]
- 14. Gillen AE, Gosalia N, Leir SH, Harris A. MicroRNA regulation of expression of the cystic fibrosis transmembrane conductance regulator gene. Biochem J 438: 25–32, 2011. doi: 10.1042/BJ20110672. [DOI] [PMC free article] [PubMed] [Google Scholar]
- 15. Dalmasso G, Nguyen HT, Yan Y, Laroui H, Charania MA, Obertone TS, Sitaraman SV, Merlin D. MicroRNA-92b regulates expression of the oligopeptide transporter PepT1 in intestinal epithelial cells. Am J Physiol Gastrointest Liver Physiol 300: G52–G59, 2011. doi: 10.1152/ajpgi.00394.2010. [DOI] [PMC free article] [PubMed] [Google Scholar]
- 16. Anbazhagan AN, Priyamvada S, Kumar A, Jayawardena D, Borthakur A, Saksena S, Gill RK, Alrefai WA, Dudeja PK. miR-29a, b, and c regulate SLC5A8 expression in intestinal epithelial cells. Am J Physiol Gastrointest Liver Physiol 321: G223–G231, 2021. doi: 10.1152/ajpgi.00148.2021. [DOI] [PMC free article] [PubMed] [Google Scholar]
- 17. Anbazhagan AN, Priyamvada S, Borthakur A, Saksena S, Gill RK, Alrefai WA, Dudeja PK. miR-125a-5p: a novel regulator of SLC26A6 expression in intestinal epithelial cells. Am J Physiol Cell Physiol 317: C200–C208, 2019. doi: 10.1152/ajpcell.00068.2019. [DOI] [PMC free article] [PubMed] [Google Scholar]
- 18. Esteller M. Non-coding RNAs in human disease. Nat Rev Genet 12: 861–874, 2011. doi: 10.1038/nrg3074. [DOI] [PubMed] [Google Scholar]
- 19. McGovern DP, Kugathasan S, Cho JH. Genetics of inflammatory bowel diseases. Gastroenterology 149: 1163–1176.e2, 2015. doi: 10.1053/j.gastro.2015.08.001. [DOI] [PMC free article] [PubMed] [Google Scholar]
- 20. Grimson A, Farh KK, Johnston WK, Garrett-Engele P, Lim LP, Bartel DP. MicroRNA targeting specificity in mammals: determinants beyond seed pairing. Mol Cell 27: 91–105, 2007. doi: 10.1016/j.molcel.2007.06.017. [DOI] [PMC free article] [PubMed] [Google Scholar]
- 21. Wang X. miRDB: a microRNA target prediction and functional annotation database with a wiki interface. RNA 14: 1012–1017, 2008. doi: 10.1261/rna.965408. [DOI] [PMC free article] [PubMed] [Google Scholar]
- 22. Rehman S, Kekuda R, Tse M, Donowitz M, Rajendran V. Su1199 post-transcriptional regulation of Na-H exchanger-3 (NHE3) by aldosterone involves microRNA-204. Gastroenterology 150: S493, 2016. doi: 10.1016/S0016-5085(16)31698-5. [DOI] [Google Scholar]
- 23. Alexiou P, Maragkakis M, Papadopoulos GL, Reczko M, Hatzigeorgiou AG. Lost in translation: an assessment and perspective for computational microRNA target identification. Bioinformatics 25: 3049–3055, 2009. doi: 10.1093/bioinformatics/btp565. [DOI] [PubMed] [Google Scholar]
- 24. Filipowicz W, Bhattacharyya SN, Sonenberg N. Mechanisms of post-transcriptional regulation by microRNAs: are the answers in sight? Nat Rev Genet 9: 102–114, 2008. doi: 10.1038/nrg2290. [DOI] [PubMed] [Google Scholar]
- 25. Chen Y, Wang X. miRDB: an online database for prediction of functional microRNA targets. Nucleic Acids Res 48: D127–D131, 2020. doi: 10.1093/nar/gkz757. [DOI] [PMC free article] [PubMed] [Google Scholar]
- 26. Yoo BK, Yanda MK, No YR, Yun CC. Human intestinal epithelial cell line SK-CO15 is a new model system to study Na(+)/H(+) exchanger 3. Am J Physiol Gastrointest Liver Physiol 303: G180–G188, 2012. doi: 10.1152/ajpgi.00069.2012. [DOI] [PMC free article] [PubMed] [Google Scholar]
- 27. Iwasaki S, Kawamata T, Tomari Y. Drosophila argonaute1 and argonaute2 employ distinct mechanisms for translational repression. Mol Cell 34: 58–67, 2009. doi: 10.1016/j.molcel.2009.02.010. [DOI] [PubMed] [Google Scholar]
- 28. Liao Y, Lönnerdal B. miR-584 mediates post-transcriptional expression of lactoferrin receptor in Caco-2 cells and in mouse small intestine during the perinatal period. Int J Biochem Cell Biol 42: 1363–1369, 2010. doi: 10.1016/j.biocel.2009.07.019. [DOI] [PubMed] [Google Scholar]
- 29. Pan Y-J, Wan J, Wang C-B. MiR-326: promising biomarker for cancer. Cancer Manag Res 11: 10411–10418, 2019. doi: 10.2147/CMAR.S223875. [DOI] [PMC free article] [PubMed] [Google Scholar]
- 30. Schaefer JS, Montufar-Solis D, Vigneswaran N, Klein JR. Selective upregulation of microRNA expression in peripheral blood leukocytes in IL-10−/− mice precedes expression in the colon. J Immunol 187: 5834–5841, 2011. doi: 10.4049/jimmunol.1100922. [DOI] [PMC free article] [PubMed] [Google Scholar]
- 31. Yoo HI, Kim BK, Yoon SK. MicroRNA-330-5p negatively regulates ITGA5 expression in human colorectal cancer. Oncol Rep 36: 3023–3029, 2016. doi: 10.3892/or.2016.5092. [DOI] [PubMed] [Google Scholar]
- 32. Bibby BAS, Miranda CS, Reynolds JV, Cawthorne CJ, Maher SG. Silencing microRNA-330-5p increases MMP1 expression and promotes an invasive phenotype in oesophageal adenocarcinoma. BMC Cancer 19: 784, 2019. doi: 10.1186/s12885-019-5996-3. [DOI] [PMC free article] [PubMed] [Google Scholar]


