

The German HPQ can be used among Swiss employees to measure performance or presenteeism as productivity loss due to health-related problems. For its application in other German-speaking countries, cross-cultural validation is needed.
Keywords: productivity, presenteeism, HPQ, German HPQ
Background
Research interest in presenteeism as a productivity loss has grown given its estimated costs for organizations. To enable researchers in German-speaking countries to compare their findings internationally, a validated German Health and Work Performance Questionnaire (HPQ) version is needed.
Methods
First, the HPQ was translated from English into German, culturally adapted, and tested using cognitive debriefing in interviews. Second, the structural validity of the item measuring presenteeism as productivity loss was tested.
Results
Overall, 14 problems with items were identified in the cognitive debriefing. Of these, 57% were comprehension problems. Two of three alternative hypotheses for discriminative validity were accepted. No discrimination was possible for individuals with or without chronic disease.
Conclusions
The German HPQ has satisfactory cross-cultural validity and can be used to measure overall performance, as well as presenteeism in a specified sample with health problems.
Research interest in presenteeism has grown globally given its influence on employee well-being and organizational productivity.1,2 For employees, presenteeism can exacerbate an existing health condition and have a negative impact on the quality of daily work and work performance.3 For organizations, presenteeism can lead to lower productivity and quality of work.3 The rising costs of lost productivity were found to be predominantly caused by presenteeism.4–7 It is internationally recognized that presenteeism has a significant financial burden on society, accounting for 52% of the total cost of health-related production losses.4 In Switzerland, a partially German-speaking country, presenteeism was found to account for approximately two thirds of total health-related production losses in 2016, which is close to three times the cost of absenteeism.8 However, presenteeism is not necessarily a negative behavior nor does it have solely negative consequences.9,10 Under certain conditions (eg, supportive work environment or flexible work resources), presenteeism can maintain or improve an individual's health. Individuals might experience the exchange among coworkers as supportive or going to work as a break from private life and a boost to self-confidence.9 Furthermore, Lohaus et al10 found that employees show presenteeism if the expected benefits outweigh the costs, such as avoiding extra work for the team or avoiding letting the disease make one feel down.
There are two perspectives for investigating presenteeism11,12: (a) presenteeism as the behavior of going to work despite illness13 and (b) presenteeism as a productivity loss due to reduced performance of workers with health problems.14 Whereas the definition of “sickness presenteeism” is predominantly used in European research, the definition of presenteeism as “reduced performance at work, besides illness” is used in studies in North America.11 The current study is based on the latter perspective, which elaborates presenteeism as productivity loss due to reduced performance of workers with health-related problems. Health-related problems can be chronic diseases, such as allergies, burnout, low back pain, or depression.15,16
Because of its global relevance, researchers strive for international comparability of their findings.15 International comparability is crucial for the development of a joint understanding of presenteeism, its assessment, and suitable interventions.12 For this purpose, international comparable questionnaires are needed. In this sense, the World Health Organization Health and Work Performance Questionnaire (HPQ) is used.15,17 The HPQ was designed as a self-report instrument to assess the indirect costs of workplace illness and productivity loss.14 Although the HPQ has been used internationally since 2003, no validated German version is available. However, a validated German HPQ version is needed to enable researchers in German-speaking countries to compare their findings internationally. The aim of this study was to translate the HPQ questionnaire into German and to analyze the structural validity by assessing the discriminative validity.
METHODS
Design
This study was conducted in two phases. First, the HPQ was translated from English into German, culturally adapted, and tested using “cognitive debriefing” in interviews. Second, the translated item measuring presenteeism as productivity loss was validated regarding its ability to show differences between groups for related constructs. For the reporting of the results, we adhered to the guidelines from the Consensus-based Standards of the selection of health Measurement Instruments (COSMIN).18 The COSMIN manual offers checklists for conducting hypothesis testing elaborating structural validity and for cross-cultural validity. The checklist for hypothesis testing consists of 10 questions, such as “Were hypotheses regarding correlations or mean differences formulated a priori?”. The checklist for cross-cultural validity consists of 15 questions, such as “Was the instrument pretested (eg, cognitive interviews to check interpretation, cultural relevance of the translation, and ease of comprehension)?”.
Phase 1: Translation and Cultural Adaption
The HPQ was fully translated and cross-culturally adapted to German in accordance with established guidelines for scientific translation processes “SPOR Principles of Good Practice.”19Figure 1 presents the stages of the translation process. In stage 1, all items were independently forward translated by a native German-speaking professional translator and a native German-speaking researcher. After translation, the two versions were compared by an expert panel and discussed, and a consensual final version 1 was created. The expert panel was consisted of the project team and the translators. In stage 2, the translated items were independently back translated into English by an English-speaking translator and researcher, who were both native German speakers. Afterward, language discrepancies were resolved by discussion, and a consensual final version 2 was created. In the last step, the translated items were tested using “cognitive debriefing,”19 to reach cross-cultural validity by determining acceptability, understandability, and clarity for translation. After those interviews, a final version was created and proofread by a translation agency.
FIGURE 1.
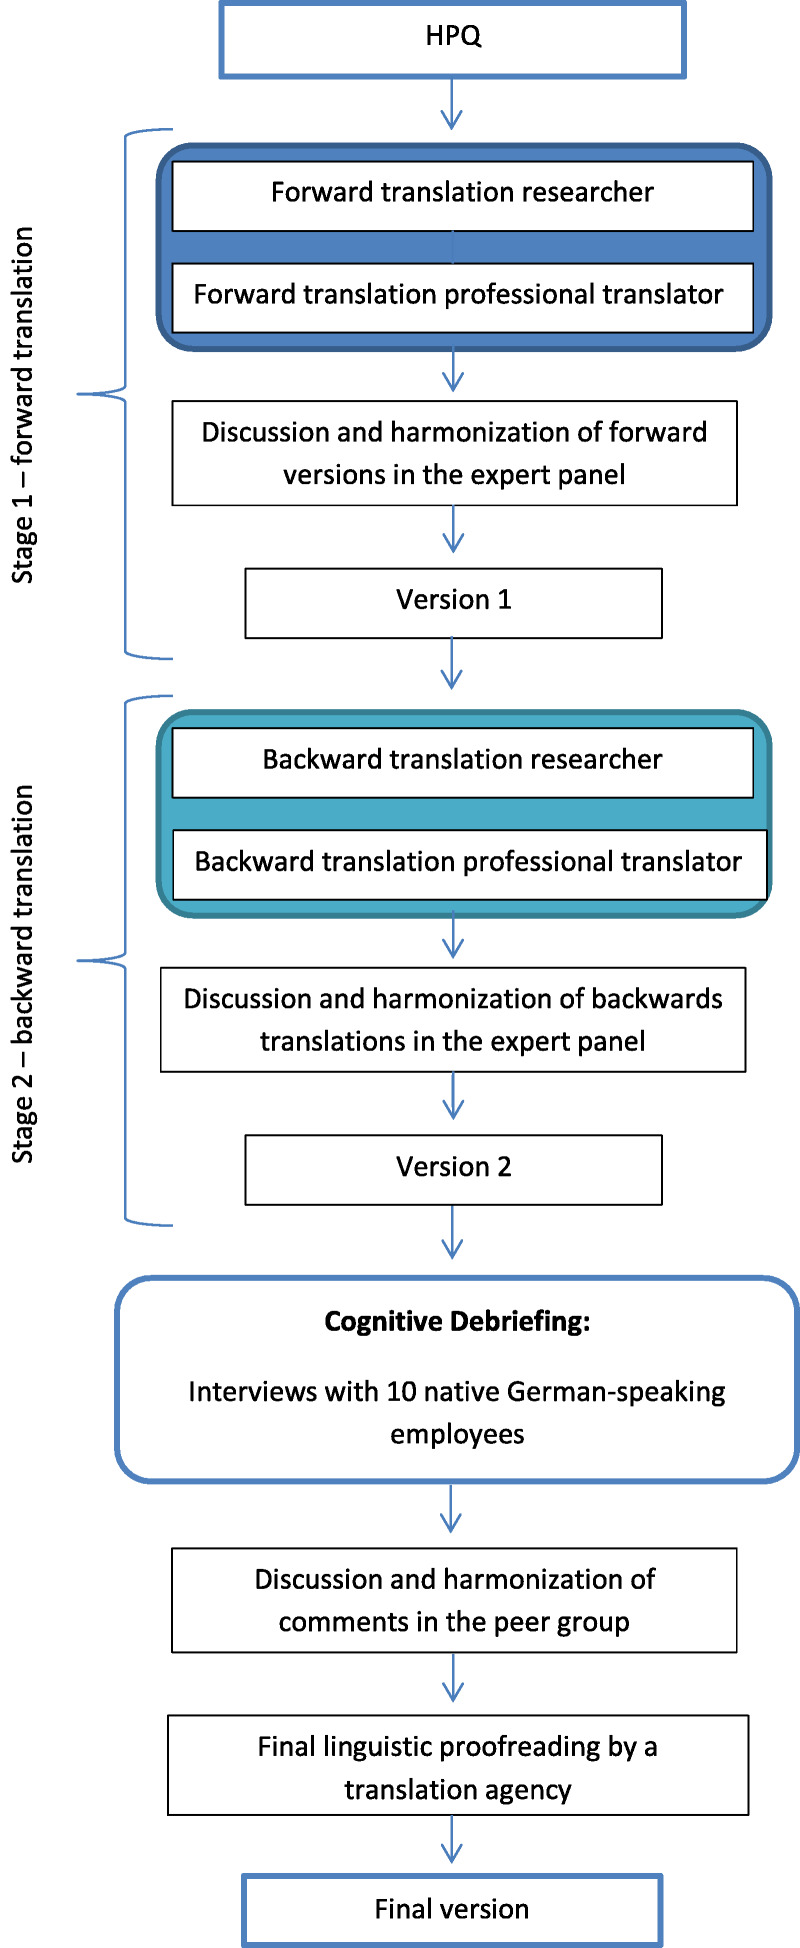
Methodological steps of translation and testing 3.
Cognitive Debriefing
The assessment of the last step for cross-cultural validity can be optimally captured by interviews because of individual subjective perception.20 Therefore, general comprehensibility was determined using Collins21 cognitive interviewing in individual interviews. Questions and answers should be unambiguous across all participants, if possible, so that generalizability of the results is possible.20 Even a plausible answer may be based on an incorrect understanding of the question.22 Respondents may interpret questions and answers differently because of their individual characteristics (eg, language proficiency, jargon, educational level, and experience).20 A person must cognitively process four phases to answer a question: (a) the question with the possible answer categories must be understood, (b) knowledge must be retrieved from memory about it, and (c) the person must think about the planned answer, whether it should be formulated in such a way or if he/she wants to formulate the answer in this way to (d) give the answer in the end.21 For the cognitive validation, the “verbal probing” technique was used, because the participants did not have to be trained first, as with the “think-aloud” technique. In the verbal probing technique, given answers are questioned by “one or more additional questions.”23 The additional questions were noted in advance in the interview guide. In the interview guide, each question to be tested was assigned one to three questions per phase according to Collins21 (Table 1).
TABLE 1.
| Phase | Example Questions | Subcategory According to Willis24 |
|---|---|---|
| 1. Understand question/answer | a. What do you understand by the term X? b. In your own words, what do you think this question asks? |
The responder has difficulty understanding the question, a particular word, or concept. |
| 2. Retrieve information | a. How easy or difficult did you find it to remember X? b. What time period did you think of when answering this question? c. When was the last time you did X? |
The responder has difficulty retrieving information about the answer. |
| 3. Valuation of the answer | a. How did you elaborate your answer to this question? b. How accurate is your answer to your question? c. How did you feel when you answered this question? |
The responder has difficulty formulating the answer. |
| 4. Answer | a. How easy or difficult was it for you to answer based on available answer choices? b. Why did you choose this particular answer? c. Are you missing an answer category; if yes, which one? |
The responder has difficulty giving the answer, or the possible answers do not apply. |
Recruitment and Study Sample
The literature refers to sample sizes for cognitive testing with a minimum of 10 subjects.20,21,24 For this purpose, German-speaking employees as contacts from the network of the research group were contacted and asked to participate.
Data Collection
Data were collected within single interviews on MS Teams. During the interviews, field notes were made if an interviewee had difficulties within one of the rounds. The interviews were recorded. The audio tracks were transcribed using the F4 word processing program.
Data Analysis
The qualitative analysis was done interpretatively in two rounds20 by using MAXQDA 12. The goal of this approach is “to gain conceptual understanding about the [cognitive] process for formulating a response, as well as any difficulty responders experience can produce [...].”20 Identified problems were assigned to one of the four possible subcategories (Table 1, right column).
Phase 2: Structural Validity
Discriminative Validity
Discriminative validity between known groups, also known as known groups validity, is a form of validity that “relies on hypotheses concerning a measure's ability to discriminate between two or more groups known (or expected) to differ with regard to the construct of interest.”25 For discriminative validity, the tested instrument is evaluated, whether it discriminates the differences between different groups, for example, symptomatic and nonsymptomatic groups, sick, and healthy. Discriminative validity was assessed to test the validity of the HPQ item measuring presenteeism as productivity loss. Three known associated factors of the HPQ are chronic diseases,26,27 health status,3,28,29 and burnout symptoms.16 A lower health status was found to be associated with higher productivity loss due to presenteeism.3,28,29 Higher burnout symptoms were found to be associated with higher productivity loss due to presenteeism.16 Furthermore, employees with chronic diseases were found to have greater productivity loss due to presenteeism than employees without chronic diseases.
Accordingly, the following hypotheses were made:
Ha1: The HPQ single item for presenteeism as productivity loss can discriminate between groups according to health status.
Ha2: The HPQ single item for presenteeism as productivity loss can discriminate between groups according to burnout symptoms.
Ha3: The HPQ single item for presenteeism as productivity loss can discriminate between groups with and without chronic diseases.
Recruitment and Study Sample
As a general rule, a minimum sample size of 10 participants per item is needed for psychometric testing.30 However, because the HPQ does not comprise a theoretical set of items that can be summed for an overall score, this assumption does not apply. Studies elaborating the psychometric properties of the HPQ reported sample sizes between 100 and 200.29,31–33 Thus, the research group aimed for a sample size of at least 250, which was seen as adequate.30 The sample consisted of German-speaking employees from 19 companies, who were recruited within a cross-sectional study on presenteeism at work. In the study, a convenience sampling of companies with German-speaking employees in Switzerland between the ages of 18 and 65 years was conducted. The research group invited 280 companies by email and phone from lists of national industry associations to participate in the study. The email included information about the project's aim, anonymity, and voluntariness of the participation. A total of 19 companies from different sectors (construction, education, health, informatics, and recruitment agencies) took part in the study. For data collection, a contact person in each participating company was responsible for the distribution of the study information and the questionnaires. The questionnaire was sent by email to the employees.
Content and Use of the Questionnaire
Health and Work Performance Questionnaire
The HPQ is a self-report questionnaire that provides a measure of absenteeism and performance.14 Presenteeism as productivity loss due to reduced performance of workers with health-related problems is measured, if the sample consists of individuals with health-problems (eg, symptoms of illness, chronic diseases).27 The HPQ is available in three different versions: a long version with 89 items for employees, a version for clinical studies, and a short version with 11 items. The majority of the items are included for decomposition and anchoring of the presenteeism and absenteeism single items.27 The HPQ is available with a 1-week and 4-week recall period (7 or 28 days). The questionnaire is applicable across industries and occupations. There is no final sum score. The authors of the HPQ evaluated the validity of the single items of performance and absenteeism by comparing them with archival data of performance ratings and with data gathered in a 1-week Experience Sample Method evaluation.14 The quality criteria of the English version show good reliability in this comparison (Cronbach α = 0.74).14,27 The HPQ offers two methods of scoring (relative and absolute). In another study elaborating the discriminative validity of the HPQ performance, the absolute method showed higher validity.34
Thus, we used the absolute method with the single item “How would you rate your overall performance on the days you worked during the past 7/28 days?,” measuring the performance and scores range between 0 (low performance) and 100 (high performance).35
Associated Factors
Burnout symptoms were measured using the German subscale from the Copenhagen Psychosocial Questionnaire, comprising three items on a five-point Likert scale from never to always, indicating a high value for high burnout symptoms.36 Health status was measured using the single item for general health status, ranging from a value of 0 (worst imaginable health state) to 100 (best imaginable health state).37 Chronic disease was measured using an in-house developed single binary item, “Do you suffer from one or more chronic disease(s)?”.
Data Collection
Data were collected over 16 weeks using an online version of the questionnaire on Unipark. All employees from the participating companies were invited to participate. Participation was on a voluntary basis for the participants.
Psychometric and Statistical Analysis
The analysis was conducted using the statistical software R version 4.0.4.38 According to the original author of the Copenhagen Psychosocial Questionnaire, scale scores can be calculated if at least half the items are not missing (eg, for a scale with five items, the mean is calculated if at least three of the five items are completed).39 No imputation procedure for missing values was performed. For discriminative validity, the numeric variables burnout symptoms and health status were categorized into four groups by using quartiles.40 For the dependent variable burnout symptoms, analysis of variance with equal variances was computed with the Tukey post hoc test. For the dependent variables health status and chronic disease, analysis of variance with Welch t test was used, because Levene test showed unequal variances (P = 0.001).41 Thus, Games-Howell post hoc analysis was performed to determine which groups differed significantly from each other. Because three hypotheses were tested on one data set, a Bonferroni-adjusted significance level of α = 0.017 (0.05/3) was calculated.42
RESULTS
Phase 1: Cognitive Debriefing
Overall, 10 employees participated in the single interviews in two rounds. The interviews lasted 30 to 55 minutes each. Half of the interviewees were female (50%) and worked in the health care (30%), education (20%), and sales (20%) sectors. Participants were on average 38 years old (SD, 11.2 years). The original and translated items are summarized in Appendix A, http://links.lww.com/JOM/B215. In the first round of the cognitive debriefing, the majority of the translated items were understood and answered according to the intention. Overall, 14 problems were identified. Of those, four problems (29%) could be assigned to the same problem with polite spelling. This problem emerged in 12 items, which could not be assigned to one category, as described in Table 1. In the original questionnaire, some items politely request giving an answer by using “please.” However, 12 items do not, which was seen as impolite and not stringent for the whole questionnaire. For example, “If it varies, estimate the average” was experienced as a request and not an invitation, resulting in the following change: “If it varies, please estimate the average.” Thus, we added “please” to the respective items. Furthermore, 10 problems emerged with four items that could be assigned to two subcategories according to Willis24: difficulties in understanding the question (8 [57%]) and difficulties in giving the answer (2 [14%]).
Difficulties in Understanding the Question
With regard to the items “How often was your performance lower/higher than most workers on your job?,” the 8 of 10 interviewees had difficulties in understanding the question, in particular the concept “most workers on your job.” This was due to the first translation “Wie oft war Ihre Leistung höher/geringer als die der meisten Arbeitnehmer(innen) an Ihrer Arbeitsstelle?”, which led to a misinterpretation of the question. With the first translation of “most workers on your job,” the interviewees compared themselves with all coworkers in the company. However, the item is meant to have oneself comparing with workers doing the exact same job, such as a cashier comparing himself/herself with another cashier and not with the store manager. Thus, the two items were revised accordingly to “Wie oft war Ihre Leistung höher/geringer als die der meisten Arbeitskräfte mit Ihrer Tätigkeit?”. In the second round, the revised items were processed and answered correctly. No additional problems with the questions emerged.
Difficulties in Giving the Answer
Regarding the item “How many hours does your employer expect you to work in a typical seven-day week?”, interviewees responded differently depending on their position. One interviewee with a leading function argued that the expectation of working hours by their employer differs regarding their working hours defined in their contract, such as expected overtime. Also, the item “On a scale from 0 to 10 where 0 is the worst job performance anyone could have at your job and 10 is the performance of a top worker, how would you rate the usual performance of most workers in a job similar to yours?” was found difficult by one interviewee because no other worker in a similar job was available for comparison. Both concerns were issues of conceptualization in the original questionnaire and were not possible to distinguish by rephrasing the translations. Thus, no revision of the items was done.
Phase 2: Discriminative Validity
A total of 1386 employees from 19 companies completed the survey. In Table 2, the sample characteristics are summarized. Regarding chronic diseases, 273 (19.7%) reported having one or more chronic disease. The mean for HPQ productivity was 90.88 (SD, 11.43), indicating a high overall performance. The proportion of missing values was 10% (141). The results of the group comparisons are summarized in Table 2.
TABLE 2.
Sample Characteristics
| Characteristics | Participants (N = 1386) | |
|---|---|---|
| Mean (SD) | n (%) | |
| Age | 46.8 (15.88) | |
| Sex | ||
| Female | 888 (64) | |
| Education | ||
| No education | 17 (1.2) | |
| Secondary level | 664 (47.9) | |
| Tertiary level | 295 (21.8) | |
| Bachelor's degree | 163 (11.7) | |
| Master's degree | 143 (10.3) | |
| PhD | 62 (4.5) | |
| Missing | 42 (3) | |
| Chronic disease | ||
| Yes | 273 (19.7) | |
| HPQ productivity | 90.88 (11.43) | 1245 (90) |
Burnout Symptoms
Health and Work Performance Questionnaire Presenteeism as productivity loss differed significantly between the quartile groups for burnout symptoms (F3, 1201 = 10.009, P < 0.001). The Tukey post hoc analysis revealed a significant difference (<0.001) between the first quartile group and the second quartile group, −3.65 (95% CI, −5.68 to −1.62); between the first quartile group and the third quartile group, −3.66 (95% CI, −5.98 to −1.35); and between the first quartile group and the fourth quartile group, −3.47 (95% CI, −5.70 to −1.26]). The group with the lowest scores in burnout symptoms (the first quartile) had significantly higher performance scores. Thus, alternative hypothesis Ha1 can be accepted (Table 3).
TABLE 3.
Results From the Post Hoc Analyses
| Variable | Quartile | Difference | 95% CI | P |
|---|---|---|---|---|
| Burnout symptoms | 2 vs 1 | −3.65 | −5.68 to −1.62 | <0.001 |
| 3 vs 1 | −3.66 | −5.98 to −1.35 | <0.001 | |
| 4 vs 1 | −3.47 | −5.70 to −1.24 | <0.001 | |
| 3 vs 2 | −0.01 | −2.38 to 2.36 | 0.99 | |
| 4 vs 2 | 0.18 | −2.10 to 2.47 | 0.99 | |
| 4 vs 3 | 0.20 | −2.35 to 2.74 | 0.99 | |
| Health status | 2 vs 1 | 2.84 | 0.46–5.22 | 0.012 |
| 3 vs 1 | 4.71 | 2.32–7.09 | <0.001 | |
| 4 vs 1 | 7.41 | 4.71–10.12 | <0.001 | |
| 3 vs 2 | 1.86 | −0.09 to 3.82 | 0.07 | |
| 4 vs 2 | 4.57 | 2.23–6.91 | <0.001 | |
| 4 vs 3 | 2.71 | 0.36–5.05 | 0.016 |
Health Status
Health and Work Performance Questionnaire Presenteeism as productivity loss differed significantly between the quartile groups for health status (Welch F3, 602.03 = 18.594, P < 0.001). The Games-Howell post hoc analysis revealed a significant difference (<0.001) between the first quartile group and the second quartile group, 2.84 (95% CI, 0.46–5.22; P = 0.012); between the first quartile group and the third quartile group, 4.71 (95% CI, 2.32–7.09; P < 0.001); between the first quartile group and the fourth quartile group, 7.41 (95% CI, 4.71–10.12; P < 0.001); and between the second quartile group and the fourth quartile group, 4.57 (95% CI, 2.23–6.91; P < 0.001). The group with the lowest and scores in health status (the first quartile) had significantly lower performance scores. Alternative hypothesis Ha2 can be accepted.
Chronic Disease
Health and Work Performance Questionnaire Presenteeism as productivity loss did not differ significantly between the individuals with one or more chronic disease and individuals with no chronic disease (Welch F1, 330.79 = 2.3844, P = 0.12). Thus, alternative hypothesis Ha3 must be rejected.
DISCUSSION
This study focused on translating the HPQ questionnaire into German and evaluating its cross-cultural validity as well as the discriminative validity or the HPQ single item measuring presenteeism as productivity loss. Cross-cultural validity was reached by applying scientific translation processes comprising multiple forward and backward translations by two translators, as well as cognitive debriefing to detect interpretation errors in the items.18 The interviewees' statements highlighted deficiencies in the translation. According to Willis,24 60% to 70% of the problems were assigned to difficulties with understanding the questions in the first round. In the first round, we found a percentage above with 57%, followed by items rated as impolite (29%). However, all difficulties with understanding were related to two items that differed only in their weighting (lower/higher). Both items play an important role in the HPQ, as they are meant for memory priming as preparation for the question about the self-rated overall performance and for the calculation of the relative performance score.27 The cognitive debriefing allowed the identification of the problem and approval for cross-cultural validity after the second round. Nevertheless, the two identified difficulties with giving the right answer were not resolved. The item asking for the expected working hours in a typical 7-day week is used to calculate the absenteeism score. The HPQ for measuring absenteeism follows an indirect procedure by asking for the number of hours to be worked expected by the employer and subtracting the number of hours the employee actually worked. The indirect approach in the HPQ could lead to imprecision, as the word “expect” on the one hand can be understood as the target working time stated in the contract or the implied expectation of hours to be worked, which could also include overtime. Also, the original author identified an issue with employees who report not having a defined number of hours to work but are rewarded for performance.43 Thus, the applicability of the HPQ questionnaire to measure absenteeism seems limited to employees with specified working hours. In this study, only the item measuring absolute presentism as health-related productivity loss was tested for structural validity. Thus, further structural validation for other scales of the translated German HPQ is necessary. Furthermore, the items asking for comparisons with workers in a similar job were found to be difficult for employees who do not have the possibility of comparison. In another study on cross-cultural cognitive debriefing of the HPQ, the authors concluded that, in particular, the questions involving comparison with other workers were disliked.44 This aspect was not reported in our interviews, but this indicates that, although a questionnaire is available in multiple languages and is cross-culturally validated, comparisons of the findings across countries may be limited.45 Not only the validity of the questionnaire may differ between countries but also the measured outcomes.15,46 One reason for this difference between countries could be cultural differences, which were found to be relevant influencing factors of presenteeism.47,48 In this study, a sample of Swiss employees was used. Although people in other countries speak the same language, it cannot be assumed that our findings are valid for other German-speaking countries. This has to do with the fact that, although the language is the same, there exist cultural differences between Germany and Switzerland, which are reflected in the language (eg, politeness).49
Regarding the discriminative validity, we were able to support two of the three hypotheses for the HPQ single item “How would you rate your overall performance on the days you worked during the past 7/28 days?.” The item showed the ability to discriminate between groups with low health status versus high health status and groups with low burnout symptoms versus high burnout symptoms. However, no difference was identified between individuals with and without chronic diseases, which is in contrast to other findings.26 The HPQ is predominantly used among samples with known chronic diseases,15,16,27,50 and employees with chronic diseases were found to have lower performance than employees without chronic diseases.26 One reason for this difference might be different approaches with self-reported chronic disease in our case versus chronic disease status from medical records. In our sample, the prevalence of chronic diseases was 5% lower than in the Swiss population with approximately 25%.51 The level of agreement between self-reported chronic disease and medical records may differ between the respective diseases, because the individuals are unaware of their chronic disease52 or because of social desirability bias in surveys.53
Strengths and Limitations
The translation and validation process were structured and carefully implemented based on the COSMIN guidelines.18 The study included the translation process and cross-cultural validity of the whole HPQ and the structural validation of a single item measuring presenteeism as productivity loss. In this study, the minimum sample sizes for both phases were reached. The study contributes to the cross-linguistic comparability of data collected with the HPQ.
Besides these strengths, several limitations must be considered. Although the sample size was sufficient, the convenience sampling may have led to an underrepresentation of employees who were not reached via the recruitment processes. The sample differs from the total population regarding the prevalence of chronic diseases and sex. In our sample, the majority was female, which is higher in the working population in Switzerland at 46%.54 However, the mean age of the sample included the mean age of the working population in Switzerland of 42 years.55 The potential underrepresentation of the target population might limit the conclusion that the German HPQ is valid for all German-speaking employees. Furthermore, the data stem from a cross-sectional study, which only allowed us to test for correlations and does not allow for inferring causality. Regarding the psychometric testing of presenteeism questionnaires, Ospina et al2 conclude in their systematic review of the measurement properties of 21 questionnaires assessing presenteeism that they fail to evaluate criterion validity because of a missing criterion standard, which is also the case in this study.
CONCLUSIONS
This article presents the cross-cultural validity of the German HPQ and the discriminative validity of the HPQ single item for presenteeism as productivity loss. The German HPQ has satisfactory cross-cultural validity and can be used to measure overall performance, as well as presenteeism in terms of health-related productivity loss in a specified sample with health problems. Further psychometric testing of the German HPQ is needed, such as test-retest reliability or convergence validity with other scales based on the same underlying definition of presenteeism. Furthermore, cross-cultural validation in other German-speaking countries is needed. The German HPQ can be used for further research considering these limitations.
Supplementary Material
Footnotes
Ethical Considerations and Disclosures: The local Swiss ethical board in Bern confirmed that the study does not warrant a full ethical application and does not fall under the Swiss Federal Act on Research Involving Human Beings (Req-2021-00668). The study was conducted on a voluntary basis for all organizations, and all participants were free to stop filling in the questionnaire at any time.
Funding sources: This work was supported by SWICA Gesundheitsorganisation.
Conflict of interest: None declared.
Supplemental digital contents are available for this article. Direct URL citation appears in the printed text and is provided in the HTML and PDF versions of this article on the journal’s Web site (www.joem.org).
Contributor Information
Maisa Gerlach, Email: maisa.gerlach@bfh.ch.
Gablu Kilcher, Email: gablu.kilcher@swica.ch.
Karin Anne Peter, Email: karin.peter@bfh.ch.
REFERENCES
- 1.Miraglia M, Johns G. Going to work ill: a meta-analysis of the correlates of presenteeism and a dual-path model. J Occup Health Psychol. 2016;21:261–283. [DOI] [PubMed] [Google Scholar]
- 2.Ospina MB, Dennett L, Waye A, Jacobs P, Thompson AH. A systematic review of measurement properties of instruments assessing presenteeism. Am J Manag Care. 2015;21:e171–e185. [PubMed] [Google Scholar]
- 3.Johns G. Presenteeism in the workplace: a review and research agenda. J Organ Behav. 2010;31:519–542. [Google Scholar]
- 4.Kigozi J, Jowett S, Lewis M, Barton P, Coast J. The estimation and inclusion of presenteeism costs in applied economic evaluation: a systematic review. Value Health. 2017;20:496–506. [DOI] [PubMed] [Google Scholar]
- 5.Biron C, Saksvik PØ. Sickness presenteeism and attendance pressure factors: implications for practice. In: Cooper CL, Campbell Quick J, Schabracq MJ, eds. International Handbook of Work and Health Psychology. West Sussex: John Wiley & Sons Ltd.; 2009;3. [Google Scholar]
- 6.Cooper CL, Lu L. Presenteeism as a global phenomenon: unraveling the psychosocial mechanisms from the perspective of social cognitive theory. Cross Cultural & Strategic Management. 2016;23. Available at: 10.1108/CCSM-09-2015-0106. [DOI] [Google Scholar]
- 7.Wang J, Schmitz N, Smailes E, Sareen J, Patten S. Workplace characteristics, depression, and health-related presenteeism in a general population sample. J Occup Environ Med. 2010;52:836–842. [DOI] [PubMed] [Google Scholar]
- 8.Igic I Elfering A Semmer-Tschan N, et al. Job-Stress-Index 2014 bis 2016. Kennzahlen zu psychischer Gesundheit und Stress bei Erwerbstätigen in der Schweiz. Theoretische Grundlagen, Methodik und Ergebnisse für die Jahre 2014 bis 2016 in Quer-und Längsschnitt. Bern & Lausanne: Bern und Lausanne: Gesundheitsförderung Schweiz; 2017. [Google Scholar]
- 9.Karanika-Murray M, Biron C. The health-performance framework of presenteeism: towards understanding an adaptive behaviour. Hum Relat. 2019;73:242–261. [Google Scholar]
- 10.Lohaus D, Habermann W, El Kertoubi I, Röser F. Working while ill is not always bad—positive effects of presenteeism. Front Psychol. 2021;11. [DOI] [PMC free article] [PubMed] [Google Scholar]
- 11.Ishimaru T, Mine Y, Fujino Y. Two definitions of presenteeism: sickness presenteeism and impaired work function. Occup Med. 2020;70:95–100. [DOI] [PubMed] [Google Scholar]
- 12.Ruhle S Breitsohl H Aboagye E, et al. ‘To work, or not to work, that is the question’–recent trends and avenues for research on presenteeism. Eur J Work Organ Psy. 2020;29:344–363. [Google Scholar]
- 13.Lohaus D, Habermann W. Presenteeism: a review and research directions. Human Res Manag Rev. 2019;29:43–58. [Google Scholar]
- 14.Kessler RC Barber C Beck A, et al. The World Health Organization Health and Work Performance Questionnaire (HPQ). J Occup Environ Med. 2003;45:156–174. [DOI] [PubMed] [Google Scholar]
- 15.Evans-Lacko S, Knapp M. Global patterns of workplace productivity for people with depression: absenteeism and presenteeism costs across eight diverse countries. Soc Psychiatry Psychiatr Epidemiol. 2016;51:1525–1537. [DOI] [PMC free article] [PubMed] [Google Scholar]
- 16.Ferreira AI, da Costa Ferreira P, Cooper CL, Oliveira D. How daily negative affect and emotional exhaustion correlates with work engagement and presenteeism-constrained productivity. Int J Stress Manag. 2019;26:261. [Google Scholar]
- 17.Ralph P Baltes S Adisaputri G, et al. Pandemic programming. Empirical Software Eng. 2020;25:4927–4961. [DOI] [PMC free article] [PubMed] [Google Scholar]
- 18.Mokkink LB Terwee CB Patrick DL, et al. COSMIN Checklist Manual. Amsterdam, the Netherlands: University Medical Center; 2012. [Google Scholar]
- 19.Wild D Grove A Martin M, et al. Principles of good practice for the translation and cultural adaptation process for Patient-Reported Outcomes (PRO) measures: report of the ISPOR Task Force for Translation and Cultural Adaptation. Value Health. 2005;8:94–104. [DOI] [PubMed] [Google Scholar]
- 20.Miller K, Willson S, Cheep V, Padilla J. Cognitive Interviewing Methodology. New Jersey, NJ: John Wiley & Sons; 2014. [Google Scholar]
- 21.Collins D. Cognitive Interviewing Practice: London: SAGE Publications Inc.; 2014.
- 22.Belson WA. Validity in Survey Research: With Special Reference to the Techniques of Intensive Interviewing and Progressive Modification for Testing and Constructing Difficult or Sensitive Measures for Use in Survey Research: A Report. Hants, England: Gower Publishing Company, Limited; 1986. [Google Scholar]
- 23.Prüfer P, Rexroth M. ZUMA-Arbeitsbericht Nr.96/05. Verfahren zur Evaluation von Survey - Fragen. Mannheim, Germany: Ein Überblick; 1996. [Google Scholar]
- 24.Willis GB. Cognitive Interviewing: A Tool for Improving Questionnaire Design. Thousand Oaks, Canada: Sage Publications; 2004. [Google Scholar]
- 25.Polit DF, Yang F. Measurement and the Measurement of Change: A Primer for the Health Professions. Philadelphia, PA: Wolters Kluwer; 2016. [Google Scholar]
- 26.Fouad AM, Waheed A, Gamal A, Amer SA, Abdellah RF, Shebl FM. Effect of chronic diseases on work productivity: a propensity score analysis. J Occup Environ Med. 2017;59:480–485. [DOI] [PubMed] [Google Scholar]
- 27.Kessler RC Ames M Hymel PA, et al. Using the World Health Organization Health and Work Performance Questionnaire (HPQ) to evaluate the indirect workplace costs of illness. J Occup Environ Med. 2004;46:S23–S37. [DOI] [PubMed] [Google Scholar]
- 28.Schultz AB, Edington DW. Employee health and presenteeism: a systematic review. J Occup Rehabil. 2007;17:547–579. [DOI] [PubMed] [Google Scholar]
- 29.Zhang W Gignac MA Beaton D Tang K Anis AH, Canadian Arthritis Network Work Productivity Group . Productivity loss due to presenteeism among patients with arthritis: estimates from 4 instruments. J Rheumatol. 2010;37:1805–1814. [DOI] [PubMed] [Google Scholar]
- 30.DeVellis RF. Scale Development: Theory and Applications. Vol. 26Sage Publications. Los Angeles, London, New Dehli, Singapore, Washington DC, Melbourne. 2016. [Google Scholar]
- 31.de Campos MC, Marziale MH, Santos JL. Cross-cultural adaptation and validation of the World Health Organization Health and Work Performance Questionnaire to Brazilian nurses. Rev Esc Enferm USP. 2013;47:1338–1344. [DOI] [PubMed] [Google Scholar]
- 32.Kawakami N Inoue A Tsuchiya M, et al. Construct validity and test-retest reliability of the World Mental Health Japan version of the World Health Organization Health and Work Performance Questionnaire Short Version: a preliminary study. Ind Health. 2020;58:375–387. [DOI] [PMC free article] [PubMed] [Google Scholar]
- 33.Pournik O, Ghalichi L, Tehrani Yazdi AR, Tabatabaee SM, Ghaffari M, Vingard E. Reliability and validity of Persian version of World Health Organization health and work performance questionnaire in Iranian health care workers. Int J Occup Environ Med. 2012;3:33–38. [PubMed] [Google Scholar]
- 34.AlHeresh R, LaValley MP, Coster W, Keysor JJ. Construct validity and scoring methods of the World Health Organization: Health and Work Performance questionnaire among workers with arthritis and rheumatological conditions. J Occup Environ Med. 2017;59:e112–e118. [DOI] [PMC free article] [PubMed] [Google Scholar]
- 35.World Health Organization . World Health Organization Health and Performance Questionnaire (HPQ): Clinical Trials Baseline Version. World Health Organization; 2002.
- 36.Nübling M, Hasselhorn HM, Michaelis M, Hofmann F. Measuring psychological stress and strain at work: evaluation of the COPSOQ Questionnaire in Germany. Psychosoc Med. 2006;3:Doc05. [PMC free article] [PubMed] [Google Scholar]
- 37.Janssen MF Pickard AS Golicki D, et al. Measurement properties of the EQ-5D-5L compared to the EQ-5D-3L across eight patient groups: a multi-country study. Qual Life Res. 2013;22:1717–1727. [DOI] [PMC free article] [PubMed] [Google Scholar]
- 38.R Core Team . R: A Language and Environment for Statistical Computing. Boston: RStudio; 2021.
- 39.Kristensen TS, Hannerz H, Høgh A, Borg V. The Copenhagen Psychosocial Questionnaire—a tool for the assessment and improvement of the psychosocial work environment. Scand J Work Environ Health. 2005;31:438–449. [DOI] [PubMed] [Google Scholar]
- 40.Koopmans L, Bernaards CM, Hildebrandt VH, de Vet HCW, van der Beek AJ. Construct validity of the Individual Work Performance questionnaire. J Occup Environ Med. 2014;56:331–337. [DOI] [PubMed] [Google Scholar]
- 41.Liu H. Comparing Welch ANOVA, a Kruskal-Wallis test, and traditional ANOVA in case of heterogeneity of variance: Richmond, VA: Virginia Commonwealth University; 2015. [Google Scholar]
- 42.Bland JM, Altman DG. Multiple significance tests: the Bonferroni method. BMJ. 1995;310:170. [DOI] [PMC free article] [PubMed] [Google Scholar]
- 43.Kessler RC. HPQ scoring doc. Boston: Harvard Medical School; 2003. [Google Scholar]
- 44.Leggett S van der Zee-Neuen A Boonen A, et al. Content validity of global measures for at-work productivity in patients with rheumatic diseases: an international qualitative study. Rheumatology. 2016;55:1364–1373. [DOI] [PubMed] [Google Scholar]
- 45.Zavala-Rojas D, Saris WE. Measurement invariance in multilingual survey research: the role of the language of the questionnaire. Soc Indicators Res. 2018;140:485–510. [Google Scholar]
- 46.Reuter M Wahrendorf M Di Tecco C, et al. Do temporary workers more often decide to work while sick? Evidence for the link between employment contract and presenteeism in Europe. Int J Environ Res Public Health. 2019;16:1868. [DOI] [PMC free article] [PubMed] [Google Scholar]
- 47.Garczynski AM, Waldrop JS, Rupprecht EA, Grawitch MJ. Differentiation between work and nonwork self-aspects as a predictor of presenteeism and engagement: cross-cultural differences. J Occup Health Psychol. 2013;18:417–429. [DOI] [PubMed] [Google Scholar]
- 48.Lu L, Cooper CL, Yen Lin H. A cross-cultural examination of presenteeism and supervisory support. Career Dev Int. 2013;18:440–456. [Google Scholar]
- 49.Schüpbach D. German or Swiss? Address and other routinised formulas in German-speaking Switzerland. In: Hajek J, Slaughter Y, eds. Challenging the Monolingual Mindset. Bristol, Buffalo & Toronto: Multilingual Matters; 2014:63–77. [Google Scholar]
- 50.Leggett S van der Zee-Neuen A Boonen A, et al. Test-retest reliability and correlations of 5 global measures addressing at-work productivity loss in patients with rheumatic diseases. J Rheumatol. 2016;43:433–439. [DOI] [PubMed] [Google Scholar]
- 51.Bundesamt für Gesundheit . Zahlen und Fakten zu nichtübertragbaren Krankheiten. Bern, Switzerland: Bundesamt für Gesundheit; 2022. Available at: https://www.bag.admin.ch/bag/de/home/zahlen-und-statistiken/zahlen-fakten-nichtuebertragbare-krankheiten.html. Accessed October 26, 2022. [Google Scholar]
- 52.Najafi F, Moradinazar M, Hamzeh B, Rezaeian S. The reliability of self-reporting chronic diseases: how reliable is the result of population-based cohort studies. J Prev Med Hyg. 2019;60:E349–e353. [DOI] [PMC free article] [PubMed] [Google Scholar]
- 53.Latkin CA, Edwards C, Davey-Rothwell MA, Tobin KE. The relationship between social desirability bias and self-reports of health, substance use, and social network factors among urban substance users in Baltimore, Maryland. Addict Behav. 2017;73:133–136. [DOI] [PMC free article] [PubMed] [Google Scholar]
- 54.Bundesamt für Statistik . Erwerbstätige (Inlandkonzept), insgesamt und in Vollzeitäquivalenten nach Geschlecht und Nationalität, brutto- und saisonbereinigte Werte. Durchschnittliche Quartals- und Jahreswerte. Neuchâtel, Switzerland: Bundesamt für Statistik; 2021. Available at: https://www.bfs.admin.ch/asset/de/je-d-03.02.01.02. Accessed October 26, 2022. [Google Scholar]
- 55.Bundesamt für Statistik . Durchschnittsalter der Erwerbsbevölkerung. Neuchâtel, Switzerland: Bundesamt für Statistik; 2020. Available at: https://www.bfs.admin.ch/bfs/de/home/statistiken/kataloge-datenbanken/medienmitteilungen.assetdetail.19087963.html#:~:text=Das%20Durchschnittsalter%20beim%20Austritt%20aus,gegen%C3%BCber%2064%2C9%20Jahren). Accessed October 26, 2022. [Google Scholar]
Associated Data
This section collects any data citations, data availability statements, or supplementary materials included in this article.