

Abstract
Objective:
Despite guidelines for HCQ toxicity screening, there are clear challenges to accurate detecting and interpretation. In the current report, the feasibility of automated machine-learning (ML) -based detection of hydroxychloroquine (HCQ) retinopathy and prediction of progression to toxicity in eyes without preexisting toxicity is described.
Design:
Retrospective longitudinal cohort study.
Subjects and methods:
This was an IRB-approved retrospective longitudinal image analysis study of 388 subjects on hydroxychloroquine. Multi-layer compartmental retinal segmentation with EZ mapping was utilized to harvest quantitative SDOCT biomarkers. Utilizing a combination of clinical features (i.e., cumulative HCQ dose, duration of therapy) and quantitative imaging biomarkers (e.g., volumetric ellipsoid zone (EZ) integrity and compartmental measurements), machine learning models were created to detect toxicity and predict progression based on ground truth OCT-based toxicity reads by 2 masked retina specialists. 10-fold cross validation was performed.
Main outcome measures:
Model performance was visualized using receiver operator curves (ROC) and calculating area under the curve (AUC). Corresponding sensitivity and specificity values were evaluated for feasibility of HCQ toxicity screening and prediction.
Results:
The prevalence of HCQ toxicity in this cohort of 388 was 9.8% (n=38). Twenty-one eyes progressed to toxicity during follow-up. OCT-based features (i.e., partial EZ attenuation, EZ volume, ONL volume, compartmental thicknesses) and clinical features (i.e., HCQ daily dose, HCQ cumulative dose, duration of therapy) showed significant differences between toxic and non-toxic groups. Percentage area with partial EZ attenuation (i.e., percentage of the macula with EZ-RPE of 20 microns or less) was the most discriminating single feature (toxic=35.7±46.5 %; non-toxic=1.8±4.4 %; p<0.0001). Utilizing a random forest model, high performance automated toxicity detection was achieved with a mean AUC of 0.97 with sensitivity 95% and specificity of 91%. Further, the toxicity progression prediction model had a mean AUC 0.89 with sensitivity and specificity of 90% and 80% respectively.
Conclusions:
This report describes the feasibility of high-performance automated classification models that utilized a combination of clinical and quantitative SDOCT biomarkers to detect HCQ retinal toxicity and in non-toxic cases, predict progression to toxicity. Future work is needed to validate these findings in an independent dataset.
Keywords: Hydroxychloroquine toxicity, Machine learning, Automated detection, Automated prediction, Optical coherence tomography, Ellipsoid zone integrity, Quantitative biomarkers for hydroxychloroquine toxicity
Precis
The current report describes the feasibility of automated machine-learning-based detection of hydroxychloroquine retinal toxicity and in eyes with no toxicity, prediction of progression to toxicity using clinical and quantitative imaging biomarkers.
Introduction
Hydroxychloroquine (HCQ) retinal toxicity is an irreversible retinopathy that has been described in patients with rheumatologic conditions requiring extended durations of therapy with HCQ.10,12,18 Retinal toxicity has been recently noted to have a prevalence of 6.3-7.5% in patients who have been taking the drug for more than 5 years.11,13 Increase in prevalence to more than 25% has been described with ongoing therapy beyond 20 years.13 Other risk factors that have been previously found to be associated with retinopathy include pre-existing macular disease, high daily HCQ dose, concurrent tamoxifen use or concurrent renal disease. 11,13 Due to the irreversible nature of this disease, early detection and timely intervention becomes of paramount importance. This emphasizes the need for early detection of toxicity for individuals on HCQ.
Guidelines established by the American Academy of Ophthalmology (AAO) in 2016 have guided screening endeavors internationally using a combination of structural and functional ancillary testing.10 Although these guidelines are well-established, the reliability of these screening strategies requires accurate test interpretation. Visual field testing may introduce subjectivity to screening while more specialized tests, such as mfERG may not be readily available in the community or can be time consuming.3 Spectral domain optical coherence tomography (SDOCT) is widely available throughout ophthalmic practices and is recommended as one of the key objective tests for evaluating for HCQ toxicity.
Key findings on SDOCT that may represent potential underlying toxicity include alterations in outer retinal integrity and decrease in retinal layer thicknesses. Although these findings have been well-described, many of these key features may be quite subtle and difficult to identify early in the disease, even for expert readers. Some of these changes relate to mild alterations in retinal compartment thickness/volume, such as focal parafoveal EZ loss. The current lack of quantitative metrics rely heavily on clinician expertise.3 Moreover, comprehensive eye care providers (i.e., general ophthalmologists, optometrists) are often at the front lines for HCQ screening that may be less familiar with these early findings.3 Providing new tools for toxicity detection that augment and facilitate clinician identification of SDOCT alterations could significantly improve risk stratification and modulate decision-making.
Recent advances, machine learning, and advanced image analysis techniques in ophthalmology have presented interesting avenues for automated screening and diagnostic methods.8,14 Previously, utilizing an advanced EZ mapping multi-layer segmentation platform to quantify outer retinal layer parameters in eyes with HCQ toxicity and demonstrated significant differences between eyes with toxicity and normal controls in quantitative extracted features.2,7,17 In the current study, machine learning-based higher-order binary classification models were developed and tested for (1) automated detection of the presence of HCQ toxicity and (2) automated prediction of progression to toxicity in eyes without clinical toxicity at baseline.
Methods
This was an Institutional Review Board-approved retrospective longitudinal image analysis study evaluating semi-automated multi-layer retinal feature assessment of eyes in consecutive patients on HCQ therapy who had sequential macular SDOCTs available for assessment at a minimum of 12-month interval. Given the retrospective nature of this analysis, a waiver of informed consent requirement was given by the IRB and informed consent was not obtained. When more than 2 imaging visits were available, the visits with the longest interval were selected for analysis. If both eyes were imaged, the right eye was used for analysis. Subjects with other clinically apparent concurrent macular disease (e.g., age-related macular degeneration, diabetic macular edema) were excluded. The study was conducted in accordance with the Declaration of Helsinki and all applicable Health Insurance Portability and Accountability Act regulation.
Clinical Characteristics
Demographic, clinical, and imaging data such as age, gender, ethnicity, visual acuity, height, weight, co-existing kidney disease, concurrent tamoxifen use, duration on HCQ, cumulative dose of HCQ, dose in mg/kg body weight per day, fundus photographs, and OCT scans were collected.
OCT imaging and feature extraction
SD-OCT scans were performed in all subjects using the macular cube protocol with the Cirrus HD-OCT (Zeiss, Oberkochen, Germany) with a raster scan pattern 512 x 128 A-scans covering a 6x6 mm fovea-centered area. A previously described semi-automated multi-layer segmentation and compartmental retinal mapping platform was utilized to extract OCT based quantitative biomarkers such as retinal layer thickness measurements and ellipsoid zone-retinal pigment epithelium (EZ-RPE) integrity maps. 2,4,5,7,17 This platform has been validated for use in normal eyes and eyes with various retinal conditions such as diabetic retinopathy, age-related macular degeneration and HCQ toxicity. 1,2,4,5,7,17 As shown in Figure 1, segmentation of the internal limiting membrane (ILM), outer boundaries of the outer plexiform layer (ONL), EZ band, and retinal pigment epithelium (RPE) was performed. The segmentation results were subsequently reviewed by a trained image analyst to manually correct for segmentation errors, as needed. All image analysts underwent standardized training for interpretation of SD-OCT with particular focus on identification outer retinal abnormalities. A senior image analyst then performed quality assessment (QA) of every image frame in the macular cube following initial manual correction. Subsequent to the QA process, although highly uncommon, any additional unresolved discrepancies in segmentation correction were assessed by group review with the principal investigator to develop a consensus approach for optimal segmentation of the specific B-scans in question. Image analysts were masked to demographic and clinical features of the patients.
Figure 1:

Multi-layer segmentation of retinal layers on OCT in a patient (A-C) without toxicity and (D-F) with toxicity; A) and D) OCT B scan corresponding to the selected slice from the volume with layer segmentation of the ILM (yellow line), ONL (green line), EZ (red line) and RPE (orange line) along with ONL-RPE thickness measurements (white brace) and EZ-RPE thickness measurements (red brace); B) and E) EZ-RPE thickness maps with the red line indicating selected B scan from the OCT volume (white arrows indicate loss of EZ integrity due to HCQ toxicity); C) and F) 3-dimensional reconstruction of the EZ-RPE layer visualizing changes in EZ integrity. OCT: Optical coherence tomography, ILM: Inner limiting membrane, ONL: Outer nuclear layer, EZ: Ellipsoid zone, RPE: Retinal pigment epithelium
Quantitative imaging biomarkers obtained from the outer retinal features were subsequently exported and evaluated. EZ-RPE thickness represented the vertical distance between EZ band to the RPE. Similarly, ONL-RPE thickness represented the vertical distance between the ONL and RPE. EZ volume was calculated using the 3-dimensional extrapolation of the area between EZ-RPE across the macular cube. ONL volume was calculated using the 3-dimensional extrapolation of the area between ONL-RPE across the macular cube. The en face EZ-RPE topographic map provided the area of total EZ attenuation (e.g., the measurement value of EZ-RPE thickness of 0 μm i.e., no EZ band visible) and partial EZ attenuation (EZ-RPE thickness ≤ 20 μm) across the macular cube to visualize overall alterations, the severity, and location of EZ loss, as previously described. 2,4,7,17 Specifically, the percentage measurement represents the percentage of thickness points of the en face map where measurement (e.g., each A-scan) between the EZ-RPE of 20 microns or less for “partial attenuation” or 0 microns for “total attenuation.”
Ground truth
The review of scans was performed with initial screening read by the first retina specialist. All completely normal scans were graded as such and removed from the review pool. Any indeterminate or suspected toxicity cases were identified. These cases were then re-pooled with controls non-toxic eyes in a 3:1 fashion. These eyes were then independently reviewed by both retina specialists and reviewed in a masked fashion. Overall agreement was good (Cohen’s kappa coefficient=0.80). Eyes with disagreement were adjudicated between both retina specialists with mutual review. Eyes were classified as “toxic” or “non-toxic” based on the identification of characteristic OCT findings, such as parafoveal outer retinal attenuation/atrophy. All eyes were reviewed in a masked fashion and when eyes changed from non-toxic at first visit (V1) to toxic at final visit (V2), the eyes were categorized as progressors.
Statistical analysis
All statistical analysis were performed using R (v4.0.1, Bell Laboratories, USA). Data normality was determined using Shapiro Wilk test. Univariate analysis was described using boxplots and means between toxic group, non-toxic group, progressor group and non-progressor groups were compared using Wilcoxon test. Statistical significance was assumed at p<0.05. Examination of the univariate analysis and ranking metrics based on overlap between groups, metrics that highly differentiated the various groups were then explored for model building.
Machine learning-based classification for toxicity detection and progression prediction
Machine learning random forest models were prepared using Python v3.9. Independent models for detection of toxicity by achieving classification between toxic and non-toxic groups at V2, and prediction of developing toxicity by achieving classification between progressors and non-progressors based on input metrics from V1 were built. The machine learning prediction models were assembled based on the identification of factors with significant differences between groups (i.e., toxic vs non-toxic, progressor vs non-progressor). In addition, known clinical risk factors were also included (e.g., daily HCQ dose, cumulative HCQ dose). Hyperparameter optimization was performed using randomized grid search and optimal parameters were used for training. Binary detection classifiers were based on random forest architecture (number of trees=400, depth=420, max features=auto) and the prediction classifier based on random forest architecture (number of trees=200, depth=100, max features=sqrt) with 10-fold cross validation. Mean receiver operator curves (ROC) were generated over the 10-folds and averaged area under the curve (AUC), sensitivity, and specificity values were calculated.
Results
Clinical characteristics and Incidence of HCQ Toxicity and Progression
A total of 388 eyes from 388 patients, with 47 men (12%) and 341 women (88%), with average age 51.6 ± 12.8 years were included in the study. Mean dose of HCQ was 367 mg/day. Mean HCQ dose as per ideal body weight was 6.6 ± 1.5 mg/kg and mean HCQ dose per actual body weight was 4.9 ± 1.5 mg/kg. Average duration on HCQ therapy at V1 and V2 were 5.8 ± 3.7 years and 8.8 ± 3.9 years respectively while average duration between V1 and V2 was 3.0 ± 1.4 years. At V1, 213 (54%) of 388 patients had more than 5 years of HCQ therapy while 63 patients (16%) had more than 10 years of therapy. At V2, 319 (82%) of 388 patients had more than 5 years of HCQ therapy while 146 patients (38%) had more than 10 years of therapy. These results along with other demographic and clinical characteristics of these patients is summarized in Table 1. Based on masked expert review, 38 eyes (9.8%) were identified to have SDOCT alterations consistent with HCQ toxicity. Of these, 21 eyes developed toxicity between V1 and V2 (i.e., progressors).
Table 1:
Demographic and clinical characteristics of 388 patients included in this study.
| Characteristic | Value |
|---|---|
| Age at HCQ start | 51.6±12.8 |
| Gender | |
| Female | 341 (87) |
| Male | 47 (13) |
| Ethnicity | |
| Caucasian | 269 (79) |
| African American | 93 (24) |
| Hispanic | 8 (2) |
| Asian | 10 (2) |
| Other or not answered | 8 (3) |
| Duration on HCQ (in years) | |
| at V1 | 6±4 |
| at V2 | 9±4 |
| HCQ dose (in mg/kg) more than 5mg/kg at V2 | 165 (42) |
| Cumulative dose of HCQ (in grams) | |
| at V1 | 780±556 |
| at V2 | 1186±592 |
| Number of patients with | |
| more than 5 years on HCQ therapy | 325 (83) |
| more than 10 years on HCQ therapy | 150 (38) |
| Primary Indication for HCQ therapy* | |
| Rheumatoid Arthritis | 165 (42) |
| Lupus | 139 (35) |
| Other | 107 (27) |
| Underlying kidney disease | 27 (7) |
| Concurrent tamoxifen citrate intake | 7 (2) |
| Number of patients diagnosed with HCQ toxicity | |
| at V1 based on ground truth | 17 (4) |
| at V2 based on ground truth | 39 (10) |
| Number of progressors between V1 and V2 based on ground truth | 22 (6) |
Sum may be more than 388 as some patients had more than one primary indications for HCQ therapy
Comparative assessment of toxic vs non-toxic groups
Duration of HCQ therapy was significantly higher in the toxic group compared to the non-toxic group (p=0.002). HCQ dose in mg/kg actual body weight (toxic=5.6±1.8; non-toxic=4.8±1.5 mg/kg; p=0.0044) as well as cumulative dose (toxic=1520±765 g; non-toxic=1144±558 g; p=0.0008) were significantly different with higher mean doses in the toxic group. Visual acuity was significantly worse in the toxic group at V2 (p=0.0004). (Figure 3)
Figure 3:
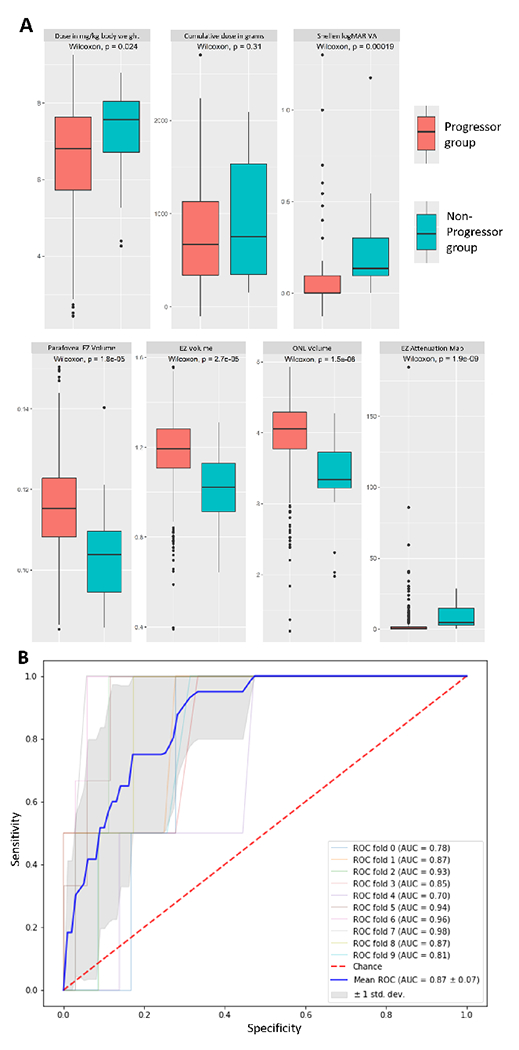
(A) Box-plot maps for the univariate analysis for clinical and imaging biomarkers comparing the progressor and non-progressor groups (n=377); (B) Receiver Operator Curve (ROC) for the toxicity prediction model with the mean area under curve (AUC) of 0.87 after 10-fold cross validation. HCQ: Hydroxychloroquine, EZ: Ellipsoid zone, VA: Visual Acuity, ONL: Outer nuclear layer, Point thickness: Layer thickness at a single point at 1 mm nasal or temporal to fovea
There was significantly greater macular partial EZ attenuation in the toxic group (toxic=35.7±46.5 %; non-toxic=1.8±4.4 %; p<0.0001). EZ-RPE volume was significantly lower in the toxic group (toxic=0.9±0.2; non-toxic=1.2±0.2; p<0.0001). EZ-RPE thickness at a point 1 mm nasal and temporal to fovea was significantly thinner in the toxic group (toxic=25.9 ±11.6; non-toxic=35.5±4.8; p<0.0001 and toxic=23.7±14.3; non-toxic=35.4±5.1; p<0.0001, respectively). ONL volume was significantly lower in the toxic group (toxic=5.6±1.8; non-toxic=4.0±0.5; p<0.0001). ONL-RPE thickness at a point 1mm nasal and temporal to fovea was also significantly lower in the toxic group (toxic=25.9 ±11.6; non-toxic=125.8±17.9; p<0.0001 and toxic=23.7±14.3; non-toxic=136.8±14.6; p<0.0001, respectively). These findings along with others have been summarized in table 2. Interestingly, when using partial EZ attenuation and a single measure screening factor, a threshold of greater than or equal to 1.9% yielded a sensitivity of 87% and specificity of 93% for identifying toxicity. A specificity optimized threshold of greater than or equal to 2.5% for this biomarker yielded a sensitivity of 82% and specificity of 95% for identifying toxicity. Figure 2A summarizes the univariate box-plots highlighting the differences between groups.
Table 2:
Comparison between toxic and non-toxic groups
| Characteristic | Toxic (n=39) | Non-Toxic (n=355) | p-value |
|---|---|---|---|
| Age at HCQ start | 59±16 | 50±10 | >0.05 |
| Gender | >0.05 | ||
| Female | 35 (92) | 306 (86) | |
| Male | 3 (8) | 49 (14) | |
| Ethnicity | >0.05 | ||
| Caucasian | 28 (72) | 241 (69) | |
| African American | 8 (23) | 85 (23) | |
| Hispanic | 1 (3) | 7 (2) | |
| Asian | 1 (3) | 9 (3) | |
| Other or not answered | - (-) | 8 (3) | |
| Duration on HCQ (in years) | 0.002 | ||
| at V1 | 8±5 | 3±3 | |
| at V2 | 11±5 | 6±3 | |
| Number of patients | |||
| more than 5 years on HCQ therapy | 37 (97) | 288 (81) | 0.02 |
| more than 10 years on HCQ therapy | 22 (59) | 128 (36) | 0.008 |
| HCQ dose (in mg/kg) more than 5mg/kg | 24 (62) | 141 (40) | 0.01 |
| Cumulative dose of HCQ (in grams) | 0.0008 | ||
| at V1 | 1088±782 | 664±510 | |
| at V2 | 1535±761 | 1028±552 | |
| Primary Indication for HCQ therapy | >0.05 | ||
| Rheumatoid Arthritis | 15 (38) | 150 (42) | |
| Lupus | 15 (38) | 124 (35) | |
| Other | 9 (24) | 81 (23) | |
| Underlying kidney disease | 2 (5) | 25 (7) | >0.05 |
| Concurrent tamoxifen citrate intake | - (-) | 7 (2) | >0.05 |
| Quantitative imaging features studied at V2 | |||
| Area of partial EZ attenuation (%) | 35.66 | 1.78 | <0.0001 |
| Area of complete EZ attenuation (%) | 22.14 | 1.44 | <0.0001 |
| Point EZ-RPE thickness 1 mm nasal to fovea | 26.02 | 35.45 | <0.0001 |
| Point EZ-RPE thickness 1 mm temporal to fovea | 23.76 | 35.35 | <0.0001 |
| Volume of EZ-RPE Compartment | 0.94 | 1.18 | <0.0001 |
| Point ONL-RPE thickness 1 mm nasal to fovea | 100.11 | 125.56 | <0.0001 |
| Point ONL-RPE thickness 1 mm temporal to fovea | 94.71 | 136.64 | <0.0001 |
| Volume of ONL-RPE Compartment | 3.05 | 3.95 | <0.0001 |
Figure 2:

(A) Box-plot maps for the univariate analysis for clinical and imaging biomarkers comparing the toxic and non-toxic groups; (B) Receiver Operator Curve (ROC) for the toxicity detection model B with the mean area under curve (AUC) of 0.97 after 10-fold cross validation. HCQ: Hydroxychloroquine, EZ: Ellipsoid zone, VA: Visual Acuity, ONL: Outer nuclear layer, Point thickness: Layer thickness at a single point at 1 mm nasal or temporal to fovea
Comparative assessment of progressors vs non-progressors
In comparing progressors to non-progressors, HCQ dose in mg/kg of actual body weight was significantly higher in progressors (progressors=5.3±1.4; non-progressors=4.8±1.5 mg/kg; p=0.02). However, duration of HCQ therapy did not differ significantly between groups (progressors=6.0±4.1 years; non-progressors=5.6±3.7 years; p=0.44). No statistically significant difference was noted in cumulative HCQ dose (progressors=843.9±591.8 g; non-progressors=744.0±516.3 g; p=0.31) between groups. Baseline visual acuity was significantly worse in progressors (p=0.0002).
The difference in the percentage area of partial EZ attenuation was highly significant with progressors showing much higher mean (progressors=9.4±8.7%; non-progressors=2.3±6.8%; p<0.0001). EZ-RPE and ONL-RPE volume were significantly lower in progressors (progressors=1.0±0.2; non-progressors=1.2±0.2; p<0.0001, and progressors=3.4±0.6; non-progressors=4.0±0.5; p<0.0001, respectively). ONL-RPE thickness at a point 1mm nasal to fovea was significantly lower progressors (progressors=116.4±21.2; non-progressors=128.6±17.8; p<0.0045). Figure 3A summarizes the univariate box-plots highlighting the differences between groups.
Machine learning-based detection and prediction models
Detection
Two unique toxicity detection models were trained with 10-fold cross validation using the clinical variables and imaging features that were selected based on the results of the univariate analysis. The first detection model included eight features: percentage area of partial EZ attenuation, ONL volume, ONL thickness at 1mm nasal from fovea, EZ volume, EZ thickness at 1 mm temporal and nasal from fovea, daily HCQ dose in (mg/kg), and cumulative HCQ dose (in g) at V2. The second detection model included four features namely percentage area of partial EZ attenuation, ONL volume, daily HCQ dose (in mg/kg), and cumulative HCQ dose (in g) at V2.
The toxicity detection classifiers yielded high levels of accuracy (AUC: 0.94-0.97). The first detection model yielded a mean AUC of 0.97 (0.92-1.00), mean sensitivity of 95%, and mean specificity of 91% over the 10-fold cross validation visualized in figure 3. The second detection model yielded an AUC of 0.95 (0.83-1.00), mean sensitivity of 93%, and mean specificity of 83%. These results along with sensitivity and specificity optimized thresholds are summarized in Table 3. Figure 2B shows the ROC curves and the mean AUC for the detection model over the 10-fold cross validation. Figures 4 and 5 demonstrate examples of false positives and false negatives in automated detection of retinal toxicity due to HCQ.
Table 3:
Detection and prediction model performance along with best performing, sensitivity optimized and specificity optimized thresholds.
| Models╲Parameters | Area Under Curve (AUC±SD) | Sensitivity (%) | Specificity (%) |
|---|---|---|---|
| Detection Model 1 | 0.97±0.03 | 95 | 91 |
| Sensitivity Optimized | 95 | 91 | |
| Specificity Optimized | 84 | 97 | |
| Detection Model 2 | 0.95± 0.05 | 93 | 83 |
| Sensitivity Optimized | 82 | 91 | |
| Specificity Optimized | 95 | 80 | |
| Prediction Model | 0.89±0.07 | 90 | 80 |
| Sensitivity Optimized | 95 | 77 | |
| Specificity Optimized | 81 | 86 |
Figure 4:

Toxicity detection model false negative (A-C) and false positive (D-G) EZ-RPE thickness maps with the red line indicating selected B scan from the OCT volume; (A,B) EZ-RPE thickness maps demonstrates classic perifoveal EZ loss consistent with hydroxychloroquine toxicity at both timepoints for this subject confirming the false negative classification. (C) B-scan shows corresponding structural findings with EZ loss. (D-G) EZ-RPE demonstrate some EZ inetegrity loss that at the second timepoint (E) may be more consistent with hydroxychloroquine toxicity; however neither scan was graded as toxic by masked review. (F, G) B-scans demonstrate abnormal retinal contour with staphylomatous alteration that may have impacted algorithm. Nevertheless, EZ attenuation does appear to be present on secondary review and may represent true toxicity (rather than a false positive). OCT: Optical coherence tomography, ILM: Inner limiting membrane, ONL: Outer nuclear layer, EZ: Ellipsoid zone, RPE: Retinal pigment epithelium
Figure 5:

Retinal abnormality resulting in false positive toxicity detection. (A) EZ-RPE thickness maps demonstrating some perifoveal EZ integrity loss including a significant area of focal loss. (B) B-scan in the area of focal loss demonstrates an isolated pocket of SRF that has resulted in EZ loss rather than a secondary loss due to hydroxychloroquine toxicity (layer segmentation of the ILM (yellow line), ONL (green line), EZ (red line) and RPE (orange line)). OCT: Optical coherence tomography, ILM: Inner limiting membrane, ONL: Outer nuclear layer, EZ: Ellipsoid zone, RPE: Retinal pigment epithelium
Prediction
A progression prediction model was trained using six features selected based on univariate comparison, specifically partial EZ macular attenuation, ONL volume, EZ panmacular volume, EZ central subfield volume, daily HCQ dose (mg/kg of ideal body weight), and cumulative dose at the baseline timepoint. The prediction classifier yielded high levels of accuracy with a mean AUC of 0.89 (0.77-0.94), sensitivity of 90%, and specificity of 80% visualized in Figure 3B. These results along with sensitivity and specificity optimized thresholds are summarized in Table 3.
Discussion
In this study, the feasibility for a novel high performance automated approach for detection of HCQ retinal toxicity using a combination of clinical and quantitative imaging features was demonstrated. Key discriminating features between toxic and non-toxic groups were percentage area of partial EZ attenuation, ONL volume, EZ volume, daily HCQ dose and cumulative HCQ dose. Percentage area of partial EZ attenuation of 1.9% or higher was associated with a sensitivity of 87% and specificity of 93% for detection of toxicity. In addition to automate detection, this study also demonstrated the opportunity for a progression prediction model. This builds on previous work that demonstrated significant quantitative retinal compartmental differences between eyes with toxicity and those without toxicity.2,7,17
As with any clinical decision tool, optimizing sensitivity/specificity is critical to understand the role of the tool and to provide guidance to clinicians on how to utilize the systems in clinical practice. Initially, a tool such as this could be use as an adjunct to clinical judgement and not to replace human interpretation. The overall toxicity detection model had a sensitivity of 95% and specificity of 91%. For toxicity detection, this performance is likely reasonable as an adjunct for clinical decision-making. Given the subtle alterations that occur early in HCQ toxicity and missed diagnoses, any tool that could potentially reduce the risk of missing toxicity could add value. The slightly lower specificity is likely acceptable as this could encourage closer scrutiny of various imaging parameters, subjective testing parameters and clinical risk factors. In regards to the progression risk model, which had a 90% sensitivity and 80% specificity, although a higher sensitivity would be ideal, given that these eyes do not have underlying toxicity, one would not likely be discontinuing the drug but perhaps beginning that discussion with the patient and rheumatologist/primary care physician. Perhaps, most importantly, this could be used as an adjunctive alert to eye care providers to be watching carefully for any additional concurrent testing abnormalities (e.g., visual field alterations, mfERG changes).”
Retinal thickness measures have been evaluated in a manual assessment fashion to evaluate eyes for the presence of toxicity in a swept source OCT device. 9 Utilizing retinal thickness deviation map, HCQ toxicity detection sensitivity and specificity between 82-95% and 80-97% respectively.9 This supports the key opportunity that quantitative compartmental and thickness measurements provide for objective detection of underlying HCQ retinopathy.
In contrast to isolated retinal thickness deviations, the automated classification models described in the current study utilize a comprehensive multi-layer segmentation and clinical features to provide a high-performance test for detection of HCQ toxicity as well as to predict eyes at highest risk for progression. The automation of detection and prediction of progression of retinopathy has a tremendous potential to address the challenges that adoption of HCQ retinopathy screening currently faces.3
The current study has several important strengths. All images were graded by two masked and experienced retina specialists. This bears merit as the signs of HCQ toxicity on OCT can be subtle. Additionally, for quantitative analysis, images were segmented using a triple-tier grading process comprising of an automated multi-layer segmentation, image analyst-guided correction and senior image analyst quality assessment. This supports quality, accuracy, and reliability of the imaging quantification pipeline. Further, these models build on existing work that describes markers and risk factors of importance in detection of HCQ toxicity and progression.17 In addition to the known clinical risk factors such as HCQ daily dose, duration of therapy, and cumulative dose, unique and innovative imaging markers that have been validated in a variety of disease states were used. 2,7,16 A combination of highly discriminating features based on univariate analysis were then chosen to train the automated classifiers that achieved high accuracy.
The current study found a higher prevalence of HCQ retinopathy (9.8%) compared to that reported in literature (6.3-7.5%).11,13 There are multiple factors that may explain this difference in findings to many of the previous reported studies. Percentage of patients in the current study that have been on HCQ therapy for more than 10 years (38%) is high. It has been reported in literature that the risk of retinal toxicity in patients on HCQ therapy longer than 10 years is 10%.11,13 This may contribute to the higher prevalence was noted in this population. Another reason could be the fact that this study was conducted at a tertiary academic facility which may include patients with a greater proportion of associated risk factors. Finally, the disagreement in prevalence can be explained by the possibility of HCQ toxicity still being underdiagnosed. An important discriminating factor was that in this study, toxicity was determined by OCT alone and did not consider concurrent testing. Based on the findings on OCT, it is thought that these do accurately represent toxicity. Adding additional testing would have likely only identified additional alterations. Finally, all testing was reviewed by retina specialists with specific targeted review for subtle OCT changes. The potential for automated detection of risk or progression have great potential to impact clinical practice for both retina and non-retina specialists. Utilizing an automated risk assessment tool could significantly impact the threshold for additional testing, dose reduction, or specialist referral. HCQ retinopathy is a challenging diagnosis and stakes can be high as progression can continue even after cessation of therapy.15 In rheumatology and primary care medical practices, an automated tool such as one described in this report may be used to identify patients that need further testing and a close follow up with a retina specialist. Further, the prediction model described in this study can predict progression to toxicity and this can provide the opportunity for early cessation of HCQ therapy. Detection of toxicity and prediction of progression in currently non-toxic eyes using an automated tool has the potential to reduce clinic burden in ophthalmology and rheumatology offices.
This study has important limitations that should also be acknowledged. The retrospective nature of this study may limit the generalizability of results described in this study. Although the quality-controlled approach to segmentation accuracy adds strength for the overall segmentation results, this also limits the ability to assess a purely automated approach to multi-layer segmentation. Additional validation is needed with next generation algorithms that are image analyst independent. Prospective clinical studies evaluating longitudinal alterations and correlation with functional testing is also of key importance. An additional important limitation of the current study’s prediction model is the high variability of follow-up time. Although it is encouraging that the prediction model achieved the performance within a wide-variability of follow-up periods, a more targeted timing for risk assessment would be ideal for clinical applications (e.g., 2-year risk, 5-year risk). Further studies are currently being planned to enable a more discrete time-gated prediction model.
HCQ retinal toxicity screening using machine learning based automated tools is feasible and classification performance is high. Although this study focused on OCT, the addition of quantifiable or even binary features of additional diagnostic testing could potentially add value to machine learning models in the future. This could include quantifiable near infra-red and short-wavelength auto fluorescence6, alterations on mfERG, and visual field data. The inclusion of these features with machine learning methods have the potential to improve performance further. However, the widespread availability of OCT across practices and potentially limited availability of other imaging demonstrates the potential value of an OCT-only derived model that could include adjuvant imaging data for enriched assessment. Prediction of the development of future toxicity using existing clinical and imaging based quantitative biomarkers can also be performed with modest accuracy. Future research in this area is needed to validate these findings in external datasets.
Funding:
Funding was in part provided by NIH/NEI K23-EY022947-01A1 (JPE); Research to Prevent Blindness (Cole Eye Institutional Grant).
Financial Disclosures:
No direct conflict of interests for any authors for this manuscript. KET receives research support from Zeiss. SKS receives research support from Allergan and is a consultant for Bausch and Lomb, Novartis, Adverum, and Regeneron. JPE is also a consultant for Allegro, Zeiss, Alcon, Allergan, Regeneron, Adverum, Stealth, RegenexBIO, Thrombogenics, Novartis, Iveric Gio and Aerpio. JPE receives research support from Regeneron, Genentech, Novartis, Alcon, Stealth, Adverum, IvericBio, and Allergan. No other specific conflicts of interest exist related to this study for any of the other authors.
Footnotes
Publisher's Disclaimer: This is a PDF file of an unedited manuscript that has been accepted for publication. As a service to our customers we are providing this early version of the manuscript. The manuscript will undergo copyediting, typesetting, and review of the resulting proof before it is published in its final form. Please note that during the production process errors may be discovered which could affect the content, and all legal disclaimers that apply to the journal pertain.
REFERENCES
- 1.Arepalli S, Srivastava SK, Hu M, et al. Assessment of inner and outer retinal layer metrics on the Cirrus HD-OCT Platform in normal eyes. PLoS One 2018; 13(10): e0203324. [DOI] [PMC free article] [PubMed] [Google Scholar]
- 2.Arepalli S, Traboulsi EI, Ehlers JP. Ellipsoid zone mapping and outer retinal assessment in Stargardt disease. Retina (Philadelphia, Pa) 2018; 38(7): 1427. [DOI] [PMC free article] [PubMed] [Google Scholar]
- 3.Cukras C, Huynh N, Vitale S, Wong WT, Ferris FL, Sieving PA. Subjective and Objective Screening Tests for Hydroxychloroquine Toxicity. Ophthalmology 2015; 122(2): 356–66. [DOI] [PMC free article] [PubMed] [Google Scholar]
- 4.Ehlers JP, Uchida A, Hu M, et al. Higher-Order Assessment of OCT in Diabetic Macular Edema from the VISTA Study: Ellipsoid Zone Dynamics and the Retinal Fluid Index. Ophthalmology Retina 2019;3(12): 1056–66. [DOI] [PMC free article] [PubMed] [Google Scholar]
- 5.Ehlers JP, Zahid R, Kaiser PK, et al. Longitudinal Assessment of Ellipsoid Zone Integrity, Subretinal Hyperreflective Material, and Subretinal Pigment Epithelium Disease in Neovascular Age-Related Macular Degeneration. Ophthalmology Retina 2021. [DOI] [PMC free article] [PubMed] [Google Scholar]
- 6.Greenstein VC, Lima de Carvalho JR Jr., Parmann R, et al. Quantitative Fundus Autofluorescence in HCQ Retinopathy. Investigative Ophthalmology & Visual Science 2020; 61(11): 41-. [DOI] [PMC free article] [PubMed] [Google Scholar]
- 7.Itoh Y, Vasanji A, Ehlers JP. Volumetric ellipsoid zone mapping for enhanced visualisation of outer retinal integrity with optical coherence tomography. British Journal of Ophthalmology 2016;100(3): 295–9. [DOI] [PMC free article] [PubMed] [Google Scholar]
- 8.Kalra G, Kar SS, Sevgi DD, Madabhushi A, Srivastava SK, Ehlers JP. Quantitative Imaging Biomarkers in Age-Related Macular Degeneration and Diabetic Eye Disease: A Step Closer to Precision Medicine. Journal of Personalized Medicine 2021; 11(11). [DOI] [PMC free article] [PubMed] [Google Scholar]
- 9.Kim KE, Ahn SJ, Woo SJ, et al. Use of OCT Retinal Thickness Deviation Map for Hydroxychloroquine Retinopathy Screening. Ophthalmology 2021; 128(1): 110–9. [DOI] [PubMed] [Google Scholar]
- 10.Marmor MF, Kellner U, Lai TY, Melles RB, Mieler WF. Recommendations on screening for chloroquine and hydroxychloroquine retinopathy (2016 revision). Ophthalmology 2016; 123(6): 1386–94. [DOI] [PubMed] [Google Scholar]
- 11.Marshall E, Robertson M, Kam S, Penwarden A, Riga P, Davies N. Prevalence of hydroxychloroquine retinopathy using 2018 Royal College of Ophthalmologists diagnostic criteria. Eye 2021; 35(1): 343–8. [DOI] [PMC free article] [PubMed] [Google Scholar]
- 12.Mavrikakis I, Sfikakis PP, Mavrikakis E, et al. The incidence of irreversible retinal toxicity in patients treated with hydroxychloroquine: a reappraisal. Ophthalmology 2003; 110(7): 1321–6. [DOI] [PubMed] [Google Scholar]
- 13.Melles RB, Marmor MF. The Risk of Toxic Retinopathy in Patients on Long-term Hydroxychloroquine Therapy. JAMA Ophthalmology 2014; 132(12): 1453–60. [DOI] [PubMed] [Google Scholar]
- 14.Petri M, Elkhalifa M, Li J, Magder LS, Goldman DW. Hydroxychloroquine blood levels predict hydroxychloroquine retinopathy. Arthritis & rheumatology 2020; 72(3): 448–53. [DOI] [PMC free article] [PubMed] [Google Scholar]
- 15.Pham BH, Marmor MF. SEQUENTIAL CHANGES IN HYDROXYCHLOROQUINE RETINOPATHY UP TO 20 YEARS AFTER STOPPING THE DRUG: Implications for Mild Versus Severe Toxicity. RETINA 2019;39(3). [DOI] [PubMed] [Google Scholar]
- 16.Uchida A, Pillai JA, Bermel R, et al. Outer retinal assessment using spectral-domain optical coherence tomography in patients with Alzheimer’s and Parkinson’s disease. Investigative ophthalmology & visual science 2018; 59(7): 2768–77. [DOI] [PMC free article] [PubMed] [Google Scholar]
- 17.Ugwuegbu O, Uchida A, Singh RP, et al. Quantitative assessment of outer retinal layers and ellipsoid zone mapping in hydroxychloroquine retinopathy. British Journal of Ophthalmology 2019; 103(1): 3. [DOI] [PMC free article] [PubMed] [Google Scholar]
- 18.Yusuf I, Sharma S, Luqmani R, Downes S. Hydroxychloroquine retinopathy. Eye 2017; 31(6): 828–45. [DOI] [PMC free article] [PubMed] [Google Scholar]