

Abstract
Aims:
To estimate whether and to what extent extending indoor smoking restrictions to include electronic cigarettes (ECs) impact the use of ECs and cigarette smoking among adults in the US.
Design:
Observational study using a linear probability model and applying a difference-in-differences analysis
Setting:
USA
Participants:
People aged 18 to 54 who lived in US counties where comprehensive indoor smoking laws in bars, restaurants, and private workplaces have been in place prior to 2010 (N = 45,111 for EC use analysis, N = 75,959 for cigarette use analysis).
Measurements:
Data on cigarette smoking, use of ECs, and place of residence from the Tobacco Use Supplement of the Current Population Survey (TUS-CPS 2010–2011, 2014–2015, and 2018–2019) were combined with the American Nonsmokers’ Rights Foundation (ANRF) database of state and local indoor smoking and vaping restriction laws.
Findings:
Indoor vaping restriction (IVR) coverage was not significantly associated with the likelihood of adult EC use (coefficient estimate = 0.001; 95% confidence interval [CI] =−0.009, 0.013, P-value = 0.783). In addition, IVR coverage was not significantly associated with adult cigarette smoking (coefficient estimate = −0.00; 95% CI = −0.016, 0.015, P-value = 0.954). The non-significant results appeared in different socio-demographic subgroups.
Conclusions:
Indoor vaping restrictions do not appear to decrease electronic cigarette use among US adults. There is no evidence that indoor vaping restrictions increase or decrease cigarette smoking among US adults.
Keywords: Indoor vaping restrictions, Vapefree air laws, Vaping, Substitutability, E-cigarettes, Nicotine vaping products
INTRODUCTION
Electronic nicotine delivery systems, commonly known as e-cigarettes (ECs), are relatively new tobacco products that gained market share in the US after 2010.[1, 2] As of 2019, among the US adult population, an estimated 50.6 million – about 20.8% – currently used any tobacco product, with cigarettes the most commonly-used product at a smoking prevalence of 14%; ECs were the most commonly-used non-cigarette product with a use prevalence of 4.5%.[3]
As of August 2020, 22 US states and 970 localities had prohibited the use of ECs in venues in which conventional cigarette smoking was prohibited.[4] The purpose of indoor vaping restrictions (IVR) is to protect bystanders from any adverse health effects due to exposure to vaping aerosols and promote compliance with indoor smoking restrictions (ISRs). The evidence on the adverse health impact of exposing bystanders to vaping aerosols is limited and mostly supports the view that EC aerosols are much less toxic compared to cigarette smoke.[5–8] Nonetheless, many localities have extended their smoking restrictions to include vaping restrictions.
There is a large body of published evidence showing that ISRs reduce smoking rates and secondhand smoke exposure.[9–12] It is conceivable that IVR laws will have a similar impact on vaping behavior and cause a reduction in EC use.
Furthermore, IVRs, by reducing the appeal and convenience of EC use, may influence cigarette use through various channels such as 1) affecting interest in cigarette quitting through changes in social norms and acceptability of nicotine product use; and/or 2) affecting cigarette use through the extent to which ECs could be used to replace cigarette use versus other alternative methods (e.g., cold turkey, nicotine replacement therapy products), conditional on making a quit attempt. If IVRs increase (decrease) interest in quitting cigarette use, we may observe that IVRs increase (decrease) cigarette quit attempts and actual cigarette quitting. Conditional on making a quit attempt, if IVRs decrease (increase) the use of ECs for quitting cigarette use versus other quitting methods, we may observe that IVRs increase (decrease) cigarette use if ECs are more effective than other products for smoking cessation, as has been suggested by a Cochrane review.[13]
Several difference-in-differences studies have investigated the impact of IVRs on cigarette smoking and EC use. Cooper and Pesko[14] used US birth records between 2010 and 2015 to examine the effect of IVR coverage at the county level on prenatal smoking. They found that a comprehensive IVR added to an existing comprehensive ISR increased prenatal smoking, suggesting that pregnant women may use ECs to substitute for cigarette smoking. Friedman and colleagues[15] used National Health Interview Survey data from 2014–2018 to examine the association between IVRs and adult (ages 18–54 years) cigarette smoking and EC use. They found that adding vaping restrictions to smoke-free worksite laws was not associated with either a reduction in EC use or an increase in cigarette smoking. A recent study of Canadian provincial IVRs on adult EC use and smoking between 2013 and 2017 found that the IVRs had no impact on cigarette use or past-30-day EC use.[16] One recent study of ISRs found no statistically significant effects of ISRs on EC purchases among adult households.[17]
Our study investigated how extending ISRs to include ECs impacted adult EC use and cigarette use. Our study adds to the current body of literature by employing the Tobacco Use Supplement to Current Population Survey, a national and individual-level dataset, and extending the analysis to the 2011–2019 time frame.
METHODS
Data
Individual-level data come from the Tobacco Use Supplements to Current Population Survey (TUS-CPS) 2010–2011, 2014–2015, and 2018–2019. TUS-CPS is sponsored by the National Cancer Institute and administered as part of the US Census Bureau’s Current Population Survey. The supplement universe represents non-institutionalized civilians aged 18 and older. This survey details smoking history and current use patterns of every day smokers, some days smokers, former smokers, and never smokers. In addition to cigarette smoking, starting in 2014, questions on use of other nicotine products (e.g., ECs) are included in the survey. The demographics provided by TUS-CPS include gender, age, race, educational attainment, employment status, marital status, and family income.
The American Nonsmokers’ Rights Foundation (ANRF) database provides detailed information on ISRs and IVRs at the state, county, and city levels. The database includes date of implementation, venues covered by the law (workplace, restaurant, and bar venues), and strength of the laws (100% smoke/vape-free, partial restrictions, and no restriction at all). The fraction of the population within a US county covered by a comprehensive IVR was calculated by combining the ANRF database with the Census-Estimated Population (CEP) Cities and Towns (Vintage 2019 all states, all geographies data file) database.
Other state-level factors, such as unemployment rate and per capita gross domestic product by state, were obtained from the University of Kentucky Center for Poverty Research. State-level cigarette excise tax data were obtained from Orzechowski and Walker.[18] The effective dates of EC taxes were collected from the CDC State System (2019)[19] and the Vapor Products Tax Data Center (2019).[20]
Measurement
Dependent variables: Individual vaping and smoking status
In the main model specifications, dependent variables included binary indicators of vaping and smoking status. EC use was coded 1 for those who currently used ECs every day or some days, and 0 for those who did not currently use ECs. Cigarette use was coded 1 for those who currently smoked cigarettes every day or some days and had smoked at least 100 cigarettes in their lifetime, and 0 for those who did not currently smoke or had not smoked 100 cigarettes in their lifetime.
Independent variable: IVR coverage
The county-level IVR coverage variable indicates the proportion of county population covered by an IVR that is comprehensive in nature, meaning that it bans EC use in all indoor areas without exemptions. This coverage takes into account all laws in place at that particular point in time at the state, county, and smaller levels of government. State preemption of local legislation was also taken into account in our IVR measure. If a state preempted local legislation, we assumed that from that point forward city- and county-level IVRs are identical to the state-level IVR. Additionally, venue-specific versions of the variable (i.e., IVR coverages in workplaces, restaurants, and bars) are created meeting the same criteria.
The probability of IVR coverage ranged from 0 (no one in the county is covered by a comprehensive IVR) to 1 (the entire population of the county is covered by a comprehensive IVR).
Other covariates
Individual-level variables included gender (male, female), age group (18–24 years old, 25–34 years old, 35–44 years old, and 45–54 years old), race (White, Black, Hispanic, Other), educational attainment (less than high school, high school graduate, some college, college and above), employment status (employed, unemployed, not in labor force), family income (less than $19,999, $20,000 – $39,999, $40,000 – $74,999, $75,000 – $14,999, >$150,000) and marital status (married, never married, other status). State- and county-level variables included unemployment rate, state gross domestic product per capita, cigarette tax, EC tax, Tobacco 21 laws, and medical marijuana laws. The EC tax variable was constructed as a binary variable indicating the existence of EC tax (1) and absence of EC tax (0). The variable of county Tobacco 21 law (T21) coverage, ranging from 0 to 1, was constructed by computing the proportion of county population covered by T21 law, taking into account such laws at the city, county, and state levels.[21] Finally, a set of county and year-month indicator variables were included in the regression to capture the time-invariant county-specific effects as well as the time-specific seasonality effects. All dollar values for variables were adjusted by the consumer product index (CPI) with 2019 as the base year.
Study Sample
We merged the individual survey data, TUS-CPS from 2010–2019, with the state-level factors (unemployment rate, per capita gross state product, EC tax, cigarette tax), and county-level factors (IVR coverage, T21 coverage) by year-month, state, and county identifiers.
Since TUS-CPS only released county identifiers for counties with population size greater than 200,000, we restricted the sample to the 40.6% of respondents with county geocodes. Additionally, we restricted the sample to adult respondents aged 18 and above but under age 55 to reduce the impact of differential mortality by smoking status. Finally, we restricted the sample to those who lived in counties where state- or local-level comprehensive ISRs have been in place since prior to 2010, the year of the first wave of TUS-CPS. This sampling restriction aims to isolate the IVR impact when added to existing comprehensive ISRs. Our analytic sample size is 45,671 respondents for EC use analysis from 2014 to 2019 and 76,100 respondents for cigarette use analysis from 2010 to 2019. Another recent study using TUS-CPS data also used 2010–19 data for cigarette use and 2014–19 data for EC use.[22] We excluded those who had missing information for EC use (n = 560) which leads to N = 45,111 for EC use regression. We excluded those who had missing information for cigarette use (n = 141) which leads to N = 75,959 for cigarette use regression.
Data Analysis
A generalized difference-in-differences (DID) model was estimated to study the effect of county IVR coverage on EC use and cigarette use, respectively, as shown below:
where i indexes an individual residing in state s of county c at year-month t. We ran a separate weighted linear probability model for EC use and cigarette use equation. In the equation, denotes EC or cigarette use status; both are binary variables, coded as 1 if the respondents are current users of the product and 0 if they are former and never users. is the mean value of the county-level IVR coverage. represents the demographics of each respondent, such as gender, age, race, education, employment status, etc. is a series of state- and county-level time-varying variables, including unemployment rate, state gross domestic product per capita, cigarette tax, EC tax, Tobacco 21 laws, and medical marijuana laws. and represent time fixed effects (year-month) and county fixed effects; both control for unobserved confounders which do not vary over time or across counties. Standard errors were clustered at the county level because unobservable factors may be correlated within each county.
The coefficient on is the effect of IVR coverage on use of nicotine product (i.e., cigarette use and EC use, respectively), and our identification of IVR impact relies on differences in use between respondents covered with higher IVRs and those with lower IVRs (or no IVRs) within year-month, state, and county. If IVR coverage increased (decreased) EC use, we would expect a positive (negative) sign of the estimate of β in the EC use regression. If IVR coverage increased (decreased) cigarette use, we would expect a positive (negative) sign of the estimate of β in the cigarette use regression. The results should be considered exploratory, as the analysis was not pre-registered.
RESULTS
Summary Statistics
Table 1 presents summary statistics of the study sample. On average, the prevalence of current smokers was 13% and every day smokers was 9.9% between 2010 and 2019. The prevalence of current EC users was 2.5% and every day EC users was 1.0% between 2014 and 2019. In our study sample, the average county IVR coverage in workplaces, restaurants, and bars was 24.6%, 26.6%, and 26.6%, respectively.
Table 1:
Summary Statistics of the Study Sample
| Variable | OBS | Percentage or mean |
|---|---|---|
| Outcomes | ||
| Current Smokers (daily and some days) | 10110 | 13.3% |
| Daily smokers | 7267 | 9.9% |
| Non-current smokers | 65849 | 86.5% |
| Missing | 141 | 0.1% |
| Current EC users (daily and some days)* | 1155 | 2.5% |
| Daily EC users* | 441 | 0.9% |
| Non-current EC users* | 43956 | 96.2% |
| Missing* | 560 | 1.2% |
| IVR coverage | ||
| County IVR coverage in bars | 26.6% | |
| County IVR coverage in restaurants | 26.6% | |
| County IVR coverage in workplaces | 24.6% | |
| Average of county IVR coverage in three venues | 25.9% | |
| Socio- demographics | ||
| Gender | ||
| Male | 34,959 | 45.9% |
| Female | 41,141 | 54.1% |
| Age groups | ||
| Age 18–24 (reference group) | 7,131 | 9.3% |
| Age 25–34 | 19,849 | 26% |
| Age 35–44 | 20,280 | 26.6% |
| Age 45–54 | 20,255 | 26.6% |
| Ethnicity | ||
| White (reference group) | 43,777 | 57.5% |
| Black | 8,108 | 10.6% |
| Hispanic | 15,327 | 20.1% |
| Other races | 8,888 | 11.6% |
| Educational attainment | ||
| Less than high school | 7,006 | 9.2% |
| High school (reference group) | 16,858 | 22.1% |
| College but no degree | 21,082 | 27.7% |
| College degree or higher | 31,154 | 40.9% |
| Employment status | ||
| Employed (reference group) | 58,123 | 76.3% |
| Unemployed | 4,518 | 5.9% |
| Not in labor force | 13,459 | 17.6% |
| Marital Status | ||
| Married (reference group) | 37,379 | 49.1% |
| Never married | 28,558 | 37.5% |
| Other marital status | 10,163 | 13.3% |
| Household income | ||
| Income <19999(reference group) | 10,689 | 14% |
| Income 20000–39999 | 14,407 | 18.9% |
| Income 40000–74999 | 19,661 | 25.8% |
| Income 75000–149999 | 21,019 | 27.6% |
| Income >150000 | 10,324 | 13.5% |
| State- and county-level characteristics | ||
| Unemployment rate | 6.8% | |
| State GDP per capita | 74943.12 | |
| Medical marijuana laws | 74.7% | |
| Cigarette tax in dollars | 2.23 | |
| E-cigarette tax indicator | 12.8% | |
| County-level Tobacco 21 law coverage | 16.1% | |
| Observations | 76,100 |
Notes: The sample is restricted to self-respondents aged 18–54, and those living in counties with state- or local-level comprehensive smoking bans. The dollar values have been adjusted by CPI (year 2019=100).
The sample size is 45,671 for TUS-CPS 2014–2019.
Figure 1 indicates the time trends of IVR coverage in workplaces, restaurants, and bars from 2010–2019 in our study sample. The average IVR coverage among the three venues of workplaces, restaurants, and bars was 2% in 2010, and increased to 71% in 2019. The venue-specific IVR coverage increased from 2% to 69% in workplaces; from 2% to 71.6% in restaurants; and from 2% to 71.6% in bars from 2010 to 2019
Figure 1:
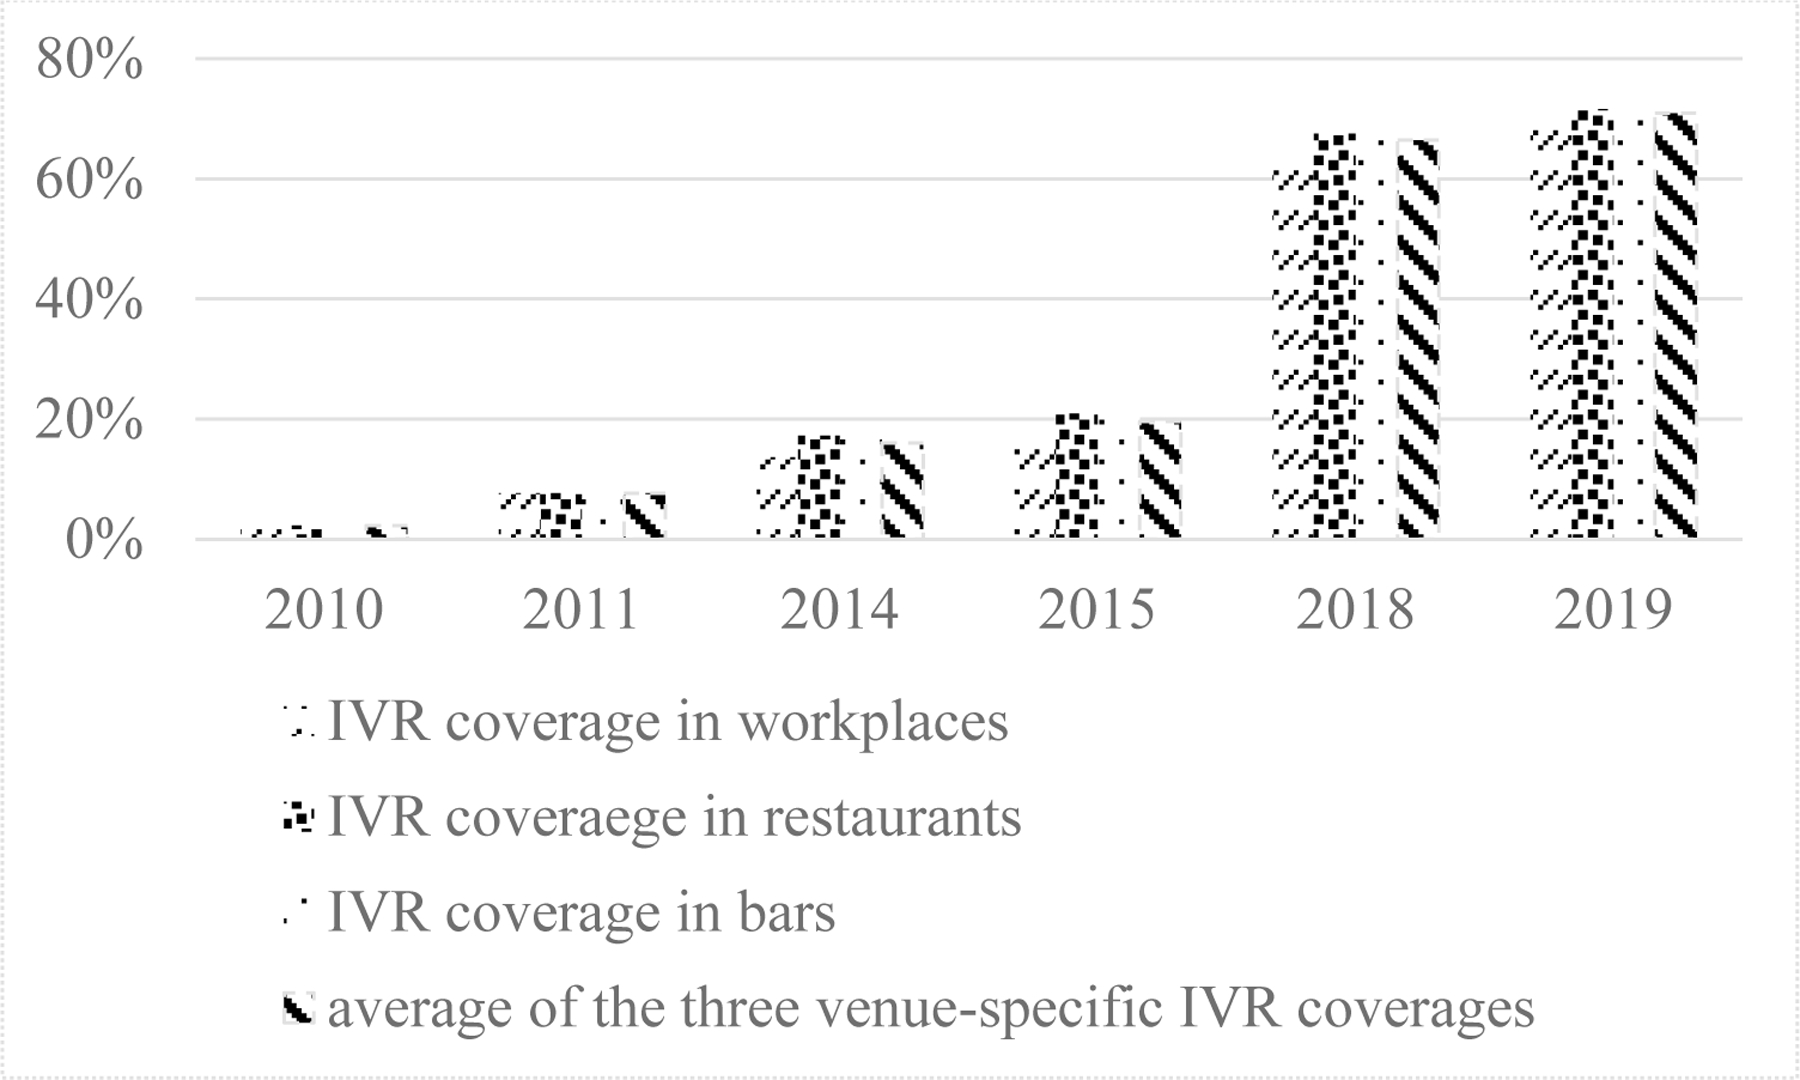
County-level IVR coverage in workplace, restaurant, and bar venues from 2010 to 2019
Regression Results
Table 2 provides the effects of IVR on EC use for the entire sample and for each demographic subgroup of age, gender, educational attainment, and household income, respectively. The results show that overall IVR did not significantly impact the likelihood of EC use (coefficient estimate = 0.001; 95% CI =−0.009, 0.013, P-value=0.783), which translates to approximately a 5% increase from the mean. IVR coverage was associated with statistically insignificant reduced EC use for individuals aged 18–35 (coefficient estimate = −0.002 (~ −8%); 95% CI =−0.024, 0.018, P-value=0.784), males (coefficient estimate = −0.000 (~ −1%); 95% CI =−0.018, 0.175, P-value=0.96), individuals with college and above educational attainment (coefficient estimate = −0.004 (~ −25%); 95% CI =−0.015, 0.006, P-value=0.401), and individuals with lower household income (coefficient estimate = −0.001 (~ −5%); 95% CI =−0.016, 0.128, P-value=0.826).
Table 2:
Linear probability model estimating effects of IVR coverage in bars, restaurants, and workplaces on EC use 2014/2015 & 2018/2019
| Age | Educational Attainment | Household Income | Gender | ||||||
|---|---|---|---|---|---|---|---|---|---|
| Entire Sample+ | Aged 18–35 | Aged 36–54 | HS or less | college or more | <75K | 75K+ | Male | Female | |
| IVR average | 0.001 | −0.002 | 0.006 | 0.005 | −0.004 | −0.001 | 0.007 | −0.00 | 0.004 |
| 95% CI | −0.009, 0.013 | −0.024, 0.018 | −0.003, 0.016 | −0.013, 0.024 | −0.015, 0.006 | −0.016, 0.012 | −0.009, 0.023 | −0.018, 0.017 | −0.007, 0.015 |
| P-value | 0.783 | 0.784 | 0.217 | 0.579 | 0.401 | 0.826 | 0.396 | 0.966 | 0.490 |
| Percentage change | 5.8% | −8.1% | 33.2% | 15.4% | −25.3% | −5.1% | 34% | −1% | 20% |
| Observations | 45,111 | 18,309 | 26,800 | 20,662 | 24,447 | 24,560 | 20,548 | 20,841 | 24,269 |
Note:
Entire Sample contains adults aged 18–54. Models controlled for gender, age, race, educational attainment, and employment status, time and state fixed effects, and state- and county-level time-varying variables (unemployment rate, gross state product per capita, cigarette tax, EC tax, Tobacco 21 laws, and medical marijuana laws). IVR average is the average of venue-specific IVR coverages in workplaces, restaurants and bars. Standard errors clustered to the county level.
Table 3 presents the effects of IVR coverage on cigarette use for the entire sample and for each demographic subgroup of age, gender, educational attainment, and household income, respectively. Overall, IVR coverage did not have a statistically significant impact on the likelihood of cigarette use (coefficient estimate = −0.000 (~ −0.3%); 95% CI =−0.016, 0.151, P-value=0.954). In subsample analysis, IVR coverage was associated with statistically insignificant increases in cigarette use for individuals aged 36–54 (coefficient estimate = 0.009 (~7.9%); 95% CI =−0.008, 0.028, P-value=0.293), females (coefficient estimate = 0.005 (~4.9%); 95% CI =−0.010, 0.020, P-value=0.514), and individuals with household incomes of $75K+ (coefficient estimate = 0.001 (~1.1%); 95% CI =−0.016, 0.182, P-value=924), while IVR coverage was associated with statistically insignificant reduced cigarette use in other subgroups, including individuals aged 18–35 (coefficient estimate = −0.009 (~ −7.3%); 95% CI =−0.032, 0.149, P-value=0.462), males (coefficient estimate = −0.005 (~ 3.6%); 95% CI =−0.030, 0.020 P-value=0.688), and individuals with household income less than 75K (coefficient estimate = −0.001 (~ −1.0%); 95% CI =−0.025, 0.022, P-value=0.895).
Table 3:
Linear probability model for estimating the effects of IVR coverage on cigarette use2010/2011, 2014/2015, and 2018/2019
| Cigarette Use | |||||||||
|---|---|---|---|---|---|---|---|---|---|
| Age | Educational Attainment | Household Income | Gender | ||||||
| Entire Sample+ | Aged 18–35 | Aged 36–54 | HS or less | college or more | Income <75K | Income75K+ | Male | Female | |
| IVR average | −0.000 | −0.008 | 0.009 | −0.002 | −0.003 | −0.001 | 0.000 | −0.005 | 0.005 |
| 95% CI | −0.016, 0.015 | −0.032, 0.014 | −0.008, 0.028 | −0.028, 0.023 | −0.016, 0.008 | −0.025, 0.022 | −0.016, 0.018 | −0.030, 0.020 | −0.010, 0.020 |
| P-value | 0.954 | 0.462 | 0.293 | 0.832 | 0.536 | 0.895 | 0.924 | 0.688 | 0.514 |
| Percentage change | −0.37% | −7.3% | 7.9% | −1.6% | −5.8% | −1.0% | 1.1% | −3.6% | 4.9% |
| Observations | 75,959 | 310,22 | 44,937 | 37,770 | 38,189 | 44,669 | 31,289 | 34,885 | 41,074 |
Notes:
Entire Sample contains adults aged 18–54. Smoking status and IVR coverage are measured in current month. Models controlled for gender, age, race, educational attainment, and employment status, time and state fixed effects, and state- and county-level time-varying variables (unemployment rate, gross state product per capita, cigarette tax, EC tax, Tobacco 21 laws, and medical marijuana laws). IVR average is the average of venue-specific IVR coverages in workplaces, restaurants and bars. Standard errors are clustered to the county level.
Table 4 shows the results of sensitivity analyses in which we re-ran the model without survey weights and used a logit functional form. The sensitivity analyses found that IVR coverage is not associated with statistically significant changes in EC use or cigarette use. In addition, we restricted the samples to include every day users only and current employees only, respectively, and we included adults aged 55 years and above. We studied the impact of worksite IVR coverage on cigarette use and EC use among the currently employed because the currently employed may be more directly impacted by worksite IVRs. Results from these sensitivity analyses continued to find non-significant effects of IVR on EC use and cigarette use.
Table 4:
Sensitivity analysis for effects of IVR coverage on EC use and cigarette use
| EC Use | Cigarette Use | |||||||||
|---|---|---|---|---|---|---|---|---|---|---|
| Unweighted LPM | Unweighted Logit | LPM Daily users only | LPM employed | Including aged 55+ | Unweighted LPM | Unweighted Logit | LPM Daily users only | LPM employed | Including aged 55+ | |
| IVR average | 0.003 | 1.215 | −0.002 | 0.002 | 0.003 | 0.993 | −0.000 | −0.000 | ||
| 95% CI | −0.005, 0.012 | 0.845, 1.746 | −0.008, 0.003 | −0.006, 0.010 | −0.009, 0.015 | 0.870, 1.134 | −0.013, 0.013 | −0.012, 0.010 | ||
| IVR workplace | 0.001 | −0.001 | ||||||||
| 95% CI | −0.012, 0.014 | −0.018, 0.014 | ||||||||
| P-value | 0.430 | 0.293 | 0.460 | 0.867 | 0.575 | 0.634 | 0.919 | 0.956 | 0.817 | 0.874 |
| Observations | 45,111 | 43,957 | 44,397 | 35,404 | 74,006 | 75,959 | 75,959 | 72,883 | 58,013 | 119,516 |
Notes: Entire sample contains adults aged 18–54. Smoking status and IVR coverage are measured in current month. Models controlled for gender, age, race, educational attainment, and employment status, time and state fixed effects, and state- and county-level time-varying variables (unemployment rate, gross state product per capita, cigarette tax, EC tax, Tobacco 21 laws, and medical marijuana laws). IVR average is the average of venue-specific IVR coverages in workplaces, restaurants and bars. Standard errors are clustered to the county level.
DISCUSSION
Our study did not find that IVRs decreased EC use overall or for any socio-demographic subgroup. Neither was the effect of IVRs on cigarette use apparent. The impact of IVRs on cigarette use was also not statistically significant overall or for subgroups. Our findings are consistent with the findings from Friedman et al. (2021) and Nguyen and Bornstein (2021) who reported that adding vaping restrictions to current smoke-free venues appears not to reduce EC use or impact cigarette use among adults. Our findings differ from results reported by Cooper and Pesko[14] who reported that IVRs significantly increased prenatal smoking, possibly suggesting that there are differences in responsiveness between general adults and pregnant women, or between time periods (2010–2019 in the current study versus 2010–2015 in theirs).
Our study has a number of limitations. First, the sample is not fully representative of the US population since the data are restricted to individuals living in large counties with a population size greater than 200,000 and covered by comprehensive state or local indoor smoking bans by 2010, the year of the first wave of TUS-CPS used in this analysis. This sampling restriction aims to isolate the IVR impact when added to existing comprehensive ISRs. Second, the main outcomes for our study, individual current status of EC use and cigarette use, do not reflect other relevant margins of tobacco product use such as initiation or cessation. Third, the IVR coverage mandated by law likely is different from actual IVR coverage since many venues may voluntarily adopt IVRs in the absence of a law; or some venues may actively defy or fail to comply with IVR laws. While studies have found that comprehensive smoke-free laws achieved high levels of enforcement and compliance,[23–25] little is known regarding enforcement of and compliance with IVR laws.
Despite these limitations, our study provides insights on the impact of adding vaping restrictions to current smoke-free air laws on EC use and cigarette use. While decreases in cigarette use in response to ISRs are widely observed in previous literature, IVRs do not appear to reduce EC use. There was no evidence in this large national sample that IVRs increased or decreased cigarette smoking.
Acknowledgements:
This paper is funded by grant P01-CA200512 (National Cancer Institute) and grant R01DA045016 (National Institute on Drug Abuse).
Footnotes
G.T.F. has served as an expert witness on behalf of governments in litigation involving the tobacco industry. K.M.C. has received payment as a consultant to Pfizer, Inc, for service on an external advisory panel to assess ways to improve smoking cessation delivery in health care settings. K.M.C. also has served as a paid expert witness in litigation filed against cigarette manufacturers. Others have nothing to declare.
REFERENCES
- 1.Adkison SE, O’Connor RJ, Bansal-Travers M, et al. Electronic nicotine delivery systems: international tobacco control four-country survey. Am J Prev Med 2013;44(3):207–15. [DOI] [PMC free article] [PubMed] [Google Scholar]
- 2.Kasza KA, Ambrose BK, Conway KP, et al. Tobacco-Product Use by Adults and Youths in the United States in 2013 and 2014. N Engl J Med 2017;376(4):342–53. [DOI] [PMC free article] [PubMed] [Google Scholar]
- 3.Cornelius ME, Wang TW, Jamal A, et al. Tobacco Product Use Among Adults - United States, 2019. MMWR Morb Mortal Wkly Rep 2020;69(46):1736–42. [DOI] [PMC free article] [PubMed] [Google Scholar]
- 4.American Nonsmokers’ Rights Foundation. States and municipalities with laws regulating use of electronic cigarettes: American Nonsmokers’ Rights Foundation; [updated October 1, 2021. Available from: http://no-smoke.org/wp-content/uploads/pdf/ecigslaws.pdf.
- 5.Czogala J, Goniewicz ML, Fidelus B, et al. Secondhand exposure to vapors from electronic cigarettes. Nicotine Tob Res 2014;16(6):655–62. [DOI] [PMC free article] [PubMed] [Google Scholar]
- 6.Logue JM, Sleiman M, Montesinos VN, et al. Emissions from Electronic Cigarettes: Assessing Vapers’ Intake of Toxic Compounds, Secondhand Exposures, and the Associated Health Impacts. Environ Sci Technol 2017;51(16):9271–9. [DOI] [PubMed] [Google Scholar]
- 7.National Academies of Sciences E, Medicine, Health, et al. In: Eaton DL, Kwan LY, Stratton K, editors. Public Health Consequences of E-Cigarettes Washington (DC): National Academies Press (US) Copyright 2018 by the National academy of Sciences. All rights reserved.; 2018. [PubMed] [Google Scholar]
- 8.National Academies of Sciences E, Medicine. Public Health Consequences of E-Cigarettes Stratton K, Kwan LY, Eaton DL, editors. Washington, DC: The National Academies Press; 2018. 774 p. [PubMed] [Google Scholar]
- 9.Adda J, Cornaglia F. The Effect of Bans and Taxes on Passive Smoking. American Economic Journal: Applied Economics 2010;2(1):1–32. [Google Scholar]
- 10.Bitler MP, Carpenter CS, Zavodny M. Effects of venue-specific state clean indoor air laws on smoking-related outcomes. Health Econ 2010;19(12):1425–40. [DOI] [PubMed] [Google Scholar]
- 11.Carpenter C, Postolek S, Warman C. Public-Place Smoking Laws and Exposure to Environmental Tobacco Smoke (ETS). American Economic Journal: Economic Policy 2011;3(3):35–61. [Google Scholar]
- 12.Cheng KW, Liu F, Gonzalez M, et al. The Effects of Workplace Clean Indoor Air Law Coverage on Workers’ Smoking-Related Outcomes. Health Econ 2017;26(2):226–42. [DOI] [PMC free article] [PubMed] [Google Scholar]
- 13.Hartmann-Boyce J, McRobbie H, Butler AR, et al. Electronic cigarettes for smoking cessation. Cochrane Database Syst Rev 2021;9:CD010216. [DOI] [PMC free article] [PubMed] [Google Scholar]
- 14.Cooper MT, Pesko MF. The effect of e-cigarette indoor vaping restrictions on adult prenatal smoking and birth outcomes. J Health Econ 2017;56:178–90. [DOI] [PMC free article] [PubMed] [Google Scholar]
- 15.Friedman AS, Oliver JF, Busch SH. Adding vaping restrictions to smoke-free air laws: associations with conventional and electronic cigarette use. Addiction 2021;116(8):2198–206. [DOI] [PubMed] [Google Scholar]
- 16.Nguyen HV, Bornstein S. Changes in adults’ vaping and smoking behaviours associated with aerosol-free laws. Tob Control 2021;30(6):644–52. [DOI] [PubMed] [Google Scholar]
- 17.Cotti C, Nesson E, Tefft N. The relationship between cigarettes and electronic cigarettes: Evidence from household panel data. J Health Econ 2018;61:205–19. [DOI] [PubMed] [Google Scholar]
- 18.Orzechowski W, Walker RC. Tax Burden on Tobacco. Historical Compilation Arlington, VA: 2014. [Google Scholar]
- 19.Center for Disease Control and Prevention. State Tobacco Activities Tracking and Evaluation (STATE) System 2019.
- 20.Tax Data Center. Vapor Products Tax Database 2019.
- 21.Abouk R, De P, Pesko MF. Estimating the Effects of Tobacco-21 on Youth Tobacco Use and Sales. SSRN Electronic Journal https://ssrn.com/abstract=37375062021. [DOI] [PMC free article] [PubMed] [Google Scholar]
- 22.Friedman AS, Pesko MF. Young Adult Responses to Taxes on Cigarettes and Electronic Nicotine Delivery Systems. Addiction in press. [DOI] [PMC free article] [PubMed] [Google Scholar]
- 23.Fong GT, Hyland A, Borland R, et al. Reductions in tobacco smoke pollution and increases in support for smoke-free public places following the implementation of comprehensive smoke-free workplace legislation in the Republic of Ireland: findings from the ITC Ireland/UK Survey. Tob Control 2006;15 Suppl 3:iii51–8. [DOI] [PMC free article] [PubMed] [Google Scholar]
- 24.U.S. Department of Health and Human Services. The Health Consequences of Involuntary Exposure to Tobacco Smoke: A Report of the Surgeon General Publications and Reports of the Surgeon General. Atlanta (GA)2006. [Google Scholar]
- 25.National Center for Chronic Disease P, Health Promotion Office on S, Health. Reports of the Surgeon General. The Health Consequences of Smoking—50 Years of Progress: A Report of the Surgeon General Atlanta (GA): Centers for Disease Control and Prevention (US); 2014. [Google Scholar]