


Abstract
The enteroviral 2C protein is a therapeutic target, but the absence of a mechanistic framework for this enzyme limits our understanding of inhibitor mechanisms. Here, we use poliovirus 2C and a derivative thereof to elucidate the first biochemical mechanism for this enzyme and confirm the applicability of this mechanism to other members of the enterovirus genus. Our biochemical data are consistent with a dimer forming in solution, binding to RNA, which stimulates ATPase activity by increasing the rate of hydrolysis without impacting affinity for ATP substantially. Both RNA and DNA bind to the same or overlapping site on 2C, driven by the phosphodiester backbone, but only RNA stimulates ATP hydrolysis. We propose that RNA binds to 2C driven by the backbone, with reorientation of the ribose hydroxyls occurring in a second step to form the catalytically competent state. 2C also uses a two-step mechanism for binding to ATP. Initial binding is driven by the α and β phosphates of ATP. In the second step, the adenine base and other substituents of ATP are used to organize the active site for catalysis. These studies provide the first biochemical description of determinants driving specificity and catalytic efficiency of a picornaviral 2C ATPase.
INTRODUCTION
The Enterovirus genus of the Picornavirus family is comprised of 15 species (1,2). Seven of these species contain viruses capable of infecting humans: enteroviruses (EVs) A–D and rhinoviruses A–C. The type species of this genus is EV-C, with poliovirus (PV), the causative agent of poliomyelitis, representing the prototype virus. The decades-long global effort to eradicate PV has yet to be completely successful. Importantly, this effort has had no impact on minimizing the rising global incidence of other EVs. EVs with a tropism for the respiratory system and capability of causing acute flaccid myelitis, for example EV-A71 and EV-D68, have been on the rise (3,4). Coxsackievirus B3 (CVB3), a species B EV, continues to be a major cause of viral myocarditis and dilated cardiomyopathy (5,6). If the current severe acute respiratory syndrome coronavirus 2 (SARS2) pandemic has taught us anything, it is that we should not eliminate any circulating virus species from the list of potential agents of a future pandemic. As a result, there has been a recent call for studies of non-poliovirus enteroviruses to enable development of countermeasures (https://grants.nih.gov/grants/guide/rfa-files/RFA-AI-21-006.html). Multiple EVs are also featured prominently on the list of viruses of pandemic potential targeted by the recently formed Antiviral Drug Discovery Centers for Pathogens of Pandemic Concern (https://www.niaid.nih.gov/research/antiviral-drug-discovery-centers-pathogens-pandemic-concern).
The enteroviral 2C protein represents an attractive target for development of pan-enteroviral therapeutics. The sequence of this protein is as conserved as the viral RNA-dependent RNA polymerase (RdRp) (7). The 2C protein has roles in genome replication and viral morphogenesis (8–16). Sub-optimal activity of 2C protein during morphogenesis causes defects to entry and/or uncoating (12). Numerous classes of small molecules targeting 2C have been discovered (13,17–19). How 2C specifically contributes to genome replication and morphogenesis is unknown.
2C is a member of the helicase superfamily 3 (SF3), a family of small viral hexameric helicases with the ATPase active site belonging to the AAA+ (ATPases Associated with various cellular Activities) superfamily (20). Inclusion of 2C in this family makes it likely that 2C would fulfill some type of helicase function, but neither widespread demonstration nor a specific biological target of helicase activity has yet been identified. One assumption has been that the ATPase-fueled helicase activity might function during genome replication to assist the RdRp with secondary structure and/or to facilitate reutilization of negative-strand RNA templates by preventing formation of, or resolving, dsRNA. Similarly, the helicase and/or translocase activity might facilitate encapsidation of viral RNA during morphogenesis. Again, the biological, biochemical, or biophysical evidence to support these assumptions is sparse.
There is indisputable evidence that 2C is an ATPase and that this activity is essential during early and late steps of the viral lifecycle (21–23). Evidence for helicase activity has only been demonstrated by a single group (24). To our knowledge, no one has ever reported translocase activity. Most efforts over the past few decades have focused on assembly and documentation of hexamers (25–27), a feat that has yet to be achieved with high efficiency for any picornavirus. A major complication of the vast majority of biochemical and biophysical studies of 2C protein is the use of recombinant proteins containing large amino-terminal fusions to help overcome insolubility caused by the amphipathic amino terminus of 2C (15,26).
We have achieved expression of full-length PV 2C and truncated derivatives thereof. We have established a biochemical framework to guide characterization of the mechanism of the 2C-mediated ATPase activity and elucidation of the mechanism(s) of action of inhibition. Prominent features of this mechanism include formation of a 2C dimer in the absence of RNA, ATP and other viral factors. Binding of RNA and ATP to 2C occurs using a two-step process, which suggests specific interactions between 2C, 2′-hydroxyls of RNA, and both the base and ribose of ATP. These key principles revealed by studying PV 2C protein extend to EV-A71, CVB3, and EV-D68.
MATERIALS AND METHODS
Reagents
RNA oligonucleotides (listed in Supplementary Table S1) were from Horizon Discovery Ltd (Dharmacon); DNA oligonucleotides were from Integrated DNA Technologies, Inc.; radiolabeled ATP and derivatives, [α32P]-ATP (3000 Ci/mmol), [α32P]-2′-dATP (3000 Ci/mmol) and [γ-32P]-ATP (7000 Ci/mmol), were from Perkin Elmer; restriction enzymes were from New England Biolabs; Phusion DNA polymerase and T4 polynucleotide kinase were from ThermoFisher; nucleoside 5′-triphosphates (ultrapure solutions) were from Cytiva; remdesivir triphosphate and 2′-C-methyl-ATP was provided by Gilead Sciences; β,γ-methylene-ATP and AMP-PNP were from MilliporeSigma; all other chemicals and reagents were from VWR, MilliporeSigma, or Fisher Scientific at the highest grade.
Construction of 2C bacterial expression plasmids
2C proteins produced in this study were expressed and purified as SUMO-fusions. The pSUMO system allows for production of SUMO fusion proteins containing an amino-terminal affinity tag fused to SUMO that can be purified by affinity chromatography and subsequently processed by the SUMO protease, Ulp1 (28). Briefly, the WT 2C gene was PCR amplified from the PV cDNA, pMO-3 plasmid, using primers listed in Supplementary Table S2. We utilized BsaI and XhoI restriction sites for subcloning of DNA fragments using T4 DNA ligase into the pSUMO expression plasmid and confirmed the final sequence, pSUMO-PV-WT-2C, by Sanger sequencing at the Penn State Genomics Core Facility in University Park, PA or Genewiz at Wake County, NC. The N-terminal derivatives, NΔ39 2C and NΔ115 2C, were cloned using a similar procedure as the WT 2C gene. Site-directed mutants, e.g. pSUMO-PV-2C-D177A, were produced by QuikChange mutagenesis (Aligent). The genes for 2C from CVB3 (Genbank: M33854.1), EV-A71 (Genbank: KM077140.1), and EV-D68 (Genbank: KM881710.2) were PCR amplified from viral cDNA templates (29–31) and cloned into pSUMO expression plasmid by In-Fusion (Takara Bio). The final constructs were confirmed by Sanger sequencing performed by Genewiz (Morrisville, NC, USA).
Modeling of PV 2C WT
The WT 2C model was modeled by using ATPγS-bound VAT complex (PDB: 5G4G) and generated using Phyre2 in the Intensive mode (32). The model was then minimized using Schrödinger Maestro, by Schrödringer, Inc.
Expression and purification of PV 2C WT, PV 2C NΔ39, and other NΔ39 constructs
2C protein was expressed in Rosetta (DE3) competent cells (MilliporeSigma). Cells were grown in NZCYM media, pH 7.6, to an optical density (OD600) of 1.0 and induced by autoinduction for 48 h at 15 °C (33). The induction and subsequent purity of 2C fractions was evaluated by Coomassie-stained SDS-PAGE (15%) gels. Cells were harvested by centrifugation at 5 400 × g for 10 min at 4 °C and washed with a buffer containing 10 mM Tris and 1 mM EDTA at pH 8.0 and then re-centrifuged. The cell pellet was resuspended and homogenized in Buffer A [50 mM 3-(cyclohexylamino)-1-propanesulfonic acid (CAPS) at pH 10.0, 10% (v/v) glycerol, 500 mM NaCl, 5 mM imidazole, 5 mM β-mercaptoethanol (BME), 1 mM EDTA, 1.4 μg ml-1 pepstatin A, 1.0 μg ml-1 leupeptin] by Dounce homogenizer at a ratio of 5 ml Buffer A per 1-gram wet cell pellet. Lysis was achieved by passing the suspension through a French press twice at a pressure of 15 000 psi. Phenylmethylsulfonyl fluoride (PMSF) and nonyl phenoxypolyethoxylethanol (NP-40) was added to the cell lysate at a final concentration of 1 mM and 0.1%, respectively. While stirring, polyethylenimine (PEI) was added gradually to a final concentration of 0.25% (w/v) at 4 °C to precipitate any contaminating nucleic acids. The PEI-containing lysate was clarified by centrifugation at 75 000 × g for 30 min at 4 °C. Ammonium sulfate was gradually added to the clarified lysate at 4 °C to 40% saturation while stirring to precipitate the protein and remove the PEI. The solution was centrifuged at 75 000 × g at 4 °C for 30 min to collect the ammonium sulfate-protein pellet. From this point onward, buffers contained detergent only for purification of PV 2C WT and full-length mutant derivatives. The pellet was resuspended in Buffer B [20 mM HEPES at pH 7.5, 20% (v/v) glycerol, 500 mM NaCl, 5 mM BME, 0.1% (v/v) NP-40] containing 5 mM imidazole. Using a peristaltic pump, a nickel-nitrilotriacetic (Ni-NTA) resin (Thermo Fisher Scientific Inc.) was equilibrated with 5 column volumes (CVs) of Buffer B containing 5 mM imidazole at 1 ml min-1. The equilibrated Ni-NTA resin was then mixed with the resuspended protein pellet for 30 min while stirring, and subsequently repacked. To remove contaminants, the loaded resin was washed with 5 CVs Buffer B containing 5 mM imidazole and 4 CVs Buffer B containing 50 mM imidazole. 2C was eluted into multiple fractions with Buffer B containing 500 mM imidazole. 2C protein fractions were pooled, treated with 1 μg ubiquitin-like-specific-protease 1 (Ulp1) per 1 mg protein of interest, and dialyzed against Buffer C [20 mM HEPES at pH 7.5, 20% (v/v) glycerol, 5 mM BME, 50 mM NaCl, 0.1% (v/v) NP40] overnight at 4 °C by using a 12–14 000 MWCO dialysis membrane (Spectrum Laboratories). The dialyzed 2C protein was centrifuged at 75 000 × g at 4 °C for 30 min to remove insoluble protein. A Q-sepharose column (ThermoFisher Scientific Inc.) was equilibrated with 5 CVs Buffer C. PV 2C protein was passed through the Q-column as flow-through while the cleaved-SUMO protein bound to the Q-sepharose column. A phosphocellulose column was prepared as previously described (34) and equilibrated with buffer C. PV 2C was loaded onto the phosphocellulose column with buffer D [20 mM HEPES at pH 7.5, 20% (v/v) glycerol, 5 mM BME, 1.5% (v/v) octyl-β-d-glucopyranoside] containing 50 mM NaCl until A280 values from the NP-40 were reduced to <0.1. PV 2C was eluted from the phosphocellulose column with buffer D containing 500 mM NaCl. The protein concentration was determined by measuring the absorbance at 280 nm (PV 2C WT: ϵmax = 32 430 M−1·cm−1; PV 2C NΔ39: ϵmax = 15 930 M−1·cm−1; CVB3 2C NΔ39: ϵmax = 14 900 M−1·cm−1; EVA71 2C NΔ39: ϵmax = 14 900 M−1·cm−1; EVD68 2C NΔ39: ϵmax = 20 860 M−1·cm−1) with NanoDrop One (Thermo Fisher Scientific Inc.). The ionic strength of the dialyzed protein solution was confirmed with a conductivity meter (Traceable). Agarose gel electrophoresis was run to check for any contaminating nucleic acids. Flash frozen aliquots were stored at −80 °C until ready to use. The ProtParam tool (ExPASy Bioinformatics Resource Portal) was used to calculate the physical/chemical parameters of the protein including extinction coefficient. Representative purified proteins are shown in Figure 1.
Figure 1.

Purified PV 2C protein and derivatives used in this study. (A) Purification of PV 2C full-length protein (WT). We expressed and purified WT and derivatives as described under Materials and Methods. Progress was visualized before and after each step by electrophoresis through a 15% polyacrylamide gel. Briefly, cells were induced (uninduced and induced), disrupted and centrifuged (lysate vs. clarified lysate), and precipitated by ammonium sulfate (Amm. Sulf. Pellet). Next, pooled fractions of proteins eluted from the Ni-NTA column (Ni-NTA Elution), then treated with the Ulp1 protease to remove the His-SUMO tag (Ulp1-treated), Finally, protein was passed through a Q-sepharose column (Q-seph Elution), and then eluted from a phosphocellulose column (PC Elution). (B) PHYRE2-predicted structure of PV WT 2C modeled based on the structure of the ATP-γ-S-bound VAT complex (PDB: 5G4G). Blue is N-terminus; red is C-terminus. We deleted the indicated residues from 2C to produce NΔ39, NΔ46 and NΔ70. Only NΔ39 was soluble. (C) PV 2C NΔ39 was purified as described for WT in panel A. (D) Purified PV WT and NΔ39 (2 μg) used in this study. D177A represents the amino acid substitution used to inactivated the ATPase activity; D177 is in the conserved Walker B motif. Molecular weight standards (Mr) in panels A, B, and D are represented in kDa.
Expression and purification of PV 2C NΔ115
The induction, lysis, and PEI/ammonium sulfate treatment of SUMO PV 2C 116–329 (Δ115) was performed as described for PV 2C WT but using buffer E [20 mM HEPES at pH 7.5, 10% (v/v) glycerol, 500 mM NaCl, 5 mM imidazole, 5 mM BME, 1 mM EDTA, 1.4 μg/ml pepstatin A, 1.0 μg/ml leupeptin]. The ammonium sulfate pellet was resuspended in Buffer F [Buffer B lacking NP-40] and containing 5 mM imidazole. Using a peristaltic pump, an Ni-NTA resin was equilibrated with 5 CVs of Buffer F containing 5 mM imidazole at 1 ml/min. The equilibrated Ni-NTA resin was then mixed with the resuspended protein pellet for 30 min while stirring, and subsequently repacked. To remove contaminants, the loaded resin was washed with 5 CVs Buffer F containing 5 mM imidazole and 4 CVs Buffer B containing 50 mM imidazole. PV 2C Δ115 was eluted into multiple fractions with Buffer F containing 500 mM imidazole. 2C protein fractions were pooled, treated with 1 μg Ulp1 per 1 mg protein of interest, and dialyzed against Buffer G [20 mM HEPES at pH 7.5, 20% (v/v) glycerol, 5 mM BME, 500 mM NaCl] overnight at 4 °C by using a 6–8000 MWCO dialysis membrane (Spectrum Laboratories). The dialyzed 2C protein was centrifuged at 75 000 × g at 4 °C for 30 min to isolate soluble protein and concentrated using a Vivaspin Turbo 15 (Sartorius, 10 kDa MWCO) to 2–5 ml for preparative gel filtration, using a HiLoad 16/600 Superdex 200 pg (GE Healthcare). The gel filtration column was flowed at 1.0 ml min−1 buffer G and divided into 34 3-ml fractions. Fractions with the protein of interest were detected by Nanodrop and SDS-Page, and subsequently pooled and concentrated with a Vivaspin Turbo 15. The protein concentration, conductivity, concentration of contaminant nucleic acids, and storage was performed similarly to PV 2C WT (PV 2C Δ115 ϵmax = 7450 M−1·cm−1).
Fluorescence polarization experiments
To test interactions between 2C and nucleic acids, increasing concentrations of 2C were added into a solution containing 10 nM of fluorescein-labeled nucleic acid in a binding buffer [20 mM HEPES, 5 mM magnesium acetate, 1 mM TCEP, and 25 mM NaCl, at pH 6.8] in a 100 μl final reaction volume. Reactions were incubated for 15 min at 30 °C and then measured. Experiments were performed in a 96-well plate format using a BioTek H1M1 plate reader using a dual wavelength 485/20 485/20 fluorescence polarization cube. Data from protein titration experiments were fit to a hyperbola:
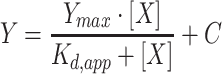 |
(1) |
where X is the concentration of protein, Y is degree of polarization, Kd,app is the apparent dissociation constant, and Ymax is the maximum value of Y.
The stoichiometric binding experiment was performed essentially as described above with the addition of 3 μM unlabeled ssRNA-1. The molar ratio of 2C protein to ssRNA-1 was solved via simultaneous equations as described in the legend of Figure 4.
Figure 4.

2C protein binds RNA as a dimer. (A–E) 2C binds to ssRNA in the absence and presence of ATP. Fluorescein-labeled ssRNA-1 (10 nM; 29-mer; see Supplementary Table S1 for additional details) was mixed with increasing concentrations of 2C (WT, NΔ39, D177A, or NΔ39 D177A) in the absence or presence of ATP (500 μM). Milliporization (mP) was plotted and the data were fit to Equation (1), yielding the apparent dissociation constants (Kd,app) summarized in Table 1. Error bars represent the SD (n = 3). (E) Stoichiometry of binding between NΔ39 2C and ssRNA-1. NΔ39 2C was titrated into the RNA binding assay in which the total concentration of ssRNA-1 was 10•Kd,app (3 μM), and the mP was measured. Error bars represent the SD (n = 3). We defined lines for the two phases of the curve by linear regression and calculated the intersection (6 μM) algebraically. This value is twice the concentration of RNA, indicating that 2C binds RNA as a dimer.
Radiolabeled ATPase Assay
Reactions were performed at 30 °C and contained 20 mM HEPES pH 6.8, 25 mM NaCl, 5 mM magnesium acetate, 0.05 μM [α32P]-ATP, and 1 mM TCEP (15). Depending on the assay, the presence of ATP, RNA, or drug varied, and are indicated within figures and their legends. Nucleic acids used for stimulation experiments are listed in Supplementary Table S1. Reactions were quenched by the addition of EDTA at a final concentration of 250 mM. During nucleotide competition experiments, the total amount of Mg2+ was stoichiometric compared to the total NTP concentration, with an additional 4 mM Mg2+ free. The volume of enzyme added to any reaction was always less than or equal to one-tenth the total reaction volume. Rates are defined as μM ADP formed min−1 μM 2C−1. When defining the rate, timepoints were taken during the linear portion of the reaction with less than 20% product formed.
Radiolabeled ATPase assay product analysis
Products were resolved by spotting 1 μl of quenched reactions onto polyethyleneimine (PEI) TLC plates (Fisher Scientific M1055790001). TLC plates were developed in 0.3 M potassium phosphate, pH 7.0, dried, and exposed to a PhosphorImager screen. Phosphor images were taken with a GE Amersham Typhoon. Products were quantified using ImageQuant software (Molecular Dynamics) to determine the amount of ADP formed from ATP. For linear reactions, the amount of ADP formed was plotted as a function of time and fit to a line. For saturating reactions, the rate (defined as μM ADP min−1 μM 2C−1) was plotted versus concentration of substrate and fit to a hyperbola:
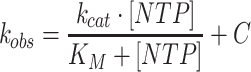 |
(2) |
where [NTP] is the concentration of ligand, kobs is the rate, kcat is the maximal rate, KM is the Michaelis constant, and C is a constant. When fitting data from competition experiments, the following equation was used:
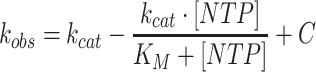 |
(3) |
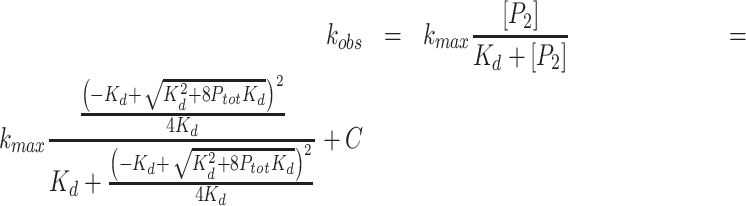
When necessary, a quadratic binding equation was used to provide another perspective where the free concentration of protein was not assumed to be the concentration of dimer in solution. To calculate the concentration of monomer, a quadratic was used:
 |
(4) |
where [P] is the concentration of monomer, Ptot is the total protein concentration, and Kd is the equilibrium dissociation constant of the dimer. Equation (4) was then used to calculate the concentration of dimer:
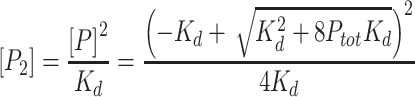 |
(5) |
where [P2] is the concentration of dimer. Finally, concentration dependent rate (defined as μM ADP min−1 μM 2C−1) activity curves were fit with:
 |
(6) |
where kmax is the maximum rate with a substrate concentration of 0.5 mM ATP, C is a constant, and kobs the observed rate (μM ADP min−1 μM 2C−1).
Colorimetric ATPase assay
The BioAssay Systems QuantiChrom ATPase/GTPase Assay Kit (BioAssay Systems, Hayward, CA, USA) was used for colorimetric ATPase assays. Reactions were performed at 30 °C and contained 20 mM HEPES pH 6.8, 25 mM NaCl, 5 mM magnesium acetate, NTP, and 1 mM TCEP. Depending on the assay, the presence of NTP, or RNA varied, and are indicated within figures and their legends. Timepoints were taken by quenching with 50 mM final EDTA. 20 μl of quenched reaction mix was added to 80 μl of QuantiChrom reagent in a 384-well glass-bottom plate and left to develop for 30 min. The A620 was then read using a BioTek H1M1 plate reader. A phosphate standard curve was produced using the provided phosphate standard in the same reaction buffer used for 2C enzymatic assays and was linear between 1 and 50 μM phosphate: samples were diluted into that range for final measurement. The standard curve was used to calculate concentration of phosphate present in assay timepoints or samples.
Deprotection and 5′-32P-labeling of RNA oligonucleotides
RNA nucleotides were ordered to be PAGE-purified in their ACE-protected forms and were deprotected according to instructions of the manufacturer. For helicase assays, oligonucleotides were labeled using [γ-32P]-ATP and T4 polynucleotide kinase as previously described (35).
Annealing of unwinding substrates
RNA duplexes (pairs made up of ssRNA 2 and 3, ssRNA 4 and 5, and ssRNA 7 and 8; sequences detailed in Supplementary Table S1) were annealed at 5 μM in 20 mM HEPES, pH 7.5, 50 mM NaCl by using a Progene Thermocycler (Techne). The unlabeled strand was present in a 1.2:1 ratio excess. Annealing reactions were heated to 90 °C for one minute and cooled 5 °C min−1 until 10 °C.
Helicase assay
Reactions (20 μl) were performed at 30 °C with either RNA duplex. We used either Mix A or Mix B. Mix A contained 20 mM HEPES pH 6.8, 25 mM NaCl, 5 mM magnesium acetate, 1 mM ATP, 5 μM DNA trap strand, and 1 mM TCEP. Mix B contained 20 mM HEPES pH 7.0, 25 mM NaCl, 0.5 mM MgCl2, 2 mM ATP, 5 μM DNA trap strand, and 1 mM TCEP (36). The trap strand was a 9-mer RNA of the same sequence as the 32P-labeled strand, 5′-CCGGGCGGC-3′. Reaction timepoints were quenched with an equal volume (5 μl) addition of loading buffer (100 mM ETA, 0.33% (wt/v) SDS, 10% (v/v) glycerol, 0.025% (wt/v) bromophenol blue, 0.025% (wt/v) xylene cyanol). Products were resolved on 20% native PAGE gels by electrophoresis in 1× TBE at 15 mA for 90 min. Gels were visualized by phosphorimaging.
Western blotting of 2C protein
Rabbit polyclonal antibody against 2C was produced by Covance Research Products (Denver, PA, USA) using the antigen PV 2C NΔ115. One hundred picograms of purified 2C WT and NΔ39 protein was loaded onto a 15% SDS PAGE gel. Mock, 4, and 6 hour post-infection (hpi) HeLa cell extracts (60 × 103 cells lane−1) were loaded onto the same gel. After electrophoresis, the SDS-PAGE gel was sandwiched to a nitrocellulose membrane with a Genie Blot apparatus (IDEA Scientific Company). The membrane was probed with 1:5000-dilution of the final bleed of anti-2C polyclonal antibody, and 1:5000-dilution of goat anti-rabbit IgG-HRP (Santa Cruz Biotechnology). The 2C-reactive bands were detected by ECL Western blot detection reagents (Azure Biosystems) and analyzed by a G:Box imager (SynGene).
Size-exclusion chromatography and multi-angle light scattering (SEC-MALS)
Samples of 2C NΔ39 protein at a concentration of 5 mg min-1 were prepared in a buffer of 20 mM HEPES, pH 6.8, 5 mM Magnesium acetate, 1 mM TCEP, 5% glycerol, and 50 mM NaCl. All samples were centrifuged at 6000 × g for 20 min to minimize aggregation and to remove dust particles prior to SEC-MALS. SEC chromatographic separation of samples was conducted using an Agilent 1260 Infinity II HPLC system with an autosampler and fraction collector. A Wyatt Technology DAWN MALS and Wyatt Optilab Refractive Index(RI) detectors were used for analyzing the molar mass of peaks that eluted from the column. The SEC-MALS system was calibrated with bovine serum albumin (BSA) and equilibrated with in the same mobile phase as that of the 2C samples. Normalization and alignment of the MALS and RI detectors were carried out using the BSA (monomer ∼66 kDa) standard, run in the 2C buffer condition. The Wyatt SEC hydrophilic column used had 5 μm silica beads, a pore size of 100 Angstrom, and dimensions 7.8 × 300 mm. The column, fraction collector, and autosampler were set to 4 °C. A volume of 15 μl of 2C protein (75 μg) was injected at a flow rate of 0.5 ml min−1 with a chromatogram run time of ∼25 minutes. Data was analyzed using the ASTRA software from Wyatt. As a single peak with a molar mass corresponding to a dimer of 2C protein was observed by SEC-MALS, BioSAXS data were subsequently collected directly with no further purification via SEC-MALS fractions.
BioSAXS and modeling of the protein envelope
Small angle X-ray scattering (BioSAXS) was collected on 2C NΔ39 (at 2 mg ml−1 and 1 mg ml−1) and 2C NΔ39 with ATP (at 1 mg ml−1) to compare their solution state conformations. BioSAXS data were collected at a wavelength of 1.54 Å on the in-house home source X-rays generated by a Rigaku MM007 rotating anode housed with the BioSAXS2000nano Kratky camera system. The system includes OptiSAXS confocal max-flux optics that is designed specifically for SAXS and a sensitive HyPix-3000 Hybrid Photon Counting detector. The sample capillary-to-detector distance was 495.5 mm and was calibrated using silver behenate powder (The Gem Dugout, State College, PA, USA). The useful q-space range (4πSinθ λ−1, 2θ being the scattering angle) was generally from qmin = 0.008 Å−1 to qmax = 0.3Å−1 (q = 4πsin(θ) λ−1, where 2θ is the scattering angle). The energy of the X-ray beam was 1.2 keV, with the Kratky block attenuation of 22% and a beam diameter of ∼100 μm. Protein samples were loaded using the autosampler on to quartz capillary flow cell mounted on a stage cooled to 4 °C prior and aligned in the X-ray beam. The sample cell and full X-ray flight path, including beam stop, were kept in vacuo (<1 × 10⁻³ Torr) to eliminate air scatter. The Rigaku SAXSLAB software was programmed for automated data collection of each protein with elaborate cleaning between samples. Data reduction including image integration and normalization, and background buffer data subtraction were also carried out using the SAXSLAB software. Six ten-minute images from protein and buffer samples were collected and averaged after ensuring that no X-ray radiation damage had occurred. SAXS data overlays showed that there was no radiation decay over the 60 min of data collection. Data analysis was done in ATSAS and solvent envelopes were computed using DENSS, an algorithm used for calculating ab initio electron density maps directly from solution scattering data (37,38). The theoretical scattering profiles of the constructed models were calculated and fitted to experimental scattering data using CRYSOL.
Modeling of the PV NΔ115-2C dimer
To construct a model for the PV NΔ115-2C dimer, we sought to recapitulate likely features of the bipartite AAA + ATPase site and maintain compatibility with a hexameric arrangement, which is adopted in the helicase-active forms of other SF3 helicases such as papillomavirus E1 (39,40) and SV40 Large T-antigen (41,42). Similar to the procedure applied previously for modeling of the PV 2C hexamer (43), a hexameric model for a NΔ115-2C hexamer was constructed by superposition of the structure of the 2C ATPase domain (chain A, PDB 5Z3Q (43)) onto the AAA + domains of an SV40 Large T-antigen hexamer. To facilitate further inspection of the ATPase sites, the structure of SV40 Large T-antigen hexamer bound to 6 ATP molecules and 6 magnesium ions was used (chains A-F, PDB 1SVM) rather than the structure used previously (43) of T-antigen bound to p53 (PDB 2H1L (44)), which lacks magnesium and nucleotide. Six copies of the 2C AAA + domain were superimposed on those of SV40 Large T-antigen in Coot (45) using the secondary structure matching algorithm.
Following this superposition, the positions of the ATP, magnesium, and three water molecules bound to the magnesium from chain A of the SV40 Large T-antigen structure (PDB: 1SVM chain A, waters 802, 935, 936 (41)) were optimized for alignment to the Walker A motif of one 2C subunit by explicit superimposition of the Walker A helix of both structures (aligning residues 429–439 of 1SVM to residues 132–142 of the superimposed 2C subunit; see above). Following this adjustment, the Mg•ATP•water unit was examined and revealed a substantial steric clash of the adenine ring with the 2C protein. The adenine ring was rotated to an alternate non-clashing conformation in Coot (45) and minimized. This minimized Mg•ATP•water unit was copied to the other subunits of the putative 2C hexamer model by least-squares alignment of the ATP-containing subunit to each of the remaining five subunits to generate a hexamer with ATP and an octahedrally coordinated magnesium at all six ATPase sites. Finally, the overall hexameric structure was minimized in Phenix (46) with phenix.geometry_minimization.
This minimization incorporated distance restraints for likely interactions of the ATPase site, guided by the structure of the MCM AAA + hexameric helicase (PDB 6MII (47)). The specific restraints included an octahedral coordination sphere (1.95 Å bond distances and 90 ° bond angles) for the magnesium ion comprised by the conserved hydroxyl of the Walker A serine (S136), an ATP β-phosphate oxygen, an ATP γ-phosphate oxygen, and three water molecules. Some hydrogen-bonding distance restraints (3.0 Å) were applied between protein atoms and the ATP molecule, detailed further below. The main-chain amide groups of Walker A residues G132-V137 and oxygen atoms of ATP phosphates were restrained to 3.0 Å. The side-chain ammonium of the conserved lysine of the Walker A motif (K135) and oxygen atoms of the ATP were restrained to 3.0 Å. The sensor-I conserved asparagine (N223) side-chain and an ATP oxygen atom were restrained to 3.0 Å. From the neighboring subunit, two arginine residues, the arginine finger (R241) and its neighbor (R240) and oxygen atoms of the ATP phosphates were restrained to 3.0 Å. Based on comparison with the MCM ATPase site, the R240 side-chain appears to fulfill a role equivalent to sensor-II (2C does not have a canonical sensor-II sequence motif, consistent with other SF3 helicases such as E1, which places a lysine side-chain in the structural position typically occupied by a sensor-II arginine (39)). A conserved aspartate of the Walker B motif (D176) was restrained to 3.0 Å from a water molecule of the magnesium coordination sphere and the conserved hydroxyl of the Walker A motif (S136). The resulting hexamer model showed a good hexameric geometry free of clashes and six equivalent ATPase sites with interactions between the protein, ATP, and magnesium that are anticipated to be important for catalysis. Two adjacent subunits from this model were selected as the PV NΔ115 2C dimer model.
Isothermal titration calorimetry (ITC)
Dilution experiments were performed using a TA instruments Affinity ITC auto equipment (TA instruments New Castle, Delaware). PV 2C (27 μM) protein was loaded onto the titration syringe. The calorimeter cell contained exactly matched buffer: 10 mM HEPES, 50 mM NaCl, 5% glycerol, 1 mM TCEP, at pH 7.5. Enthalpy of dimer dissociation were recorded with injection volume of 3 μl over 20 titrations. All the injections were conducted at a constant temperature of 30 °C with a stir speed of 125 rpm. The ITC dilution data were integrated and analyzed using the TA Instruments Nano analyze software program (v3.12.0). Before testing protein samples, the instrument was calibrated using the EDTA/CaCl2 test kit for the TA Affinity ITC auto.
Quantification and statistical analysis
Statistical analyses and nonlinear regressions were performed using GraphPad Prism v9.3. Error bars in graphs represent standard deviation. Plus-minus values provided in tables and legends are the standard error. An unpaired Student's t-test was used to assess stimulation of 2C by double-stranded RNA. The P values for the experiment are presented in the legend (n.s. = non-significant, * P < 0.05, ** P <0.005, *** P < 0.005).
RESULTS
Expression and purification of PV 2C protein and derivatives
The enteroviral 2C protein has been notoriously difficult to purify (15,25–27,48). The presence of an amino-terminal, amphipathic alpha-helix on the protein causes aggregation and formation of inclusion bodies when expressed in E. coli (15,43,49). Previous studies of the NS5A protein from hepatitis C virus showed that fusion to cleavable tags positively augments expression and solubility (43,49). We have used a similar strategy for expression of PV 2C protein. We encoded a six-histidine-SUMO-tag on the amino terminus (28). We induced the protein using the auto-induction system, which leads to expression of chaperones capable of preventing protein aggregation (33). The combination of these two approaches permitted purification of the authentic, full-length 2C protein as described under Materials and Methods (Figure 1A). We will refer to a protein with an authentic amino terminus as WT. Solubility of WT, full-length 2C requires the presence of detergent.
Structural information is available for a derivative of PV 2C in which the amino-terminal 115 amino acid residues were deleted (43,49). We will refer to this protein as NΔ115. We purified NΔ115; however, it lacked ATPase activity under conditions used for WT 2C (Supplementary Figure S1). Modeling of PV 2C based on a structure for the VAT AAA + ATPase placed amino acid 115 well into the body of the folded globular domain of 2C (Figure 1B). Therefore, we engineered several shorter truncations with the goal of identifying a derivative that was soluble in the absence of detergent and active. Deleting 79 or 46 amino acid residues from the amino terminus produced insoluble proteins (data not shown). However, deletion of only 39 amino acid residues produced a soluble protein that we purified using the protocol developed for WT, but without the requirement of detergent for solubility (Figure 1C).
The Xia laboratory has reported the existence of post-translational modification on picornaviral 2C proteins expressed in insect cells that alter the mobility of the protein on denaturing gels (24). This modification is also thought to be required for helicase activity (24). Interestingly, WT PV 2C proteins produced in bacteria or during infection exhibit the same mobility on denaturing gels (Supplementary Figure S1D). Recently, the Cui laboratory expressed a picornaviral 2C protein in insect cells (50). In this case, perturbed gel mobility was not observed (50).
To inactivate the ATPase activity of 2C without impairing nucleotide binding, we changed the conserved Asp-177 to Ala (D177A). Asp-177 is a residue in the ‘Walker B motif,’ which contributes to formation of the nucleophile in the active site (Supplementary Figure S2A) (51,52). Purification of the D177A variants in the context of the full-length or NΔ39 proteins followed protocols developed for the unsubstituted enzymes. As expected, the D177A substitution inactivated the ATPase activity (Supplementary Figure S2B,C). Purified proteins used in this study are shown in Figure 1D.
PV 2C-NΔ39 exists as a dimer in solution
SF3 helicases are active as hexamers. Previous studies of picornaviral 2C proteins have demonstrated the capacity of these proteins to form hexamers. However, the efficiency with which hexamers form is very low (18,26,27). Our ability to purify the NΔ39 derivative in the absence of detergent and to concentrate the protein to a concentration of 5 mg ml-1 (150 μM) or greater provided the opportunity to use a variety of biophysical approaches to characterize the behavior of NΔ39 in solution properties.
We evaluated the quaternary structure of NΔ39 using size-exclusion chromatography coupled to multi-angle light scattering (SEC-MALS) as described under Materials and Methods. Neither monomer nor hexamer formed in solution based on this experiment (Figure 2A). The average mass of the species present in solution was 71.0 ± 7.7 kDa (Figure 2A). Given the calculated molecular weight of 33 kDa for a monomer, these data are most consistent with NΔ39 existing as a dimer in solution. The concentration range of protein eluted from the column during the SEC-MALS experiment was 35 – 50 μM based on the UV absorbance profile (Figure 2A). Use of high protein concentrations is a requirement for this experiment, so it is not possible to glean any insight into the equilibrium dissociation constant for the dimer from this experiment. However, the inability to observe hexamers over this range of concentration suggests that the equilibrium dissociation constant for such structures must be quite high.
Figure 2.

NΔ39 2C forms a dimer in solution. (A) Analysis of NΔ39 2C by size-exclusion chromatography coupled to multi-angle light scattering (SEC-MALS) was performed as described under Materials and Methods. The sample loaded was 150 μM (5 mg ml−1), with the concentration ranging from 35 to 50 μM during elution. Under these conditions, the average mass observed was 71 ± 7 kDa (95% CI: 57–85 kDa), most consistent with formation of a dimer (66 kDa). (B) Analysis of NΔ39 2C by dilution isothermal titration calorimetry (ITC) was performed as described under Materials and Methods. Shown is the observed heat change as a function of the protein concentration in the cell post-injection. The data could not be fit to a model for dimer dissociation only but required addition of pre- and/or post-dissociation conformational changes. Therefore, we have not fit the data to any model. What can be gleaned from the data is that the dimer fails to dissociate at concentrations above 4 μM, suggesting a Kd value on the order of 0.4 μM. (C) Analysis of NΔ39 2C by small-angle X-ray scattering (SAXS) was performed as described under Materials and Methods. The primary data are presented in Supplementary Figure S3. Shown here is the density map calculated by the Density from Solution Scattering (DENSS) algorithm and rotated 360 degrees. Twenty reconstruction trials were run, and the correlation score between the average and reference maps was 0.943. (D) Structural model of NΔ115 2C dimer presented in Figure 3 was manually fit in into the electron density envelope observed for NΔ39 2C by SAXS using Pymol.
To pursue information on the equilibrium dissociation constant (Kd) for the dimer, we used isothermal titration calorimetry (ITC). We used a dilution format as described under Materials and Methods. The basis for this experiment is that if the protein exists as a dimer in solution, then dilution of the protein into buffer to a concentration below the value of the Kd will cause a heat change due to dissociation of the dimer. Such an effect will be observed until the concentration of protein in the cell exceeds the Kd value. This phenomenon was observed for NΔ39, consistent with the existence of a dimer in solution (Figure 2B). Unfortunately, we were unable to model the data to a simple dimer-to-monomer transition to obtain a value for the Kd. However, it is clear that concentrations above 4 μM failed to exhibit heat change (Figure 2B). If we assume that heat changes will be undetectable when the protein concentration in the cell reaches a value of 10•Kd, then the Kd value for the dimer would be on the order of 400 nM.
Finally, to evaluate the quaternary structure of 2C further and to reveal the overall three-dimensional shape of the protein in solution, we performed small-angle X-ray scattering (SAXS). The 3D protein envelope calculated using the SAXS data is shown in Figure 2C. Kratky plots confirmed a well-folded protein with no flexibility or disorder (Supplementary Figure S3). Values for the radius of gyration (24.1 Å) and maximum radius (Dmax of 86 Å), as well as values from the distance distribution (P(r)), CRYSOL, and Guinear analyses, were all consistent with the 2C dimer as the predominant species in solution.
Structural model for the PV 2C hexamer based on the NΔ115-2C structure
We used the structure of PV NΔ115-2C to construct a model of the PV 2C hexamer as described under Materials and Methods. Modeling was templated by SV40 Large T-antigen, an SF3 helicase, bound to ATP and Mg2+ (PDB 1SVM) (42). Modeling of the organization of the active site at each dimer interface of the NΔ115-2C hexamer was restrained by the structure of the MCM AAA + hexameric helicase solved in the presence of ATP and Mg2+ (PDB 6MII) (47). The final model of the NΔ115 2C hexamer included ATP and Mg2+ bound to each dimer interface of the hexamer. A single dimer interface is shown in Figure 3A. The Mg2+ ion exhibited an octahedral coordination sphere. Ligands to the metal included the following: the conserved hydroxyl of Walker A serine (S136), oxygens from the β- and γ-phosphates of ATP, as well as several water molecules (Figure 3A). The phosphates of ATP interacted with the conserved Walker A lysine (K135), the conserved sensor I asparagine (N223), the conserved arginine-finger arginine (R241), and R240 (Figure 3A). One of the conserved Walker B aspartates (D176) interacted with both the Mg2+ ion and the hydroxyl of the conserved Walker A serine (Figure 3A). The other aspartate (D177) had no direct contact with the nucleotide (Figure 3A), yet is essential for catalysis (49,53,54). The organization of the modeled 2C active site was consistent with the active site observed in the structure of MCM in complex with ATP and Mg2+ (Figure 3B) (47). Interestingly, R240 of 2C may serve the same function as the conserved sensor II arginine (R560) of MCM (compare Figure 3A to B). Importantly, the dimer modeled here fit nicely into the solution envelope determined experimentally SAXS above (Figure 2D).
Figure 3.

Modeling of the PV NΔ115 2C dimer. (A) One ATPase site from the generated hexamer model of 2C. (B) A similar ATPase site from MCM (PDB 6MII) (C) Overall 2C hexamer looking down the channel. Everything is in grey except the helix of oligomerization, which is colored by subunit. (D) A similar view of SV40 T-antigen. Everything is in grey except the oligomerization domain, which is colored by subunit. (E) A perpendicular view of panel C. (F): A perpendicular view of Panel D.
As reported by the Cui laboratory, enteroviral 2C monomers interact by insertion of the carboxy-terminal helix, referred to as the pocket-binding motif, of one monomer into hydrophobic pocket of another (43,49). We modeled our PV 2C hexamer to contain the same interactions (Figure 3C). Such head-to-tail interactions could extend ad infinitum. The Cui laboratory has shown that this is not the case in solution, as species no larger than tetramer are observed in solution for PV NΔ115-2C (43,49). As reported above, we did not observe species larger than dimer in solution. How 2C–2C quaternary structure is regulated remains unclear.
We compared the PV 2C hexamer to that of SV40 Large T-antigen. For T-antigen, a domain comprised of multiple helices contributes to stabilization of the hexamer (Figure 3D). By comparing side views of the 2C hexamer (Figure 3E) to that of T-antigen (Figure 3F), it becomes even clearer that T-antigen uses an entire domain to hold the subunits of the hexamer together. The solvent accessible surface area buried in forming the T-antigen hexamer is on the order of 2600 Å2, but only 1200 Å2 for the 2C hexamer. Determinants other than the interactions driven by the carboxy-terminal helix of 2C may be required to form a stable hexamer.
A PV 2C dimer binds to RNA
Although there has been some suggestion that PV 2C binds viral RNA (55,56), quantitative information on the affinity and stoichiometry of binding does not exist. We have used a fluorescence-polarization assay to monitor RNA binding as described under Materials and Methods. We titrated WT protein into binding reactions in the absence or presence of ATP. We plotted polarization as a function of WT protein concentration and fit the data to a cooperative-binding mechanism (see Materials and Methods), yielding an apparent dissociation constant (Kd,app). WT bound to RNA with a Kd,app of 110 ± 20 nM (Figure 4A). The presence of ATP caused an insignificant decrease in binding affinity (Figure 4A). NΔ39 was also capable of binding RNA with a Kd,app of 320 ± 60 nM (Figure 4B), without a significant change caused by the presence of ATP. The values measured for NΔ39 were consistent for multiple preparations of this derivative (Supplementary Figure S4). To better assess the range of data points used for quantitative analysis, data have also been plotted on a log scale (Supplementary Figure S5).
The motivation for evaluating the impact of ATP on RNA binding comes from our previous studies of the HCV ATPase/RNA helicase that suggest ATP binding loosens the grip of the enzyme on RNA. Because WT will hydrolyze ATP, it was possible that the magnitude of the effect of ATP on RNA binding by 2C was reduced. To address this possibility, we evaluated the D177A enzyme. In each case, the inactive 2C protein bound to RNA with a similar affinity as WT or NΔ39 but without any discernible impact of ATP on binding to RNA (Figure 4C, D and Supplementary Figure S5). These data are summarized in Table 1.
Table 1.
Summary of nucleic-acid binding to 2C in the presence and absence of ATP
| [ATP] | Dissociation constanta of WT 2Cb, Kd,app (nM) | Dissociation constanta of NΔ39 2Cb, Kd,app (nM) | ||
|---|---|---|---|---|
| WT | D177A | NΔ39 | D177A | |
| 0 mM | 110 ± 20 [75–150] | 170 ± 30 [110 – 190] | 320 ± 60 [210–440] | 330 ± 50 [230–420] |
| 1 mM | 180 ± 30 [125 – 230] | 150 ± 20 [110–190] | 250 ± 30 [180–310] | 240 ± 40 [160–320] |
| 5 mM | 170 ± 30 [65 – 270] | 240 ± 70 [80–390] | 430 ± 70 [290–570] | 400 ± 50 [290 – 510] |
aThe apparent dissociation constant (Kd,app) is presented ± standard error with 95% confidence interval provided in brackets below.
bData from Figure 4.
As indicated above, the prevailing view of the field is that picornaviral 2C proteins exist and function as hexamers (18,26,27,43,49,57), although our preparations only form dimers (Figure 2). To determine the stoichiometry of binding to RNA, we elevated the concentration of RNA used in the experiment to 3 μM, which is more than 10-times the value for Kd,app. For this experiment, we used NΔ39 because of its solubility in the absence of detergent. This experiment yielded a stoichiometry of two molecules of 2C, a dimer, per molecule of RNA (Figure 4E).
The value for polarization measured correlates with the mass of the complex in solution. The observation of essentially the same endpoint in all three experiments is consistent with a dimer forming in all three experiments (Figure 4A–C). The inability of protein concentrations as high as 20 μM to drive the equilibrium to complexes of higher mass suggests that a dimer may be the terminal state of PV 2C formed in solution (Figure 4C), consistent with the biophysical experiments reported above (Figure 2).
What these experiments do not reveal is whether the dissociation constant measured reflects a value for the 2C dimer, RNA-bound 2C dimer, or some combination thereof. Below, we perform experiments to distinguish between these possibilities.
PV 2C binding to nucleic acid is driven by the phosphodiester backbone
Members of SF3 include both RNA and DNA helicases. Whether specificity exists for one type of nucleic acid is not clear. In addition, the extent to which substituents other than the phosphodiester backbone contribute to affinity and/or specificity of nucleic acid binding is not known. Therefore, we evaluated the nucleic acid specificity for PV WT and NΔ39 2C proteins. In addition to RNA, we employed DNA, RNA modified at the 2′-hydroxyl, and morpholino nucleic acid (MNA) (Figure 5A). MNA contains a backbone that lacks the negative charge associated with the phosphate backbone of natural nucleic acid (58).
Figure 5.

2C binding to nucleic acid is driven by the phosphodiester backbone. (A) Chemical structures of nucleic acids used to assess binding to 2C are as follows: ssRNA, ssDNA, 2′-ACE-protected ssRNA, 2′O-methylated (2′-OMe) ssRNA, and morpholino nucleic acid (MNA). (B, C) 2C-nucleic acid binding. Fluorescein-labeled nucleic acid (10 nM) was mixed with increasing concentrations of 2C (WT, panel B; NΔ39, panel C). The resulting mP was plotted and the data were fit to Equation (1), yielding the apparent dissociation constants (Kd,app) reported in each panel. See Table 2 for a summary of calculated values. Error bars represent the SD (n = 3). (D, E) 2C-RNA binding competition experiments. A fixed concentration of 2C (2 μM; WT, panel D; NΔ39, panel E) was incubated with fluorescein-labeled ssRNA-1 (10 nM) in the absence or presence of varying concentrations of unlabeled ssRNA-1 or ssDNA-1. The mP was measured and plotted. The data were fit to Equation (3). Error bars represent the SD (n = 3). We observed no significant difference in the values obtained using ssRNA-1 or ssDNA-1.
As indicated by data above (Figure 4C), the affinity of NΔ39 for RNA was reduced by 3-fold relative to WT (compare RNA in Figure 5B to RNA in Figure 5C). Both proteins bound to DNA with affinity comparable to that of RNA (see panels DNA in Figure 5B, C). Consistent with this observation, blocking the 2′-hydroxyl of RNA by addition of a 2′-acetoxy orthoester (ACE) (59) or methyl group had essentially no impact on binding (see panels ACE and 2′-OMe in Figure 5B, C). In contrast, incorporation of a morpholino backbone ablated all detectable binding (see panels MNA in Figure 5B, C). To better assess the range of data points used for quantitative analysis, data have also been plotted on a log scale (Supplementary Figure S6). Values for the dissociation constants obtained are summarized in Table 2.
Table 2.
Summary of nucleic-acid binding to 2C and its effect on ATPase activity
| Nucleic acididentity | Dissociation constanta,b, Kd,app (nM) | Fold stimulationckobs (+ssRNA)/kobs (–ssRNA) | ||
|---|---|---|---|---|
| NΔ39 2Cb | WT 2C | NΔ39 2C | WT 2C | NΔ39 2C |
| ssRNA-1 | 110 ± 20 [70–150] | 320 ± 60 [210–440] | 32 | 28 |
| ssDNA-1 | 110 ± 20 [70–140] | 370 ± 90 [170–570] | 0.4 | 0.8 |
| ACE ssRNA-1 | 70 ± 10 [50–100] | 490 ± 100 [280–710] | 0.9 | 1.3 |
| 2′-OMe ssRNA-1 | 70 ± 10 [40–100] | 280 ± 50 [190–370] | 0.8 | 1.1 |
| MNA 1 | >>> 1000 | >>> 2500 | 0.6 | 0.7 |
To demonstrate that the site for binding to RNA was the same as that used for binding to DNA, we performed competition experiments. Both unlabeled DNA and RNA competed for binding of labeled RNA with essentially equivalent efficacy for both WT (Figure 5D) and NΔ39 (Figure 5E). Together, these data suggest that a single binding site exists for binding to single-stranded nucleic acid, and that the primary determinant for binding to this site is the phosphodiester backbone.
PV 2C exhibits RNA-stimulated ATPase activity
We used a thin layer chromatography-based assay to monitor conversion of [α-32P]-ATP to [α-32P]-ADP as described under Material and Methods. PV WT 2C exhibited low ATPase activity in the absence of RNA but exhibited substantial activity in the presence of a saturating concentration of RNA (Figure 6A) based on experiments shown above in Figure 5. Quantitation revealed a ∼30-fold increase in ATPase activity of WT 2C in the presence of RNA (Figure 6B, summarized in Table 2). We measured the RNA concentration dependence of the activation. In this experiment, WT 2C was present at a concentration of 2 μM 2C (1 μM dimer). We observed a linear increase in ATPase activity when increasing RNA concentrations until saturation, resembling a titration (Figure 6C). This observation is consistent with RNA binding measured by polarization actually reflecting formation of the 2C dimer.
Figure 6.

2C exhibits RNA-stimulated ATPase activity. ATPase activity of (A–F) WT 2C and (G–L) NΔ39 2C. (A, G) Phosphorimage of a TLC-PEI plate showing the hydrolysis of [α32-P]-ATP to [α32-P]-ADP by WT 2C (panel A) and NΔ39 2C (panel G) (2 μM) in the absence or presence of ssRNA-1 (5 μM). HCV NS3 was used as a positive control, denoted (+) and buffer was used a negative control, denoted (–). (B, H) Kinetics of ATP-hydrolysis for WT 2C (panel B) and NΔ39 2C (panel H) in the absence or presence of ssRNA-1. Shown are representative time courses using 2C (2 μM), ATP (500 μM), and ssRNA-1 (0 or 5 μM). The observed rates of ATP hydrolysis during the linear phase of the reactions were: WT, 1.4 ± 0.5 μM ADP min−1 in absence of nucleic acid and 44 ± 3 μM ADP min−1 in the presence of ssRNA-1; NΔ39, 0.47 ± 0.1 μM ADP min−1 in absence of nucleic acid and 13 ± 2 μM ADP min−1 in the presence of ssRNA-1. (C,I) RNA concentration dependence of 2C-stimulated ATPase activity for WT 2C (panel C) and NΔ39 2C (panel I). The rates of ATP hydrolysis as a function of RNA concentration were measured and plotted. The resulting data reflect a titration. (D, E, J, K) Steady-state kinetic analysis of 2C-ATPase activity was evaluated in the absence or presence of ssRNA-1 (WT, panels D,E; NΔ39, panels J,K). The initial rates of ATP hydrolysis were determined at different concentrations of ATP using 2C (2 μM) and ssRNA-1 (0 and 5 μM). The data were fit to Equation (2) yielding values for Km and Vmax reported in each panel. These data are summarized in Table 3. (F, L) 2C concentration dependence on the steady-state rate of ATP hydrolysis (WT, panel F; NΔ39, panel L). The initial rates of ATP hydrolysis were determined using ATP (500 μM) and a saturating concentration of ssRNA-1 (5 μM). The data were fit to Equation (6) yielding the K0.5 values reported in the individual panels.
To determine if RNA affects substrate binding and/or the rate-limiting step of the reaction under the conditions used, we performed a steady-state kinetic analysis of ATP hydrolysis in the absence (Figure 6D) and presence (Figure 6E) of RNA. The vast majority of the effect of RNA is on the maximal velocity of the reaction instead of the KM for ATP. These data are summarized in Table 3.
Table 3.
Summary of steady-state kinetic constants
| WT 2Ca | NΔ39 2Ca | |||||
|---|---|---|---|---|---|---|
| Substrate | [ssRNA-1] (μM) | Assay | K M (mM) | k cat (min−1) | K M (mM) | k cat (min−1) |
| ATP | 5 | Radioactiveb | 0.86 ± 0.2 [0.4–1.3] | 70 ± 4 [63–78] | 1.0 ± 0.3 [0.2–1.7] | 18 ± 1 [16–21] |
| ATP | 0 | Radioactiveb | 1.8 ± 0.2 [1.4–2.1] | 8.6 ± 0.2 [8.1–9.1] | 1.9 ± 1.2 [-0.6–4.5] | 3.2 ± 0.6 [2.1–4.5] |
| 3′-dATP | 5 | Colorimetricc | 0.70 ± 0.1 [0.5–0.9] | 27 ± 0.7 [25–29] | 3.5 ± 0.9 [1.5–5.4] | 19 ± 2 [15–24] |
If the Kd,app measured using polarization actually reflects formation of the 2C dimer, then under conditions in which RNA is present at a saturating concentration, then we should observe a 2C concentration dependence on the steady-state rate of ATP hydrolysis. In this case, the data should also fit to a quadratic equation with the value of K0.5 (2C concentration exhibiting half of the maximal stimulation) should be on par with the Kd,app value measured in Figure 5. Furthermore, the maximal rate should saturate at 2 μM 2C (1 μM dimer) and remain steady until the concentration of RNA is exceeded. The data were consistent with these predictions (Figure 6F). However, the K0.5 value measured was slightly higher than expected. We conclude that RNA binds productively to a 2C dimer and binding of RNA to a 2C monomer may interfere with formation of a 2C dimer capable of achieving the most active catalytically competent state.
We performed the same series of experiments using PV NΔ39 2C (Figure 6G–L). The conclusions drawn from these experiments were the same as those above for WT. Deletion of the first 39 amino acid residues causes a small but significant reduction in the affinity for ATP and maximal rate of ATP hydrolysis (compare Figure 6I,J to D,E). The amount of NΔ39 2C required to observe maximal activity was also higher (Figure 6L), suggesting that the amino terminus may contribute in some way to 2C dimer formation and/or stability.
A two-step mechanism for RNA binding to PV 2C and activation of its ATPase activity
Because DNA binds to PV 2C as well as RNA, we expected DNA to activate the ATPase activity as well as RNA. This was not observed for either WT or NΔ39 2C proteins (see panels DNA in Figure 7A-D). Interestingly, modification of the 2-hydroxyl also interfered with the ability of such modified RNA to stimulate the ATPase activity of both proteins (see panels ACE and 2′-OMe in Figure 7A–D). Consistent with the inability of MNA to bind to either protein, we did not observe stimulation of the ATPase in the presence of MNA (see panel MNA in Figure 7A–D). The simplest explanation for these observations is that RNA binds to PV 2C using a two-step mechanism. In the first step, binding is driven by the phosphodiester backbone. In the second step, one or more 2′-hydroxyls engage the protein and/or ATP to augment catalysis at the active site.
Figure 7.

Stimulation of 2C ATPase activity requires a 2′-OH. Kinetics of ATP-hydrolysis for (A, B) WT 2C and (C, D) NΔ39 2C protein in the absence or presence of nucleic acid (ssRNA; ssDNA; 2′-ACE ssRNA, 2′-OMe ssRNA, and MNA). Representative time courses are shown using 2C (2 μM), ATP (A, C: 500 μM; B, D: 5 000 μM), and nucleic acid (0 or 5 μM). The initial rates of ATP hydrolysis were determined, and the fold stimulation is summarized in Table 1. Only the ssRNA-1 stimulated 2C ATPase activity. (E, F) RNA-stimulated 2C ATPase activity competition experiments. A fixed concentration of 2C (2 μM; WT, panel C; NΔ39, panel D) was incubated with ssRNA-1 (0 or 5 μM) in the absence (open grey square) or presence (closed circles) of varying concentrations of ssDNA-1. The initial rates of ATP hydrolysis were determined and plotted. The data were fit to Equation (3). Error bars represent the SD (n = 3). Only the RNA-stimulated 2C ATPase activity was reduced with increasing concentrations of ssDNA-1. The stimulation rates and fold-changes presented here are summarized in Table 2.
We evaluated the capacity for dsRNA to activate 2C ATPase activity (Supplementary Figure S7). This experiment used two complementary 19-nt ssRNA sequences (ssRNA-6 and ssRNA-7) with a low probability of forming secondary structure that form a dsRNA (Duplex 3) when annealed (Supplementary Figure S7A). At 10 μM, each of these ssRNAs only exhibited a 2-fold stimulation of the ATPase activity (Supplementary Figure S7B). Under these same conditions, ssRNA-1 exhibited a 16-fold increase (Supplementary Figure S7B). These studies suggest that RNA sequence may also govern the affinity of binding to 2C and the concentration dependence of the activation of ATPase activity. Duplex 3 failed to stimulate ATPase activity (Supplementary Figure S7B), consistent with the inaccessibility of the 2′-hydroxyls for interactions with the protein.
To strengthen the argument that DNA binds to the same site as RNA and that RNA binding to this site activates ATPase activity, we performed competition experiments. DNA outcompeted RNA, reducing the ATPase to basal levels for both WT (Figure 7C) and NΔ39 2C (Figure 7D). This experiment also highlights the fact that the basal activity observed for 2C does not reflect contaminating RNA, because DNA should have competed contaminating RNA away as well (see –ssRNA-1 in Figure 7E, F).
A two-step mechanism for ATP binding to PV 2C
Previous studies of the nucleotide specificity of the enteroviral 2C protein have hinted at the possibility that nucleotides other than ATP may serve as substrates for 2C (15,60). Given the substantial increase in ATPase activity observed in the presence of RNA, we evaluated nucleotide specificity here. Using [α-32P]-labeled nucleoside triphosphates, we only detected 2C-dependent formation of the diphosphate product when ATP was used as substrate (Figure 8A). 2′-dATP was not used by 2C as a substrate (Figure 8A). To determine if the inability of the other nucleoside triphosphates to serve as substrates was a reflection of their inability to bind 2C, we evaluated their ability to inhibit turnover of ATP. GTP, CTP, and UTP inhibited turnover of ATP (Figure 8B-D,G). Interestingly, the IC50 values measured (Figure 8B-D,G) were on par with the KM value measured for ATP (Figure 6E).
Figure 8.

2C-catalyzed ATP hydrolysis occurs via a two-step mechanism. (A) Specificity of 2C-nucleoside triphosphatase activity. The kinetics of 2C-catalyzed NTP hydrolysis is depicted using either ATP (•), CTP (▪), GTP (▴), UTP (▾), or 2′-dATP (♦) as the substrate. WT 2C (2 μM) was incubated with ssRNA-1 (5 μM) and [α32-P]-NTP (1 mM) and the percentage of NTP hydrolyzed was determined and plotted. Error bars represent the SD (n = 3). (B–J) 2C ATPase activity competition experiments. A fixed concentration of WT 2C (2 μM) was incubated with ssRNA-1 (5 μM) and [α32-P]-ATP (0.5 mM) in the presence of varying concentrations of different unlabeled nucleotides (GTP, CTP, UTP, ADP, AMP, 2′-dATP, ATPγS, β,γ-methylene ATP, or AMP-PNP). The initial rates of ATP hydrolysis were determined and plotted. The data were fit to Equation (3), yielding the IC50 values reported in each panel. Error bars represent the SD (n = 3). (K, L) Competition of 2C-mediated ATP hydrolysis by the nucleotide analogs remdesivir-triphosphate (RDV-TP) and 2′-C-methyl ATP. A fixed concentration of WT 2C (2 μM) was incubated with ssRNA-1 (5 μM) and [α32-P]-ATP (500 μM) in the presence of varying concentrations of RDV-TP or 2′-C-methyl-ATP. The initial rates of ATP hydrolysis were determined and plotted. The data were fit to Equation (3), yielding the IC50 values reported in each panel. Error bars represent the SD (n = 3). Ki values (84) are summarized in Table 4.
One explanation for the above observation is that the triphosphate moiety drives the initial binding of a nucleoside triphosphate to 2C. To test this possibility, we evaluated the ability of ADP and AMP to inhibit turnover of ATP by 2C. ADP inhibited turnover of ATP as well as GTP, CTP, and UTP (Figure 8E). AMP was a much weaker inhibitor of ATP turnover (Figure 8F). While ATPγS competed well with ATP, other non-hydrolyzable analogues of ATP did not compete well and may therefore be of limited utility for structural studies (Figures 8I,J). These data are summarized in Table 4.
Table 4.
Calculated inhibition constants (Ki) for each nucleotide
| K i (mM)a | ||
|---|---|---|
| Nucleotideb | WT 2C | NΔ39 2C |
| ADP | 0.75 ± 0.1 [0.6–1.1] | 0.44 ± 0.2 [0.1–0.8] |
| AMP | NSc | NSc |
| RDV TP | 0.32 ± 0.1 [0.1–0.54] | 0.20 ± 0.1 [0.0–0.4] |
| 2′-C-methyl ATP | 0.40 ± 0.1 [0.2–0.64] | 0.21 ± 0.1 [0–0.41] |
| CTP | 0.47 ± 0.1 [0.3–0.72] | 0.48 ± 0.1 [0.3–0.79] |
| GTP | 0.49 ± 0.1 [0.3–0.71] | 0.48 ± 0.1 [0.32–0.78] |
| UTP | 0.70 ± 0.2 [0.3–1.1] | 0.48 ± 0.1 [0.22–0.69] |
| 2′-dATP | 0.55 ± 0.1 [0.35–0.75] | 0.43 ± 0.1 [0.20–0.64] |
| ATPγS | 0.15 ± 0.1 [0.0–0.38] | 0.02 ± 0.01 [0.015–0.023] |
| β,γ-methylene ATP | NSc | NSc |
| AMP-PNP | NSc | NSc |
Together, these data suggest that the alpha and beta phosphates are necessary and sufficient for initial binding of nucleotides to 2C. A second step in the binding mechanism would then enable recognition of the base bound and somehow couple the presence of an adenine base to catalytic competence of the active site.
Determinants of ATP sensed after binding and required for hydrolysis
Our studies make a compelling case for the existence of a conformation of the PV 2C-ATP complex that links binding of the correct nucleotide to catalytic competence of the active site. As a first step towards identification of other determinants of ATP interrogated in the second step of binding that are required for catalysis, we have investigated the activity of several analogues of ATP.
First, we evaluated 2′-dATP because a radiolabeled version of this analogue was available. The absence of the 2′-OH prevented hydrolysis to form 2′-dADP (Figure 8A). Other analogues were not available in a radiolabeled form, so we turned to a secondary, colorimetric assay for ATP hydrolysis (Figure 9A). This assay uses a proprietary malachite green-based reagent to detect phosphate directly. The rate of ATP hydrolysis by PV 2C measured using this colorimetric assay was identical to that measured using the radiolabel assay (Figure 9B). The non-hydrolyzable analogues ATPγS and β,γ-methylene ATP were inactive (Figure 9D). Surprisingly, the antiviral nucleotides, remdesivir triphosphate (RDV-TP) (61) and 2′-C-methyl adenosine triphosphate (2′-C-methyl ATP) (62,63), were not substrates (Figure 9C, D), despite both competing well against ATP for binding to 2C (Figure 8K, L). Structures of these analogues are shown in Figure 9C. Not all analogues tested were inactive; 3′-dATP was a good substrate for PV 2C, with a reduced kcat value compared to ATP (Figure 9E).
Figure 9.

Nucleotide determinants required for 2C-catalyzed hydrolysis. (A) Schematic of BioAssay Systems QuantiChrom™ ATPase/GTPase Assay. This assay utilizes a colorimetric method for monitoring ATP hydrolysis. After ATP hydrolysis yielding ADP and phosphate (Pi), a proprietary malachite green compound binds directly to phosphate yielding a green color change that can be detected at 620 nm. The increase in absorbance at 620 nM is directly proportional to the amount of phosphate. Image created with BioRender.com under license. (B) Radiolabeled vs Colorimetric ATPase assay. Direct comparison of the kinetics of 2C-catalyzed ATP hydrolysis obtained using radiolabeled ATP or BioAssay Systems colorimetric assay. WT 2C (2 μM) was incubated with ssRNA-1 (5 μM) and ATP (1 mM) and the amount of NTP hydrolyzed was determined and plotted. Error bars represent the SD (n = 3). (C, D) 2C does not utilize the adenosine triphosphate analogs, remdesivir-triphosphate (RDV-TP) and 2′-C-methyl-ATP, as substrates. (C) Chemical structures for ATP, RDV-TP and 2′-C-methyl-ATP. The chemical moieties that are different from ATP are highlighted. (D) Kinetics of 2C-catalyzed NTP hydrolysis. WT 2C (2 μM) was incubated with ssRNA-1 (5 μM) and either ATPγS, β,γ-methylene ATP, RDV-TP, or 2′-C-methyl ATP (1 mM) for up to 60 min. The amount of NTP hydrolyzed was determined using BioAssay Systems colorimetric assay. The amount of NTP hydrolyzed is plotted. Error bars represent the SD (n = 3). The molecules ATPγS and β,γ-methylene-ATP was used as a negative control because they are incapable of being hydrolyzed. (E) 3′-dATPase activity of 2C. The initial rates of 3′-dATP hydrolysis were determined at different concentrations of 3′-dATP using WT 2C (2 μM) and ssRNA-1 (5 μM) using BioAssay Systems colorimetric assay and is summarized in Table 3. The data were fit to Equation (2) yielding values for Km and kcat. Error bars represent the SD (n = 3).
While the structure–activity relationships studied here are far from comprehensive, the relationships enumerated here make it clear that more than the adenine base is essential to formation of a PV 2C-ATP complex competent for hydrolysis.
PV 2C does not exhibit RNA helicase activity using established helicase substrates
To date, only one laboratory has reported helicase activity for a picornaviral 2C or 2C-like enzyme (24). In the case of the picornaviral 2C, this laboratory suggested that an unidentified, post-translational modification installed by expression of the protein in insect cells bestowed this activity to their protein (24). This conclusion has been challenged by the observation that other picornaviral 2C proteins expressed and purified from insect cells appear to lack a similar post-translational modification and are inactive as helicases (50).
Assaying RNA unwinding generally requires a concentration of dsRNA low enough to prevent reannealing and an enzyme concentration high enough to have all of the dsRNA bound. The experiments described above placed us in a unique position to achieve optimal conditions for unwinding. We used two different unwinding substrates. Duplex 1 has a 9-bp duplex flanked by 20-nt single-stranded tails for loading and translocation of the helicase (Figure 10A). This design permits unwinding regardless of the polarity of the helicase; similar substrates have been used by us in the past (64,65). Duplex 2 is a forked, unwinding substrate (Figure 10A). Hexameric helicases have been shown to work best when the displaced strand interacts with the enzyme (65). In these experiments, we used HCV NS3 as a positive control. This enzyme was able to unwind both substrates under two different solution conditions (see panels HCV NS3 in Figure 10B, C). In contrast, PV 2C was unable to unwind either substrate (see panels WT 2C in Figure 10B, C).
Figure 10.

2C does not exhibit RNA helicase activity. (A) Schematic of dsRNA Duplex substrates used to assess RNA helicase activity. dsRNA Duplex substrates 1 and 2 are formed using ssRNA 2 & ssRNA 3 and ssRNA 4 & ssRNA 5, respectively. See Supplementary Table S1 for RNA sequences. Both Duplex substrates contain a 9-bp region; sequence is highlighted. Duplex 1 is flanked by 20-nt single-stranded tails on the 5′ and 3′-ends of ssRNA 2. Duplex 2 is forked, such that there are two single-stranded tails on either side of the duplex, formed by ssRNA 4 and ssRNA 5. ssRNA 3 and ssRNA 5 were 32P-labeled, indicated by a star. (B, C) RNA helicase activity. RNA unwinding by 2C was assessed by phosphorimaging of native polyacrylamide gels. HCV NS3 (0.5 μM) or WT 2C (2 μM) was incubated with 10 nM Duplex 1 (panel B) or Duplex 2 (panel C) using two different reaction conditions (Mix A and Mix B as detailed under Materials and Methods). The unwinding reactions were quenched after 2, 5, and 15 minutes. HCV NS3 was used as a positive control for RNA unwinding. Buffer indicates quenched reactions without enzyme, and heat indicates reactions heated to 90 °C prior to being quenched, resulting in single-stranded RNA.
Other enteroviral 2C proteins exhibit RNA-stimulated ATPase activity
A major conceptual advance of the studies reported here for PV 2C is that RNA is required for optimal ATPase activity. To broaden the significance of this study, we have purified the NΔ39 2C derivatives from enterovirus A71 (EV-A71), Coxsackievirus B3 (CVB3), and enterovirus D68 (EV-D68) using a protocol identical to that used for PV as described under Materials and Methods (Figure 11A). All of these enzymes exhibited RNA-stimulated ATPase activity and are not stimulated by ssDNA (Figure 11B).
Figure 11.

RNA-stimulated ATPase activity observed for members of enteroviral species A–D. (A) Purified NΔ39 2C proteins (5 μg each) from Coxsackievirus B3 (CVB3), Enterovirus A71 (EV-A71), and Enterovirus D68 (EV-D68) were visualized on a 15% polyacrylamide gel and was stained with Coomassie. (B) RNA-stimulated enteroviral 2C ATPase activity. Rates of ATP hydrolysis were compared between enteroviruses using the indicated NΔ39 2C proteins in the absence or presence of ssRNA. Reactions contained 4 μM 2C, 500 μM ATP, and ssRNA-1 (0 or 10 μM).
DISCUSSION
Enteroviruses encode several enzymes required for multiplication, the most conserved of which are the 3D gene-encoded RdRp and the 2C gene-encoded AAA + ATPase and SF3 helicase. A deep understanding of the enteroviral RdRp structure, dynamics, and mechanism exists, although few enteroviral RdRp inhibitors exist (66). In contrast, many enteroviral inhibitors known or suggested to target 2C exist; however, insufficient information exists on 2C biochemistry and biophysics to explain the mechanism of action of any of the known inhibitors. Decades of studies on picornaviral 2C proteins have been published (12,14,15,18). The majority of these have focused on documenting the existence of ATPase activity, demonstrating the use of conserved residues for this activity and virus viability, and/or investigating subunit stoichiometry and organization (11–16,18,21,26,27). Our current mechanistic understanding of the enteroviral 2C ATPase lags far behind viral ATPases and helicases belonging to other superfamilies (39,67–71). The goal of this study was to establish a framework to guide future studies of the specificity, kinetic and chemical mechanisms, and inhibition of the enteroviral 2C ATPase using PV 2C as our model system.
The amino terminus of 2C contains an amphipathic α-helix, the function of which is thought to be attachment to membranes used for genome replication and/or morphogenesis (Figure 1D) (11,72). The hydrophobic nature of this helix is thought to promote aggregation and insolubility. Until this study (Figure 1), full-length 2C protein purified by others was always fused to another protein to permit solubility (15,26,27). One study was able to produce untagged protein by translating an mRNA encoding 2C in the presence of a nanodisc-supported lipid bilayer (73). Another study involved making 2C derivatives that included the full-length protein and soluble portions of the adjacent 2B and 3A proteins (27). Various amino-terminal truncations were made to produce soluble derivatives (25,43,48,49). Deletion of the amino-terminal 33 residues from Foot-and-Mouth-Disease virus (FMDV) yielded an active, well-behaved protein (25). Derivatives from PV and EV-A71 deleted for the first 115 amino acids yielded proteins that could be crystallized, although these proteins were essentially devoid of enzymatic activity (Supplementary Figure S1). Deletion of the amino-terminal 39 residues of PV 2C and other enteroviral 2C proteins produced active enzymes with overall specificity and activity comparable to the full-length protein (Figures 6 and 11).
Several studies have reported the ability of picornaviral 2C proteins to bind viral and non-viral RNAs, consistent with the expectation that this protein is an RNA helicase (55,56). However, the functional consequence of RNA binding, if any, is not known. Members of helicase superfamily 2, for example the RNA helicase from Hepatitis C virus, binds RNA with high affinity in the absence of ATP but not in the presence of ATP (65). In addition, RNA binding stimulates its ATPase activity (65,71). Toggling between high- and low-affinity states in an ATP-directed manner is thought to couple the directional translocation of the helicase during unwinding to cycles of ATP hydrolysis (65,67,74). Both active and inactive (D177A) forms of PV 2C associated with RNA; however, the presence of ATP had little effect on the interaction with RNA (Figure 4). Binding of RNA to PV 2C and other enteroviral 2C proteins stimulated ATPase activity by more than an order of magnitude (Figures 6 and 11). Steady-state kinetic analysis revealed that the primary effect of RNA is on the maximal rate of the reaction (kcat) instead of the ATP concentration dependence (compare Figure 6D to E and J to K). At this stage, we do not know the elementary step(s) of the mechanism reflected by kcat. In some systems, nucleic acid binding stabilizes the closed state of the enzyme, thus promoting catalysis (39,70,75,76). In other non-SF3 systems, the rate-limiting step is release of the phosphate product, which is coupled to the work (translocation, unwinding) performed by the enzyme (65). Regardless of the molecular mechanism, RNA stimulates the activity of 2C to an extent that it may be best to consider 2C as an RNA-dependent ATPase. The fact that others have not reported the RNA dependence may reflect co-purification of RNA and the absence of deliberate assessment of its presence (15,25,26).
AAA + ATPases and SF3 helicases are usually ring-shaped hexamers or some multiple of hexamers (77). The substrate passes through the central pore in ATP-dependent fashion with processive translocation through the pore facilitated by successive rounds of ATP hydrolysis by one of the six active sites formed at each subunit-subunit interface (77). Most published studies using a purified picornaviral 2C protein have pursued elucidation of its oligomeric structure, most often by using conventional electron microscopy (25–27). However, in no case does it appear that formation of oligomers occurs efficiently (18,26,27). In our system, the stoichiometry of 2C:RNA was 2:1 (Figure 4E). The value of the Kd,app for this interaction was in the 100–400 nM range (Figures 4 and 5). Because this experiment was performed using polarization, which is sensitive to the mass of the complex, the inability to detect a change in polarization at concentrations as high as 20 μM suggested that the dimer may be a terminal state (Figure 4E). Biophysical experiments, including SEC-MALS (Figure 2A) and SAXS (Figure 2C), were also consistent with formation of only a dimer in solution. Dilution ITC experiments (Figure 2B) were consistent with a dissociation constant in 100–400 nM regime. All attempts to use our protein preparations to detect oligomers have only suggested dimers and may require stabilizing complexes with ATPγS as performed in the FMDV system (25). However, even in the presence of ATPγS, the efficiency of oligomerization only approached 15%, and was even less efficient for similar systems using echovirus 30 2C protein (27). We conclude that a functional 2C dimer readily forms in solution and suggest that such a form may have a biological function. If a hexamer is required, then it may need other viral or cellular proteins for assembly (78,79). The empty viral particle represents a possible platform for assembly of a 2C oligomer, reminiscent of the tethering domain observed in SV40 Large T-antigen (Figure 3D and F).
Experiments measuring formation of the 2C•RNA complex monitored the 2C-concentration dependence of polarization (Figure 4 and 5). However, it was not clear if the titration measured the concentration dependence of dimer formation followed by RNA binding or sequential binding of 2C monomers to RNA. If formation of the 2C dimer were a prerequisite to binding RNA, then a difference might exist for the observed rate of hydrolysis when the 2C concentration was 10•Kd compared to that when the RNA concentration was 10•Kd. When the dimer was preformed, we essentially observed stoichiometric activation of the ATPase activity by RNA (Figure 6C and I). However, when RNA was in excess, we observed a normal binding isotherm, with a value of the K0.5 higher than the equilibrium value of the Kd,app (Figure 6F and L to Figure 5B and C, respectively). These observations are consistent with a 2C2 dimer forming prior to RNA binding. In this case, the affinity of the RNA for the dimer likely has a lower value of the Kd,app for RNA than the dimer by as much as an order of magnitude. The presence of high concentrations of RNA would yield interactions with monomer, but formation of this complex would interfere with formation of the 2C2•RNA complex, resulting in a value of the K0.5 higher than observed for equilibrium Kd,app as observed. Loss of the amino-terminal 39 residues increased the K0.5 value (compare Figure 6F to L), suggesting a role for the amino terminus in formation and/or stability of the 2C2 dimer.
Although the 2C dimer bound a variety of nucleic acids (Figure 5) and nucleotides (Figure 8), only RNA activated the ATPase activity (Figure 7) and ATP (Figure 8A and 9) was the preferred nucleotide substrate. The simplest explanation for this observation is that binding of RNA and ATP to the 2C dimer uses a two-step mechanism. The first step governs ground-state binding and isomerization of this complex yields the activated or catalytically competent state. It is in the second step that proofreading of the bound nucleic acids and nucleotide occurs. A similar, two-step mechanism has been shown for binding of RNA to eIF4a family members, DEAD-box helicases contributing to translation initiation (80–82). In the absence of the RNA 2′-hydroxyls, the closed, catalytically competent state cannot be achieved (82). Determinants of ATP specificity are well known for ATPases/helicases (65); however, many helicases will use other nucleotides as well (83). The reason for a strict dependence on ATP is unclear.
The experiments reported herein permit the establishment of the first minimal kinetic mechanism for ATP hydrolysis by the enteroviral 2C protein (Figure 12A). We suggest that the first step is formation of a 2C dimer, 2C2, with a Kd,app in the 0.100–1 μM range depending on the disposition of the amino terminus (Step 1 in Figure 12A). Binding of RNA (R) and ATP (T) to 2C2 will occur randomly (Steps 2A and 3A or 2B and 3B in Figure 12A) to produce a ternary complex in its ground state, R•2C2•T. Formation of this complex is driven by the α- and β-phosphates of the nucleotide, any nucleotide (Figure 12B) and the phosphodiester backbone of nucleic acid, again any nucleic acid (Figure 12C). The ternary complex undergoes a conformational change to produce *R•2C2•T* (Step 4 in Figure 12A). ATP undergoes fast hydrolysis in *R•2C2•T* and slow hydrolysis in an activated binary complex (2C2•T* in Figure 12A). We do not believe hydrolysis is occurring in the ground-state complex. If this were the case, then GTP, CTP and UTP should be substrates. Finally, there are alternative pathways to formation of *R•2C2•T* (Steps 3A’-5A’ and 3B’-5B’ in Figure 12A). These are presented for completeness without any evidence of their existence or relevance.
Figure 12.

Proposed kinetic mechanism and determinants of specificity and catalytic efficiency for enteroviral 2C ATPase activity. (A) Minimal kinetic mechanism for 2C-catalyzed hydrolysis of ATP (T) in the absence and presence of RNA (R) to produce ADP (D) and inorganic phosphate (P). [i] Because a dimer is the minimally active form of 2C, experiments were performed under conditions in which the dimer was always present. [ii] Binding of ATP and RNA presumably occurs randomly. A major finding here is evidence for a catalytically competent state of the complex (*R•2C2•T*) driven by determinants of ATP and RNA that govern ground-state binding (R•2C2•T). See text for greater detail. (B) Diagram of ATP highlighting the α- and β-phosphates (orange) as primary determinants for binding to 2C and the 2′-OH and adenine base (blue) as determinants sensed after binding to form the catalytically competent state. (C) Diagram of RNA highlighting the phosphodiester backbone (orange) as the primary determinant for binding to 2C and the 2′-OH groups (blue) as determinants sensed after binding to form the catalytically competent state. (D) Schematic illustrating the proximity of conserved structural motifs to functional groups on the ATP substrates as predicted by other systems (77). The active site is formed at the interface of two subunits. The motifs are: Walker A (K135), Walker B (D177), and motif C (N223), which derive from one monomer of 2C, and the arginine finger (R-finger; R240, R241), which derives from the second monomer of 2C. (E) Alignment of sequences comprising the active sites of 2C proteins from PV, EV-A71, CVB3 and EV-D68. Numerous conserved residues exist beyond those with assigned function based on other AAA + ATPases and SF3 helicases. These conserved residues of the indicated motifs may function to confer the strict specificity of these enzymes for ATP.
Formation and/or stability of *R•2C2•T* requires the multiple determinants of ATP: the 2′-OH, the adenine base, among other substituents (Figure 12B). Loss of the 2′-OH or addition of a single methyl group to the 2′-carbon inactivated hydrolysis (Figure 9D). That these observations represent the underpinning of an evolved mechanism is suggested by the fact that the enzyme does not surveil positions of ATP common to all nucleotides; 3′-dATP is a respectable substrate (Figure 9E). Formation and/or stability of *R•2C2•T* requires the 2′-OH of RNA (Figure 12C). A structural perspective of this catalytically competent ternary complex does not exist and is difficult to infer. Clearly, the conserved motifs at the active site have the ability to contribute to formation and/or stability of the catalytically competent state (Supplementary Figure S3A and Figure 12D). However, these conserved motifs are present in myriad ATPases/helicases, even those that do not exhibit strict specificity for ATP or RNA. Alignment of the enteroviral 2C proteins studied here identify numerous conserved residues beyond the signature motifs that may contribute to the nucleotide and nucleic acid specificity described herein (Figure 12E). We are optimistic that the groundwork established here will facilitate elucidation of high-resolution structures of the catalytically competent state.
The limitations of our study include the use of bacterially expressed proteins and non-viral RNAs. With that caveat noted, whether or not PV 2C or other enteroviral 2C proteins are helicases remains an open question. One study has reported helicase activity for an enteroviral 2C protein (24). The helicase activity is attributed to post-translational modification installed during expression in insect cells (24). This observation has not been reproduced by others (15,26,50). The apparent mass of PV 2C produced in bacteria is equivalent to that produced in PV-infected, human cells (Supplementary Figure S1D). Substrates for RNA unwinding based on those used by other SF3 helicases (64,65) do not support unwinding by PV 2C (Figure 10). HCV NS3 uses both (Figure 10). If formation of a hexamer is essential for helicase activity, then dimers would be inactive. The translocase activity would be used for encapsidation of the viral genome. As discussed above, perhaps the empty viral capsid would serve as a scaffold for assembly of the hexamer. Indeed, interactions between 2C and the capsid are known and essential for morphogenesis (13,14,16,57). Is there a biological role for a dimeric, RNA-dependent ATPase during the enteroviral lifecycle? Further studies will be required to address this question. If not, perhaps other scaffolds for may exist to assemble hexamers during genome replication. In conclusion, the framework established here will permit elucidation of the specificity and kinetic and chemical mechanisms of the enteroviral 2C protein, as well as enable elucidation of mechanisms of action of inhibitors targeting 2C.
DATA AVAILABILITY
All data are incorporated into the article and its online supplementary material. Constructs and full data sets presented in this study are available upon request to the corresponding author.
Supplementary Material
ACKNOWLEDGEMENTS
Our thanks to members of the Cameron Lab for their support. Special thanks to Molly M. Yeager, Ph. D., for edits. Thanks to Dr. Suresh Sharma for his contributions to Supplementary Figure S1D. We also thank Ms. Julia Fecko at the X-ray Crystallography Core at the Penn State Huck Institutes of the Life Sciences for contributions to acquisition of data presented in Figure 2. Finally, we thank Joy Feng for providing remdesivir triphosphate.
Contributor Information
Calvin Yeager, Department of Microbiology & Immunology, University of North Carolina at Chapel Hill, Chapel Hill, NC 27599, USA.
Griffin Carter, Department of Microbiology & Immunology, University of North Carolina at Chapel Hill, Chapel Hill, NC 27599, USA.
David W Gohara, Department of Biochemistry and Molecular Biology, St. Louis University, St. Louis, MO 63104, USA.
Neela H Yennawar, The Huck Institutes of the Life Sciences, The Pennsylvania State University, University Park, PA 16802, USA.
Eric J Enemark, Department of Biochemistry and Molecular Biology, University of Arkansas for Medical Sciences, Little Rock, AR 72205, USA.
Jamie J Arnold, Department of Microbiology & Immunology, University of North Carolina at Chapel Hill, Chapel Hill, NC 27599, USA.
Craig E Cameron, Department of Microbiology & Immunology, University of North Carolina at Chapel Hill, Chapel Hill, NC 27599, USA.
SUPPLEMENTARY DATA
Supplementary Data are available at NAR Online.
FUNDING
Pennsylvania State University Eberly Family Endowment; National Science Foundation Graduate Research Fellowship [DGE-2040435]; C.Y. is additionally supported by the NIAID/National Institutes of Health Molecular Biology of Viral Diseases Predoctoral Training Grant [T32AI007419]; C.E.C., J.J.A. and N.H.Y. are supported by NIAID/National Institutes of Health [AI169462-01]; SIG S10 of the National Institutes of Health [S10-OD028589 for the Riagku BioSAXSnano small angle X-ray scattering, S10-OD025145 for the TA instruments AutoAffinity ITC, S10-OD030490 for the Wyatt SEC-MALS-DLS system to N.H.Y.]. Funding for open access charge: NIAID/National Institutes of Health [AI169462-01].
Conflict of interest statement. None declared.
REFERENCES
- 1. Hyypiä T., Hovi T., Knowles N.J., Stanway G.. Classification of enteroviruses based on molecular and biological properties. J. Gen. Virol. 1997; 78:1–11. [DOI] [PubMed] [Google Scholar]
- 2. Adams M.J., Lefkowitz E.J., King A.M., Bamford D.H., Breitbart M., Davison A.J., Ghabrial S.A., Gorbalenya A.E., Knowles N.J., Krell P.et al.. Ratification vote on taxonomic proposals to the international committee on taxonomy of viruses (2015). Arch. Virol. 2015; 160:1837–1850. [DOI] [PubMed] [Google Scholar]
- 3. Murphy O.C., Messacar K., Benson L., Bove R., Carpenter J.L., Crawford T., Dean J., DeBiasi R., Desai J., Elrick M.J.et al.. Acute flaccid myelitis: cause, diagnosis, and management. Lancet. 2021; 397:334–346. [DOI] [PMC free article] [PubMed] [Google Scholar]
- 4. Holm-Hansen C.C., Midgley S.E., Fischer T.K.. Global emergence of enterovirus D68: a systematic review. Lancet Infect. Dis. 2016; 16:e64–e75. [DOI] [PubMed] [Google Scholar]
- 5. Kandolf R., Sauter M., Aepinus C., Schnorr J.J., Selinka H.C., Klingel K.. Mechanisms and consequences of enterovirus persistence in cardiac myocytes and cells of the immune system. Virus Res. 1999; 62:149–158. [DOI] [PubMed] [Google Scholar]
- 6. Chapman N.M., Kim K.S.. Persistent coxsackievirus infection: enterovirus persistence in chronic myocarditis and dilated cardiomyopathy. Curr. Top. Microbiol. Immunol. 2008; 323:275–292. [DOI] [PubMed] [Google Scholar]
- 7. Norder H., De Palma A.M., Selisko B., Costenaro L., Papageorgiou N., Arnan C., Coutard B., Lantez V., De Lamballerie X., Baronti C.et al.. Picornavirus non-structural proteins as targets for new anti-virals with broad activity. Antiviral Res. 2011; 89:204–218. [DOI] [PubMed] [Google Scholar]
- 8. Pincus S.E., Diamond D.C., Emini E.A., Wimmer E.. Guanidine-selected mutants of poliovirus: mapping of point mutations to polypeptide 2C. J. Virol. 1986; 57:638–646. [DOI] [PMC free article] [PubMed] [Google Scholar]
- 9. Pfister T., Jones K.W., Wimmer E.. A cysteine-rich motif in poliovirus protein 2C(ATPase) is involved in RNA replication and binds zinc in vitro. J. Virol. 2000; 74:334–343. [DOI] [PMC free article] [PubMed] [Google Scholar]
- 10. Rodríguez P.L., Carrasco L.. Poliovirus protein 2C contains two regions involved in RNA binding activity. J. Biol. Chem. 1995; 270:10105–10112. [DOI] [PubMed] [Google Scholar]
- 11. Paul A.V., Molla A., Wimmer E.. Studies of a putative amphipathic helix in the N-terminus of poliovirus protein 2C. Virology. 1994; 199:188–199. [DOI] [PubMed] [Google Scholar]
- 12. Li J.P., Baltimore D. Isolation of poliovirus 2C mutants defective in viral RNA synthesis. J. Virol. 1988; 62:4016–4021. [DOI] [PMC free article] [PubMed] [Google Scholar]
- 13. Vance L.M., Moscufo N., Chow M., Heinz B.A.. Poliovirus 2C region functions during encapsidation of viral RNA. J. Virol. 1997; 71:8759–8765. [DOI] [PMC free article] [PubMed] [Google Scholar]
- 14. Wang C., Jiang P., Sand C., Paul A.V., Wimmer E.. Alanine scanning of poliovirus 2CATPase reveals new genetic evidence that capsid protein/2CATPase interactions are essential for morphogenesis. J. Virol. 2012; 86:9964–9975. [DOI] [PMC free article] [PubMed] [Google Scholar]
- 15. Pfister T., Wimmer E.. Characterization of the nucleoside triphosphatase activity of poliovirus protein 2C reveals a mechanism by which guanidine inhibits poliovirus replication. J. Biol. Chem. 1999; 274:6992–7001. [DOI] [PubMed] [Google Scholar]
- 16. Liu Y., Wang C., Mueller S., Paul A.V., Wimmer E., Jiang P.. Direct interaction between two viral proteins, the nonstructural protein 2C and the capsid protein VP3, is required for enterovirus morphogenesis. PLoS Pathog. 2010; 6:e1001066. [DOI] [PMC free article] [PubMed] [Google Scholar]
- 17. Baltimore D., Eggers H.J., Franklin R.M., Tamm I.. Poliovirus-induced RNA polymerase and the effects of virus-specific inhibitors on its production. Proc. Natl. Acad. Sci. U.S.A. 1963; 49:843–849. [DOI] [PMC free article] [PubMed] [Google Scholar]
- 18. Hurdiss D.L., El Kazzi P., Bauer L., Papageorgiou N., Ferron F.P., Donselaar T., van Vliet A.L.W., Shamorkina T.M., Snijder J., Canard B.et al.. Fluoxetine targets an allosteric site in the enterovirus 2C AAA+ ATPase and stabilizes a ring-shaped hexameric complex. Sci. Adv. 2022; 8:eabj7615. [DOI] [PMC free article] [PubMed] [Google Scholar]
- 19. Ulferts R., de Boer S.M., van der Linden L., Bauer L., Lyoo H.R., Maté M.J., Lichière J., Canard B., Lelieveld D., Omta W.et al.. Screening of a library of FDA-Approved drugs identifies several enterovirus replication inhibitors that target viral protein 2C. Antimicrob. Agents Chemother. 2016; 60:2627–2638. [DOI] [PMC free article] [PubMed] [Google Scholar]
- 20. Neuwald A.F., Aravind L., Spouge J.L., Koonin E.V.. AAA+: a class of chaperone-like ATPases associated with the assembly, operation, and disassembly of protein complexes. Genome Res. 1999; 9:27–43. [PubMed] [Google Scholar]
- 21. Mirzayan C., Wimmer E.. Genetic analysis of an NTP-binding motif in poliovirus polypeptide 2C. Virology. 1992; 189:547–555. [DOI] [PubMed] [Google Scholar]
- 22. Teterina N.L., Kean K.M., Gorbalenya A.E., Agol V.I., Girard M.. Analysis of the functional significance of amino acid residues in the putative NTP-binding pattern of the poliovirus 2C protein. J. Gen. Virol. 1992; 73:1977–1986. [DOI] [PubMed] [Google Scholar]
- 23. Teterina N.L., Gorbalenya A.E., Egger D., Bienz K., Rinaudo M.S., Ehrenfeld E.. Testing the modularity of the N-terminal amphipathic helix conserved in picornavirus 2C proteins and hepatitis c NS5A protein. Virology. 2006; 344:453–467. [DOI] [PMC free article] [PubMed] [Google Scholar]
- 24. Xia H., Wang P., Wang G.C., Yang J., Sun X., Wu W., Qiu Y., Shu T., Zhao X., Yin L.et al.. Human enterovirus nonstructural protein 2CATPase functions as both an RNA helicase and ATP-Independent RNA chaperone. PLoS Pathog. 2015; 11:e1005067. [DOI] [PMC free article] [PubMed] [Google Scholar]
- 25. Sweeney T.R., Cisnetto V., Bose D., Bailey M., Wilson J.R., Zhang X., Belsham G.J., Curry S.. Foot-and-mouth disease virus 2C is a hexameric AAA+ protein with a coordinated ATP hydrolysis mechanism. J. Biol. Chem. 2010; 285:24347–24359. [DOI] [PMC free article] [PubMed] [Google Scholar]
- 26. Adams P., Kandiah E., Effantin G., Steven A.C., Ehrenfeld E.. Poliovirus 2C protein forms homo-oligomeric structures required for ATPase activity. J. Biol. Chem. 2009; 284:22012–22021. [DOI] [PMC free article] [PubMed] [Google Scholar]
- 27. Papageorgiou N., Coutard B., Lantez V., Gautron E., Chauvet O., Baronti C., Norder H., de Lamballerie X., Heresanu V., Ferté N.et al.. The 2C putative helicase of echovirus 30 adopts a hexameric ring-shaped structure. Acta. Crystallogr. D Biol. Crystallogr. 2010; 66:1116–1120. [DOI] [PubMed] [Google Scholar]
- 28. Arnold J.J., Bernal A., Uche U., Sterner D.E., Butt T.R., Cameron C.E., Mattern M.R.. Small ubiquitin-like modifying protein isopeptidase assay based on poliovirus RNA polymerase activity. Anal. Biochem. 2006; 350:214–221. [DOI] [PMC free article] [PubMed] [Google Scholar]
- 29. Woodman A., Lee K.M., Janissen R., Gong Y.N., Dekker N.H., Shih S.R., Cameron C.E.. Predicting intraserotypic recombination in enterovirus 71. J. Virol. 2019; 93:e02057-18. [DOI] [PMC free article] [PubMed] [Google Scholar]
- 30. Tu Z., Chapman N.M., Hufnagel G., Tracy S., Romero J.R., Barry W.H., Zhao L., Currey K., Shapiro B.. The cardiovirulent phenotype of coxsackievirus B3 is determined at a single site in the genomic 5′ nontranslated region. J. Virol. 1995; 69:4607–4618. [DOI] [PMC free article] [PubMed] [Google Scholar]
- 31. Pakala S.B., Tan Y., Hassan F., Mai A., Markowitz R.H., Shilts M.H., Rajagopala S.V., Selvarangan R., Das S.R.. Nearly complete genome sequences of 17 enterovirus D68 strains from kansas city, missouri, 2018. Microbiol. Resour. Announc. 2019; 8:e00388-19. [DOI] [PMC free article] [PubMed] [Google Scholar]
- 32. Kelley L.A., Mezulis S., Yates C.M., Wass M.N., Sternberg M.J.. The phyre2 web portal for protein modeling, prediction and analysis. Nat. Protoc. 2015; 10:845–858. [DOI] [PMC free article] [PubMed] [Google Scholar]
- 33. Studier F.W. Protein production by auto-induction in high density shaking cultures. Protein Expr. Purif. 2005; 41:207–234. [DOI] [PubMed] [Google Scholar]
- 34. Ward J.M., Wallace L.J., Cowan D., Shadbolt P., Levison P.R.. Phosphocellulose as a tool for rapid purification of DNA-modifying enzymes. Anal. Chim. Acta. 1991; 249:195–200. [Google Scholar]
- 35. Arnold J.J., Cameron C.E.. Poliovirus RNA-dependent RNA polymerase (3D(pol)). Assembly of stable, elongation-competent complexes by using a symmetrical primer-template substrate (sym/sub). J. Biol. Chem. 2000; 275:5329–5336. [DOI] [PubMed] [Google Scholar]
- 36. Gebhard L.G., Incicco J.J., Smal C., Gallo M., Gamarnik A.V., Kaufman S.B.. Monomeric nature of dengue virus NS3 helicase and thermodynamic analysis of the interaction with single-stranded RNA. Nucleic. Acids. Res. 2014; 42:11668–11686. [DOI] [PMC free article] [PubMed] [Google Scholar]
- 37. Manalastas-Cantos K., Konarev P.V., Hajizadeh N.R., Kikhney A.G., Petoukhov M.V., Molodenskiy D.S., Panjkovich A., Mertens H.D.T., Gruzinov A., Borges C.et al.. ATSAS 3.0: expanded functionality and new tools for small-angle scattering data analysis. J. Appl. Crystallogr. 2021; 54:343–355. [DOI] [PMC free article] [PubMed] [Google Scholar]
- 38. Grant T.D. Ab initio electron density determination directly from solution scattering data. Nat. Methods. 2018; 15:191–193. [DOI] [PubMed] [Google Scholar]
- 39. Enemark E.J., Joshua-Tor L.. Mechanism of DNA translocation in a replicative hexameric helicase. Nature. 2006; 442:270–275. [DOI] [PubMed] [Google Scholar]
- 40. Sanders C.M., Kovalevskiy O.V., Sizov D., Lebedev A.A., Isupov M.N., Antson A.A.. Papillomavirus E1 helicase assembly maintains an asymmetric state in the absence of DNA and nucleotide cofactors. Nucleic Acids Res. 2007; 35:6451–6457. [DOI] [PMC free article] [PubMed] [Google Scholar]
- 41. Li D., Zhao R., Lilyestrom W., Gai D., Zhang R., DeCaprio J.A., Fanning E., Jochimiak A., Szakonyi G., Chen X.S.. Structure of the replicative helicase of the oncoprotein SV40 large tumour antigen. Nature. 2003; 423:512–518. [DOI] [PubMed] [Google Scholar]
- 42. Gai D., Zhao R., Li D., Finkielstein C.V., Chen X.S.. Mechanisms of conformational change for a replicative hexameric helicase of SV40 large tumor antigen. Cell. 2004; 119:47–60. [DOI] [PubMed] [Google Scholar]
- 43. Guan H., Tian J., Zhang C., Qin B., Cui S.. Crystal structure of a soluble fragment of poliovirus 2CATPase. PLoS Pathog. 2018; 14:e1007304. [DOI] [PMC free article] [PubMed] [Google Scholar]
- 44. Lilyestrom W., Klein M.G., Zhang R., Joachimiak A., Chen X.S.. Crystal structure of SV40 large T-antigen bound to p53: interplay between a viral oncoprotein and a cellular tumor suppressor. Genes Dev. 2006; 20:2373–2382. [DOI] [PMC free article] [PubMed] [Google Scholar]
- 45. Emsley P., Cowtan K.. Coot: model-building tools for molecular graphics. Acta. Crystallogr. D Biol. Crystallogr. 2004; 60:2126–2132. [DOI] [PubMed] [Google Scholar]
- 46. Afonine P.V., Grosse-Kunstleve R.W., Echols N., Headd J.J., Moriarty N.W., Mustyakimov M., Terwilliger T.C., Urzhumtsev A., Zwart P.H., Adams P.D.. Towards automated crystallographic structure refinement with phenix.refine. Acta. Crystallogr. D Biol. Crystallogr. 2012; 68:352–367. [DOI] [PMC free article] [PubMed] [Google Scholar]
- 47. Meagher M., Epling L.B., Enemark E.J.. DNA translocation mechanism of the MCM complex and implications for replication initiation. Nat. Commun. 2019; 10:3117. [DOI] [PMC free article] [PubMed] [Google Scholar]
- 48. Sára T., Konrat R., Skern T.. Strategies for purifying variants of human rhinovirus 14 2C protein. Protein Expr. Purif. 2014; 95:28–37. [DOI] [PubMed] [Google Scholar]
- 49. Guan H., Tian J., Qin B., Wojdyla J.A., Wang B., Zhao Z., Wang M., Cui S.. Crystal structure of 2C helicase from enterovirus 71. Sci. Adv. 2017; 3:e1602573. [DOI] [PMC free article] [PubMed] [Google Scholar]
- 50. Chen P., Wojdyla J.A., Colasanti O., Li Z., Qin B., Wang M., Lohmann V., Cui S.. Biochemical and structural characterization of hepatitis a virus 2C reveals an unusual ribonuclease activity on single-stranded RNA. Nucleic Acids Res. 2022; 50:9470–9489. [DOI] [PMC free article] [PubMed] [Google Scholar]
- 51. Gorbalenya A.E., Koonin E.V.. Viral proteins containing the purine NTP-binding sequence pattern. Nucleic Acids Res. 1989; 17:8413–8440. [DOI] [PMC free article] [PubMed] [Google Scholar]
- 52. Gorbalenya A.E., Koonin E.V., Wolf Y.I.. A new superfamily of putative NTP-binding domains encoded by genomes of small DNA and RNA viruses. FEBS Lett. 1990; 262:145–148. [DOI] [PubMed] [Google Scholar]
- 53. Iyer L.M., Leipe D.D., Koonin E.V., Aravind L.. Evolutionary history and higher order classification of AAA+ ATPases. J. Struct. Biol. 2004; 146:11–31. [DOI] [PubMed] [Google Scholar]
- 54. Hanson P.I., Whiteheart S.W.. AAA+ proteins: have engine, will work. Nat. Rev. Mol. Cell Biol. 2005; 6:519–529. [DOI] [PubMed] [Google Scholar]
- 55. Banerjee R., Echeverri A., Dasgupta A.. Poliovirus-encoded 2C polypeptide specifically binds to the 3′-terminal sequences of viral negative-strand RNA. J. Virol. 1997; 71:9570–9578. [DOI] [PMC free article] [PubMed] [Google Scholar]
- 56. Bienz K., Egger D., Troxler M., Pasamontes L.. Structural organization of poliovirus RNA replication is mediated by viral proteins of the P2 genomic region. J. Virol. 1990; 64:1156–1163. [DOI] [PMC free article] [PubMed] [Google Scholar]
- 57. Jiang P., Liu Y., Ma H.C., Paul A.V., Wimmer E.. Picornavirus morphogenesis. Microbiol. Mol. Biol. Rev. 2014; 78:418–437. [DOI] [PMC free article] [PubMed] [Google Scholar]
- 58. Corey D.R., Abrams J.M.. Morpholino antisense oligonucleotides: tools for investigating vertebrate development. Genome Biol. 2001; 2:Reviews1015. [DOI] [PMC free article] [PubMed] [Google Scholar]
- 59. Hartsel S.A., Kitchen D.E., Scaringe S.A., Marshall W.S.. RNA oligonucleotide synthesis via 5′-silyl-2′-orthoester chemistry. Methods Mol. Biol. 2005; 288:33–50. [DOI] [PubMed] [Google Scholar]
- 60. Rodríguez P.L., Carrasco L.. Poliovirus protein 2C has ATPase and GTPase activities. J. Biol. Chem. 1993; 268:8105–8110. [PubMed] [Google Scholar]
- 61. Seifert M., Bera S.C., van Nies P., Kirchdoerfer R.N., Shannon A., Le T.T., Meng X., Xia H., Wood J.M., Harris L.D.et al.. Inhibition of SARS-CoV-2 polymerase by nucleotide analogs from a single-molecule perspective. Elife. 2021; 10:e70968. [DOI] [PMC free article] [PubMed] [Google Scholar]
- 62. Carroll S.S., Tomassini J.E., Bosserman M., Getty K., Stahlhut M.W., Eldrup A.B., Bhat B., Hall D., Simcoe A.L., LaFemina R.et al.. Inhibition of hepatitis c virus RNA replication by 2′-modified nucleoside analogs. J. Biol. Chem. 2003; 278:11979–11984. [DOI] [PubMed] [Google Scholar]
- 63. Van Dycke J., Arnoldi F., Papa G., Vandepoele J., Burrone O.R., Mastrangelo E., Tarantino D., Heylen E., Neyts J., Rocha-Pereira J.. A single nucleoside viral polymerase inhibitor against norovirus, rotavirus, and sapovirus-induced diarrhea. J. Infect. Dis. 2018; 218:1753–1758. [DOI] [PubMed] [Google Scholar]
- 64. Javed A., Major B., Stead J.A., Sanders C.M., Orlova E.V.. Unwinding of a DNA replication fork by a hexameric viral helicase. Nat. Commun. 2021; 12:5535. [DOI] [PMC free article] [PubMed] [Google Scholar]
- 65. Wang Q., Arnold J.J., Uchida A., Raney K.D., Cameron C.E.. Phosphate release contributes to the rate-limiting step for unwinding by an RNA helicase. Nucleic Acids Res. 2010; 38:1312–1324. [DOI] [PMC free article] [PubMed] [Google Scholar]
- 66. Cameron C.E., Moustafa I.M., Arnold J.J.. Fidelity of nucleotide incorporation by the RNA-dependent RNA polymerase from poliovirus. Enzymes. 2016; 39:293–323. [DOI] [PMC free article] [PubMed] [Google Scholar]
- 67. Henn A., Bradley M.J., De La Cruz E.M.. ATP utilization and RNA conformational rearrangement by DEAD-box proteins. Annu. Rev. Biophys. 2012; 41:247–267. [DOI] [PMC free article] [PubMed] [Google Scholar]
- 68. Frick D.N., Lam A.M.. Understanding helicases as a means of virus control. Curr. Pharm. Des. 2006; 12:1315–1338. [DOI] [PMC free article] [PubMed] [Google Scholar]
- 69. Chang Y.P., Xu M., Machado A.C., Yu X.J., Rohs R., Chen X.S.. Mechanism of origin DNA recognition and assembly of an initiator-helicase complex by SV40 large tumor antigen. Cell Rep. 2013; 3:1117–1127. [DOI] [PMC free article] [PubMed] [Google Scholar]
- 70. Enemark E.J., Joshua-Tor L.. On helicases and other motor proteins. Curr. Opin. Struct. Biol. 2008; 18:243–257. [DOI] [PMC free article] [PubMed] [Google Scholar]
- 71. Byrd A.K., Raney K.D.. Superfamily 2 helicases. Front. Biosci. (Landmark Ed. 2012; 17:2070–2088. [DOI] [PMC free article] [PubMed] [Google Scholar]
- 72. Varkey J., Zhang J., Kim J., George G., He G., Belov G., Langen R., Wang X.. An amphipathic alpha-helix domain from poliovirus 2C protein tubulate lipid vesicles. Viruses. 2020; 12:1466. [DOI] [PMC free article] [PubMed] [Google Scholar]
- 73. Springer C.L., Huntoon H.P., Peersen O.B.. Polyprotein context regulates the activity of poliovirus 2CATPase bound to bilayer nanodiscs. J. Virol. 2013; 87:5994–6004. [DOI] [PMC free article] [PubMed] [Google Scholar]
- 74. Linder P., Jankowsky E.. From unwinding to clamping - the DEAD box RNA helicase family. Nat. Rev. Mol. Cell Biol. 2011; 12:505–516. [DOI] [PubMed] [Google Scholar]
- 75. Putnam A.A., Jankowsky E.. DEAD-box helicases as integrators of RNA, nucleotide and protein binding. Biochim. Biophys. Acta. 2013; 1829:884–893. [DOI] [PMC free article] [PubMed] [Google Scholar]
- 76. Wurm J.P., Glowacz K.A., Sprangers R.. Structural basis for the activation of the DEAD-box RNA helicase DbpA by the nascent ribosome. Proc. Natl. Acad. Sci. U.S.A. 2021; 118:e2105961118. [DOI] [PMC free article] [PubMed] [Google Scholar]
- 77. Hickman A.B., Dyda F.. Binding and unwinding: SF3 viral helicases. Curr. Opin. Struct. Biol. 2005; 15:77–85. [DOI] [PubMed] [Google Scholar]
- 78. Bergvall M., Melendy T., Archambault J.. The E1 proteins. Virology. 2013; 445:35–56. [DOI] [PMC free article] [PubMed] [Google Scholar]
- 79. Rogers G.W., Richter N.J., Lima W.F., Merrick W.C. Modulation of the helicase activity of eIF4A by eIF4B, eIF4H, and eIF4F. J. Biol. Chem. 2001; 276:30914–30922. [DOI] [PubMed] [Google Scholar]
- 80. Andersen C.B., Ballut L., Johansen J.S., Chamieh H., Nielsen K.H., Oliveira C.L., Pedersen J.S., Séraphin B., Le Hir H., Andersen G.R.. Structure of the exon junction core complex with a trapped DEAD-box ATPase bound to RNA. Science. 2006; 313:1968–1972. [DOI] [PubMed] [Google Scholar]
- 81. Le Hir H., Andersen G.R. Structural insights into the exon junction complex. Curr. Opin. Struct. Biol. 2008; 18:112–119. [DOI] [PubMed] [Google Scholar]
- 82. Peck M.L., Herschlag D. Effects of oligonucleotide length and atomic composition on stimulation of the ATPase activity of translation initiation factor elF4A. RNA. 1999; 5:1210–1221. [DOI] [PMC free article] [PubMed] [Google Scholar]
- 83. Karpe Y.A., Aher P.P., Lole K.S.. NTPase and 5′-RNA triphosphatase activities of chikungunya virus nsP2 protein. PLoS One. 2011; 6:e22336. [DOI] [PMC free article] [PubMed] [Google Scholar]
- 84. Cheng Y., Prusoff W.H.. Relationship between the inhibition constant (K1) and the concentration of inhibitor which causes 50 per cent inhibition (I50) of an enzymatic reaction. Biochem. Pharmacol. 1973; 22:3099–3108. [DOI] [PubMed] [Google Scholar]
Associated Data
This section collects any data citations, data availability statements, or supplementary materials included in this article.
Supplementary Materials
Data Availability Statement
All data are incorporated into the article and its online supplementary material. Constructs and full data sets presented in this study are available upon request to the corresponding author.