Abstract
The solid tumour microenvironment includes nerve fibres that arise from the peripheral nervous system1,2. Recent work indicates that newly formed adrenergic nerve fibres promote tumour growth, but the origin of these nerves and the mechanism of their inception are unknown1,3. Here, by comparing the transcriptomes of cancer-associated trigeminal sensory neurons with those of endogenous neurons in mouse models of oral cancer, we identified an adrenergic differentiation signature. We show that loss of TP53 leads to adrenergic transdifferentiation of tumour-associated sensory nerves through loss of the microRNA miR-34a. Tumour growth was inhibited by sensory denervation or pharmacological blockade of adrenergic receptors, but not by chemical sympathectomy of pre-existing adrenergic nerves. A retrospective analysis of samples from oral cancer revealed that p53 status was associated with nerve density, which was in turn associated with poor clinical outcomes. This crosstalk between cancer cells and neurons represents mechanism by which tumour-associated neurons are reprogrammed towards an adrenergic phenotype that can stimulate tumour progression, and is a potential target for anticancer therapy.
Early in cancer development, nerve fibres form and infiltrate tumour tissue, and the density of these nerves in solid tumours has been associated with poor clinical outcomes1,2. Neurogenic signals, including adrenergic stimulation by tumour-infiltrating neural fibres, are strongly associated with tumorigenesis, angiogenesis, invasion, and metastasis1,3. Hence, the little-understood molecular mechanisms of cancer–nerve crosstalk during cancer-associated neural infiltration represents opportunities for therapeutic intervention. The TP53 tumour suppressor gene is the most commonly mutated gene in head and neck cancer and shapes multiple aspects of tumour formation, including the microenvironment4,5. p53 expression fluctuates during nerve regeneration, permitting tight control of the plasticity of the differentiation phase6,7. We therefore explored the mechanisms of cancer–nerve interactions in head and neck squamous cell carcinoma on the basis of the hypothesis that the p53 protein suppresses cancer–nerve interactions in this disease and that the loss of this p53 function increases cancer–nerve crosstalk and thereby promotes tumour progression.
Loss of p53 alters neural milieu
To evaluate the impact of tumour innervation in head and neck cancer, we analysed survival data from The Cancer Genome Atlas. High neural density in oral cavity squamous cell carcinoma (OCSCC) was associated with poorer overall survival (P < 0.0001, log-rank test) and with the presence of TP53 mutations (P < 0.0001, Extended Data Fig. 1a–c). To study the interplay between nerves and epithelial cell p53 function throughout tumorigenesis, we evaluated neuritogenesis over the course of the progression from precursor lesions to high-grade lesions in Trp53flox/flox wild-type control and Krt5cre Trp53flox/flox (Trp53−/− in the recombined epithelial tissue) mouse models of oral cancer8 (Fig. 1a). Nerve density was significantly greater in tumours from mice lacking p53 expression in oral epithelia compared with control mice expressing p53 (Fig. 1b), in both early and advanced phases of cancer development. Similarly, in orthotopic xenografts of human OCSCC cells, we found increased nerve density p53-deficient (p53null) tumours compared with wild-type (p53WT) controls (Extended Data Fig. 1d–f). These findings suggest that the loss of p53 signalling in epithelial tumour cells is associated with neuritogenesis during early tumorigenesis.
Fig. 1 |. Loss of p53 alters the neural microenvironment throughout tumour evolution.
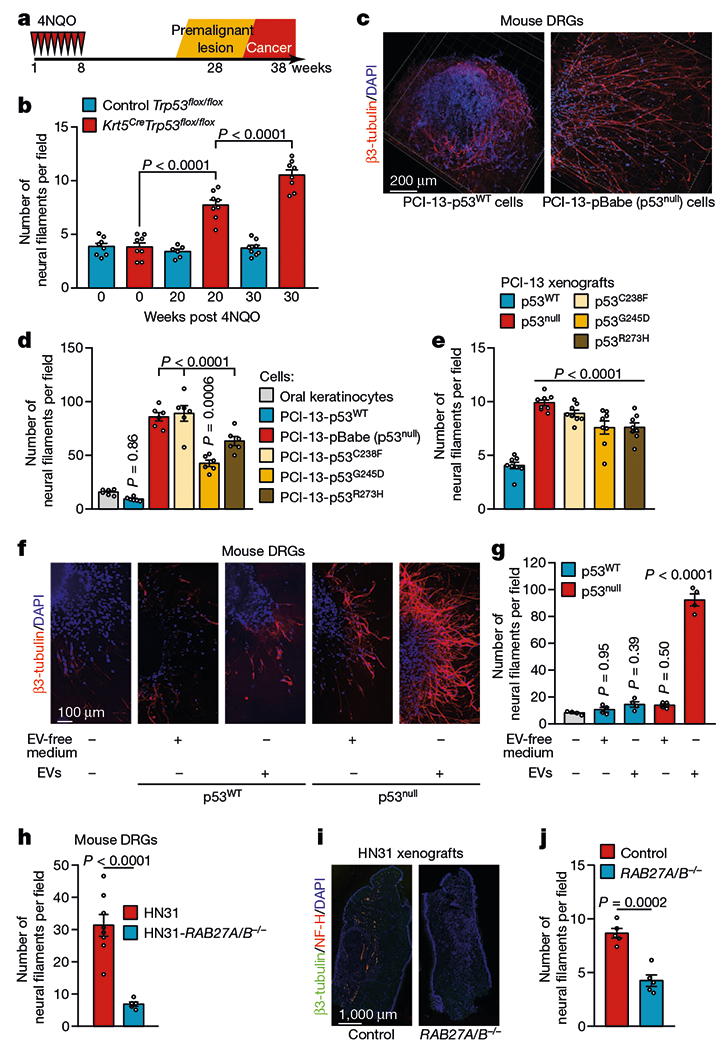
a, Tumour progression in Krt5.Cre;B6.129P2-Trp53tm1Brn/J (Krt5CreTrp53flox/flox) and B6.129P2-Trp53tm1Brn/J (Trp53flox/flox) control mice. b, Quantification of neural density in tongues from Trp53flox/flox and Krt5CreTrp53flox/flox mice immediately after the end of treatment with the carcinogen 4-nitroquinoline 1-oxide (4NQO) (normal mucosa), 20 weeks after treatment completion (low-grade lesions), and 30 weeks after treatment completion (high-grade lesions) (n = 8 except for control group at 20 weeks (n = 6)). c, Representative immunofluorescence staining of DRGs co-cultured with p53WT or p53null PCI-13 cells; data independently replicated in 12 ganglia. d, Quantification of neuritogenesis in DRGs co-cultured with p53-isogenic PCI-13 cells or normal oral keratinocytes (n = 6 biologically independent ganglia per cell line). e, Analysis of neural density in orthotopic p53-isogenic PCI-13 xenograft cells (n = 8 mice per group). f, Representative immunofluorescence of in vitro neuritogenesis in DRGs treated with soluble factors (EV-depleted conditioned medium) or EVs from p53-isogenic PCI-13 cells; data independently replicated in 20 ganglia. g, In vitro quantification of neuritogenesis (n = 4 biologically independent ganglia per condition). h, Quantification of neuritogenesis in freshly collected DRG cultured with conditioned medium from HN31 RAB27A/RAB27B-isogenic human OCSCC cells (n = 8 and n = 5 biologically independent ganglia for HN31 RAB27A−/−RAB27B−/− and HN31 RAB27A+/+RAB27B+/+ cells respectively). i, Representative immunofluorescence montage of glossectomy specimens derived from mice 3 weeks after injection of HN31 RAB27A/RAB27B-isogenic OCSCC cells; data independently replicated in 10 mice. j, In vivo analyses of neural density (n = 5 mice per group). Unpaired two-tailed t-test (h, j) and one-way ANOVA with Tukey multiple comparisons (b, d, e, g). Bar graphs represent mean ± s.e.m.
To better understand the mechanisms that link epithelium-derived signalling, altered p53 function, and neuritogenesis, we assessed induced neurite outgrowth from dorsal root ganglia (DRG) co-cultured with oral keratinocytes and p53-isogenic OCSCC cells. Neurite outgrowth was markedly enhanced in the presence of p53null cells compared with p53WT-expressing cells (Fig. 1c, d). The p53R273H mutation (which causes a functional p53 deficiency) was also associated with increased neuritogenesis, as was the p53C238F mutation (which leads to structural p53 deficiency); however, the partial effect of p53G245D on the DNA-binding region (which causes partial functional p53 deficiency) only modestly increased neuritogenesis9. The increased neuritogenesis seen in tumours with p53null or either DNA-contact or structural mutations in TP53, both in vitro and in vivo (Fig. 1e, Extended Data Fig. 1g–l), suggested that the effect of p53 mutations on neuritogenesis is likely to result from loss of p53 function.
Cancer-derived vesicles control neuritogenesis
To investigate the route by which neurotrophic cues are delivered to nerves, we incubated DRGs with cancer-derived soluble and extracellular vesicle (EV) compartments of conditioned medium from p53-isogenic OCSCC cell cultures (Extended Data Fig. 2a–g). DRGs cultured with EVs derived from p53null cells had more neurofilaments than those cultured with the corresponding EV-depleted conditioned medium or with EVs from p53WT cells (Fig. 1f, g).
To assess the potential effect of EVs on neuritogenesis, we used conditioned medium derived from HN31 cells (a human OCSCC cell line with endogenous p53C176F and p53A161S mutations that cause functional deficiency) and isogenic HN31 RAB27A−/−RAB27B−/− cells lacking the GTPases RAB27A and RAB27B, which are necessary for the exocytosis of EVs10 (Extended Data Fig. 2h, i). Knockout of RAB27A and RAB27B significantly reduced DRG neuritogenesis in vitro (Fig. 1h, Extended Data Fig. 2j, k) and in vivo in orthotopic xenografts of OCSCC cells (Fig. 1i, j). Thus, neurons appear to be a major stromal target of EVs derived from p53-deficient cancer cells.
Cancer-derived miRNAs drive axonogenic switch
Small RNAs are key regulators of neuronal development, regeneration, and function11,12, and EVs are the main route by which RNA species are transferred between cells (Extended Data Fig. 3a, b). By comparing the microRNA (miRNA) profiles of EVs derived from p53-sufficient and isogenic p53-deficient cell lines, we identified p53-related alterations in the expression of 17 miRNAs (Extended Data Fig. 3c–e). A customized single-channel Agilent array revealed a similar significant increase in the expression of miR-34a-5p and miR-141-5p, but not the other 15 miRNAs, in EVs derived from p53WT cells compared with those from p53null cells (GEO accession number GSE140324). Analysis of miR-34a and miR-141 in tongue tumour specimens from Trp53flox/flox control mice and Krt5creTrp53flox/flox mice confirmed a significant decrease in the levels of both miRNAs in Trp53−/− tumours (Extended Data Fig. 3f).
To investigate how miR-34a and miR-141 interact with other cancer-derived EV signals to mediate axonogenesis, we co-cultured trigeminal ganglion (TG) neurons transfected with antagomiR-34a or antago-miR-141 (Extended Data Fig. 3g) with EVs containing abundant miR-34a and miR-141 derived from p53WT OCSCC cells. Compared with non-specific antagomiR or no-EV controls, both antagomiRs increased the number of neurofilaments, although only antagomiR-34a had a significant effect (Fig. 2a, b). Conversely, transfection of TG neurons with ectopic miR-34a (compared with scramble miRNA or no-EV controls), followed by co-culture with miR-34a-deficient EVs derived from p53null OCSCC cells, significantly decreased the number of neurofilaments (Fig. 2a, b, Extended Data Fig. 3h). Co-culture of TG neurons with EVs derived from miR-34a-deficient p53WT OCSCC cells13 (Extended Data Fig. 3i–k) significantly increased the number of neurofilaments in vitro compared with no EVs or EVs derived from the same cells without knockdown (Fig. 2c). Knockdown of miR-34a in p53WT OCSCC cells also increased neuritogenesis in vivo, compared with the same cells without knockdown (Fig. 2d, e). Together, these data support the notion that EV shuttling of OCSCC-derived miR-34a to cancer-associated neurons negatively regulates, and confers resistance to, EV-derived axonogenic signals.
Fig. 2 |. p53-dependent alterations in miRNA populations control neuritogenesis.
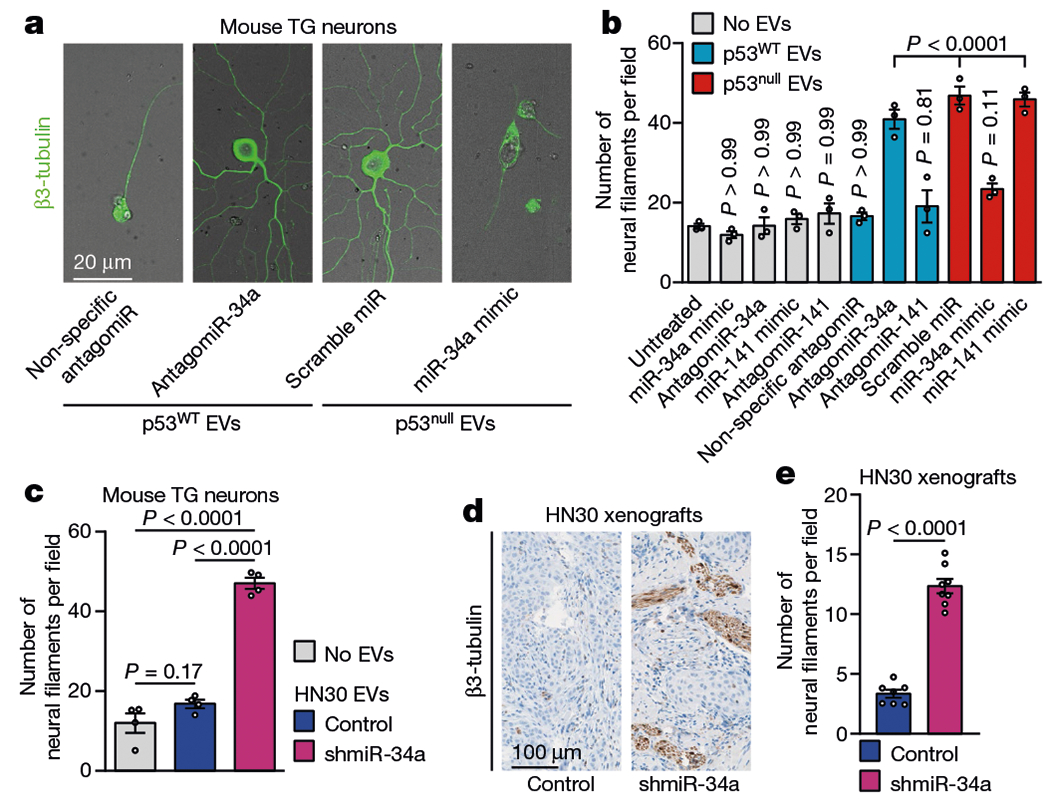
a, Representative fluorescence–bright-field overlay images of TG neurons after transfection with antagomiR-34a and incubation with EVs from p53WT PCI-13 cells EVs (left) and after transfection with miR-34a mimic and incubation with EVs from p53null PCI-13 cells (right); data independently replicated in 12 wells. b, Quantification of neuritogenesis 72 h after neuron–EV co-culture. EV-free medium (grey bars) or non-specific antagomiR/miR-mimic transfection were used as controls (n = 3 biologically independent samples per condition). c, Quantification of neuritogenesis in TG neurons 72 h after neuron-EV co-culture using EVs from p53WT OCSCC cells stably expressing a short hairpin targeting miR-34a (shmiR-34a) or non-specific control (n = 4 biologically independent samples per condition). d, Representative images showing β3-tubulin-positive neural fibres in orthotopic OCSCC xenografts stably expressing shmiR-34a (n = 8 mice) or non-specific control (n = 7 mice); data independently replicated in 15 mice. e, Quantification of neural density 3 weeks after orthotopic injection as in d. Bar graphs represent mean ± s.e.m. Unpaired two-tailed t-test (c, e) or one-way ANOVA with Tukey multiple comparisons (b).
To dissect the relative contributions to axonogenesis of stimulatory and inhibitory signals in cancer-derived EVs, we used antagomiRs to selectively inhibit 13 miRNAs detected by our EV miRNA sequencing that have previously been shown to induce neural growth or cancerous neural invasion14–17. Inhibition of miR-21, miR-197, or miR-324, but not of the other miRNAs, reduced neurite outgrowth in TG neurons co-cultured with EVs derived from miR-34a-deficient p53null OCSCCs Extended Data Fig. 4a). Transfection of TG neurons with miR-21, miR-197, or miR-324 alone only modestly increased neuritogenesis; however, co-transfection with both miR-21 and miR-324, with or without miR-197, increased neuritogenesis twofold (Extended Data Fig. 4b, c). Incubation of TG neurons with liposomes containing miR-21, miR-324, and scramble miRNA increased axonogenesis compared with liposomes containing miR-34a, miR-21 and miR-324 together (Extended Data Fig. 4d–f). These data are consistent with aberrant, but orchestrated, signalling by miRNAs in OCSCC-derived EVs that both negatively regulates and acts as a ligand that modulates the tumour neural microenvironment.
EVs drive sensory nerve reprogramming
To evaluate the effect of OCSCC-derived EVs on neuronal transcriptional programs, we performed RNA sequencing of human DRG neurons co-cultured with EVs from p53null or p53WT OCSCC cells18. Principal component analysis of RNA sequencing data showed that neurons cultured with EVs from p53WT OCSCC cells were segregated from those cultured with EVs from p53null OCSCC cells (Fig. 3a). Ingenuity pathway analysis revealed that the differentially expressed genes in the latter group of neurons were enriched for neuronal outgrowth and morphogenesis, synaptogenesis, differentiation and stemness, and synaptic transmission (Fig. 3b). To evaluate the effect of p53 on cancer-associated neuronal differentiation, we analysed nerve fibre densities in samples of tissue removed during glossectomy (TP53+/+, n = 12; TP53mut, n = 12) from patients with OCSCC treated at MD Anderson Cancer Center. Assessment of the sympathetic and parasympathetic branches of the autonomic nervous system showed that fibres positive for tyrosine hydroxylase (TH, adrenergic), but not those positive for vesicular acetylcholine transporter (parasympathetic), were significantly denser in TP53mut OCSCCs than in TP53WT tumours (Fig. 3c, d, Extended Data Fig. 5a–e). Similarly, in vivo, TH+ nerve fibres were significantly denser in tongue tumour specimens from Trp53−/− tumours excised from Krt5CreTrp53flox/flox mice than in those from Trp53flox/flox tumours (wild-type Trp53) excised from Trp53flox/flox control mice (Fig. 3e). Together these results suggest that the recruitment of proximal adrenergic neurons is related to signals that originate from p53-deficient tumours.
Fig. 3 |. p53-deficient tumours are enriched with adrenergic nerve fibres.
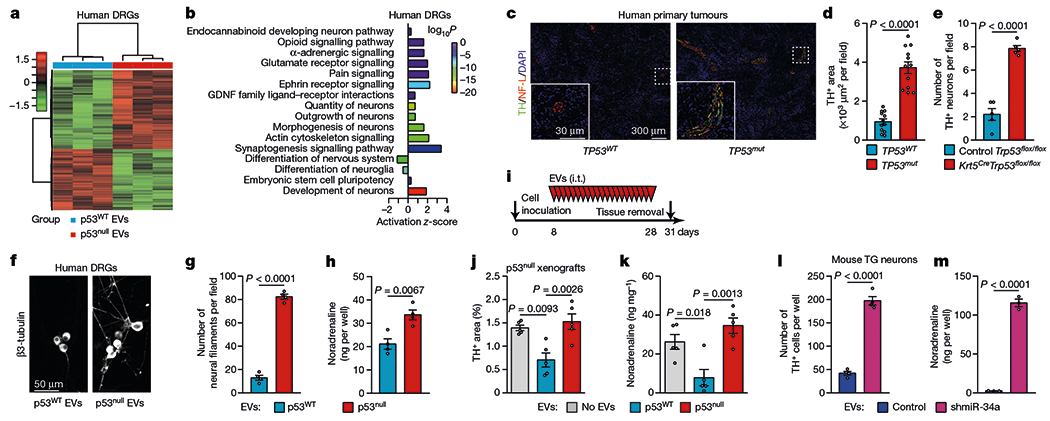
a, b, Heat map (a) and enriched Gene Ontology terms (b) for differentially expressed genes in freshly collected human DRG neurons incubated with EVs from p53WT or p53null PCI-13 cells, plotted by fold enrichment with the associated log P value (Fisher’s exact algorithm for functional gene set enrichment); n = 3 biologically independent samples per condition. c, Representative images showing TH+ adrenergic neural fibres in TP53WT or TP53mut human OCSCC tissue; data independently replicated in 24 patient specimens. d, Quantification of TH+ areas as in c (n = 12 independent samples per group). e, Quantification of TH+ neural fibres in tumours from Krt5CreTrp53flox/flox and control mice (n = 5). f, Representative images of neo-neurites (β3-tubulin+) in human DRG co-cultured with EVs from p53WT or p53null PCI-13 cells; data independently replicated in 8 wells. g, h, Quantification of neuritogenesis (g) and noradrenaline levels (h) in human DRGs as in f (n = 4 biologically independent samples per condition). i–k, PCI-13-p53null orthotopic tumours were injected daily with no EVs (vehicle) or with EVs from p53null or p53WT PCI-13 cells for 3 weeks (n = 5 mice per group, i), and TH+ neural areas (j) and noradrenaline levels (k) in the tongue were measured. l, m, TG neurons were co-cultured with EVs from p53WT OCSCC cells treated with lentiviral miR-34a or non-specific inhibitors. Quantification of TH+ TG neurons (n = 4 mice per condition, l), and noradrenaline levels (n = 3 biologically independent samples per condition, m). Bars represent mean ± s.e.m. Unpaired two-tailed t-test (d, e, g, h, l, m) or one-way ANOVA with Tukey multiple comparisons (j, k).
Next, we investigated whether shuttling of tumour-derived miRNAs in EVs regulates the differentiation of cancer-associated neurons. Neuritogenesis and noradrenaline release were increased in human DRG or mouse TG sensory neurons 72 h after incubation with EVs derived from p53null OCSCC cells, but not from p53WT OCSCC cells (Fig. 3f–h, Extended Data Fig. 5f–k). Next, we tested whether the adrenergic neurogenic response of cancer-associated neurons to epithelial loss of p53 could be rescued by EVs derived from p53WT OCSCC cells in vivo. Daily intratumoral injections of EVs from p53WT OCSCC cells markedly inhibited noradrenaline secretion and TH expression in orthotopic xenografts of p53null OCSCC cells, compared with tumours injected with p53null EVs and controls (Fig. 3i–k, Extended Data Fig. 5l). These results provide evidence that EVs derived from p53WT OCSCC cells suppress neo-adrenergic cancer-associated neurogenesis.
miR-34a restricts cell fate and impedes somatic cell reprogramming, whereas miR-34a deficiency expands cell developmental potential19–22. We tested the ability of miR-34a to suppress the tumour-associated phenotypic switch. Both TH expression and noradrenaline levels (Fig. 3l, m) were higher in TG neurons incubated with EVs purified from p53WT OCSCC cells in which miR-34a was knocked down than in control TG neurons incubated with EVs from p53WT OCSCC cells in which miR-34a was not knocked down. Furthermore, incubation of TG neurons with liposomes containing miR-21, miR-324, and scramble miRNA, but not with liposomes containing miR-21, miR-324, and miR-34a, resulted in robust noradrenaline synthesis (Extended Data Fig. 5m).
Next we investigated the transcriptomes of p53-deficient cancer-associated neurons. We identified 2,495 genes that were upregulated and 1,760 that were downregulated in neurons incubated with EVs from p53null OCSCC cells, compared with neurons incubated with EVs from p53WT OCSCC cells (Extended Data Fig. 5n; GEO accession number GSE140189). Upregulated genes were associated with neuronal survival, development, growth, and branching; downregulated genes were associated with neuronal function and synaptic transmission (Gene Ontology terms)23. Neurons incubated with EVs from p53null OCSCC cells had high expression of catecholamine biosynthesis-related genes (Extended Data Fig. 6a) and low expression of endogenous sensory neuron pain signalling genes including Ntrk2, Tac1 and Plcg1; potassium channel family genes; and glutamate metabotropic receptor genes (Prkc and Pka). These analyses suggest that the TG sensory neurons acquired transcriptional programs similar to those of sympathetic neurons.
To better understand the functional annotations of the involved miRNAs, we compared the transcriptional profiles of TG neurons transfected with miR-21, miR-34a, or miR-324 with that of TG neurons transfected with scramble miRNAs (Extended Data Fig. 6b). Neural identity determination domains (Gene Ontology terms) were significantly enriched in transcription factors crucial for neural cell fate and catecholaminergic differentiation, including En1, Lrp6, Ryk, Shh, Fzd3, Erbb2, and Wnt5a (induced by miR-21), and Nrp2, Gdnf, and Sema3f (induced by miR-324). Two determinants of sensory neuron differentiation, Ntrk1 and Isl1, were downregulated by miR-21 and miR-324, respectively. Expression of genes involved in fundamental inhibitory neuron differentiation pathways, including Eya1, Sox9, Homez, Cic, Kdm5a, and Eif4ebp3, was dysregulated by miR-34a. Neural growth domains were enriched in genes associated with neurogenesis, axonogenesis, and neuron projection development pathways. The axon guidance genes, most of which were deregulated by miR-21, included members of the neural cell adhesion family (Cdh2, Nrcam, Lamc1, and Nfasc), semaphorins (Plxna1, Plxna2, Sema3b, Sema3d, and Sema3e), ephrins (Efnb2, Epha3, Ephb4, and Epha4), Rho GTPases (Srgap2), and Napa, Slit3, and Slitrk6. The top pathways annotated in the neuron function domain were mostly related to synaptic functions, ion channels, and neurotransmission. Glutamatergic signalling genes (for example, Cnih2, Ntrk2, Oprm1, and Syt1) and nociception genes (Ptgs1, Tac1, and Npy1r) were also downregulated by miR-324, whereas key components of catecholaminergic neuron maintenance, including Nr4a2, En1, Lrp6, and Ryk, were upregulated by miR-21.
To investigate the origin of the TH+ neo-nerves that infiltrated OCSCC xenografts, we ablated adrenergic nerves by injecting mice with 6-hydroxydopamine (6-OHDA) before inoculating them with tumour cells (Fig. 4a). Quantification of TH+ fibres showed that there were similar increases in the numbers of cancer-associated TH+ fibres in both 6-OHDA-treated mice and controls (Fig. 4b, c). In 6-OHDA-treated mice, the levels of noradrenaline were significantly higher in p53null tumours than in p53WT tumours (P < 0.001 for each, pairwise comparisons, Fig. 4d). Flow cytometry analysis of TG neurons in 6-OHDA-treated mice showed a substantial increase in TH+ neurons after implantation of p53null tumour cells (Extended Data Fig. 7a). To investigate whether differentiation signals modify the neural signalling components in the tumour microenvironment, we surgically cut the lingual nerve, a branch of the trigeminal nerve, thereby ablating sensory innervation to the tongue, before orthotopic injection of tumour cells into BALB/c (nu/nu) mice. Surgical lingual denervation markedly decreased the cancer-associated TH+ area (P < 0.0001, Fig. 4e, f), the number of TH+ ipsilateral TG neurons (Extended Data Fig. 7b, c), and tumour development (Fig. 4g) relative to those in sham-operated mice. However, chemical sympathectomy before orthotopic xenograft implantation of OCSCC cells did not affect tumour growth (Fig. 4h). These results indicate that tumour-derived signals regulate the adrenergic differentiation of cancer-associated nerves and that these neo-adrenergic nerves, rather than infiltration of pre-existing adrenergic nerves, promote tumour growth.
Fig. 4 |. De novo transdifferentiated cancer-associated adrenergic nerves support tumour growth.
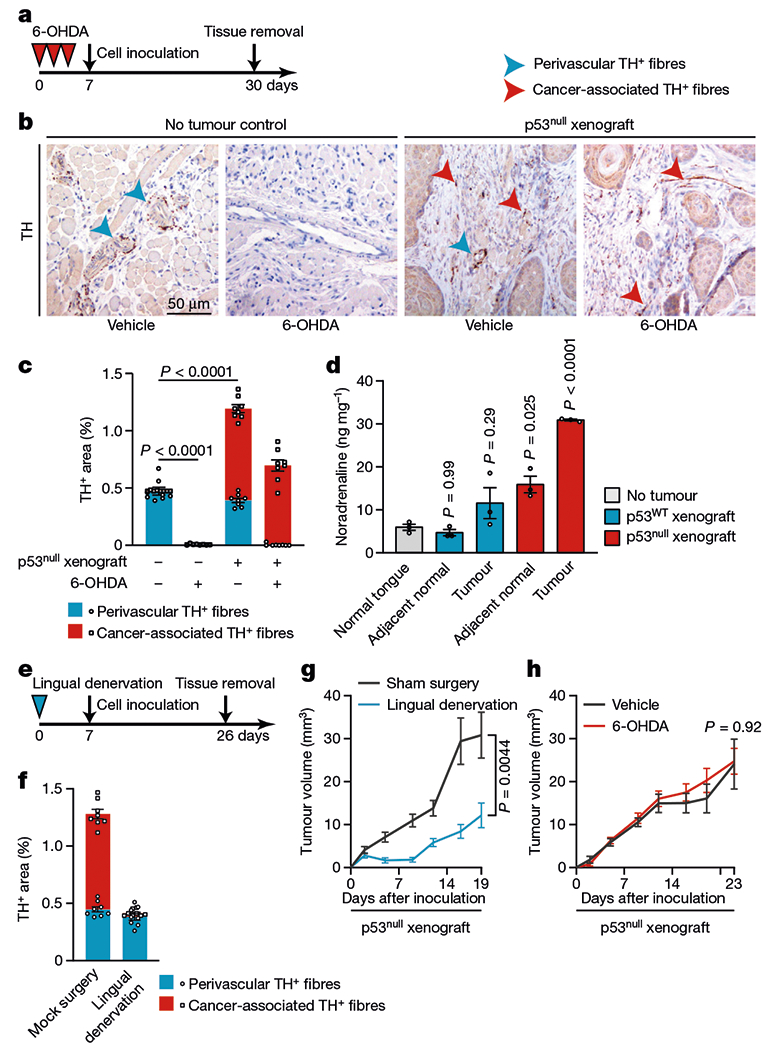
a, BALB/c (nu/nu) mice were chemically sympathectomized by intraperitoneal injection of 6-OHDA and then injected orthotopically with p53null PCI-13 cells. Tumour volume was monitored for 3 weeks. b, Illustrative immunohistochemical analysis for TH+ neural fibres in tongues from mice with or without tumours and with or without sympathectomy. Blue arrowheads, pre-existing TH+ perivascular neural fibres; red arrowheads, non-perivascular TH+ fibres that emerged after tumour formation (cancer-associated nerves); data independently replicated in 32 mice. c, Perivascular and cancer-associated TH+ area (n = 8 mice per condition). d, Noradrenaline levels in tumour-bearing tongue (ipsilateral to tumour injection site), adjacent normal tongue (contralateral to tumour injection site), and normal tongue controls (n = 3). e, BALB/c (nu/nu) mice were orthotopically xenografted with p53null PCI-13 cells to the denervated or sham-operated tongue. f, Quantification of TH+ nerve fibres in mice from e (n = 8 mice per condition). g, h, In vivo p53null PCI-13 tumour growth after lingual denervation (blue, n = 12) compared with sham surgery controls (n = 10, g), or chemical sympathectomy (red, n = 12) compared with vehicle controls (n = 11, h). Bar graphs and tumour growth curves represent mean ± s.e.m. Unpaired two-tailed t-test (g, h) or one-way ANOVA with Tukey multiple comparisons (c, d, f).
In nude mice orthotopically xenografted with p53null OCSCC cells, the number of TH+ cell bodies was markedly increased compared with tumour-free mice or mice orthotopically xenografted with p53WT OCSCC cells (Extended Data Fig. 7d, e). Furthermore, inoculation of mice with p53WT OCSCC cells in which miR-34a was knocked down increased TH expression and noradrenaline secretion; these increases, along with tumour volume, were abrogated by lingual denervation (Extended Data Fig. 7f–i). We further explored the cancer-induced retrograde reprogramming of TG neurons in vivo. We identified 685 genes that were upregulated and 15 that were downregulated in TG neurons from mice orthotopically injected with p53null OCSCC cells, compared with mice injected with p53WT OCSCC cells (Extended Data Fig. 8a). Ingenuity pathway analysis indicated significant activation of embryonic stem cell pluripotency canonical pathways (Extended Data Fig. 8a). We also found statistically significant activation of adrenergic signalling pathways, axonogenesis, neurite branching, and ephrin axonal guidance signalling.
To elucidate the reprogramming of neuronal identity24,25, we profiled the expression of known neuronal lineage differentiation transcription factors (Fig. 5a, Extended Data Fig. 8b–e) in mouse TG after orthotopic inoculation of mice with p53-deficient or p53-sufficient OCSCC cell lines. POU5F1 and KLF4 not only have essential roles in differentiation but also are validated direct targets of miR-34a26, alongside strong candidate targets such as NEUROG2 and ASCL1, which are crucial for the determination of neuronal identity27,28. The transcriptional factors POU5F1 and KLF4, which are sufficient to reprogram mouse adult neural stem cells24,29,30, showed increased expression in mouse TG neurons after inoculation with p53null OCSCC cells (Fig. 5a). In line with the neoneuron adrenergic phenotype, the number of neurons expressing ASCL1, which is essential for proper development of the sympathetic nervous system24,31–33, was elevated in mouse TG after inoculation with p53null but not p53WT OCSCC cells (Fig. 5a).
Fig. 5 |. Retrograde signalling by p53-deficient but not p53-sufficient cancer cells activates neural reprogramming.
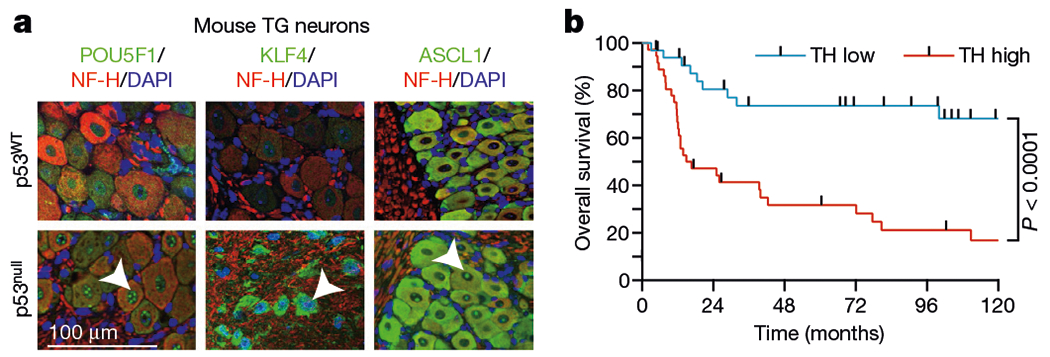
a, Representative images demonstrating expression of POU5F1, KLF4, and ASCL1 in ipsilateral TGs after orthotopic injection of p53WT (upper) or p53null (lower) PCI-13 cells; data independently replicated in six mice. b, Kaplan–Meier curves showing the overall survival of patients with high and low TH+ adrenergic nerve densities. Two-sided log-rank test.
Adrenergic innervation promotes OCSCC growth
To evaluate the effect of selective adrenergic receptor blockade on OCSCC progression, we orthotopically injected p53-deficient OCSCC cells into BALB/c (nu/nu) mice treated with carvedilol, a non-selective blocker of β1, β2, and α1 adrenergic receptors. Tumours from carvedilol-treated mice exhibited lower growth rates and proliferation (Ki-67+) indices than did tumours from vehicle-treated mice, with similar cardiovascular haemodynamics (Extended Data Fig. 8f–h, Supplementary Table 1). These data support the notion that adrenergic neuron-derived signals have an important role in OCSCC progression. In a validation set of patients treated at MD Anderson Cancer Center (n = 70, Supplementary Table 2), Kaplan–Meier analysis revealed that increased TH+ nerve density (Fig. 5b, Extended Data Fig. 8i) in OCSCCs was associated with lower recurrence-free survival rates (P = 0.00103, log-rank test) and lower overall survival rates (P < 0.0001, log-rank test). The statistical significance of the association with adrenergic nerve fibre densities was sustained in multivariable analysis after adjustment for clinical variables, including age, sex, pathologic stage, surgical margin status, perineural invasion presence, and treatment modalities (Supplementary Table 3). These results suggest that nerve density assessment merits exploration as an independent predictive marker of oral cancer aggressiveness.
Discussion
Neural regulation represents an emerging targetable pathway for the treatment of cancer1,34–36. The peripheral adrenergic nervous system has previously been shown to regulate prostate cancer tumorigenesis1,3,34,35. Sympathetic nerves form a dominant part of the normal prostate microenvironment, while in the oral cavity, their presence is modest and limited to the perivascular space. Our present study reveals that the emergence of adrenergic neonerves in the tumour microenvironment accompanies the initial phase of OCSCC development. In contrast to previous findings using a prostate cancer mouse model, in our OCSCC mouse model, ablation of the sympathetic nervous system before tumour inoculation neither abrogated the development of adrenergic neo-nerves nor inhibited tumour growth1.
Neither the origin of adrenergic neo-nerves nor the cellular and molecular events that control their development throughout tumorigenesis have previously been characterized. A recent study did show that doublecortin-expressing neural progenitors from the central nervous system infiltrate prostate tumours and metastases33. Here, we have identified crosstalk between the peripheral nervous system and head and neck tumours and described a phenotypic switch, induced by cancer cells, in which sensory nerves differentiate into adrenergic neo-neurons. Our findings show that in p53-deficient tumours, an miRNA-based mechanism mediates neuronal responses to environmental cues and determines the fate of cancer-associated neurons. We have shown that axonal sprouting and autonomic reprogramming of existing nerves occur as a result of miRNA shuttling from cancer cells to neurons. These miRNAs orchestrate gene expression via combined dominantly negative (for example, miR-34a) and positive (for example, miR-21 and miR-324) effects, activating transcriptional programs that establish neuronal identity. In our mouse model of OCSCC, surgical ablation of sensory nerves prevented the development of these adrenergic neo-nerves. Our results thus show that the peripheral sensory nerves may be reprogrammed during the development of cancer in a manner similar to that of neural progenitors that initiate adrenergic neurogenesis during tumour formation.
As tumours evolve, neo-neural networks develop in and around the tumour stroma, providing signals that coordinate cancer progression1,2. These results are consistent with recent preclinical data suggesting that sympathetic fibres accumulate in the normal vicinity of solid tumour tissues and infiltrate into the stroma. Furthermore, clinical data show that cancer patients treated with β-blockade have improved survival, supporting the role of adrenergic nerve activity in cancer progression35,37. Although further studies will be required to dissect the molecular events that link tumour-associated neuritogenesis to cancer progression, our data raise the tantalizing possibility that drugs that target both axonal growth and the adrenergic nervous system could be useful for the treatment of head and neck cancer.
Methods
Animals and in vivo procedures
B6.129P2-Trp53tm1Brn/J (Trp53flox/flox) and BALB/c nu/nu (B6.Cg-Foxn1nu+/− mice were obtained from The Jackson Laboratory. Krt5Cre mice were obtained from Dr. Carlos Caulin38. All animal studies were carried out according to protocols approved by The University of Texas MD Anderson Cancer Center Institutional Animal Care and Use Committee. Mouse housing, husbandry, and care practices met or exceeded the minimum requirements set forth in the Animal Welfare Act and the Guide for the Care and Use of Laboratory Animals (8th Edition). Disease development and progression were closely monitored, and mice with metastases were euthanized as soon as we noticed signs of discomfort in the mice or when the largest dimension of a tumour reached 5 mm, according to our approved protocol. In none of the experiments were these limits exceeded.
Orthotopic human tumours were implanted by injection of 5 × 10⁴ PCI-13 cells suspended in 30 μl serum-free medium (see Supplementary Methods) into the lateral tongue of 6- to 8-week-old BALB/c nu/nu mice and were monitored three times per week as previously described39. For the transgenic models, we crossbred Trp53flox/flox and Krt5cre mice to generate male and female Krt5creTrp53flox/flox mice; the recombined epithelial tissue of these mice lacks p53. We added 4NQO (100 μg/ml) to the drinking water (1% sucrose) of Krt5creTrp53flox/flox mice and Trp53flox/flox controls38,40,41. After 8 weeks of 4NQO treatment, mice were killed at 0, 20, and 30 weeks to study normal, precursor, and malignant lesion innervation, respectively. All animals underwent a full oral cavity examination three times per week and were killed for tissue retrieval 4 weeks after tumour cell injection.
For the assessment of in vivo neural recruitment, mice were anaesthetized and prepared: the right chorda-lingual nerve was exposed in the neck and transected between the anterior belly of the digastric and masseter muscles42. Although the proximal and distal stumps of the transected chorda-lingual nerve were separated, we resected a 5-mm section of each stump to minimize regeneration.
CRISPR–Cas9 knockout
For generation of RAB27A and RAB27B knockout cells, two synthetic single-guide RNAs (sgRNAs) in complex with Cas9, targeting the protein coding sequence of either RAB27A (guide sequence: GTC GTT AAG CTA CGA AAC CT, exon 5) or RAB27B (guide sequence: TGA ACG GCA AGC TCG GGA AC, exon 5), were transfected by electroporation. sgRNAs and Cas9 2NLS Nuclease were purchased from Synthego, and electroporation was performed using the Cell Line Nucleofector Kit V (Lonza). A total of 100,000 cells were diluted in 50 μl electroporation buffer containing 3.6 μM of each sgRNA and 0.8 μM Cas9 enzyme, and electroporated using the program P-020 (Amaxa Nucleofector II). Cells were transferred to full medium immediately after electroporation and left to recover for 1 week, and then single-cell colonies were generated by seeding of a single cell using flow cytometry (sorting for live cells by propidium iodide staining) at the South Campus Flow Cytometry and Cellular Imaging Core Facility at MD Anderson Cancer Center. Screening for knockout clones was done by Sanger sequencing of target regions and western blotting.
Isolation, quantification, and characterization of EVs
Conditioned media were collected, and EVs were isolated by differential centrifugation and analysed using NanoSight, as previously described43. In brief, conditioned media were centrifuged at 300g for 10 min to eliminate cells and at 2,000g and 10,000g to eliminate dead cells and cell debris, respectively. Then, EVs were pelleted by ultracentrifugation at 120,000g for 70 min and subsequently washed with PBS at a similar speed. The number and size of EVs were determined as previously described using NanoSight analysis43. In brief, EVs were analysed using a NanoSight LM10 Nanoparticle Characterization system. All nanoparticle tracking analyses were carried out with identical experiment settings. Particles were measured for 60 s, and for optimal results, microvesicle concentrations were adjusted to obtain about 50 microvesicles per field of view. EV morphology was assessed by transmission electron microscopy as previously described44.
For transmission electron microscopy, samples were placed on 100 mesh carbon-coated, formvar-coated copper grids treated with poly-l-lysine for approximately 1 h. Samples were then negatively stained with Millipore-filtered aqueous 1% uranyl acetate for 1 min. Stains were blotted dry from the grids with filter paper, and samples were allowed to dry. Samples were then examined in a JEM 1010 transmission electron microscope (JEOL, USA, Inc.) at an accelerating voltage of 80 Kv. Digital images were obtained using the AMT Imaging System (Advanced Microscopy Techniques Corp.).
EVs were lysed in a 2% sodium dodecyl sulphate buffer, and equal amounts of protein were loaded onto a sodium dodecyl sulphate–polyacrylamide gel and transferred onto polyvinylidine difluoride membranes (Bio-Rad Laboratories). Antibodies against CD63 were used as primary antibodies. As secondary antibodies, horseradish peroxidase-linked antibodies against rabbit immunoglobulin G (GE Healthcare) were used at a dilution of 1:5,000. Bound antibodies were visualized by chemiluminescence.
Neuron mRNA sequencing and data analysis
Low-input RNA libraries compatible with Illumina were prepared using the Smart-Seq V4 Ultra Low Input RNA (Clontech) and KAPA HyperPlus Library Preparation kits. In brief, full-length, double-stranded cDNA was generated from 10 ng total RNA using Clontech’s SMART (Switching Mechanism at 5′ End of RNA Template) technology. The full-length double-stranded cDNA was amplified by eight cycles of long-distance PCR, then purified using AMPure Beads (Agencourt). Following bead elution, the cDNA was evaluated for size distribution and quantity using the 4200 TapeStation High Sensitivity DNA Kit (Agilent Technologies) and the Qubit dsDNA HS Assay Kit (Thermo Fisher Scientific), respectively. The cDNA was enzymatically fragmented, and 5 ng of the fragmented cDNA was used to generate Illumina-compatible libraries using the KAPA HyperPlus Library Preparation kit. The KAPA libraries were purified and enriched with eight cycles of PCR to create the final cDNA library. The libraries were quantified using the Qubit dsDNA HS Assay (Thermo Fisher Scientific), then multiplexed with 12–16 libraries per pool. The pooled libraries were quantified by quantitative PCR using the KAPA Library Quantification Kit (KAPA Biosystems) and assessed for size distribution using the 4200 TapeStation (Agilent Technologies). The libraries were then sequenced, one pool per lane, on the Illumina HiSeq4000 sequencer using the 76-bp paired-end format.
Paired-end reads in FASTQ format were initially checked for read quality using FastQC45 and then aligned to the reference genome, UCSC mouse mm10 or GENCODE human GRCh38, using TopHat246. Alignment quality was evaluated from the output of TopHat2. The BAM file with mapped reads for each sample was sorted using SAMtools47, which serves as an input for HTSeq48 to estimate the number of reads that are mapped to each gene. The read counts for all samples were then normalized using the trimmed mean of M method implemented in the R Bioconductor package edgeR49. Weakly expressed genes were excluded if they did not have more than one read per million in at least two samples (adjusting for library size for each sample). Principal component analysis and hierarchical cluster analysis using Pearson distance and Ward’s minimum variance method were used to evaluate sample quality and similarity. The generalized linear model likelihood ratio test implemented in the edgeR package50 was applied to determine significant differentially expressed genes between groups. Benjamini–Hochberg correction was applied to the P values for multiple testing adjustment. Significant differentially expressed genes were selected using a false discovery rate cutoff of 5% with or without an absolute fold-change of ≥2 for heatmap generation. The Pearson distance and Ward’s minimum variance method were used to generate the cluster dendrograms on the heatmaps.
EV miRNA sequencing and data analysis
miRNA libraries compatible with Illumina were prepared using the QIAseq miRNA Library Kit (QIAGEN), per the manufacturer’s protocol. In brief, 80 ng of total RNA was sequentially ligated to adapters. In the first ligation step, an adenylated 3′ DNA adaptor was ligated to the 3′ end of the miRNA. In the second step of the ligation, an RNA adaptor was ligated to the 5′ end of the mature miRNAs in the sample. A cDNA library was then synthesized from the mature miRNAs using a reverse transcription primer containing an integrated unique molecular barcode. During reverse transcription, the reverse transcription primer hybridized to the 3′ adaptor and converted the dual 3′/5′ ligated miRNAs to cDNAs, while adding a unique molecular barcode and a universal sample index to every miRNA molecule. Following bead cleanup, the libraries were enriched and unique sample indexes were added using 16 cycles of PCR. A post-PCR bead cleanup was performed, and then the libraries were assessed for size distribution using the Tapestation (Agilent Technologies), quantified using the Qubit assay (Thermo Fisher Scientific), and then multiplexed, 33 samples per pool. The pooled library was quantified by quantitative PCR using the KAPA Library Quantification Kit (KAPA Biosystems), then sequenced, one pool per run, on the Illumina NextSeq 500 Sequencer using the 75-nt SR High-Output flow cell.
Single-end reads in FASTQ format were initially checked for read quality using FastQC45. The QIAseq miRNA Library Kit specific 3′ adaptor sequence was trimmed from the 3′ ends of sequencing reads using cutadapt51. The trimmed reads were then aligned to the reference genome, human GRCh38, using BWA52. SAMtools flagstat was used to check the mapping quality47. The SAM files with mapped reads for each sample were sorted by coordinate and outputted in BAM format using the Picard tool of SortSam (http://broadinstitute.github.io/picard/). The miRNA GFF annotation file was downloaded from miRBase, which serves as an input for featureCounts53 to estimate the number of reads that are mapped to each mature miRNA. Weakly expressed miRNAs were filtered out if they did not have more than one read in at least two samples. The read counts for all samples were then normalized using the trimmed mean of M method implemented in the R Bioconductor package edgeR49. Principal component analysis and hierarchical cluster analysis using Pearson distance and Ward’s minimum variance method were used to evaluate sample quality and similarity. The generalized linear model likelihood ratio test implemented in the edgeR package50 was applied to determine significant differentially expressed miRNAs between groups. The Benjamini–Hochberg correction was applied to the P values for multiple testing adjustment. Significant differentially expressed miRNAs were selected using a false discovery rate cutoff of 5% for each comparison. The Pearson distance and Ward’s minimum variance method were used to generate the cluster dendrograms on the heatmaps.
Affymetrix gene expression microarray and analysis
Total RNA was collected to assess global gene changes after TG neurons were transfected with miR-21, miR-34a, miR-324, or scramble miRNA. The array was analysed using the Affymetrix Clariom S mouse assay. The CEL files generated were processed through Transcriptome Analysis Console version 4.0 (Thermo Fisher Scientific), which normalized (and applied the log2 function to) array signals using a robust multiarray averaging algorithm. Differential expression between neurons transfected with different miRNAs was defined as a fold-change in the absolute value that was equal to or greater to 1.1 and a P value obtained from the moderated t-statistic from the limma package that was less than 0.05. The gene-level differential expression analysis was performed using Transcriptome Analysis Console version 4.0. Pathway analysis and functional annotation for upregulated and downregulated genes in the three comparisons were performed using enrichR (https://amp.pharm.mssm.edu/Enrichr/). Dysregulated genes from the pathways of interest were displayed using R software (version 3.5.1).
Canonical pathway integrative analysis
Canonical pathway activation and downregulation were predicted in QIAGEN Ingenuity pathway analysis. Ingenuity pathway analysis was used to identify the cascade of upstream and downstream regulators of the core gene set. Ingenuity pathway analysis uses a priori knowledge of expected interactions between transcriptional regulators and their target genes stored in Ingenuity Knowledge Base, a scientific literature-based database https://www.g6g-software-directory.com/bio/cross-omics/dbs-kbs/20018U-Ingenuity-Knowledge-Base.php.
miRNA target analysis
Predicted targets were retrieved from TargetMiner54, TargetScan55, and miRDB56,57 databases through the searchable database miRBase58, while experimentally validated targets were retrieved from miRTarBase59.
Preparation of miRNA encapsulated liposomes
A lipid mixture of 1,2-dipalmitoyl-3-dimethylammonium-propane (Avanti Polar Lipids), cholesterol (Sigma-Aldrich), and DSPE-PEG 2000 (Avanti Polar Lipids) in a molar ratio of 42:48:10 was dissolved in 100% ethanol. The mixed lipids were added to 125 mmol/l sodium acetate buffer (pH 5.2) to yield a solution containing 35% ethanol. The resultant nanoparticles were extruded through a 0.08-μm membrane (Whatman) using a LIPEX Extruder (Northern Lipids) to form 120- to 140-nm nanoparticles. miRNA in 50 mmol/l sodium acetate (pH 5.2) and 35% ethanol was added to the nanoparticles at 538:1 lipid:miRNA ratios and incubated at 37°C for 30 min. Ethanol removal and buffer exchange of miRNA-containing nanoparticles were achieved by dialysis against PBS using a 13,000-kDa MWCO dialysis bag (Spectra/Por Dialysis Membrane) for 24 h at 4 °C, with the external medium exchanged after 1, 3, and 24 h. Finally, the formulation was filtered through a 0.2-μm sterile filter. Particle size and zeta potential were determined using a Zetasizer Nano ZS (Malvern). miRNA entrapment efficiency was determined by the Quant-iT RiboGreen RNA assay (Invitrogen). For labelling, 50 μl of 1 mg/ml 18:1 Liss Rhod PE 1,2-dioleoyl-sn-glycero-3-phosphoethanolamine-N-(lissamine rhodamine B sulfonyl) (ammonium salt) was added to the lipid mixture.
Statistical analysis
The unpaired, two-tailed t-test and one-way ANOVA with Tukey multiple comparisons were carried out to analyse in vitro data. For mouse studies, a two-way ANOVA was used to compare tumour volumes between control and treatment groups. For immunohistochemical analyses, a one-way ANOVA was used to compare control and treatment groups. Survival was analysed by the Kaplan–Meier method and compared using the log-rank test. All bar graphs were expressed as mean ± s.e.m. with individual values shown if n ≤ 12. P values of less than 0.05 were considered to indicate nominal statistical significance. On the basis of the variance of xenograft growth in control mice, we used at least three mice per genotype to give 80% power to detect an effect size of 20% with a significance level of 0.05. For all mouse experiments, the number of independent mice used is listed in the figure legend. No statistical methods were used to predetermine sample size. The experiments were not randomized and investigators were not blinded to allocation during experiments and outcome assessment.
Reporting summary
Further information on research design is available in the Nature Research Reporting Summary linked to this paper.
Extended Data
Extended Data Fig. 1 |. High nerve density was associated with the presence of p53 mutation.
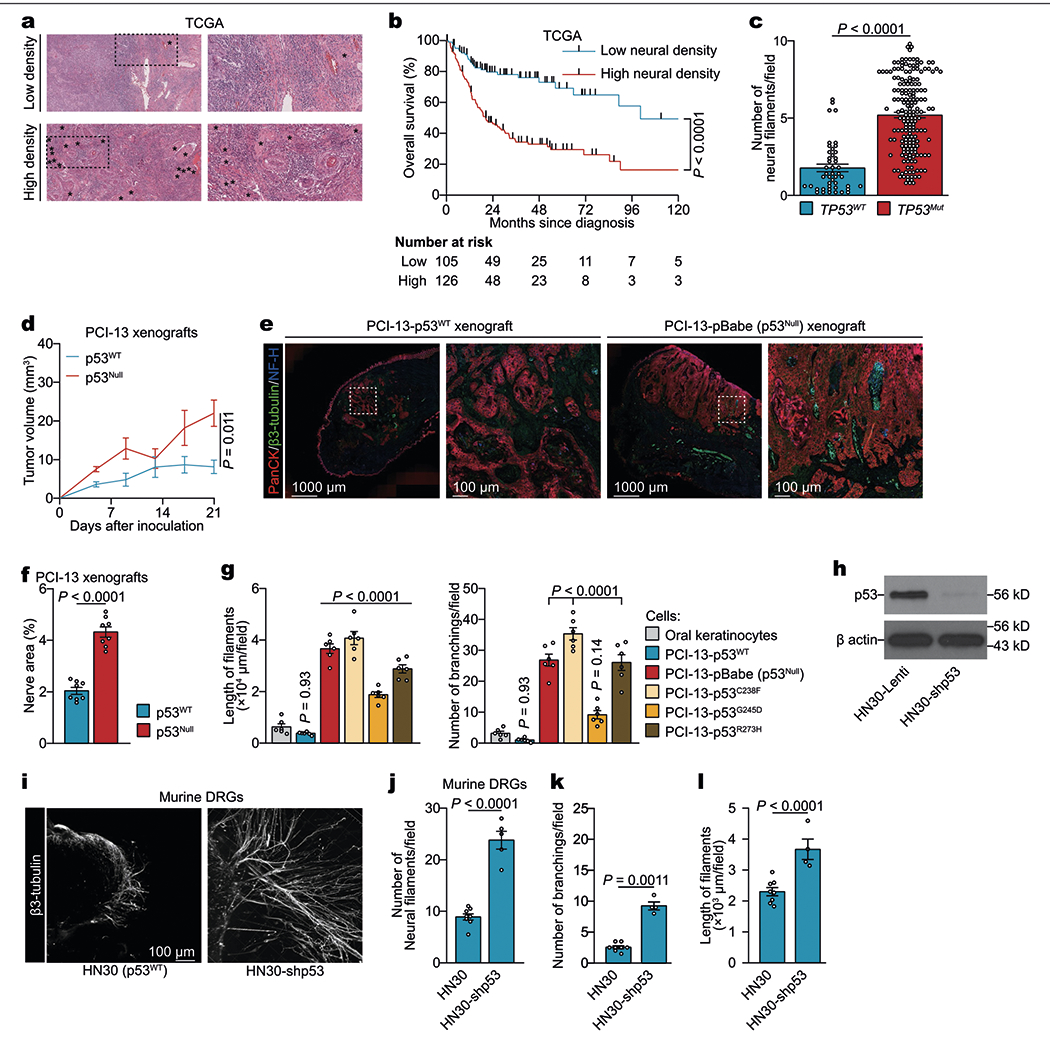
a, Representative haematoxylin and eosin image of OCSCC samples from TCGA demonstrating low (top) and high (bottom) nerve densities; data independently replicated in 231 samples. Asterisks represent neural structures. b, Overall survival of patients with OCSCC with high (≥4 neurofilaments per field) and low nerve densities. Two-sided log-rank test. c, Quantification of nerve density in TCGA OCSCC patient cohort (n = 231). Bar graphs represent mean ± s.e.m. Unpaired two-tailed t-test. d, Serial in vivo analyses of PCI-13 cell engraftment and growth in BALB/c (nu/nu) mice (n = 6 per group). Tumour growth curves represent mean tumour volume ± s.e.m. Unpaired two-tailed t-test. e, Representative immunofluorescence of glossectomy specimens taken 4 weeks after orthotopic injection of isogenic p53WT or p53null PCI-13 cells; data independently replicated in 16 mice. f, Quantification of nerve area in p53WT and p53null OCSCC xenografts (n = 8 mice per group). g, Quantification of neuritogenesis in DRG co-cultured with p53-isogenic PCI-13 cells or normal oral keratinocytes (n = 6 biologically independent ganglia per cell line). h, Immunoblots demonstrating the knockdown of TP53 in human HN30 OCSCC cells; data replicated in two independent experiments. i, Representative immunofluorescence staining of neo-neurites (β3-tubulin+) in DRG co-cultured with HN30 (left) and HN30-shp53 (right) OCSCC cells. Data independently replicated in 13 samples. j–l, In vitro quantification of number (j), branching (k), and length (l) of neurofilaments protruding from ex vivo DRG co-cultured with HN30 (n = 8 ganglia) or HN30-shp53 (n = 5 ganglia) OCSCC cells. Bar graphs represent mean ± s.e.m. One-way ANOVA with Tukey multiple comparison.
Extended Data Fig. 2 |. OCSCC-derived EVs and neuritogenesis.
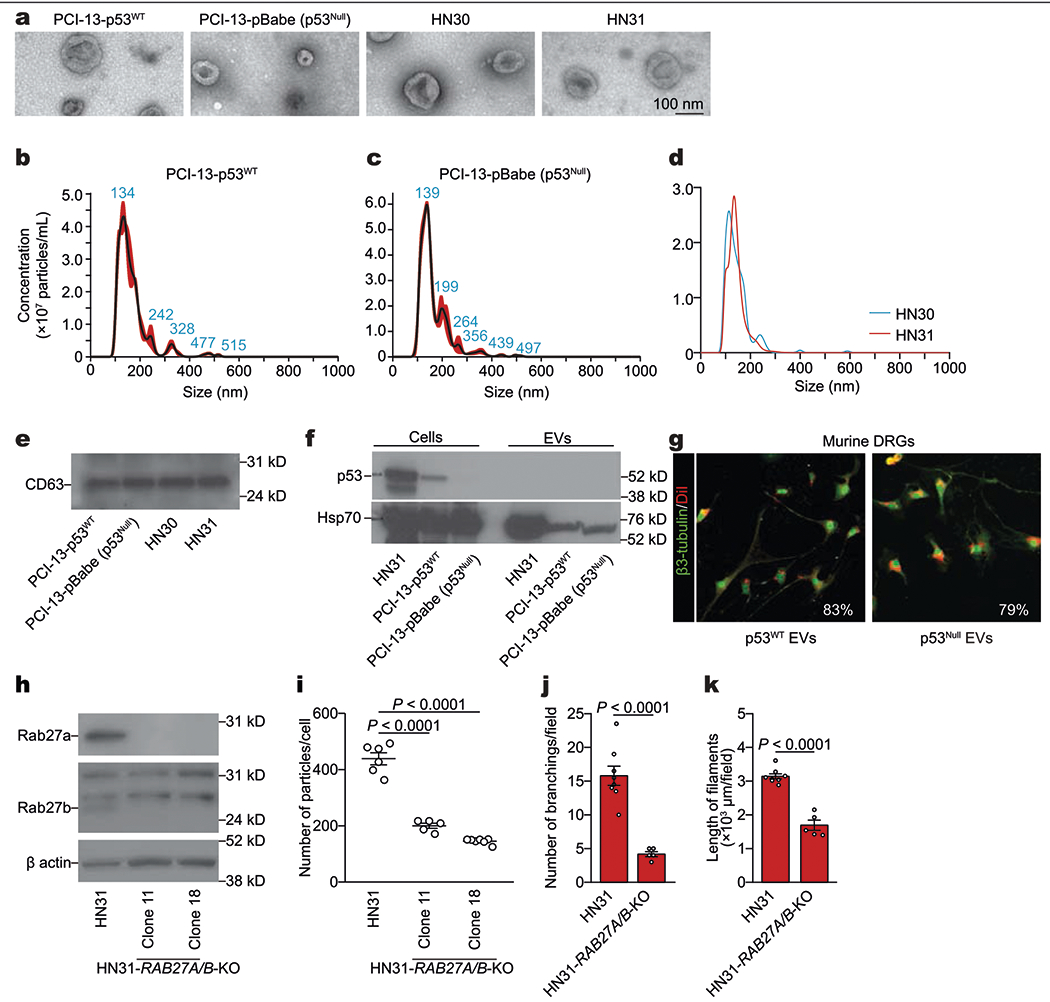
a, Representative transmission electron microscopy image of EVs from isogenic PCI-13, HN30, and HN31 OCSCC cells; data replicated in two independent experiments. b–d, Size distribution from nanoparticle tracking analysis of particles derived from p53WT (b) or p53null (c) PCI-13 cells or HN30 and HN31 (d) cells; data replicated in two independent experiments. e, Western blot of the EV marker CD63 in EVs from PCI-13 and HN30/HN31 cells; data replicated in two independent experiments. f, Western blot of the p53 and controls (HSP70) in p53WT or p53Null PCI-13 and HN31 cells and their corresponding cell-derived EVs; data replicated in three independent experiments. g, Confocal immunofluorescence images showing EVs (lipophilic DiI-labelled, red) in the cytoplasm of a neuron (labelled with β3-tubulin, green) 8 h after application of EVs derived from p53WT or p53null PCI-13 cells. Percentage represents the proportion of DiI+ β3-tubulin+ neurons out of all β3-tubulin+ neurons (n = 6 ganglia per condition). h, Immunoblots demonstrating the knockout (KO) of RAB27A and RAB27B in OCSCC cells edited with sgRNAs targeting RAB27A and RAB27B (HN31 clones 11 and 18, respectively) compared with HN31 controls; data replicated in two independent experiments. i, Nanoparticle tracking analysis of EV particle number in conditioned medium from HN31 clones 11 (n = 5 biologically independent samples) and 18 (n = 7 biologically independent samples) compared with HN31 controls (n = 6 biologically independent samples). Number of EVs was adjusted to cell number; bars represent mean ± s.e.m. Unpaired two-tailed t-test. j, k, In vitro quantification of branching (j) and neurofilament length (k) in freshly collected DRGs cultured with conditioned medium from HN31 RAB27A+/+RAB27B+/+ (n = 8) and HN31 RAB27A−/−RAB27B−/− (n = 5) isogenic human OCSCC cells. Bar graphs and tumour growth curves represent mean tumour volume ± s.e.m. Unpaired two-tailed t-test.
Extended Data Fig. 3 |. p53-dependent miRNA in OCSCC.
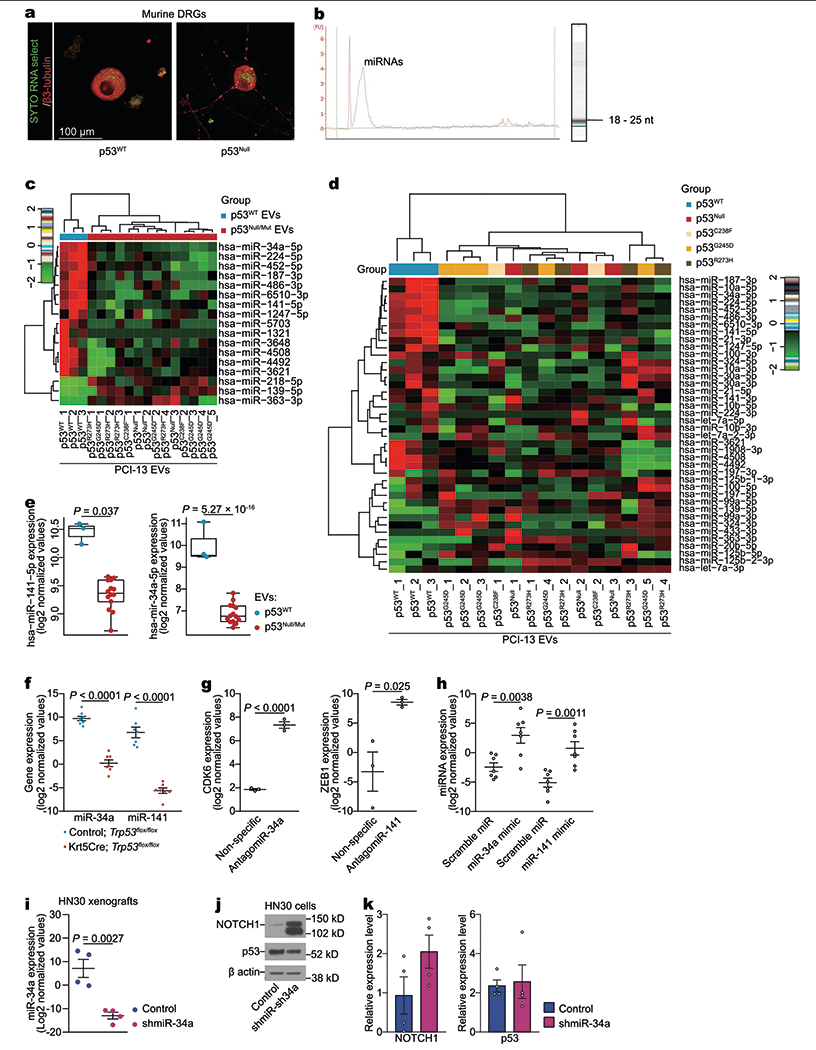
a, OCSCC RNA transfer to neurons via EVs. Representative confocal immunofluorescence image demonstrating PCI-13 cell-derived RNA labelled with SYTO RNASelect (green) in the perinuclear cytoplasm of a neuron (labelled with β3-tubulin, red). Images were captured 12 h after application of EVs derived from PCI-13 cells labelled with SYTO RNASelect; data replicated in two independent experiments. b, EVs derived from PCI-13 cells contained mainly small RNA species. Bioanalyzer results showing presence of RNA in EVs from PCI-13 cells. Representative band of EV RNA by Agilent RNA Pico Chips; data independently replicated in ten experiments. c, An unsupervised hierarchical clustering heat map showing differentially expressed EV miRNAs between p53-isogenic PCI-13 cells. p53WT, n = 3 biologically independent samples; p53null and p53mut, n = 14 biologically independent samples. d, Heat map of differentially expressed miRNA, arranged by unsupervised hierarchical clustering, presenting the miRNA sequencing for EVs derived from isogenic PCI-13 cells expressing p53WT versus no p53 (p53null) or mutant p53 (p53C238F, p53G245D, and p53R273H). The Pearson distance and Ward’s minimum variance method were used for pairwise clustering (c, d). Red and green indicate increased and decreased expression levels, respectively (n = 2 to 5 per group). e, Fold change in hsa-miR-141-5p and hsa-miR-34a-5p in EVs derived from p53WT PCI-13 cells (blue, n = 3 biologically independent samples) compared with p53null or p53mut cells (red, n = 14 biologically independent samples). Results are log2 normalized. f, Real-time PCR quantification of miR-34a and miR-141 in ventral tongues from Trp53flox/flox and Krt5CreTrp53flox/flox mice (n = 7 per group). g, Real-time PCR quantification of CDK6 (miR-34a target) and ZEB1 (miR-141 target) in neurons treated with antagomiR-34 or antagomiR-141 compared with nonspecific antagomiR-treated controls (n = 3 biologically independent samples per group). h, Quantitative validation of miR-34a and miR-141 overexpression after transfection with miR-34a and miR-141 mimics, respectively. TG neurons were transfected with miR-34a mimic, miR-141 mimic, or scramble miR, and overexpression of miR-34a and miR-141 was confirmed by real-time PCR (n = 7 biologically independent samples per group). i, Real-time PCR quantification of miR-34a in orthotopic tumour xenografts of HN30 OCSCC cells treated with shControl (blue) or shmiR-34a (purple). n = 4 biologically independent samples per group. j, k, Western blot of NOTCH1 (confirmed miR-34a target) in OCSCC transfected with lentiviral miR-34a inhibitor or scramble miRNA inhibitor (j). Bar graph quantification of the blots demonstrates no impact of miR-34a inhibition on p53 expression and is normalized to the total amount of β-actin (n = 4 biologically independent samples per group, j). Unpaired two-tailed t-test; bars and dot plots represent mean ± s.e.m. (e–i, k).
Extended Data Fig. 4 |. microRNAs modulate neuritogenesis.
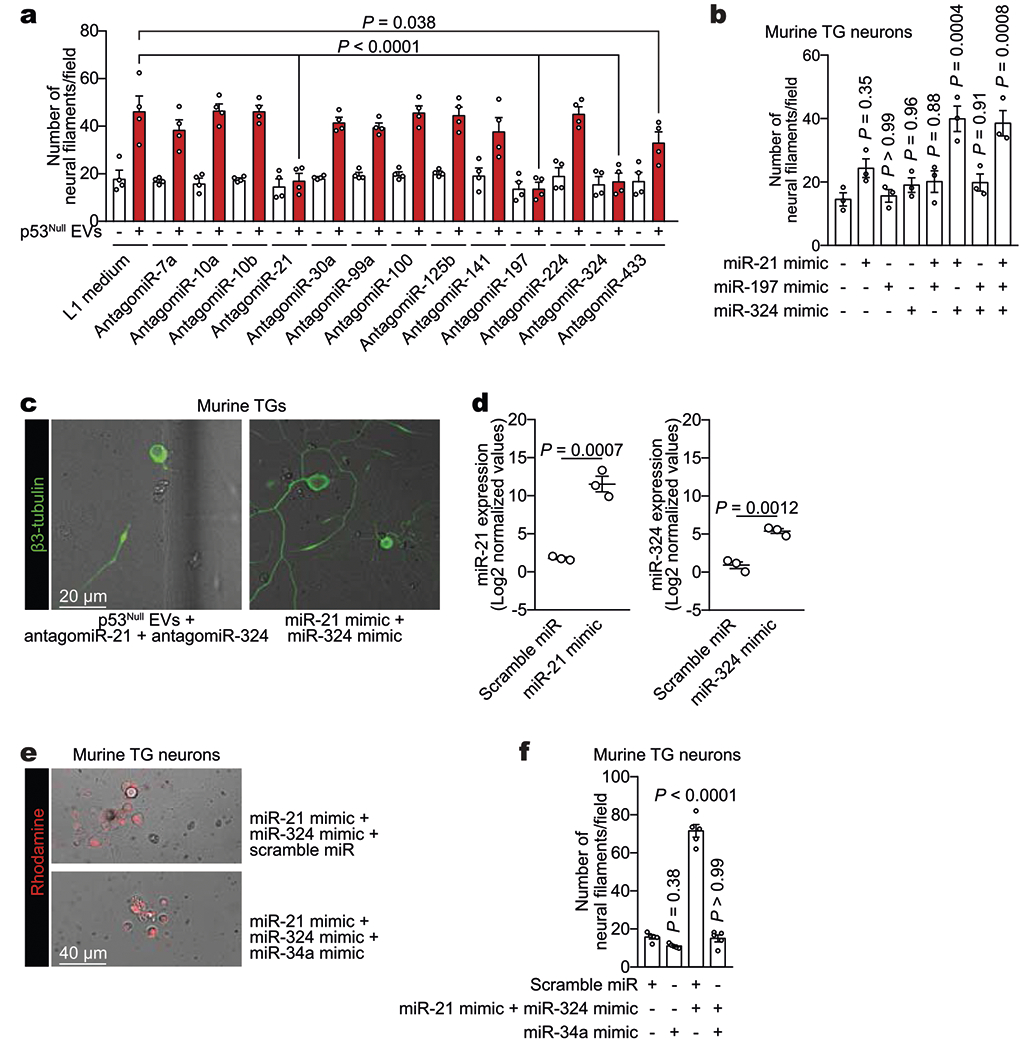
a, Screening of candidate neuritogenesis-associated miRNAs. Quantification of neuritogenesis 72 h after neuron–EV co-culture. Eight hours after transfection with 13 different antagomiRs, TG neurons were incubated with EVs derived from p53null PCI-13 cells (n = 4 biologically independent samples per condition). One-way ANOVA with Tukey multiple comparison. b, Quantification of neuritogenesis in TG neurons 72 h after transfection with miR-21 mimic, miR-197 mimic, or miR-324 mimic or co-transfection with their combinations (n = 3 biologically independent samples per condition). c, Representative fluorescent–bright-field overlay images demonstrating the lack of response of TG neurons exposed to EVs derived from p53null PCI-13 cells after co-transfection with antagomiR-21 and antagomiR-324 and the response of TG neurons after miR-21 and miR-324 mimic co-transfection. Data replicated across six independent samples. d, Quantitative validation of miR-21 and miR-324 overexpression in TG neurons incubated with liposomes containing miR-21, miR-324, and scramble miRNA (n = 3 biologically independent samples per group). e, Representative fluorescence–bright-field overlay images of TG neurons exposed to liposomes containing miR-21, miR-324, and scramble miRNA or liposomes containing miR-21, miR-324, and miR-34a; data independently replicated in 20 wells. f, Quantification of neuritogenesis in TG neurons 72 h after neuron–liposome co-culture (n = 5 biologically independent samples per condition). Unpaired two-tailed t-test; bars represent mean ± s.e.m. (a, b, d) or one-way ANOVA with Tukey multiple comparisons (f).
Extended Data Fig. 5 |. TP53 deficiency does not change parasympathetic nerve fibre densities in human OCSCC specimens.
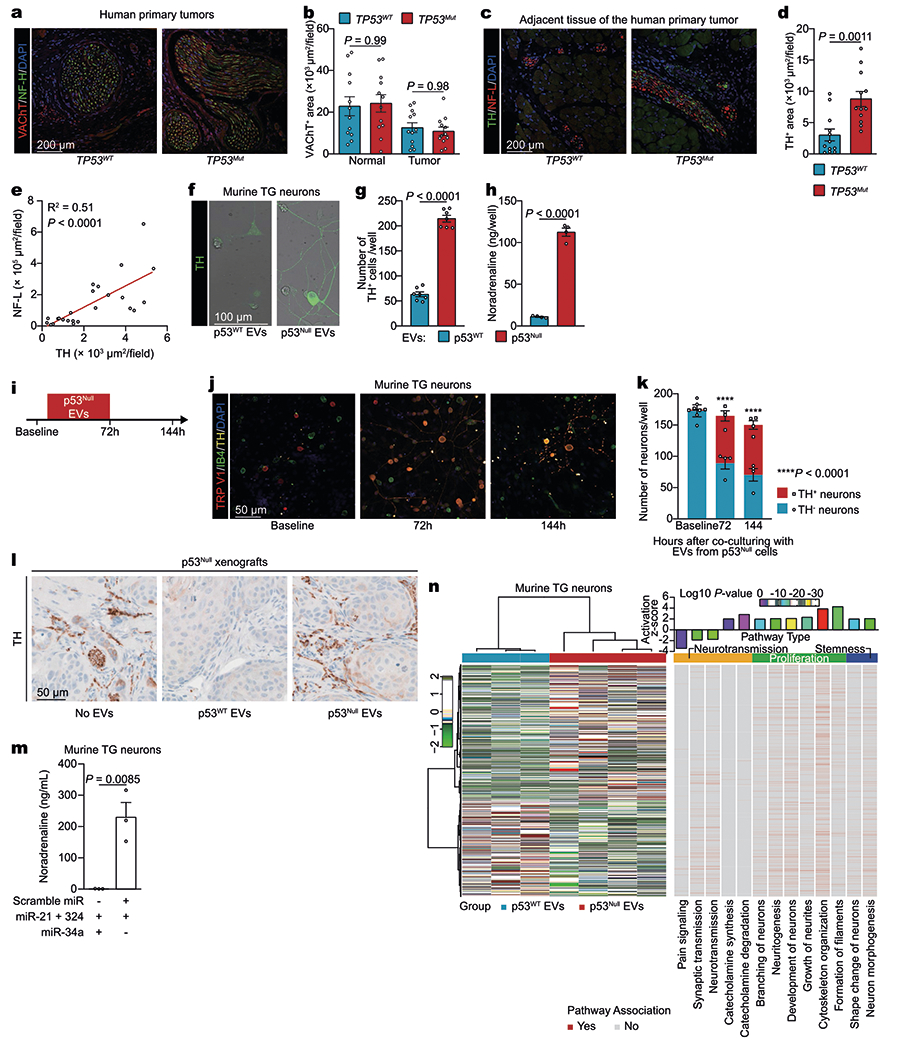
a, b, Representation of vesicular acetylcholine transporter (VAChT)+ nerve densities in both TP53WT and TP53mut OCSCC tissues; data independently replicated in 24 patient specimens (a). Quantification of cholinergic VAChT+ neural areas in TP53-sufficient (TP53WT, blue, n = 12) and TP53-deficient (TP53mut, red, n = 12) human OCSCC tissues. Each dot represents the mean for one patient (b). NF-H, neurofilament heavy. c, d, TP53 deficiency increases the sympathetic nerve fibre density in normal tongue tissue surrounding OCSCC in humans. Representative images showing TH+ adrenergic neural fibres in human normal tongue tissue surrounding OCSCC with TP53WT (left) or TP53mut (right) (TH, green; neurofilament light (NF-L), red; DAPI, blue). Data independently replicated in 24 patient specimens (c). Quantification of adrenergic TH+ areas in TP53-sufficient (TP53WT, blue, n = 12) and TP53-deficient (TP53mut, red, n = 12) human OCSCC samples. Each dot represents the mean for a patient (d). e, Correlation of TH and NF-L expression levels. Linear regression (r2, n = 24 biologically independent samples). f–h, Representative images of TG neurons labelled with anti-TH antibody after incubation with EVs derived from p53WT or p53null PCI-13 cells; data independently replicated in 14 wells (f). Quantification of TH+ neurons (n = 7 biologically independent samples per condition, g), and noradrenaline levels (n = 4 biologically independent samples per condition, h). i–k, Co-culture of TG neurons with p53null EVs for 72 h induced TH coexpression in TRPV1+ but not IB4+ neurons; TH expression remained stable 72 h after washout of the EVs. n = 4 biologically independent samples per condition (k). l, TH+ neural areas in PCI-13–p53null orthotopic tumours injected daily with no EVs or with EVs derived from p53null or p53WT PCI-13 cells for 3 weeks; data independently replicated in 15 mice. m, Co-culture of TG with liposomes containing miR-21 and miR-324 but not miR-34a increases catecholamine synthesis. Noradrenaline levels in neurons cultured with nano-liposomes containing miR-21 + miR-34a + miR-324 or miR-21 + miR-324 controls, quantified by enzyme-linked immunosorbent assay. n = 3 biologically independent samples per condition. n, Heat map of differentially expressed genes in mouse TG neurons co-cultured with p53-isogenic EVs. Enriched Gene Ontology terms of the neurons were plotted at fold enrichment with the associated log P value (Fisher’s exact algorithm for functional gene set enrichment); n = 3 biologically independent samples for p53WT and n = 4 biologically independent samples for p53null. Mean ± s.e.m.; unpaired two-tailed t-test (b, d, g, h, k, m).
Extended Data Fig. 6 |. Target analysis for miR-21, miR-34a, and miR-324.
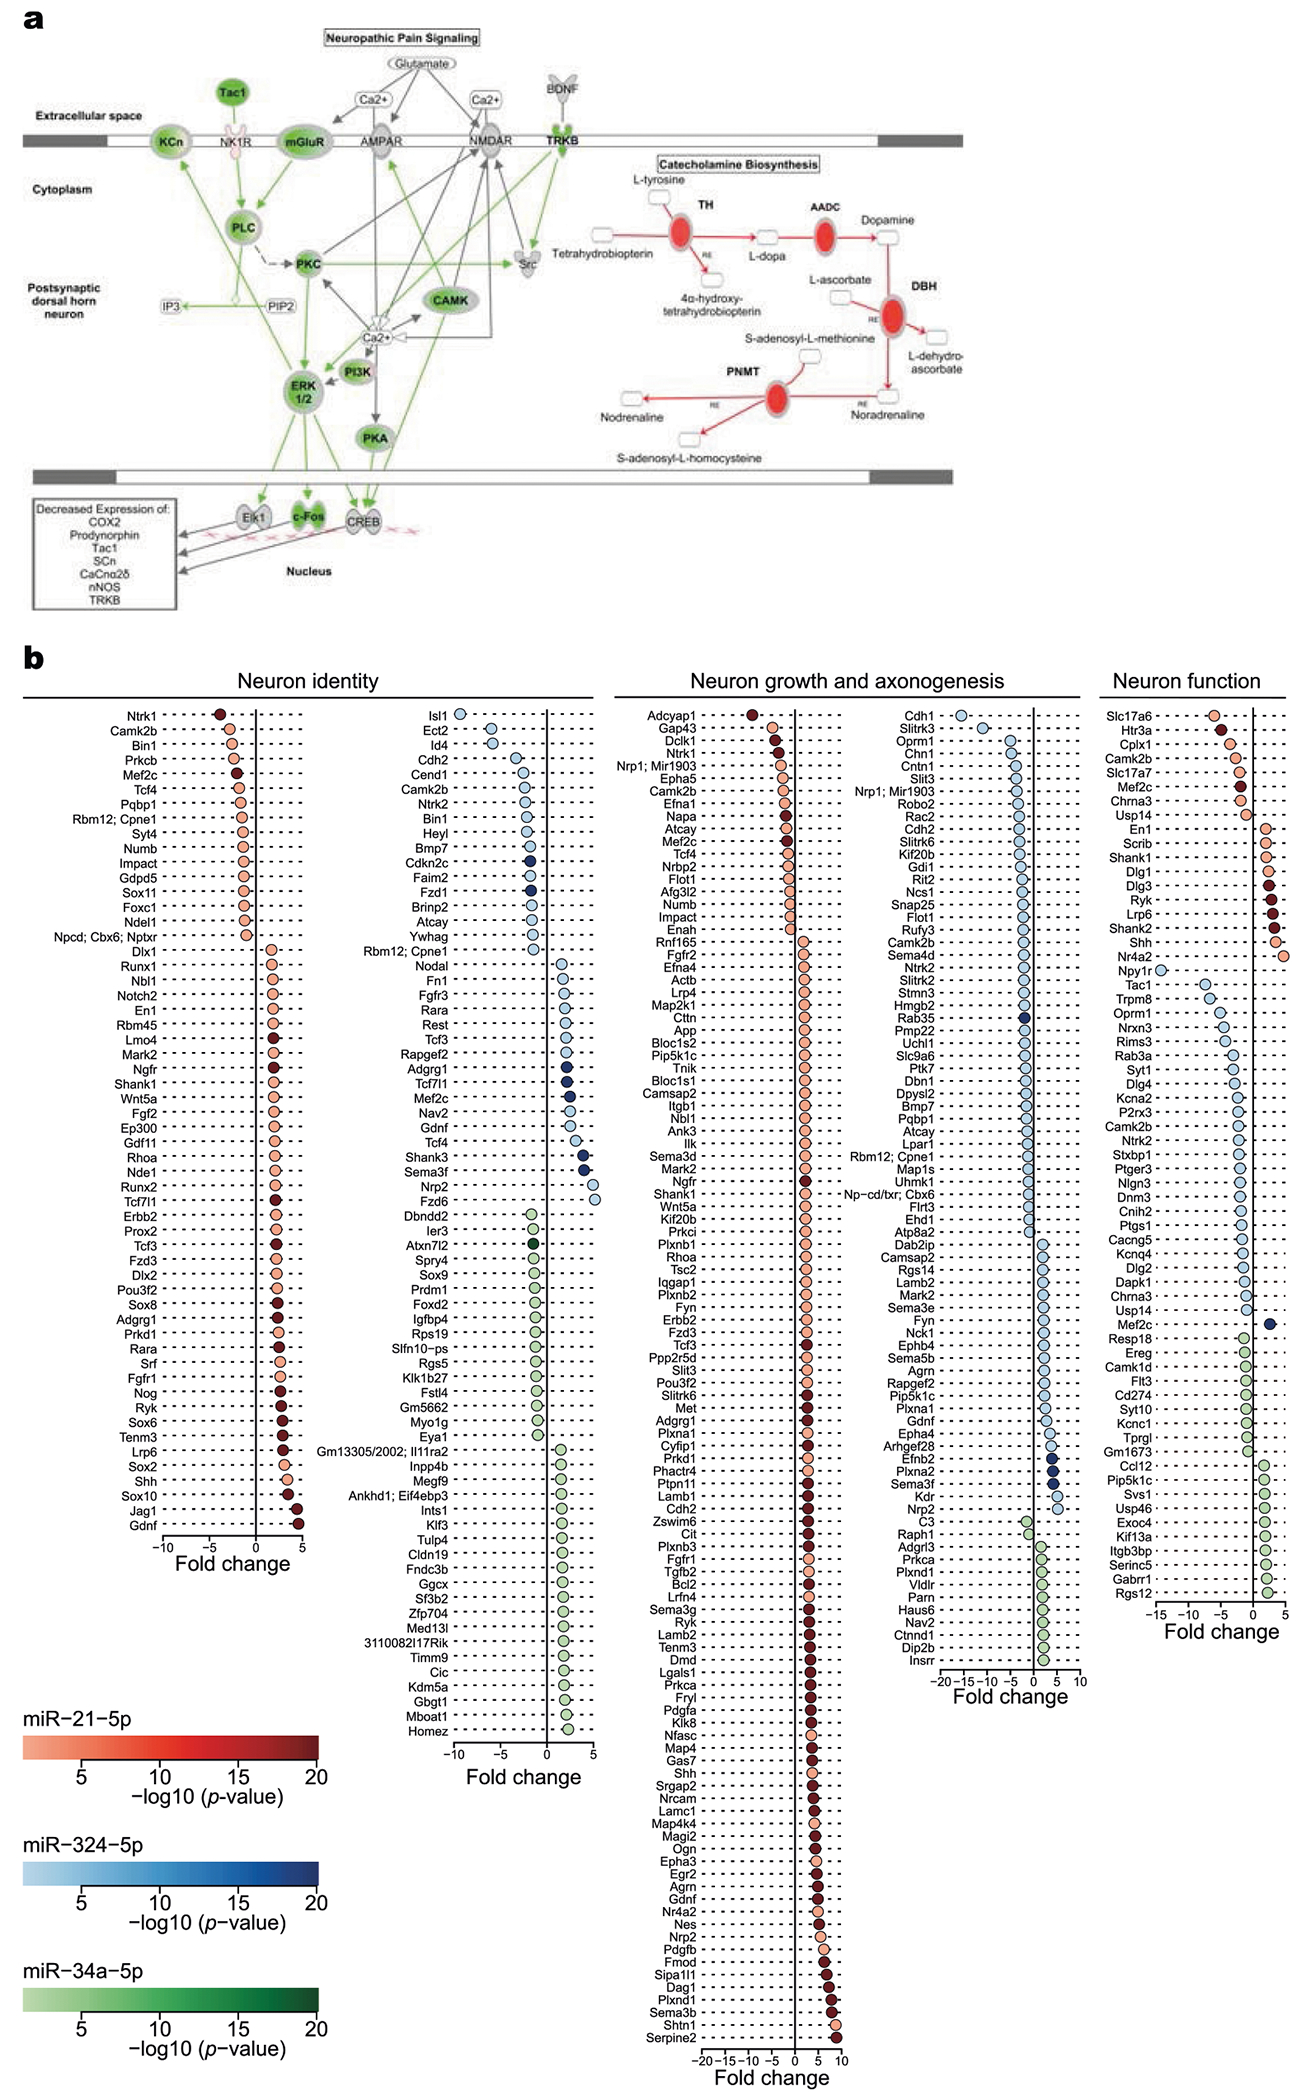
a, Schematic of ingenuity pathway analysis of pain signalling (silenced, green) and noradrenaline biosynthesis (activated, red). AADC, aromatic l-amino acid decarboxylase; DBH, dopamine β-hydroxylase; PNMT, phenylethanolamine N-methyltransferase. b, Total RNA was collected to assess global gene changes after TG neurons were transfected with miR-21 (red), miR-324 (blue), miR-34a (green), or scrambled miRNA. Data show fold change in expression of potential targets involved in neural identity determination (left), neural growth (middle), and neural function (right) between neurons transfected with different miRNAs (n = 3 biologically independent samples per condition). P values obtained from the moderated t-statistic for the presented genes were <0.05. Forest plots displaying fold change and P values for genes on different neuron pathways that are significantly differentiated between TG neurons transfected with miR-21, miR-34a or miR-324 and scramble miRNA. Linear models and empirical Bayes methods were used for obtaining the statistics and assessing differential gene expression between two conditions.
Extended Data Fig. 7 |. Loss of p53 in OCSCC induces adrenergic switch proximally in TG neurons.
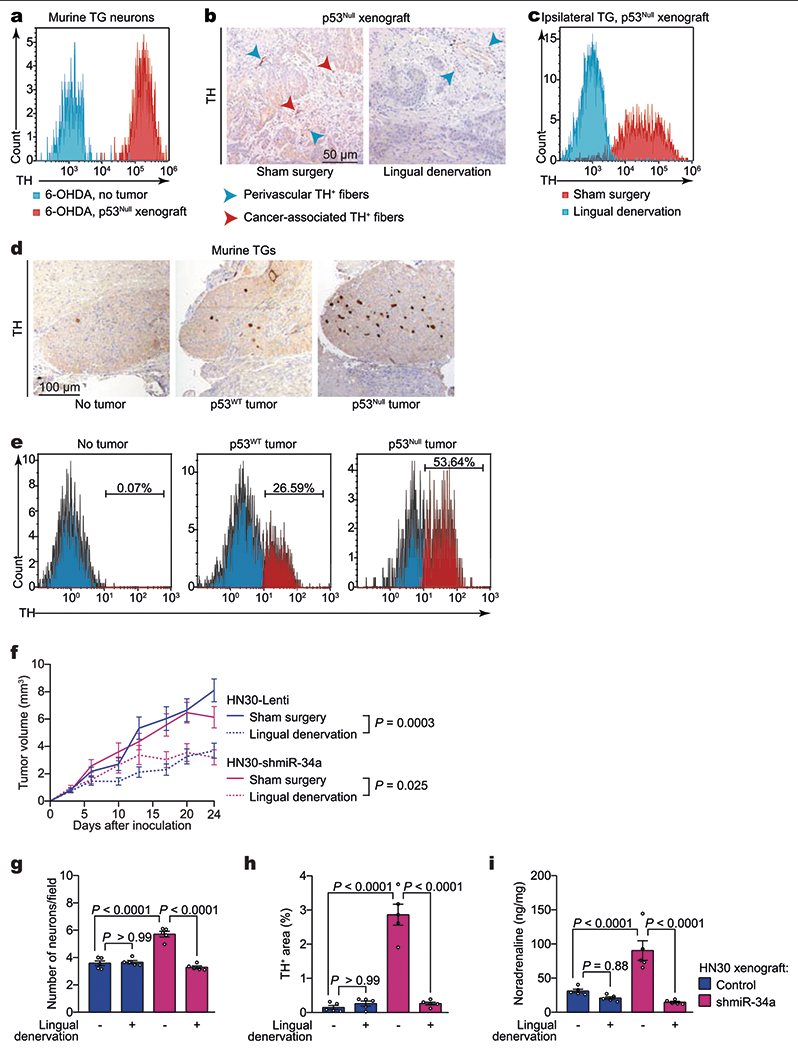
a, Flow cytometry quantification of neurotrophin-3-positive (NT3+), TH+ neurons in freshly collected ipsilateral TG neurons 3 weeks after orthotopic inoculation of p53null PCI-13 cells to the tongues of sympathectomized mice. Non-tumour-bearing, sympathectomized mice were used as controls (n = 6). b, Representative immunohistochemical analysis for TH+ in orthotopic xenografts; data independently replicated in 16 mice. c, Flow cytometry quantification of NT3+TH+ neurons in ipsilateral TG neurons (n = 6 mice per condition). d, Representative images of TH+ TG neurons in mice without tumours (left) and 3 weeks after injection of p53WT (middle) or p53null (right) PCI-13 cells to the ipsilateral tongue; data independently replicated in nine mice. e, Flow cytometry quantification of NT3+ TH+ neurons in freshly collected ipsilateral TG 3 weeks after orthotopic inoculation of p53WT (middle) and p53null (right) PCI-13 cells to the tongue. Non-tumour-bearing mice were used as controls (left, n = 12 per group). f, Serial in vivo analyses of tumour growth after engraftment of HN30 transfected with either control lentivirus (HN30-lenti) or shmiR34a (HN30-shmiR34a) into BALB/c (nu/nu) mice. Mice were randomized and underwent lingual denervation or sham surgery 1 week before cell injection (n = 8 per group). Tumour growth curves represent mean tumour volume ± s.e.m.; unpaired two-tailed t-test. g–i, Neural density (g), TH+ area (h), and noradrenaline levels in vivo (i) in HN30-lenti and HN30-shmiR34a orthotopic xenografts with and without lingual denervation (n = 5 biologically independent samples per condition). Bars indicate mean ± s.e.m.; unpaired two-tailed t-test.
Extended Data Fig. 8 |. Characterization of OCSCC-induced neural transcriptional program.
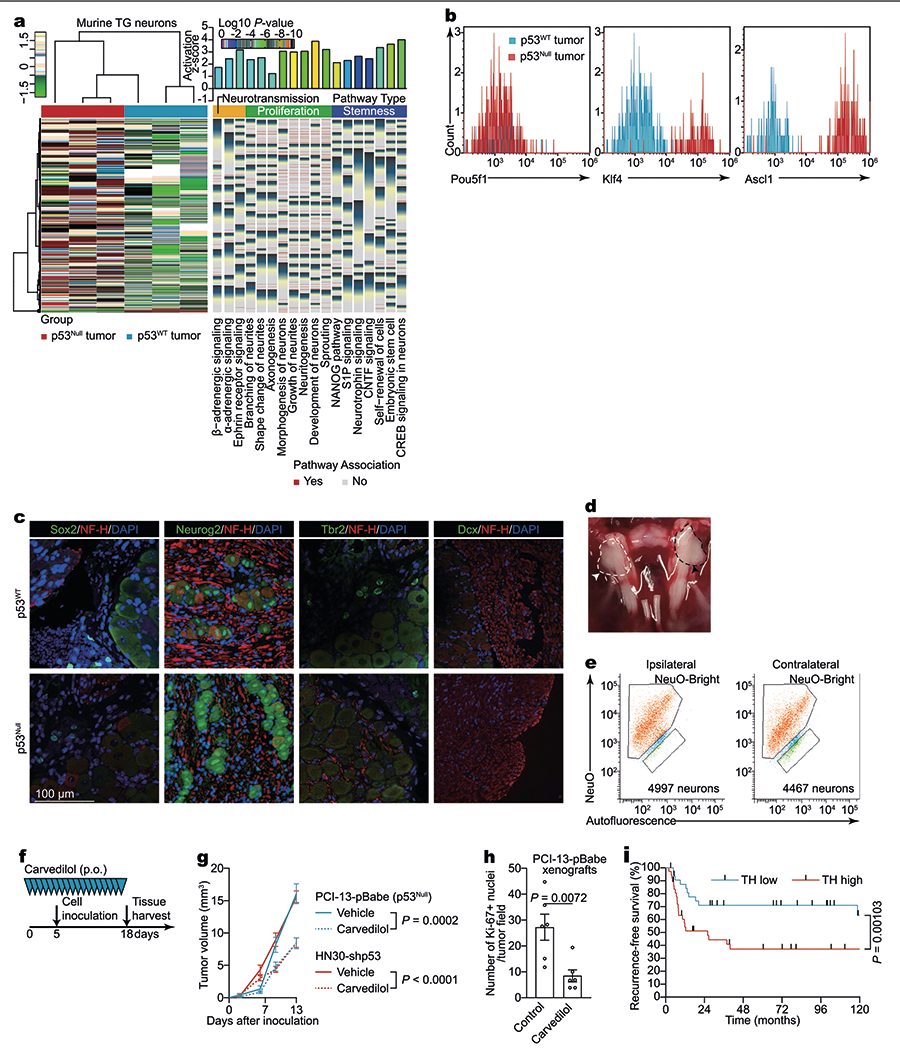
a, Heat map of differentially expressed genes arranged by unsupervised hierarchical clustering in TG neurons 3 weeks after orthotopic injection of p53null or p53WT PCI-13 cells (n = 3 biologically independent samples per condition) and enriched Gene Ontology terms plotted by fold enrichment with the associated log P value (right; Fisher’s exact algorithm for functional gene set enrichment). b, Flow cytometry quantification of NeuroFluor-positive (NeuO+), POU5F1+ (left), NeuO+KLF4+ (middle), and NeuO+ASCL1+ (right) neurons in ipsilateral TGs after orthotopic injection of p53null or p53WT PCI-13 cells; data independently replicated in six mice. c, Representative images in freshly collected TG neurons (red, NF-H+) from BALB/c (nu/nu) mice after orthotopic injection of either p53null or p53WT PCI-13 cells to the ipsilateral tongue, demonstrating lack of nuclear expression of the transcription factors SOX2, TBR2, and DCX and similar neurogenin2 expression between groups. Data independently replicated in six mice; DAPI, blue. d, e, Representative necropsy photograph (TG delineated by dashed line in c) and flow cytometry quantification of NeuO+ neurons in freshly collected TG 3 weeks after tumour injection to the left side of the tongue; ipsilateral (c, right, black arrowhead) and contralateral (c, left, white arrowhead) ganglia were similar in size. None of the tumours crossed the midline of the tongue (n = 6). f, g, Mice were treated daily with either β-adrenergic receptor blocker carvedilol or vehicle via oral gavage. On day 5, mice were orthotopically xenografted with human p53-deficient (p53null PCI-13 or HN30-shp53) cells to the tongue. Serial in vivo tumour volume measurement (n = 12 per group except for p53null PCI-13 tumour-bearing mice with carvedilol treatment, n = 13; f). h, Adrenergic inhibition decreases OCSCC proliferation in vivo. Carvedilol injections inhibited the proliferation of p53null PCI-13 cells orthotopically implanted into the tongue, as determined by Ki-67 expression (n = 6 biologically independent samples per condition). i, Kaplan–Meier curves showing the recurrence-free survival of patients with high (>2,000 μm2 per field) and low (≤2,000 μm2 per field) TH+ adrenergic nerve densities. Mean ± s.e.m.; unpaired two-tailed t-test.
Supplementary Material
Acknowledgements
G.A.C. is the Felix L. Haas Endowed Professor in Basic Science. Work in the Calin laboratory is supported by National Institutes of Health (NIH/NCATS) grant UH3TR00943-01 through the NIH Common Fund, Office of Strategic Coordination (OSC), NCI grants 1R01CA182905-01 and 1R01CA222007-01A1, National Institute of General Medical Sciences (NIGMS) grant 1R01GM122775-01, U54 grant CA096297/CA096300 – UPR/MDACC Partnership for Excellence in Cancer Research 2016 Pilot Project, US Department of Defense grant CA160445P1, a Chronic Lymphocytic Leukemia Moonshot Flagship Project, a Sister Institution Network Fund (SINF) 2017 grant, and the Estate of C. G. Johnson Jr. Work in the Dougherty laboratory is supported by NIH grant CA200263, Thompson Family Foundation Initiative; P.M.D. is the H.E.B. Endowed Professor in Basic Science. The NIH Cancer Center Support Grant P30CA016672 supports the High Resolution Electron Microscopy Facility (K. Dunner Jr) and the Advanced Technology Genomics Core (core grant CA016672) at The University of Texas MD Anderson Cancer Center. We thank M. Sushnitha for assistance with miRNA encapsulation; A. Patel for technical assistance; J. K. Burks for discussions and technical assistance with image analysis; C. M. Johnston; H. Kimhi; S. J. Bronson; E. Kimhi and D. M. Aten for artistic work; and our patients and their families. This work was supported by National Institute of Dental and Craniofacial Research grant 5R01 DE014613 12 (J.N.M.) and by S.I.A. funds (G.A.C.). Y.C. and R.W. were funded by the National Natural Science Foundation of China (NSFC, 81741082). D.A.S. is supported by NCI fellowship NIH/NCI F30CA228258.
Footnotes
Online content
Any methods, additional references, Nature Research reporting summaries, source data, extended data, supplementary information, acknowledgements, peer review information; details of author contributions and competing interests; and statements of data and code availability are available at https://doi.org/10.1038/s41586-020-1996-3.
Competing interests The authors declare no competing interests.
Supplementary information is available for this paper at https://doi.org/10.1038/s41586-020-1996-3.
Data availability
Neuron RNA sequencing data from in vivo and in vitro experiments are available from the Gene Expression Omnibus (GEO) under accession number GSE134220. mRNA array data are available on GEO under accession number GSE140189, and miRNA array data are available on GEO under accession number GSE140324. All other data are available in the article and source data, or from the corresponding author upon reasonable request.
References
- 1.Magnon C et al. Autonomic nerve development contributes to prostate cancer progression. Science 341, 1236361 (2013). [DOI] [PubMed] [Google Scholar]
- 2.Ayala GE et al. Cancer-related axonogenesis and neurogenesis in prostate cancer. Clin. Cancer Res. 14, 7593–7603 (2008). [DOI] [PubMed] [Google Scholar]
- 3.Zahalka AH et al. Adrenergic nerves activate an angio-metabolic switch in prostate cancer. Science 358, 321–326 (2017). [DOI] [PMC free article] [PubMed] [Google Scholar]
- 4.Ravi R et al. Regulation of tumor angiogenesis by p53-induced degradation of hypoxia-inducible factor 1α. Genes Dev. 14, 34–44 (2000). [PMC free article] [PubMed] [Google Scholar]
- 5.Schmid JO et al. Cancer cells cue the p53 response of cancer-associated fibroblasts to cisplatin. Cancer Res. 72, 5824–5832 (2012). [DOI] [PubMed] [Google Scholar]
- 6.Antoniades HN, Galanopoulos T, Neville-Golden J, Kiritsy CP & Lynch SE p53 expression during normal tissue regeneration in response to acute cutaneous injury in swine. J. Clin. Invest 93, 2206–2214 (1994). [DOI] [PMC free article] [PubMed] [Google Scholar]
- 7.Yun MH, Gates PB & Brockes JP Regulation of p53 is critical for vertebrate limb regeneration. Proc. Natl Acad. Sci. USA 110, 17392–17397 (2013). [DOI] [PMC free article] [PubMed] [Google Scholar]
- 8.Li Z et al. Cdkn2a suppresses metastasis in squamous cell carcinomas induced by the gain-of-function mutant p53(R172H). J. Pathol 240, 224–234 (2016). [DOI] [PMC free article] [PubMed] [Google Scholar]
- 9.Joerger AC & Fersht AR Structural biology of the tumor suppressor p53. Annu. Rev. Biochem 77, 557–582 (2008). [DOI] [PubMed] [Google Scholar]
- 10.Ostrowski M et al. Rab27a and Rab27b control different steps of the exosome secretion pathway. Nat. Cell Biol 12, 19–30 (2010). [DOI] [PubMed] [Google Scholar]
- 11.Posner R et al. Neuronal small RNAs control behavior transgenerationally. Cell 177, 1814–1826.e1815 (2019). [DOI] [PMC free article] [PubMed] [Google Scholar]
- 12.Chen W & Qin C General hallmarks of microRNAs in brain evolution and development. RNA Biol. 12, 701–708 (2015). [DOI] [PMC free article] [PubMed] [Google Scholar]
- 13.Pang RT et al. MicroRNA-34a suppresses invasion through downregulation of Notch1 and Jagged1 in cervical carcinoma and choriocarcinoma cells. Carcinogenesis 31, 1037–1044 (2010). [DOI] [PubMed] [Google Scholar]
- 14.Prueitt RL et al. Expression of microRNAs and protein-coding genes associated with perineural invasion in prostate cancer. Prostate 68, 1152–1164 (2008). [DOI] [PMC free article] [PubMed] [Google Scholar]
- 15.Lubov J et al. Meta-analysis of microRNAs expression in head and neck cancer: uncovering association with outcome and mechanisms. Oncotarget 8, 55511–55524 (2017). [DOI] [PMC free article] [PubMed] [Google Scholar]
- 16.Ramdas L et al. miRNA expression profiles in head and neck squamous cell carcinoma and adjacent normal tissue. Head Neck 31, 642–654 (2009). [DOI] [PMC free article] [PubMed] [Google Scholar]
- 17.Sousa LO et al. Lymph node or perineural invasion is associated with low miR-15a, miR-34c and miR-199b levels in head and neck squamous cell carcinoma. BBA Clin. 6, 159–164 (2016). [DOI] [PMC free article] [PubMed] [Google Scholar]
- 18.North RY et al. Electrophysiological and transcriptomic correlates of neuropathic pain in human dorsal root ganglion neurons. Brain 142, 1215–1226 (2019). [DOI] [PMC free article] [PubMed] [Google Scholar]
- 19.Choi YJ et al. miR-34 miRNAs provide a barrier for somatic cell reprogramming.Nat. Cell Biol. 13, 1353–1360 (2011). [DOI] [PMC free article] [PubMed] [Google Scholar]
- 20.Choi YJ et al. Deficiency of microRNA miR-34a expands cell fate potential in pluripotent stem cells. Science 355, eaag1927 (2017). [DOI] [PMC free article] [PubMed] [Google Scholar]
- 21.Agostini M et al. Neuronal differentiation by TAp73 is mediated by microRNA-34a regulation of synaptic protein targets. Proc. Natl Acad. Sci. USA 108, 21093–21098 (2011). [DOI] [PMC free article] [PubMed] [Google Scholar]
- 22.Jauhari A, Singh T, Singh P, Parmar D & Yadav S Regulation of miR-34 family in neuronal development. Mol. Neurobiol 55, 936–945 (2018). [DOI] [PubMed] [Google Scholar]
- 23.Dennis G Jr et al. DAVID: database for annotation, visualization, and integrated discovery. Genome Biol. 4, 3 (2003). [PubMed] [Google Scholar]
- 24.Tsunemoto R et al. Diverse reprogramming codes for neuronal identity. Nature 557, 375–380 (2018). [DOI] [PMC free article] [PubMed] [Google Scholar]
- 25.Vierbuchen T et al. Direct conversion of fibroblasts to functional neurons by defined factors. Nature 463, 1035–1041 (2010). [DOI] [PMC free article] [PubMed] [Google Scholar]
- 26.Hsu SD et al. miRTarBase update 2014: an information resource for experimentally validated miRNA-target interactions. Nucleic Acids Res. 42, D78–D85 (2014). [DOI] [PMC free article] [PubMed] [Google Scholar]
- 27.Miranda KC et al. A pattern-based method for the identification of microRNA binding sites and their corresponding heteroduplexes. Cell 126, 1203–1217 (2006). [DOI] [PubMed] [Google Scholar]
- 28.Lewis BP, Shih IH, Jones-Rhoades MW, Bartel DP & Burge CB Prediction of mammalian microRNA targets. Cell 115, 787–798 (2003). [DOI] [PubMed] [Google Scholar]
- 29.Kim J et al. Direct reprogramming of mouse fibroblasts to neural progenitors. Proc. Natl Acad. Sci. USA 108, 7838–7843 (2011). [DOI] [PMC free article] [PubMed] [Google Scholar]
- 30.Yao H et al. Transdifferentiation-induced neural stem cells promote recovery of middle cerebral artery stroke rats. PLoS One 10, e0137211 (2015). [DOI] [PMC free article] [PubMed] [Google Scholar]
- 31.Wapinski OL et al. Hierarchical mechanisms for direct reprogramming of fibroblasts to neurons. Cell 155, 621–635 (2013). [DOI] [PMC free article] [PubMed] [Google Scholar]
- 32.Axelson H The Notch signaling cascade in neuroblastoma: role of the basic helix-loop-helix proteins HASH-1 and HES-1. Cancer Lett. 204, 171–178 (2004). [DOI] [PubMed] [Google Scholar]
- 33.Mauffrey P et al. Progenitors from the central nervous system drive neurogenesis in cancer. Nature 569, 672–678 (2019). [DOI] [PubMed] [Google Scholar]
- 34.Zhao CM et al. Denervation suppresses gastric tumorigenesis. Sci. Transl. Med 6, 250ra115 (2014). [DOI] [PMC free article] [PubMed] [Google Scholar]
- 35.Melhem-Bertrandt A et al. Beta-blocker use is associated with improved relapse-free survival in patients with triple-negative breast cancer. J. Clin. Oncol 29, 2645–2652 (2011). [DOI] [PMC free article] [PubMed] [Google Scholar]
- 36.Faulkner S, Jobling P, March B, Jiang CC & Hondermarck H Tumor neurobiology and the war of nerves in cancer. Cancer Discov. 9, 702–710 (2019). [DOI] [PubMed] [Google Scholar]
- 37.Lin CS, Lin WS, Lin CL & Kao CH Carvedilol use is associated with reduced cancer risk: a nationwide population-based cohort study. Int. J. Cardiol 184, 9–13 (2015). [DOI] [PubMed] [Google Scholar]
- 38.Caulin C et al. An inducible mouse model for skin cancer reveals distinct roles for gain- and loss-of-function p53 mutations. J. Clin. Invest 117, 1893–1901 (2007). [DOI] [PMC free article] [PubMed] [Google Scholar]
- 39.Myers JN, Holsinger FC, Jasser SA, Bekele BN & Fiddler IJ An orthotopic nude mouse model of oral tongue squamous cell carcinoma. Clin. Cancer. Res 8, 293–298 (2002). [PubMed] [Google Scholar]
- 40.Foy JP et al. The dynamics of gene expression changes in a mouse model of oral tumorigenesis may help refine prevention and treatment strategies in patients with oral cancer. Oncotarget 7, 35932–35945 (2016). [DOI] [PMC free article] [PubMed] [Google Scholar]
- 41.Tang XH, Knudsen B, Bemis D, Tickoo S & Gudas LJ Oral cavity and esophageal carcinogenesis modeled in carcinogen-treated mice. Clin. Cancer Res 10, 301–313 (2004). [DOI] [PubMed] [Google Scholar]
- 42.Guagliardo NA & Hill DL Fungiform taste bud degeneration in C57BL/6J mice following chorda-lingual nerve transection. J. Comp. Neurol 504, 206–216 (2007). [DOI] [PMC free article] [PubMed] [Google Scholar]
- 43.Ricklefs F et al. Extracellular vesicles from high-grade glioma exchange diverse pro-oncogenic signals that maintain intratumoral heterogeneity. Cancer Res. 76, 2876–2881 (2016). [DOI] [PMC free article] [PubMed] [Google Scholar]
- 44.Haderk F et al. Extracellular vesicles in chronic lymphocytic leukemia. Leuk. Lymphoma 54, 1826–1830 (2013). [DOI] [PubMed] [Google Scholar]
- 45.FASTQC: a quality control tool for high throughput sequence data (Babraham Bioinformatics, 2011). [Google Scholar]
- 46.Kim D et al. TopHat2: accurate alignment of transcriptomes in the presence of insertions, deletions and gene fusions. Genome Biol. 14, R36 (2013). [DOI] [PMC free article] [PubMed] [Google Scholar]
- 47.Li H et al. The sequence alignment/map format and SAMtools. Bioinformatics 25, 2078–2079 (2009). [DOI] [PMC free article] [PubMed] [Google Scholar]
- 48.Anders S, Pyl PT & Huber W HTSeq—a Python framework to work with high-throughput sequencing data. Bioinformatics 31, 166–169 (2015). [DOI] [PMC free article] [PubMed] [Google Scholar]
- 49.Robinson MD & Oshlack A A scaling normalization method for differential expression analysis of RNA-seq data. Genome Biol. 11, R25 (2010). [DOI] [PMC free article] [PubMed] [Google Scholar]
- 50.Robinson MD, McCarthy DJ & Smyth GK edgeR: a Bioconductor package for differential expression analysis of digital gene expression data. Bioinformatics 26, 139–140 (2010). [DOI] [PMC free article] [PubMed] [Google Scholar]
- 51.Martin M Cutadapt removes adapter sequences from high-throughput sequencing reads. EMBnet.journal 17, 10–12 (2011). [Google Scholar]
- 52.Li H & Durbin R Fast and accurate long-read alignment with Burrows-Wheeler transform. Bioinformatics 26, 589–595 (2010). [DOI] [PMC free article] [PubMed] [Google Scholar]
- 53.Liao Y, Smyth GK & Shi W featureCounts: an efficient general purpose program for assigning sequence reads to genomic features. Bioinformatics 30, 923–930 (2014). [DOI] [PubMed] [Google Scholar]
- 54.Bandyopadhyay S & Mitra R TargetMiner: microRNA target prediction with systematic identification of tissue-specific negative examples. Bioinformatics 25, 2625–2631 (2009). [DOI] [PubMed] [Google Scholar]
- 55.Agarwal V, Bell GW, Nam JW & Bartel DP Predicting effective microRNA target sites in mammalian mRNAs. eLife 4, (2015). [DOI] [PMC free article] [PubMed] [Google Scholar]
- 56.Wong N & Wang X miRDB: an online resource for microRNA target prediction and functional annotations. Nucleic Acids Res. 43, D146–D152 (2015). [DOI] [PMC free article] [PubMed] [Google Scholar]
- 57.Wang X Improving microRNA target prediction by modeling with unambiguously identified microRNA-target pairs from CLIP-ligation studies. Bioinformatics 32, 1316–1322 (2016). [DOI] [PMC free article] [PubMed] [Google Scholar]
- 58.Kozomara A & Griffiths-Jones S miRBase: annotating high confidence microRNAs using deep sequencing data. Nucleic Acids Res. 42, D68–D73 (2014). [DOI] [PMC free article] [PubMed] [Google Scholar]
- 59.Chou CH et al. miRTarBase update 2018: a resource for experimentally validated microRNA-target interactions. Nucleic Acids Res. 46, D296–D302 (2018). [DOI] [PMC free article] [PubMed] [Google Scholar]
Associated Data
This section collects any data citations, data availability statements, or supplementary materials included in this article.
Supplementary Materials
Data Availability Statement
Neuron RNA sequencing data from in vivo and in vitro experiments are available from the Gene Expression Omnibus (GEO) under accession number GSE134220. mRNA array data are available on GEO under accession number GSE140189, and miRNA array data are available on GEO under accession number GSE140324. All other data are available in the article and source data, or from the corresponding author upon reasonable request.


