Nucleic Acids Research, Volume 49, Issue 1, 11 January 2021, Pages 221–243, https://doi.org/10.1093/nar/gkaa1120
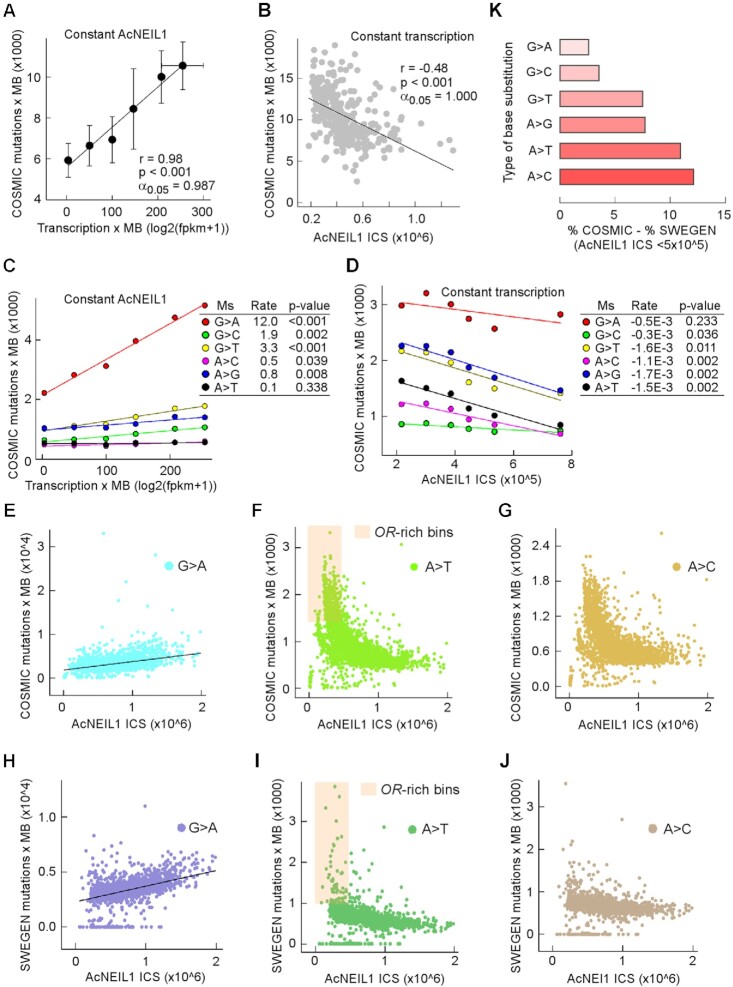
In the originally published version of this manuscript, panel B and C in figure 5 were swapped: panel C should be panel B and panel C should be panel B. In addition, the legend to panel D should read ‘from B’ rather than ‘from C’ and that to panel K should read: in the Swedish population subtracted from those in cancer genomes.
Figure 5.
AcNEIL1 occupancy correlates with low mutation rates. (A) Mutation loads in cancer genomes increase with transcription. Mutations were computed for 6 different types of genomic region each containing 10 1-Mb bins with high AcNEIL1 ICS (∼1 million counts/bin) but increasing transcription. Transcription data were from normal tissues. Data represent mean and SD (vertical bars for mutations and horizontal bars for transcription). The bin containing TP53 with 45,787 mutations was excluded. (B) Mutation loads in cancer genomes decrease with increasing AcNEIL1 density. Mutations were computed for 322 1-Mb bins each containing low transcription (0.5 – 5) as a function of AcNEIL1 ICS. (C) Deconvolution of mutation loads in cancer genomes into 6 mutation spectra as a function of transcription at steady AcNEIL1 concentration, from A. Data were fitted to linear regressions with rates representing dy/dx changes. P-values were from the regression coefficients. (D) Deconvolution of mutation loads in cancer genomes into 6 mutation spectra as a function of AcNEIL1 ICS and constant transcription from B. Data were fitted to linear regression with rates representing dy/dx changes. P-values were from the regression coefficients. (E) – (G) Genome-wide number of mutations as a function of AcNEIL1 ICS in cancer genomes. (E) G>A; (F) A>T; (G) A>C. Orange highlight, low AcNEIL1-containing bins enriched in olfactory receptor (OR) genes. (H) – (J) Genome-wide number of SNPs as a function of AcNEIL1 ICS in the Swedish population. (H) G>A; (I) A>T; (J) A>C. Orange highlight, low AcNEIL1-containing bins enriched in olfactory receptor (OR) genes. (K) Relative difference in base changes between cancer genomes and the germline. The percentage base changes occurring in all bins with low (≤5x10⁵) versus high (>5x10⁵) AcNEIL1 ICS in the Swedish population subtracted from those in cancer genomes.
These details have been corrected only in this correction notice to preserve the published version of record.


