Lopes et al. perform a pilot dissection of the cancer tubulin code in the NCI-60 cancer cell panel that identifies high α-tubulin acetylation as a biomarker of taxol response and unveils a mechanistic link between α-tubulin detyrosination and the suppression of MCAK activity in taxol-induced cytotoxicity.
Abstract
α/β-Tubulin posttranslational modifications (PTMs) generate microtubule diversity, but whether they account for cancer cell resistance to microtubule-targeting drugs remains unknown. Here, we performed a pilot dissection of the “cancer tubulin code” using the NCI-60 cancer cell panel. We found that acetylated, detyrosinated, and ∆2-α-tubulin that typically accumulate on stable microtubules were uncoupled in many cancer cells. Acetylated α-tubulin did not affect microtubule dynamics, whereas its levels correlated with, but were not required for, taxol-induced cytotoxicity. In contrast, experimental increase of α-tubulin detyrosination, and/or depletion of the detyrosination-sensitive microtubule-depolymerizing enzyme MCAK, enhanced taxol-induced cytotoxicity by promoting cell death in mitosis and the subsequent interphase, without causing a cumulative effect. Interestingly, only increased detyrosinated α-tubulin aggravated taxol-induced spindle multipolarity. Overall, we identified high α-tubulin acetylation as a potential biomarker for cancer cell response to taxol and uncovered a mechanistic link between α-tubulin detyrosination and the suppression of MCAK activity in taxol-induced cytotoxicity, likely by promoting chromosome missegregation, regardless of spindle defects.
Introduction
Microtubules (MTs) are dynamic polymers of α/β-tubulin involved in cell division, migration, and invasion, and are amongst the most successful targets in cancer treatment (Dumontet and Jordan, 2010). Human cells express several α/β-tubulin isotypes that combine with various posttranslational modifications (PTMs) to generate MT diversity (Janke and Magiera, 2020; Verhey and Gaertig, 2007). How this so-called “tubulin code” is read by MT-associated proteins and motors and whether it impacts specific cellular functions remained largely unknown for over 40 yr. However, with the discovery of the catalytic enzymes accounting for the different tubulin PTMs, recent studies started to unveil their critical roles in mitosis and meiosis, neuronal processes and brain function, as well as heart and skeletal muscle contraction (Magiera et al., 2018). Importantly, despite existing evidence linking specific tubulin isotypes and PTMs with tumor development and metastasis, a comprehensive analysis and functional dissection of the cancer tubulin code is still lacking (Lopes and Maiato, 2020).
α-Tubulin acetylation of Lysine 40 (K40) and detyrosination are amongst the best-characterized tubulin PTMs (Janke and Magiera, 2020; Verhey and Gaertig, 2007). K40 acetylation, which takes place in the MT lumen, is mediated by αTAT1 (Akella et al., 2010; Shida et al., 2010) and reverted by HDAC6 and SIRT2 deacetylases (Hubbert et al., 2002; North et al., 2003). In turn, detyrosination consists of the catalytic removal of the last tyrosine residue from the unstructured C-terminal tail of most α-tubulin isotypes. This is mediated by VASH1/VASH2 and MATCAP carboxypeptidases (Aillaud et al., 2017; Landskron et al., 2022; Nieuwenhuis et al., 2017) and reverted by a specific tubulin tyrosine ligase (TTL) that retyrosinates α-tubulin (Ersfeld et al., 1993). A non-retyrosinatable Δ2-α-tubulin may also form after the removal of the penultimate glutamic acid in the C-terminal tail by cytosolic carboxypeptidases (Paturle-Lafanechere et al., 1991). Acetylated, detyrosinated, and Δ2-α-tubulin accumulate on stable/long-lived MTs (Khawaja et al., 1988; Paturle-Lafanechère et al., 1994; Webster et al., 1990). As such, cell treatment with MT stabilizing drugs, such as taxol/paclitaxel, increases the accumulation of these tubulin PTMs (Ferreira et al., 2020; Paturle-Lafanechère et al., 1994; Webster et al., 1990; Xiao et al., 2006), but their functional relationship and whether they directly or indirectly interfere with MT dynamic properties remains unclear. Recent works suggested that α-tubulin acetylation of K40 confers resistance to MT breakage, thereby promoting the mechanical stability of long-lived MTs (Portran et al., 2017; Xu et al., 2017). In contrast, MT depolymerization experiments and injection of function-blocking antibodies against TTL provided evidence that α-tubulin detyrosination does not directly interfere with MT stability (Khawaja et al., 1988; Webster et al., 1990). More recently, genetic perturbation of TTL in human cells and in vitro reconstitution experiments further supported this conclusion (Chen et al., 2021; Ferreira et al., 2020). However, α-tubulin detyrosination suppresses the activity of effector proteins involved in the regulation of MT dynamics, including MCAK, an MT-depolymerizing enzyme of the kinesin-13 family (Ferreira et al., 2020; Liao et al., 2019; Peris et al., 2009; Sirajuddin et al., 2014).
Intrinsic or acquired resistance to MT-targeting drugs, such as taxol and its derivatives, remains a major challenge in improving therapy response and cancer patient survival (Orr et al., 2003). Several mechanisms, including altered expression of tubulin isotypes, tubulin mutations, and modifications of MT-regulatory proteins, have been implicated in taxol resistance, but whether and how tubulin PTMs play a role in this process remains poorly understood. Here, we used the NCI-60 cancer cell panel, a validated anticancer drug screening platform representing nine distinct tumor types (leukemia, colon, lung, central nervous system [CNS], renal, melanoma, ovarian, breast, and prostate; Shoemaker, 2006) to perform a pilot analysis and initial functional dissection of the cancer tubulin code, while investigating the respective impact in taxol-induced cytotoxicity. In particular, we focused on determining whether and how specific posttranslational signatures (acetylation, detyrosination, and related ∆2 modification of α-tubulin) vary among the different cancer cell lines of the panel. Experimental manipulation of these tubulin PTMs, combined with functional studies, revealed that elevated α-tubulin acetylation predicts taxol cytotoxicity and may be a useful biomarker for cancer patient stratification toward a more personalized treatment with MT-targeting drugs. In addition, we uncovered a role for α-tubulin detyrosination in taxol-induced cytotoxicity by promoting cell death in mitosis and the subsequent interphase. Mechanistically, our functional studies suggest that α-tubulin detyrosination promotes taxol-induced cytotoxicity mainly by suppressing the activity of the MT-depolymerizing enzyme MCAK involved in mitotic error correction. Overall, this work provides a pilot dissection of the cancer tubulin code and identifies MT acetylation and detyrosination as predictive and causal determinants of taxol response, respectively.
Results
Cancer cells show highly variable tubulin PTM signatures
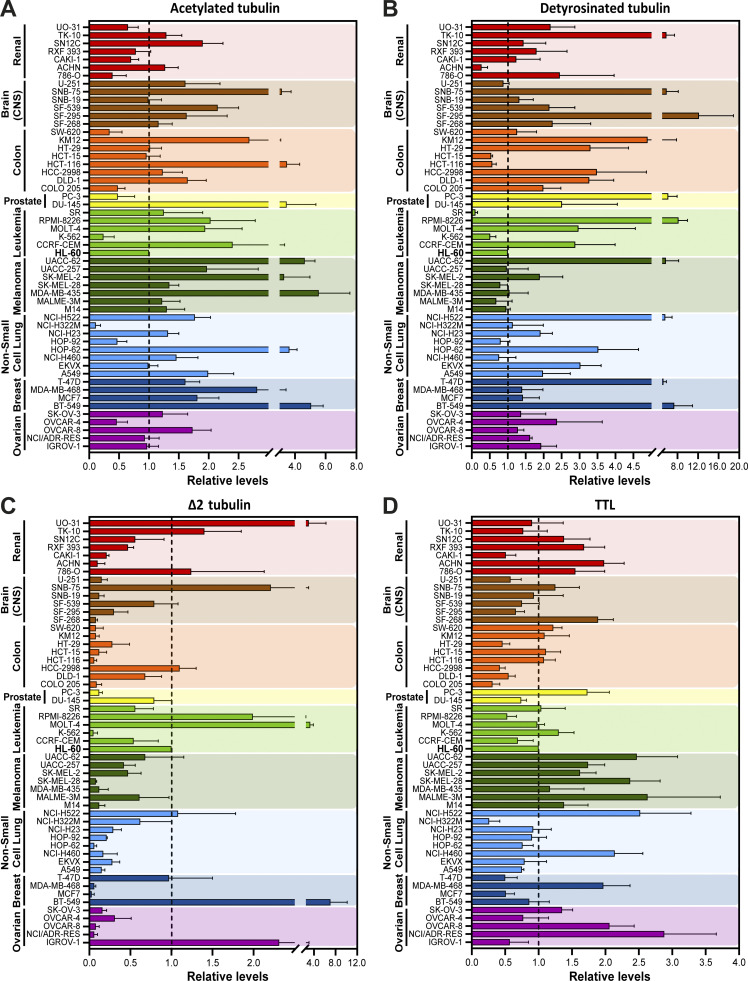
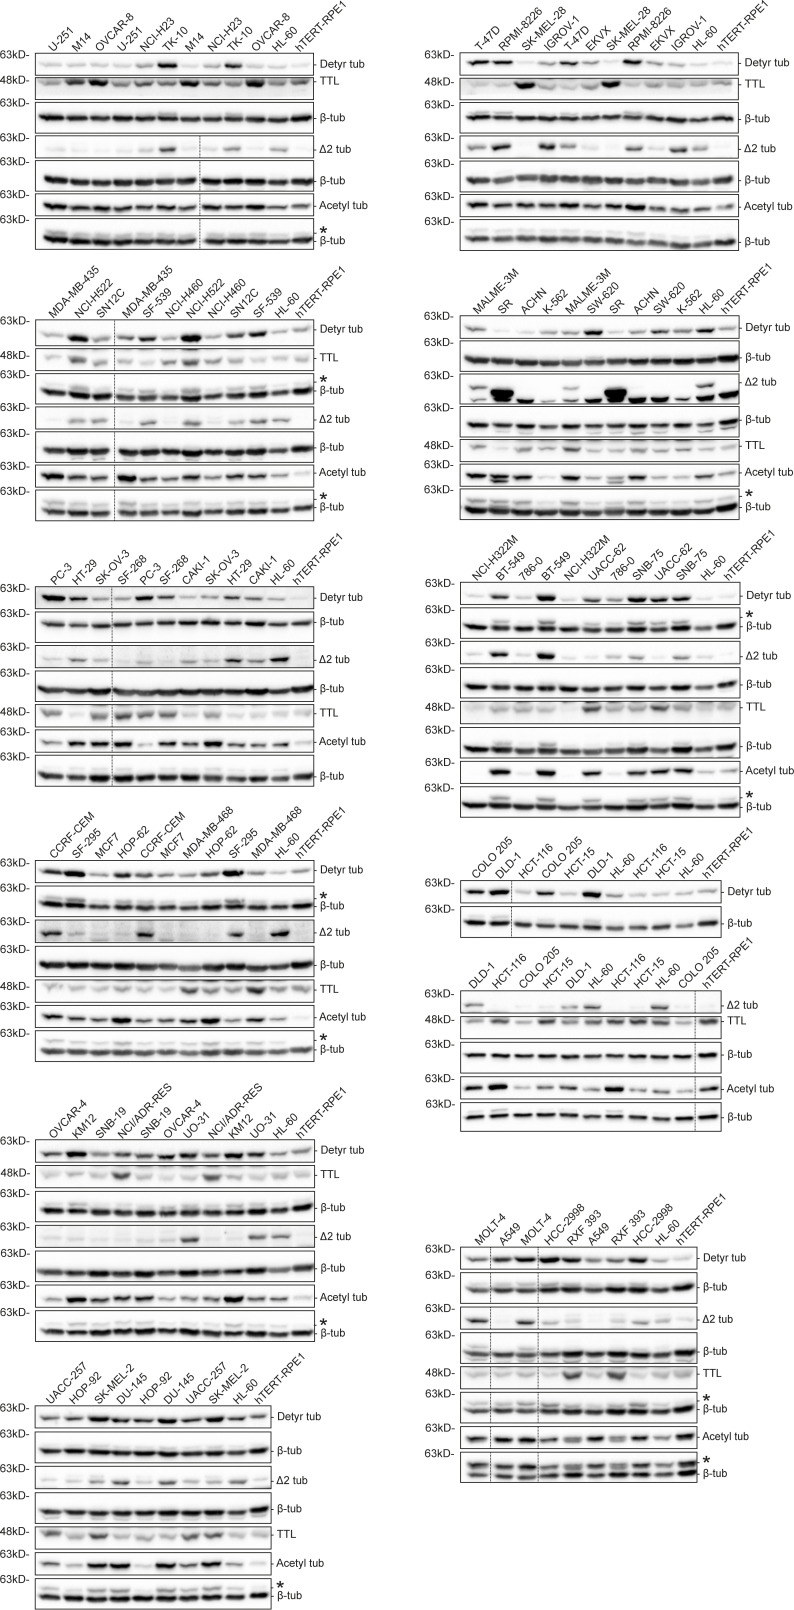
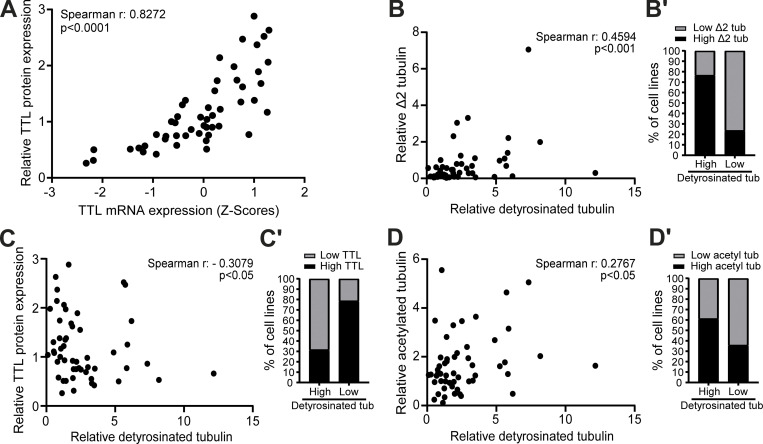
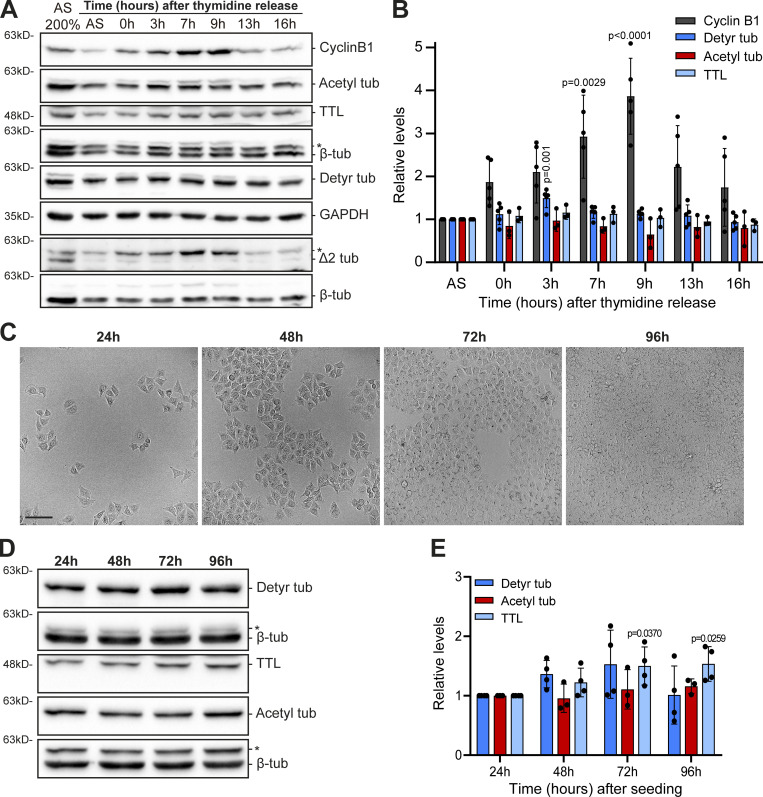
To investigate whether distinct cancer cell types show different molecular signatures associated with the accumulation of specific α-tubulin PTMs, namely acetylation, detyrosination, and related Δ2 modification, we screened the NCI-60 cancer cell panel by immunoblot with previously validated antibodies (Fig. 1, A−C, and Fig. S1; Barisic et al., 2015; Ferreira et al., 2018; Ferreira et al., 2020). To control our quantitative immunoblot analyses, we also included the detection of the retyrosinating enzyme TTL (Fig. 1 D and Fig. S1) and compared its expression with the respective TTL mRNA levels obtained from the CellMiner database, a public web-based suite compiling transcriptomic data from the NCI-60 cancer cell panel (Reinhold et al., 2012). A strong correlation (r = 0.8272, P <0.0001) between TTL protein and mRNA levels among the different NCI-60 cell lines was found (Fig. 2 A), thereby validating our approach. To compare different cancer cell lines between immunoblots, the leukemia cell line HL-60, which showed intermediate levels of α-tubulin acetylation and detyrosination, was included in each immunoblot as an internal reference (Fig. S1). The nontransformed human telomerase reverse transcriptase (hTERT)–immortalized RPE1 cell line was also included in each immunoblot for qualitative comparative purposes (Fig. S1). Subsequent quantification of the levels of the different tubulin PTMs and TTL revealed high variability among the different cancer cell lines (including within the same tissue) that in some cases was higher than 10-fold (Fig. 1, A−D). Importantly, these differences could not be explained by cell cycle regulation of tubulin PTMs and TTL or cell confluency, since their respective levels did not change more than 1.5-fold throughout the cell cycle or at distinct cell density stages (Fig. S2, A−E).
Figure 1.
Cancer cells display highly variable tubulin PTM signatures. (A−D) Quantification of tubulin PTMs (α-tubulin detyrosination, acetylation, and Δ2-tubulin) and the retyrosinating enzyme TTL levels from the immunoblot screening in cell lines of the NCI-60 panel, normalized to the loading control β-tubulin (mean ± SD; two to six independent experiments with two replicates for each cancer cell line). To compare cell lines between immunoblots, the cell line HL-60 (dashed line) was added in all experiments as a reference value.
Figure S1.
Immunoblot screen of tubulin PTMs in the NCI-60 cancer cell panel. Protein lysates of 53 NCI-60 cancer cell lines and hTERT RPE-1 cells, immunoblotted (two to six independent experiments) for α-tubulin detyrosination, Δ2, and acetylation, TTL, and β-tubulin (as loading control). Representative immunoblots (from one experiment) of the screen containing two replicates for each cancer cell line. * indicates unspecific bands from previous probing with different antibodies. Source data are available for this figure: SourceData FS1.
Figure 2.
α-Tubulin detyrosination, Δ2, and acetylation can be uncoupled in cancer cells. (A) Correlation between TTL protein (our screen) and mRNA (z scores; CellMiner database) levels in NCI-60 cancer cells. (B−D) Correlation between levels of α-tubulin detyrosination and Δ2-tubulin, TTL, and α-tubulin acetylation in NCI-60 cancer cells. (B′−D′) Proportion of cancer cell lines of the panel with high and low Δ2-tubulin, TTL, and α-tubulin acetylation in the two groups with high and low α-tubulin detyrosination. From the tubulin PTM level values, the fourth and fifth quintiles (>60th percentile) were defined as the high group and the first and second quintiles (<40th percentile) as the low group. Spearman correlation coefficient (r) and P values are indicated in the graphs.
Figure S2.
Tubulin PTMs only vary slightly throughout the cell cycle or distinct cell confluency. (A) Protein lysates (HeLa cells) of different time points after release from double thymidine synchronization (and asynchronous lysates), immunoblotted for cyclin B1, TTL, α-tubulin detyrosination, Δ2, and acetylation. β-Tubulin and GAPDH were used as loading control. * indicates unspecific bands from previous probing with different antibodies. (B) Quantification of cyclin B1, TTL, α-tubulin detyrosination, and acetylation levels, normalized to asynchronous levels and loading control (mean ± SD; each dot represents an independent experiment [mean from one to two replicates]; one-way ANOVA [relative to asynchronous]). (C) Representative brightfield images of HeLa cell densities on different days after the initial seeding. Scale bar, 100 μm. (D) Protein lysates of these different time points immunoblotted for α-tubulin detyrosination and acetylation, TTL, and β-tubulin (as loading control). * indicates unspecific bands from previous probing with different antibodies. (E) Quantification of TTL, α-tubulin detyrosination, and acetylation levels, normalized to levels of 24 h after the initial seeding and loading control (mean ± SD; each dot represents a replicate, from two independent experiments; one-way ANOVA [relative to 24 h after the seeding]). Source data are available for this figure: SourceData FS2.
α-Tubulin detyrosination in cancer cells correlates moderately with Δ2, but only weakly with TTL/VASH expression and α-tubulin acetylation
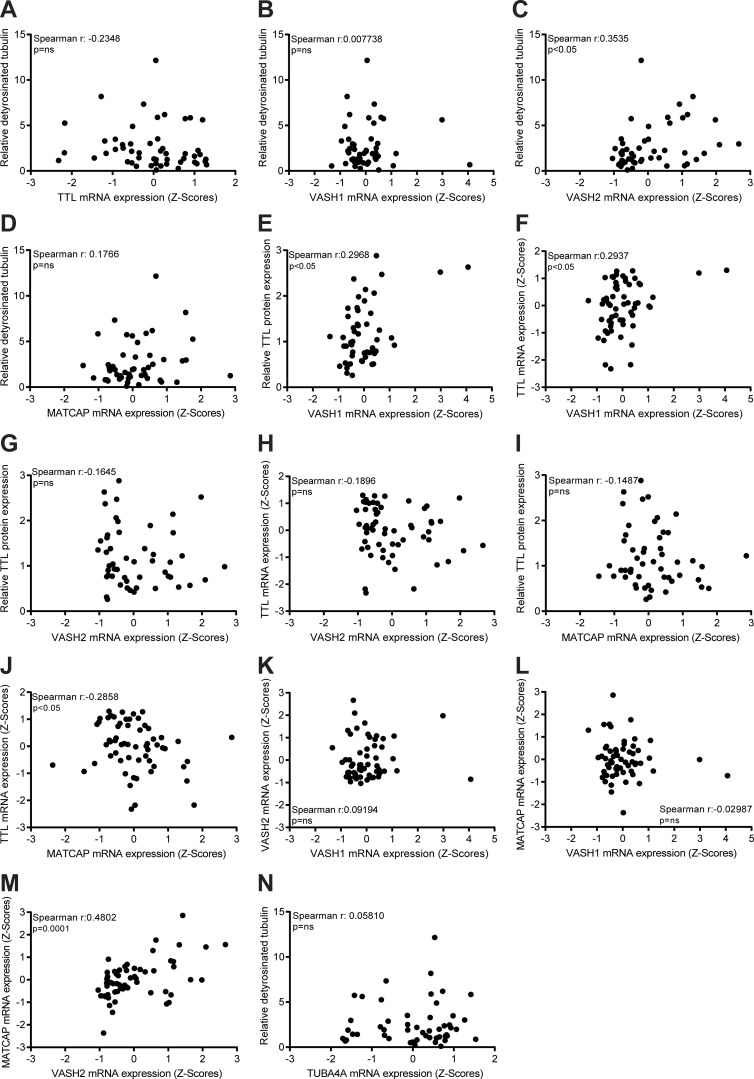
As TTL accounts for α-tubulin retyrosination, high TTL expression would be predicted to inversely correlate with α-tubulin detyrosination levels. Indeed, high detyrosinated α-tubulin was previously found to correlate with low TTL protein levels in prostate cancer cells (Soucek et al., 2006). Therefore, we investigated whether TTL protein expression correlates with α-tubulin detyrosination levels in the NCI-60 panel. Likewise, we investigated whether α-tubulin detyrosination levels correlate with the related Δ2 modification and α-tubulin acetylation. We found that α-tubulin detyrosination levels only moderately correlate with Δ2-α-tubulin levels, with some cell lines, such as in SF-295 (CNS), KM12 (colon), and PC-3 (prostate), showing no obvious relationship between these PTMs (Fig. 1, B and C, Fig. 2 B, and Fig. S1). In general, α-tubulin detyrosination showed a poor correlation with TTL protein expression (negative correlation) and α-tubulin acetylation levels (positive correlation) among the different cancer cell lines of the NCI-60 panel (Fig. 2, C and D). Interestingly, a more detailed analysis focusing on the cell lines with higher α-tubulin detyrosination levels (>60th percentile) revealed that 68.4% were found to express low TTL protein levels, 76.5% showed high Δ2-tubulin, and 61.1% had high α-tubulin acetylation levels. In agreement, for the cell lines with lower (<40th percentile) α-tubulin detyrosination levels, 78.6% expressed high TTL protein levels, 76.5% had low Δ2-α-tubulin, and 64.3% showed low α-tubulin acetylation levels (Fig. 2, B−D). Next, we investigated whether α-tubulin detyrosination and TTL expression is a function of the expression of the α-tubulin carboxypeptidases VASH1, VASH2, and MATCAP using mRNA levels obtained from the CellMiner database (Fig. S3, A−M). We only found a weak correlation between α-tubulin detyrosination and VASH2 expression (Fig. S3 C), whereas VASH1 and MATCAP expression weakly correlated with TTL levels (protein and/or mRNA; Fig. S3, E, F, and J). Lastly, we investigated whether the observed variability in α-tubulin detyrosination was related to the differential expression of TUBA4A, a genetically encoded naturally detyrosinated α-tubulin isotype, using available mRNA expression data in the CellMiner database, but we found no correlation (Fig. S3 N). Taken together, these results indicate that, although in more extreme cases the levels of specific tubulin PTMs do correlate and are somewhat linked to the expression levels of the associated catalytic enzymes, several exceptions exist in which no or only a weak correlation was observed.
Figure S3.
VASH2 expression weakly correlates with α-tubulin detyrosination, while VASH1 and MATCAP weakly correlate with TTL levels. (A–N) Correlation between α-tubulin detyrosination and mRNA (z scores; CellMiner database) levels of TTL, VASH1, VASH2, MATCAP, and TUBA4A in NCI-60 cancer cells. Correlation between the levels of TTL protein (our screen) and VASH1 mRNA (z scores; CellMiner database), TTL and VASH1 mRNA (z scores; CellMiner database), TTL protein (our screen) and VASH2 mRNA (z scores; CellMiner database), TTL and VASH2 mRNA (z scores; CellMiner database), TTL protein (our screen) and MATCAP mRNA (z scores; CellMiner database), TTL and MATCAP mRNA (z scores; CellMiner database) in NCI-60 cancer cells. Correlation between the levels of VASH1 and VASH2 mRNA (z scores; CellMiner database), MATCAP and VASH1/VASH2 mRNA (z scores; CellMiner database). Spearman correlation coefficient (r) and P values indicated in the graphs.
High α-tubulin acetylation is a potential predictive biomarker for taxol cytotoxicity
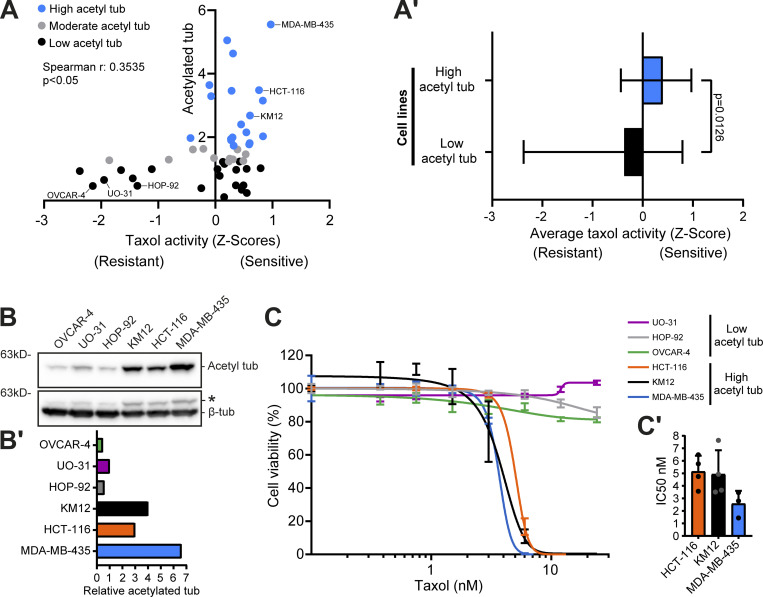
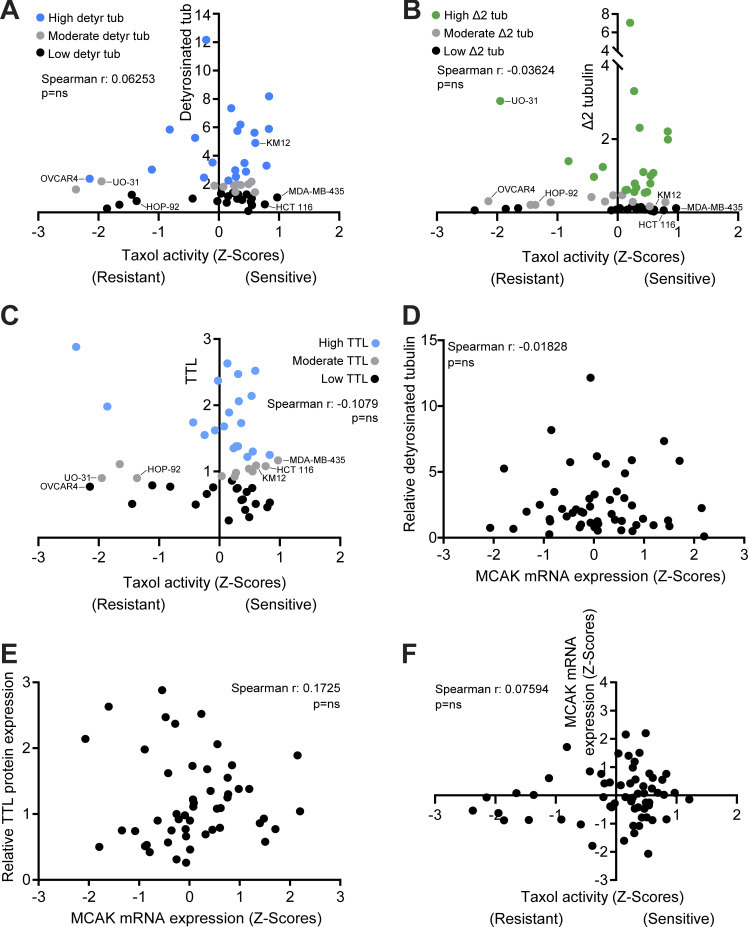
Given that tubulin PTMs are not necessarily a direct function of the expression levels of the respective catalytic enzymes, we hypothesized that other factors, such as MT stability/half-life, contribute to the accumulation of specific tubulin PTMs and, consequently, regulate cancer cell properties. To test this hypothesis, we investigated whether cancer cell cytotoxicity induced by treatment with the MT-stabilizing drug taxol is associated with specific tubulin PTMs. First, we investigated whether there is a link between acetylated, detyrosinated, or Δ2-tubulin with taxol cytotoxicity in the NCI-60 panel reported in the CellMiner database. We found only a weak, yet significant, correlation between α-tubulin acetylation levels and taxol cytotoxicity among the NCI-60 cancer cell panel (Fig. 3 A and Fig. S4, A−C). Importantly, focusing exclusively on the cancer cell lines with higher α-tubulin acetylation (>60th percentile), we found a clear bias for improved taxol response (Fig. 3, A and A′). Second, to validate our observations, we selected six representative cell lines from the panel with either high (HCT-116, KM12, and MDA-MB-435) or low (OVCAR-4, UO-31, and HOP-92) α-tubulin acetylation (Fig. 3, B and B′) to directly determine their response to taxol treatment. In line with our correlation analysis, these experiments showed that cancer cells with high α-tubulin acetylation are more sensitive (IC50 <6 nM) to increasing concentrations of taxol when compared with cancer cells with low α-tubulin acetylation that showed increased taxol resistance (IC50 >24 nM; Fig. 3, C and C′). Altogether, these results reveal high α-tubulin acetylation as a potential predictive biomarker for taxol cytotoxicity in cancer patients.
Figure 3.
High α-tubulin acetylation correlates with taxol cytotoxicity. (A) Correlation between α-tubulin acetylation levels in the NCI-60 cancer cells and taxol activity z scores (Spearman correlation coefficient [r] and P value indicated). (A′) Average (and range) taxol activity z score between cell lines of the two groups high (>60th percentile) and low (<40th percentile) α-tubulin acetylation (Mann–Whitney test). (B and B′) Representative immunoblot and respective quantification (relative to β-tubulin) in the cell lines with high or low α-tubulin acetylation. * indicates unspecific bands from previous probing with different antibodies (C) Graphic representation of cell viability after 120 h of taxol treatment (increasing concentrations; graphic representation of one experiment; lines show nonlinear curve fittings; error bars in each concentration show ± SD of three to four replicates). (C′) Related IC50 of four (HCT-116, KM12) and three (MDA-MB-435) independent experiments (mean ± SD; each dot represents an independent experiment). Source data are available for this figure: SourceData F3.
Figure S4.
α-Tubulin detyrosination, Δ2, TTL, and MCAK levels do not correlate with taxol cytotoxicity, whereas α-tubulin detyrosination and TTL do not correlate with MCAK. (A–F) Correlation between α-tubulin detyrosination, Δ2, and TTL levels in NCI-60 cancer cell lines and taxol activity z scores. Correlation between the levels of MCAK mRNA (z scores; CellMiner database) and α-tubulin detyrosination, TTL protein (our screen), and taxol activity z scores. Spearman correlation coefficient (r) and P values indicated in the graphs.
α-Tubulin acetylation does not account for taxol cytotoxicity
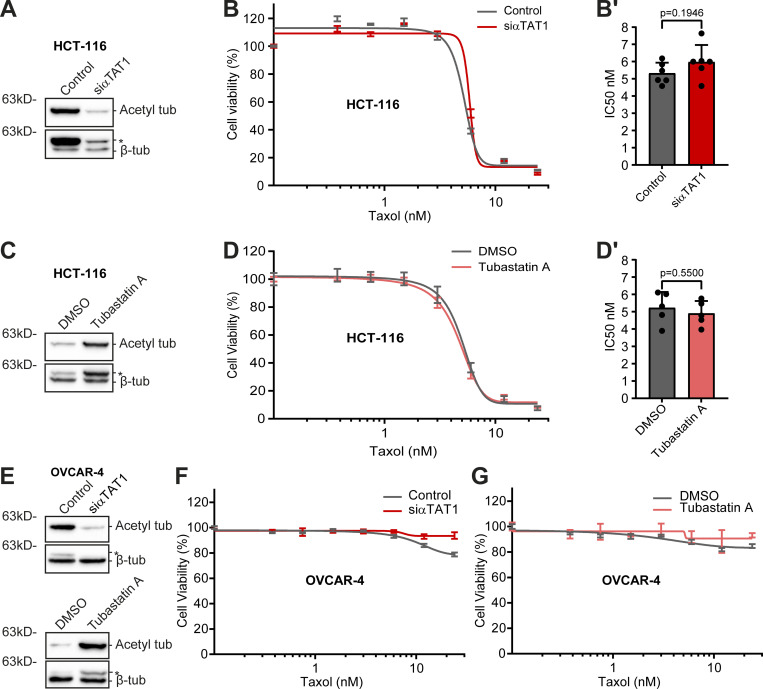
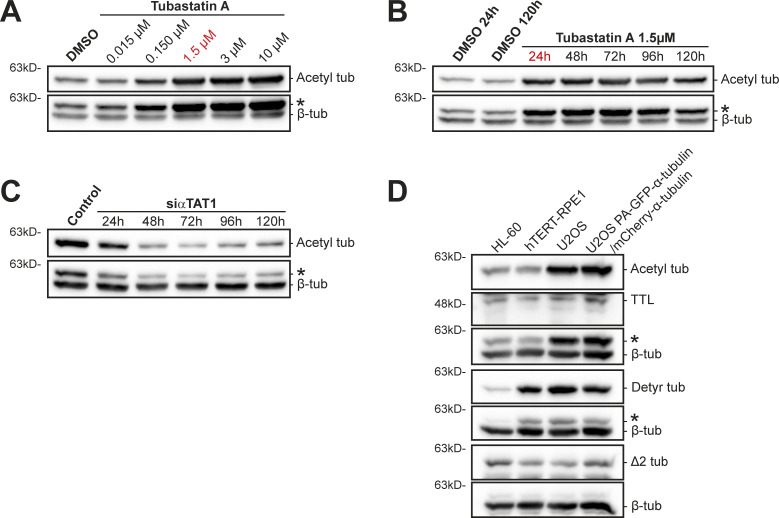
We then investigated the impact of experimentally modulating α-tubulin acetylation in taxol cytotoxicity. For this purpose, we depleted the α-tubulin acetyltransferase αTAT1 (Akella et al., 2010; Shida et al., 2010) by RNAi in HCT-116 cells, which show high α-tubulin acetylation. As expected, αTAT1 depletion led to a substantial decrease in α-tubulin acetylation in this cell line (Fig. 4 A and Fig. S5 C). However, this did not result in any significant difference in taxol cytotoxicity (Fig. 4, B and B′). A similar outcome was found upon pharmacological inhibition of the α-tubulin (and histone) deacetylase HDAC6 with the small molecule inhibitor Tubastatin A, which increases α-tubulin acetylation (Butler et al., 2010; Hubbert et al., 2002; Fig. 4, C, D, and D′; and Fig. S5, A and B). In line with these data, no significant differences were found upon αTAT1 depletion or Tubastatin A treatment in OVCAR-4 cells, which are taxol-resistant and show low α-tubulin acetylation (Fig. 4, E−G). These results suggest that α-tubulin acetylation does not account for taxol cytotoxicity.
Figure 4.
α-Tubulin acetylation does not interfere with taxol cytotoxicity. (A, C, and E) Representative immunoblot analysis of α-tubulin acetylation levels upon αTAT1 depletion (HCT-116: 72 h; siControl as control; OVCAR-4: 96 h; mock as control) and Tubastatin A treatment in HCT-116 and OVCAR-4 cells. β-Tubulin was used as loading control. * indicates unspecific bands from previous probing with different antibodies. (B and D) Graphic representation of cell viability of αTAT1-depleted (siControl as control) and Tubastatin A-treated HCT-116 cells after treatment with taxol for 72 h (increasing concentrations; graphic representation of one experiment; lines show nonlinear curve fittings; error bars in each concentration show ± SD of three to four replicates). (B′ and D′) Respective IC50 of six (siControl and siαTAT1) and five (DMSO and Tubastatin A) independent experiments (mean ± SD; each dot represents an independent experiment; unpaired two-tailed t test). (F and G) Representative graphs of the effect of taxol (increasing concentrations; 72 h) in OVCAR-4 cells upon αTAT1 depletion and Tubastatin A treatment (graphic representation of one experiment [from three total]; lines show nonlinear curve fittings; error bars in each concentration show ± SD of three experimental replicates). Source data are available for this figure: SourceData F4.
Figure S5.
α-Tubulin acetylation levels upon different experimental manipulations and characterization of α-tubulin PTMs in human U2OS cells. (A and B) Immunoblot analysis of α-tubulin acetylation levels in Tubastatin A–treated HCT-116 cells (DMSO as control), with increasing concentrations and over time with 1.5 µM. β-Tubulin was used as loading control. (C) Representative immunoblot to analyze α-tubulin acetylation levels upon αTAT1 depletion in HCT-116 cells, over 120 h. β-Tubulin was used as loading control. (D) Protein lysates of parental U2OS cells, U2OS cells stably expressing PA-GFP-α-tubulin/mCherry-α-tubulin, HL60 cells (internal reference), and hTERT-RPE1 (nontransformed) cells were immunoblotted for α-tubulin detyrosination, Δ2, and acetylation, TTL, and β-tubulin (as loading control). * indicates unspecific bands from previous probing with different antibodies. Source data are available for this figure: SourceData FS5.
α-Tubulin acetylation does not significantly impact MT dynamics
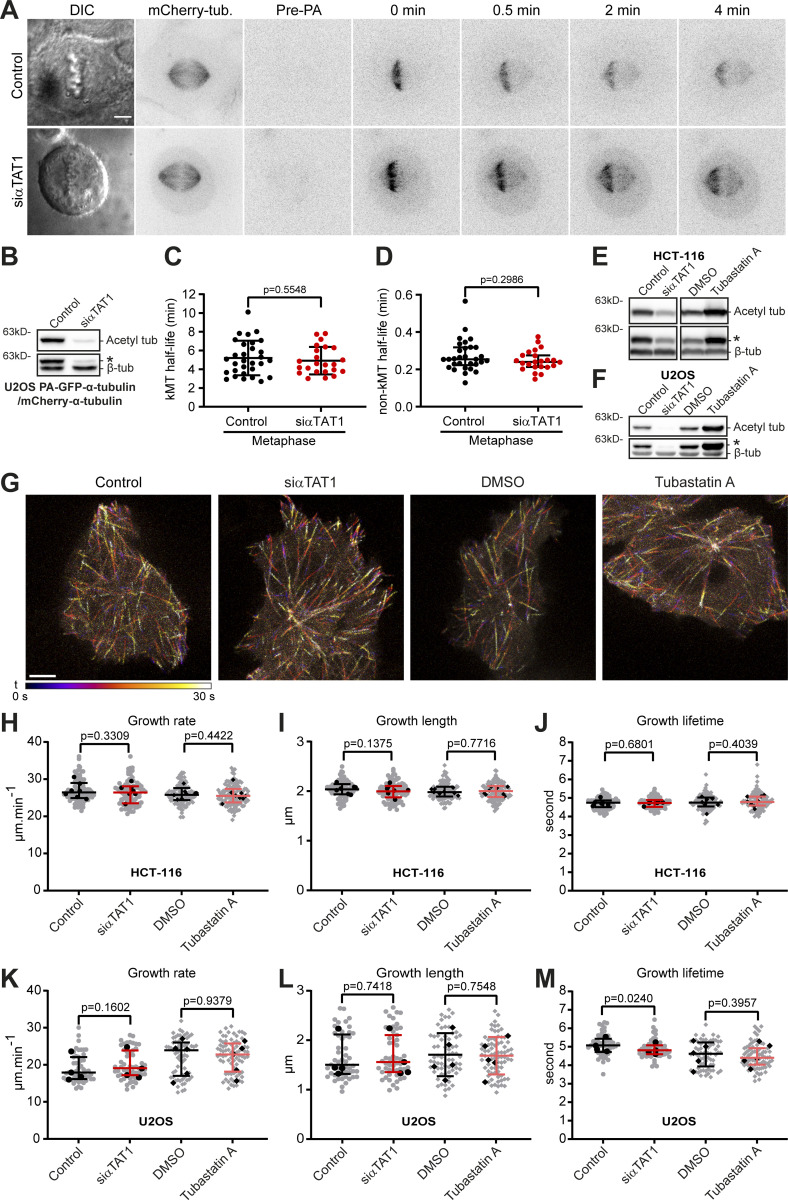
Mitotic spindle MTs are highly acetylated and detyrosinated (Barisic et al., 2015; Gundersen and Bulinski, 1986; Wilson and Forer, 1989), two PTMs that are known to accumulate upon spindle MT stabilization with taxol (Ferreira et al., 2020; Xiao et al., 2006). However, while α-tubulin detyrosination has been shown to have only an indirect impact on MT dynamics (Chen et al., 2021; Ferreira et al., 2020; Webster et al., 1990), it remains unknown whether α-tubulin acetylation plays any role in the regulation of MT dynamics during mitosis and, more generally, throughout interphase. To directly address this, we used fluorescence dissipation after photoactivation in human U2OS cells, which show high α-tubulin acetylation (and detyrosination) levels (Fig. S5 D) and conveniently express PA-GFP-α-tubulin and mCherry-α-tubulin, to measure kinetochore and non-kinetochore MT (kMT and non-kMT, respectively) turnover on metaphase spindles (Conway et al., 2022; Ferreira et al., 2018; Girao and Maiato, 2020) upon downregulation of α-tubulin acetylation (Fig. 5, A and B). We found that siRNA-mediated αTAT1 depletion did not significantly change kMT or non-kMT half-life relative to controls, indicating that α-tubulin acetylation of spindle MTs does not impact MT turnover and stability during mitosis (Fig. 5, C and D). Next, we investigated whether down- or upregulation of α-tubulin acetylation impacts MT dynamics during interphase by tracking MT polymerization events using EB3-GFP in HCT-116 and U2OS cells upon αTAT1 siRNA-mediated depletion or Tubastatin A treatment (Fig. 5, E−G). Quantification of EB3-GFP comet growth rate, growth length, and growth duration revealed no significant differences between cells with down- or upregulated α-tubulin acetylation and respective controls, except for a very small decrease in growth duration upon αTAT1 depletion in U2OS cells (Fig. 5, H−M). Based on these results, we conclude that α-tubulin acetylation does not significantly impact MT dynamics during mitosis and interphase, thereby explaining why taxol cytotoxicity appears to be independent of α-tubulin acetylation.
Figure 5.
α-Tubulin acetylation does not affect MT dynamics. (A) Representative examples of control (mock) and αTAT1-depleted (72 h RNAi) U2OS PA-GFP-α-tubulin/mCherry-α-tubulin cells before (Pre-PA) and after photoactivation (GFP-tubulin signal from 0–4 min). mCherry-α-tubulin and DIC images display the metaphase stage of the cells. Scale bar, 5 µm. (B) Representative immunoblot to validate αTAT1 depletion (against α-tubulin acetylation). * indicates unspecific bands from previous probing with different antibodies. (C and D) Quantification of kMT and non-kMT half-life for each condition (mean ± SD [kMT] or median with interquartile range [non-kMT]; each dot represents an individual cell; control: pool of nine independent experiments, n = 30 cells; siαTAT1: pool of seven independent experiments, n = 23 cells; unpaired two-tailed t test [kMT] or Mann–Whitney test [non-kMT]). (E and F) Representative immunoblot analysis (against α-tubulin acetylation) of parental HCT-116 and U2OS cells upon αTAT1 depletion (72 h; siControl as control), DMSO, and Tubastatin A treatment, and transiently expression of EB3-GFP. β-Tubulin was used as loading control. * indicates unspecific bands from previous probing with different antibodies. (G) Representative images of siControl and αTAT1-depleted, DMSO and Tubastatin A–treated HCT-116 cells, transiently expressing EB3-GFP. The 30-s time windows show labeled EB3 over time, represented by different colors, generated by the temporal color code tool in ImageJ software. Scale bar, 5 µm. (H−M) Quantification of MT dynamic parameters from the plus end–tracking analysis in HCT-116 and U2OS cells (mean ± SD; HCT-116: growth rate [Tubastatin A], growth length [siαTAT1 and Tubastatin A], growth lifetime [siαTAT1]; U2OS: growth length [Tubastatin A]) or median with interquartile range (HCT-116: growth rate [siαTAT1], growth lifetime [Tubastatin A]; U2OS: growth rate, growth lifetime [siαTAT1 and Tubastatin A], growth length [siαTAT1]); each gray dot represents a field of view containing one to four cells and black dot an independent experiment; HCT-116 cells, control: n = 82 cells; siαTAT1: n = 81 cells; pool of seven independent experiments; DMSO: n = 99 cells; Tubastatin A: n = 103 cells; pool of eight independent experiments; U2OS cells, control: n = 49 cells; siαTAT1: n = 51 cells; pool of four independent experiments; DMSO: n = 64 cells; Tubastatin A: n = 75 cells; pool of five independent experiments; unpaired two-tailed t test or Mann–Whitney were used for statistical analysis (see Materials and methods for details). Source data are available for this figure: SourceData F5
α-Tubulin detyrosination enhances taxol cytotoxicity but is unable to revert resistance in cancer cells
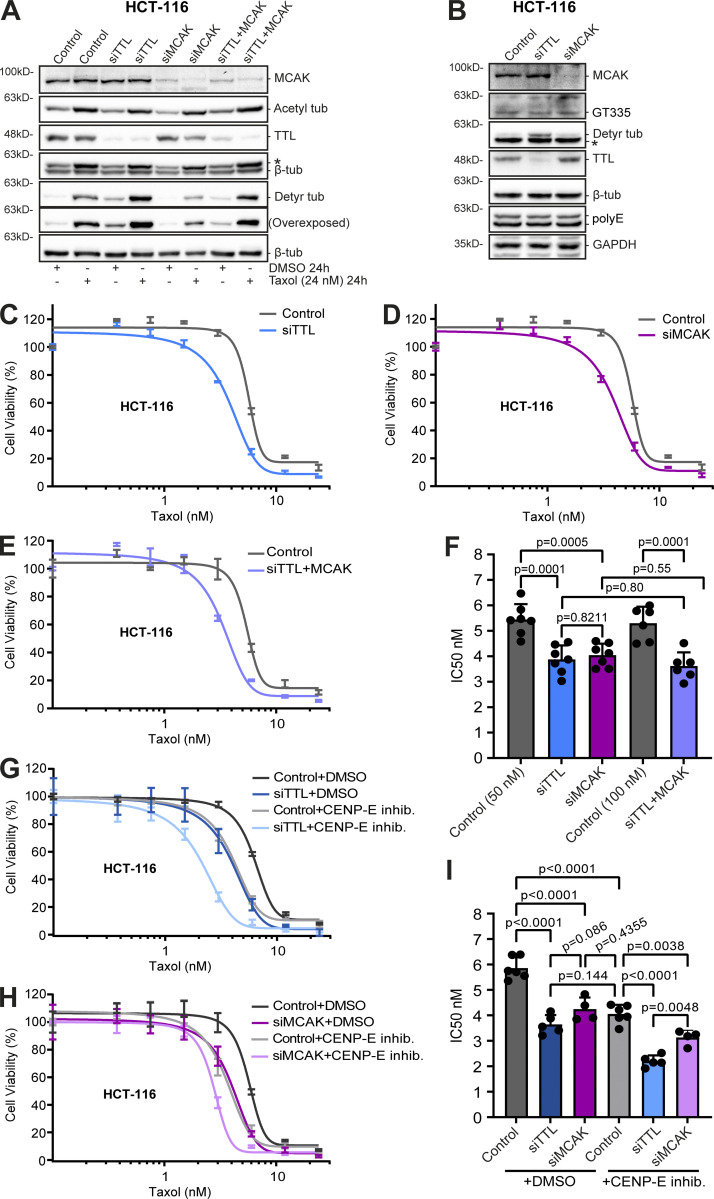
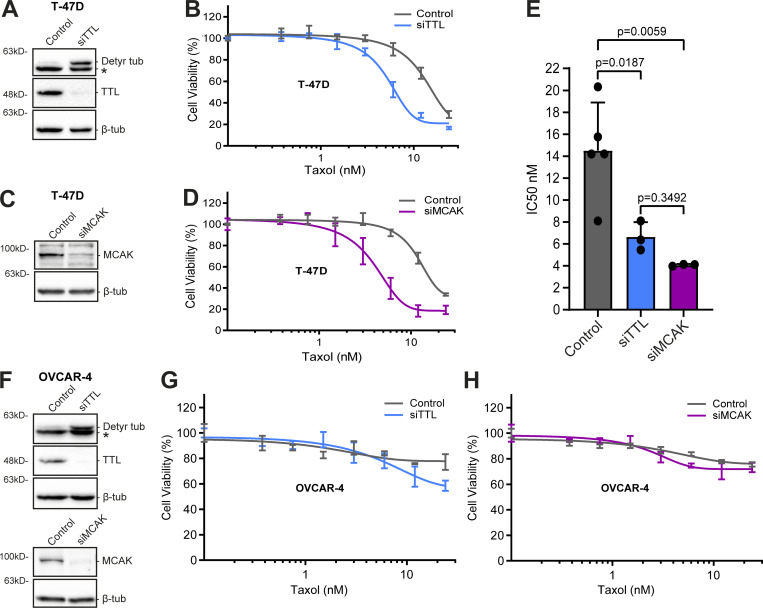
Next, we investigated whether α-tubulin detyrosination contributes to taxol cytotoxicity. In agreement with previous reports, the combined action of taxol and siRNA-mediated knockdown of TTL resulted in a marked increase in α-tubulin detyrosination relative to taxol treatment alone (Fonrose et al., 2007; Nieuwenhuis et al., 2017; Webster et al., 1990; Whipple et al., 2013). This combined effect appears to be specific to α-tubulin detyrosination since α-tubulin acetylation and polyglutamylation levels did not change after TTL depletion (Fig. 6, A and B). Strikingly, TTL knockdown in two distinct taxol-sensitive cancer cell lines (HCT-116 and T-47D) enhanced taxol cytotoxicity, as shown by a significant decrease in the IC50 (Fig. 6, C and F; and Fig. 7, A, B, and E). However, no difference in taxol cytotoxicity was found after TTL knockdown in the taxol-resistant cell line OVCAR-4 (Fig. 7, F and G). Thus, experimental increase in α-tubulin detyrosination enhances taxol cytotoxicity in taxol-sensitive cancer cell lines but does not necessarily revert taxol-resistance.
Figure 6.
MT detyrosination promotes taxol cytotoxicity mainly by regulating MCAK activity. (A) Protein lysates of HCT-116 cells obtained after 72 h of RNAi (siControl, TTL, MCAK, and TTL/MCAK) and 24 h of DMSO or taxol treatment (24 nM), then immunoblotted for α-tubulin detyrosination and acetylation, MCAK, TTL, and β-tubulin (as loading control). (B) Immunoblot analysis of branched α/β-tubulin polyglutamylation chains (GT335), long α/β-tubulin polyglutamylation chains (polyE), α-tubulin detyrosination, MCAK, TTL, and β-tubulin (as loading control) in TTL and MCAK-depleted HCT-116 cells (72 h RNAi). * indicates unspecific bands from previous probing with different antibodies. (C−E) Representative graphs of the effect of taxol (increasing concentrations; 72 h) upon RNAi-mediated knockdown (72 h) of TTL, MCAK, and the combination of TTL/MCAK in HCT-116 cells (graphic representation of one experiment; lines show nonlinear curve fittings; error bars in each concentration show ± SD of three replicates). (G and H) Graphic representations of cell viability of TTL and MCAK-depleted HCT-116 cells after treatment with GSK923295 (CENP-E inhibitor) and taxol (increasing concentrations) for 72 h (graphic representation of one experiment; lines show nonlinear curve fittings; error bars in each concentration show ± SD of three experimental replicates). (F and I) IC50 calculations of seven (siControl 50 nM, siTTL, and siMCAK) and six (siControl 100 nM and siTTL/MCAK) independent experiments; six (siControl), five (siTTL), and four (siMCAK) independent experiments in GSK923295 treatments (mean ± SD; each dot represents an independent experiment; one-way ANOVA). Source data are available for this figure: SourceData F6.
Figure 7.
Increased α-tubulin detyrosination or MCAK depletion enhances taxol cytotoxicity in T-47D cells but does not revert taxol-resistance in OVCAR-4 cells. (A and C) Representative immunoblot analysis of TTL, α-tubulin detyrosination, and MCAK levels (β-tubulin as loading control) upon TTL or MCAK depletion (96 h; mock as control) in T-47D cells. * indicates unspecific bands from previous probing with different antibodies. (B and D) Graphic representations of cell viability of TTL and MCAK-depleted (mock as control) T-47D cells after treatment with taxol for 72 h (increasing concentrations; representation of one experiment; lines show nonlinear curve fittings; error bars in each concentration show ± SD of three replicates). (E) Respective IC50 of five (siControl) and three (siTTL and siMCAK) independent experiments (mean ± SD; each dot represents an independent experiment; one-way ANOVA). (F) Protein lysates of OVCAR-4 cells upon TTL and MCAK depletion (96 h; mock as control), immunoblotted for α-tubulin detyrosination, TTL, MCAK, and β-tubulin (as loading control). * indicates unspecific bands from previous probing with different antibodies. (G and H) Representative graphs of the effect of taxol (increasing concentrations; 72 h) in OVCAR-4 cells upon these conditions (graphic representation of one experiment [from two to three total]; lines show nonlinear curve fittings; error bars in each concentration show ± SD of three replicates). Source data are available for this figure: SourceData F7.
A link between α-tubulin detyrosination and the suppression of MCAK MT-depolymerizing activity in taxol cytotoxicity
In contrast with α-tubulin acetylation, α-tubulin detyrosination indirectly impacts MT dynamics by inhibiting the activity of MT-depolymerizing enzymes of the kinesin-13 family, such as MCAK (Ferreira et al., 2020; Peris et al., 2009; Sirajuddin et al., 2014). MCAK has also been proposed to mediate taxol resistance (Ganguly et al., 2011a; Ganguly et al., 2011b). To investigate whether α-tubulin detyrosination enhances taxol cytotoxicity through inhibition of MCAK activity, we compared the effects of individual TTL or MCAK depletion in taxol-sensitive or -resistant cancer cells. We found that, as for TTL depletion, MCAK depletion did not alter α-tubulin acetylation and polyglutamylation levels and rendered HCT-116 and T-47D cells more sensitive to taxol, with an equivalent increase in taxol cytotoxicity relative to TTL depletion (Fig. 6, A, B, D, and F; and Fig. 7, C−E). In line with our previous observations after TTL depletion, no significant effect was found after MCAK depletion in taxol-resistant OVCAR-4 cells (Fig. 7, F and H). Remarkably, codepletion of TTL and MCAK did not show a cumulative effect relative to individual TTL or MCAK depletion in HCT-116 cells (Fig. 6, E and F). In contrast, treatment of TTL- or MCAK-depleted HCT-116 cells with GSK923295, a small-molecule inhibitor of centromere protein E (CENP-E) that is known to sensitize cells to taxol by increasing chromosomal instability (Scribano et al., 2021), resulted in enhanced cytotoxicity (Fig. 6, G−I), implying nonoverlapping mechanisms. Since α-tubulin detyrosination, TTL expression, and taxol cytotoxicity did not correlate with MCAK expression (Fig. S4, D−F), these results suggest that α-tubulin detyrosination enhances taxol cytotoxicity mainly by suppressing the activity of the MT-depolymerizing enzyme MCAK.
Increased α-tubulin detyrosination, but not MCAK depletion, aggravates taxol-induced mitotic spindle multipolarity
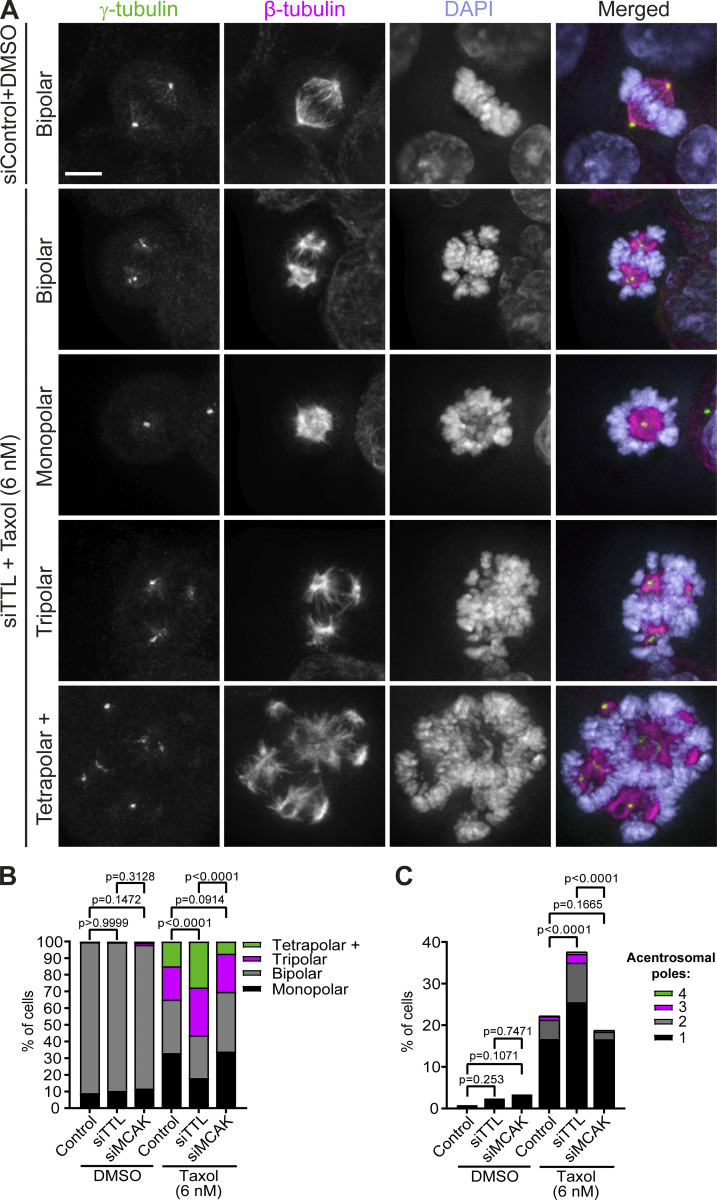
To understand how increased α-tubulin detyrosination may impact MCAK activity to enhance taxol cytotoxicity, we investigated mitotic spindle architecture and/or function by fluorescence microscopy in fixed taxol-sensitive HCT-116 cells (Fig. 8 A). While the capacity to assemble a bipolar spindle was indistinguishable between control, TTL-, and MCAK-depleted cells treated with DMSO (Fig. 8 B), addition of taxol to a concentration proximal to the IC50 for HCT-116 cells significantly increased the frequency of mitotic cells with multipolar spindles, an outcome that was further exacerbated upon TTL, but not MCAK, depletion (Fig. 8 B). This increase in multipolar spindles upon TTL depletion is likely due to a synergistic effect between increased α-tubulin detyrosination and taxol treatment that also aggravated the formation of acentrosomal spindle poles due to spindle pole fragmentation (Bian et al., 2010; Paoletti et al., 1997; Sakaushi et al., 2007; Zasadil et al., 2014; Zhu et al., 2005; Fig. 8 C). While we do not dispute that high tubulin detyrosination might affect other targets involved in bipolar spindle assembly, these results suggest that the enhanced cytotoxic effects caused by impairing MCAK activity appear not to be a consequence of defective spindles per se.
Figure 8.
Increased α-tubulin detyrosination, but not MCAK depletion, aggravates taxol-induced mitotic spindle multipolarity. (A) Representative immunofluorescence images of examples of mitotic spindles of siControl HCT-116 cells upon DMSO treatment or TTL-depleted HCT-116 cells upon taxol treatment (6 nM) for 24 h. Cells were stained for γ-tubulin, β-tubulin, and DNA (DAPI). Scale bar, 5 µm. (B) Distribution of spindle pole number (siControl-DMSO: pool of five independent experiments, n = 255 cells; siTTL-DMSO: pool of four independent experiments, n = 210 cells; siMCAK-DMSO: pool of three independent experiments, n = 151 cells; siControl-taxol: pool of six independent experiments, n = 696 cells; siTTL-taxol: pool of five independent experiments, n = 523 cells; siMCAK-taxol: pool of three independent experiments, n = 493 cells). Statistical analysis performed on the proportion of mitotic cells with multipolar spindles (Fisher’s exact two-tailed test). (C) Quantification of mitotic cells with acentrosomal poles (siControl-DMSO: pool of five independent experiments, n = 252 cells; siTTL-DMSO: pool of four independent experiments, n = 209 cells; siMCAK-DMSO: pool of three independent experiments, n = 149 cells; siControl-taxol: pool of 6 independent experiments, n = 689 cells; siTTL-taxol: pool of five independent experiments, n = 516 cells; siMCAK-taxol: pool of three independent experiments, n = 491 cells). Statistical analysis performed on the proportion of mitotic cells with acentrosomal poles (Fisher’s exact two-tailed test).
Increased α-tubulin detyrosination or MCAK depletion promotes taxol-induced cell death in mitosis and the subsequent interphase without markedly increasing multipolar divisions
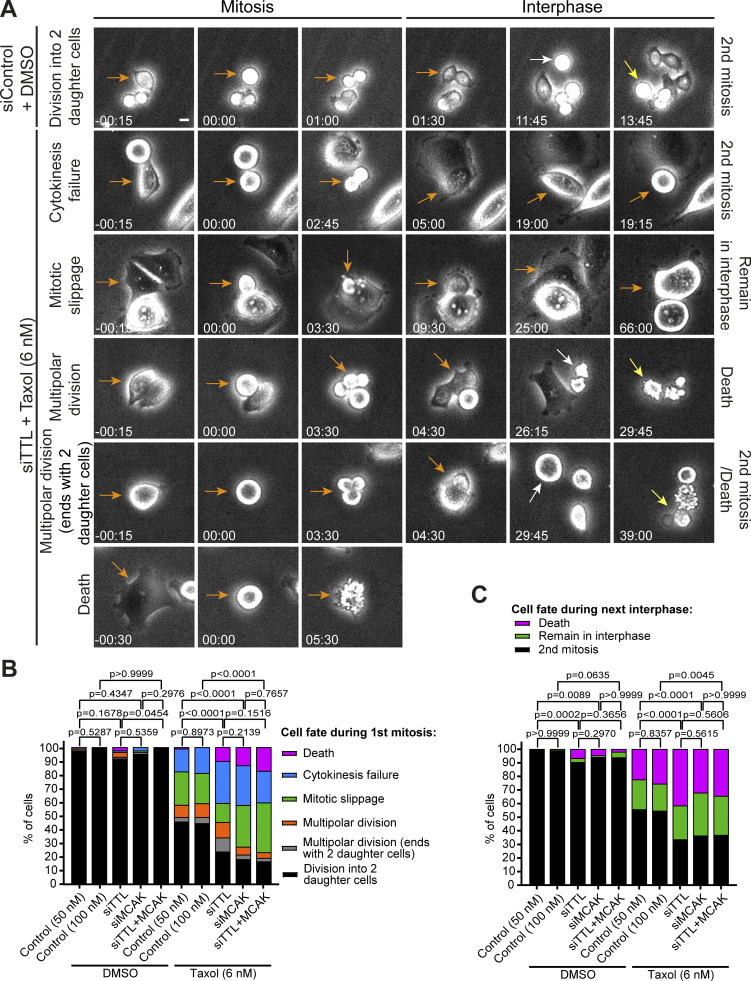
To determine whether the spindle multipolarity observed after taxol treatment in cells with increased α-tubulin detyrosination underlie the enhanced cytotoxicity, we determined the respective cell fate using live-cell phase-contrast microscopy (Fig. 9 A). When compared with control HCT-116 cells treated with taxol only, TTL depletion aggravated the frequency of cell death in mitosis and the subsequent interphase, as well as cytokinesis failure, without markedly increasing multipolar divisions (Fig. 9, B and C). Remarkably, this outcome was largely indistinguishable from that observed upon taxol treatment in MCAK-depleted cells, and no cumulative effect was observed upon codepletion of TTL and MCAK (Fig. 9, B and C). Altogether, these results suggest that, despite aggravating taxol-induced spindle multipolarity, α-tubulin detyrosination enhances taxol cytotoxicity by suppressing MCAK MT depolymerizing activity, without necessarily undergoing multipolar cell divisions.
Figure 9.
High α-tubulin detyrosination or MCAK depletion promotes taxol-induced cell death in mitosis and in the subsequent interphase. (A) Phase-contrast live-cell images representative of fates in HCT-116 cells control and TTL RNAi (72 h), treated with DMSO or taxol (6 nM), respectively. Scale bar, 10 µm. (B) Distribution of cell fate of HCT-116 cells (RNAi + DMSO or 6 nM of taxol) during the first mitosis (pool of two independent experiments: siControl 50nM-DMSO, n = 84 cells; siTTL-DMSO, n = 84 cells; siMCAK-DMSO, n = 80 cells; siControl 100nM-DMSO, n = 50 cells; siTTL/MCAK-DMSO, n = 50 cells; pool of three independent experiments: siControl 50nM-taxol, n = 180 cells; siTTL-taxol, n = 186 cells; siMCAK-taxol, n = 210 cells; siControl 100nM-taxol, n = 90 cells, siTTL/MCAK-taxol, n = 121 cells). Statistical analysis performed on the proportion of division into two daughter cells (Fisher’s exact two-tailed test). (C) Distribution of cell fates in the following interphase (pool of two independent experiments: siControl-DMSO, n = 159 cells; siTTL-DMSO, n = 165 cells; siMCAK-DMSO, n = 151 cells; siControl 100nM-DMSO, n = 99 cells; siTTL/MCAK-DMSO, n = 97 cells; pool of three independent experiments: siControl-taxol, n = 273 cells; siTTL-taxol, n = 241 cells; siMCAK-taxol, n = 228 cells; siControl 100nM-taxol, n = 141 cells, siTTL/MCAK-taxol, n = 122 cells). Statistical analysis performed on the proportion of cells that underwent a second mitosis (Fisher’s exact two-tailed test). Data obtained by 72 h of live-cell imaging in a phase-contrast microscope.
Discussion
Several independent works have reported an emerging link between alterations of tubulin PTMs and/or associated modifying enzymes with certain cancers (reviewed in Lopes and Maiato, 2020). These alterations often correlate with specific cancer properties, including poor patient outcome/prognosis (Boggs et al., 2015; Kato et al., 2004; Mialhe et al., 2001), tumor growth (Lafanechere et al., 1998), and metastatic ability (Boggs et al., 2015; Whipple et al., 2010), supporting the potential use of cancer tubulin PTM signatures as reliable biomarkers, as well as their manipulation for therapeutic purposes. However, those initial studies were often contradictory and limited to a handful and poorly characterized cancer cell lines (Lopes and Maiato, 2020). Moreover, clear functional and causal links between tubulin PTMs and specific cancer cell properties remain to be established, with most studies so far assuming a clear observational and correlational character. Here, we overcame these limitations by providing a pilot analysis and initial functional dissection of selected tubulin PTMs in the NCI-60 cancer cell panel. Our findings provide systematic evidence for high variability of selected tubulin PTMs among more than 50 different cancer cell lines from nine different tissues, including within the same tissue. Most surprisingly, we detected a clear uncoupling between α-tubulin acetylation, detyrosination, and related ∆2 modification in specific cancer cells, further indicating that different tubulin PTMs independently control specific MT functions. Several factors appear to contribute to these outcomes, including the underlying properties of the different cancers (e.g., epithelial vs. mesenchymal; Whipple et al., 2010), the relative expression of tubulin modifying enzymes, and, especially, MT half-life/stability in each cancer cell line.
Of notice, α-tubulin acetylation had no marked effect on MT half-life and dynamic behavior, both during mitosis and in interphase, with only a marginal role in MT growth lifetime in one of the tested cell lines. This is consistent with previous findings indicating that α-tubulin acetylation does not affect the assembly and disassembly of MTs in vitro (Maruta et al., 1986), and in line with recently proposed roles in MT mechanical stability and breakage resistance (Portran et al., 2017; Xu et al., 2017). Interestingly, high α-tubulin acetylation was associated with but not required for taxol-induced cytotoxicity in cancer cells. This conclusion is at odds with recent reports in lung cancer cells that suggested that high α-tubulin acetylation correlates with taxol resistance and attenuates taxol-induced apoptosis (Wattanathamsan et al., 2021). Another study reported a synergistic effect between histone deacetylase (HDAC) inhibitors (which increase α-tubulin acetylation) and taxol that promoted apoptosis in endometrial cancer cells and led to MT stabilization (Dowdy et al., 2006). In agreement, inhibition of anticancer taxol activity by caffeine was also proposed to occur through downregulation of α-tubulin acetylation (Xu et al., 2020), but additional effects caused by caffeine cannot be excluded. One possibility is that a potential synergistic effect between high α-tubulin acetylation and taxol response depends on the p53 status of each cancer cell line (Zuco et al., 2011), which might change during acquired taxol resistance. However, among the six cell lines that we investigated with either high or low α-tubulin acetylation, their respective p53 status varied from WT to inconclusive or mutated (Berglind et al., 2008), regardless of their ability to respond to taxol. Interestingly, new-generation HDAC6 inhibitors also enhanced the activity of taxol and suppressed solid tumor growth in mouse xenograft models (Huang et al., 2017). But whether this effect was specifically due to inhibition of α-tubulin deacetylation (and corresponding increase in acetylation) remains unclear, despite higher selectivity relative to histone H3 deacetylation. Lastly, it remains possible that high α-tubulin acetylation potentiates taxol activity independently of cell proliferation/apoptosis, for example, by inhibiting cell motility and invasion (Bonezzi et al., 2012). Altogether, regardless of any potential role of α-tubulin acetylation in taxol cytotoxicity on particular cancer types, our findings support that α-tubulin acetylation represents a potential prognostic biomarker for taxol response.
While in our hands, α-tubulin acetylation did not account for MT stability or taxol response in the tested cell lines, α-tubulin detyrosination revealed itself as an important determinant of taxol-induced cytotoxicity. Clinically relevant concentrations of taxol induced the formation of irreversible multipolar spindles that are thought to contribute to massive chromosome missegregation and cell death (Rodrigues-Ferreira et al., 2019; Zasadil et al., 2014). In agreement, here we found that experimental increase in α-tubulin detyrosination after TTL depletion aggravates taxol-induced mitotic spindle multipolarity while promoting cell death in mitosis and the subsequent interphase. However, this did not lead to a proportional increase in multipolar divisions relative to taxol treatment alone. Mechanistically, high levels of detyrosinated α-tubulin phenocopied the depletion of the MT-depolymerizing kinesin-13 MCAK in taxol-treated cells, while codepletion of TTL and MCAK did not result in a cumulative cytotoxic effect. Since the MT depolymerizing activity of MCAK is inhibited by α-tubulin detyrosination (Peris et al., 2009; Sirajuddin et al., 2014), the most straightforward interpretation of our findings is that high α-tubulin detyrosination promotes taxol cytotoxicity mainly by inhibiting MCAK activity. Indeed, previous works have uncovered a role for MCAK in taxol resistance (Ganguly et al., 2011a; Ganguly et al., 2011b), and MCAK knockdown was found to act synergistically with taxol by aggravating taxol-induced spindle defects (Hedrick et al., 2008). Interestingly, high α-tubulin detyrosination promoted the formation of multipolar spindles with acentrosomal poles that typically form due to spindle pole fragmentation after taxol treatment and would irreversibly result in multipolar mitosis (Bian et al., 2010; Maiato and Logarinho, 2014; Paoletti et al., 1997; Sakaushi et al., 2007; Zasadil et al., 2014; Zhu et al., 2005). However, since MCAK depletion did not significantly aggravate spindle multipolarity in cells treated with clinically relevant doses of taxol, the enhanced cytotoxicity observed upon the experimental increase in α-tubulin detyrosination is likely due tochromosome missegregation events caused by overly stable MTs, regardless of spindle multipolarity. This is supported by a large body of evidence implicating MCAK in mitotic error correction and the inhibition of this mechanism by α-tubulin detyrosination (Andrews et al., 2004; Bakhoum et al., 2009; Ferreira et al., 2020; Kline-Smith et al., 2004; Lan et al., 2004; Wordeman et al., 2007). Moreover, this interpretation is consistent with recent findings indicating that the extent of spindle multipolarity does not predict patient response to taxol, whereas preexisting or experimental induction of chromosomal instability independently of spindle multipolarity was sufficient to increase taxol efficacy and patient response (Scribano et al., 2021). Curiously, while high α-tubulin detyrosination after TTL knockdown promoted cytotoxicity in taxol-sensitive (colon and breast), but not taxol-resistant (ovary), cancer cells, knockout of the tubulin carboxypeptidase VASH2, which attenuates α-tubulin detyrosination, increased taxol cytotoxicity in other ovarian cancer cells (Koyanagi et al., 2021). While the underlying causes for the distinct response to taxol remain unclear, clonal selection after VASH2 knockout or relevant differences in MCAK or TTL expression/activities cannot be discarded. Additionally, the cooperation between different tubulin PTMs might also account for distinct taxol cytotoxicity on particular cancer types. For instance, in taxol-resistant breast cancer cell models, TTL knockdown was shown to decrease MT polyglutamylation, thereby compromising MCAK and CLIP-170 recruitment to MTs through a functional interplay with Septin proteins (Froidevaux-Klipfel et al., 2015). However, in this model, MCAK depletion alone had no effect on taxol cytotoxicity, whereas, in our hands, TTL or MCAK knockdown did not interfere with MT polyglutamylation, nor overcame taxol resistance (this study, but see also Barisic et al., 2015). Together with the broad characterization of tubulin PTMs in the NCI-60 panel provided in the present study, the availability and continuous improvement of MCAK and TTL inhibitors (Dal Piaz et al., 2009; Talje et al., 2014) might prove useful in clarifying how different cancers respond to combinatorial therapies with taxol and its derivatives to improve cytotoxicity while reducing side effects. Most relevant, the present work clearly identifies α-tubulin detyrosination and perturbation of MCAK activity as causal determinants of taxol cytotoxicity. When combined with the predictive value of high α-tubulin acetylation levels for therapeutic response to taxol, tubulin PTMs might represent important targets toward more personalized treatment of certain human cancers.
Materials and methods
Cell lines
The 53 cancer cell lines of the NCI-60 panel used in this study were authenticated by genotyping and grown in their corresponding medium (Table S1) at 37°C with 5% CO2 (exception of SW-620, grown without CO2 due to the Leibovitz’s L-15 Medium). COLO205, HCT-116, DLD-1, HCT-15, and HL-60 cells were obtained from Ipatimup’s Cell Lines Bank (University of Porto, Porto, Portugal). All the other NCI-60 cell lines were kindly provided by Mónica Bettencourt-Dias (Instituto Gulbenkian de Ciência, Oeiras, Portugal; Marteil et al., 2018). Parental HeLa (kindly provided by Y. Mimori-Kiyosue, RIKEN Center for Biosystems Dynamics Research, Kobe, Japan), hTERT RPE-1 (ATCC, CRL-4000), U2OS (kindly provided by S. Geley, Innsbruck Medical University, Innsbruck, Austria), and PA-GFPα-tubulin/mCherry-α-tubulin U2OS (kindly provided by R. Medema, Netherlands Cancer Institute, Amsterdam, Netherlands) were grown at 37°C with 5% CO2 in DMEM (Gibco, Thermo Fisher Scientific) supplemented with 10% FBS (Gibco, Thermo Fisher Scientific).
Western blotting
Cells were trypsinized and pelleted by centrifugation at 1,200 rpm for 5 min (to rule out variability introduced by different cell densities among the NCI-60 panel, pellets from adherent cells were collected from cultures at equivalent near-confluence states, ∼90%). Pellets were washed with PBS, resuspended in cold lysis buffer (50 mM Tris HCl, pH 7.4, 150 mM NaCl, 1 mM EDTA, 1 mM EGTA, 0.5% NP40, and 0.5% Triton X-100), and supplemented (freshly added) with protease inhibitors. After 30 min on ice, protein samples were snap-frozen in liquid nitrogen and centrifuged at 14,000 rpm for 8 min at 4°C. Then, supernatants were collected and the protein concentration determined by Bradford assay. 50 µg of total protein per sample were denatured in Laemmli sample buffer at 95°C for 5 min, separated by 12% (vol/vol) SDS-PAGE gel electrophoresis and transferred to a nitrocellulose membrane using an iBlot Gel Transfer System (Invitrogen, Thermo Fisher Scientific) or Trans-Blot Turbo Transfer System (Bio-Rad). Membranes were blocked with TBST (TBS with 0.05% Tween 20) containing 5% nonfat dry milk for 1.5 h at RT. The following primary antibodies (diluted in TBST with 1% nonfat dry milk) were used to incubate membranes overnight at 4°C: rabbit anti-detyrosinated α-tubulin (Polyclonal; ab48389; 1:2,000; Abcam; the antibody used in the NCI-60 screen), rabbit anti-detyrosinated α-tubulin (1:10,000; Liao et al., 2019), rabbit anti-TTL (Polyclonal; 13618-1-AP; 1:5,000; Proteintech), mouse anti-acetylated α-tubulin (acetyl K40; Monoclonal; [6-11B-1]; ab24610; 1:1,000; Abcam), rabbit anti-Δ2 α-tubulin (Polyclonal; AB3203; 1:1,000; Merck Millipore), mouse anti-β-tubulin (Monoclonal; clone TUB 2.1, T 5201; 1:1,000; Sigma-Aldrich), mouse anti-Cyclin B1 (V152; Monoclonal; 4135; 1:500; Cell Signaling Technology), mouse anti-GAPDH (Monoclonal; 60004-1-Ig; 1:40,000; Proteintech), rabbit anti-MCAK (Polyclonal; ab71706; 1:500; Abcam), mouse anti-glutamylation tubulin (GT335; Monoclonal; AG-20B-0020-C100; 1:500; AdipoGen), and rabbit anti-polyglutamylation (polyE; Polyclonal; AG-25B-0030-C050; IN105; 1:1,000; AdipoGen). After TBST washes (3× for 10 min), membranes were incubated with HRP-conjugated secondary antibodies (1:5,000; Jackson ImmunoResearch; diluted in TBST with 1% nonfat dry milk) for 1 h at RT. Signal was detected with Clarity Western ECL Substrate in a ChemiDoc XRS+ System (Bio-Rad). Quantification of protein levels was performed in Image Lab software.
Double thymidine cell synchronization
To synchronize at G1/S phase, HeLa cells were grown in DMEM supplemented with 10% FBS (T25 flasks) until ∼30% confluence. Freshly prepared thymidine (T1895; Sigma-Aldrich; in PBS) was added to a final concentration of 2 mM. After 24 h blocking, cells were washed 3× with prewarmed PBS and incubated with fresh medium for a 10-h release. Then, thymidine was added (final concentration of 2 mM) for another 24 h. For the final release, cells were washed 3× with prewarmed PBS, incubated with fresh medium, and collected at different time points (0, 3, 7, 9, 13, and 16 h) for Western blot analysis. An asynchronous culture, without thymidine treatment, was used as a control.
CellMiner data
Average transcript intensity z scores of NCI-60 cell lines were obtained from the CellMiner database versions 2.6, 2.7, and 2.8.1 (https://discover.nci.nih.gov/cellminer/) using the analysis tool “Gene transcript level z score.” Additionally, taxol (NSC 125973) average activity z scores were obtained from the CellMiner database version 2.6 using the analysis tool “Drug activity level z score.”
Constructs and transfections
For siRNA experiments, cells were seeded in 6-well plates or onto 22 × 22 mm no. 1.5 glass coverslips in complete growth medium. The following day, the cells were starved with 1.5 ml of serum-free Opti-MEM (Gibco, Thermo Fisher Scientific) for 1 h before siRNA transfection. During this period, 3 µl Lipofectamine RNAiMax (Invitrogen, Thermo Fisher Scientific) diluted in 250 µl Opti-MEM was mixed with 50 nM of siRNA oligonucleotides diluted in 250 µl Opti-MEM and incubated for 45 min. Then, transfection mix was added dropwise to the cells and incubated for 7 h before replacement with complete growth medium. The following previously validated siRNA oligonucleotides were used: αTAT1 5′-AACCGCCAUGUUGUUUAUAUU-3′ (Barisic et al., 2015; Shida et al., 2010), TTL 5′-GUGCACGUGAUCCAGAAAU-3′ (Barisic et al., 2015; Ferreira et al., 2020), and MCAK 5′-GAUCCAACGCAGUAAUGGU-3′ (Ferreira et al., 2020; Steblyanko et al., 2020). As control for the siRNA experiments, MISSION siRNA Universal Negative Control #1 (SIC001;Sigma-Aldrich) was used in all the HCT-116 cells experiments and scrambled siRNA 5′-CUUCCUCUCUUUCUCUCCCUUGUGA-3′ in the EB3-tracking experiments in U2OS cells. In addition, mock transfection was used as control in the photoactivation experiments in U2OS cells and the taxol cytotoxicity experiments in OVCAR-4 and T47-D cells. For the EB3-GFP transient transfection experiments, the same protocol of siRNA was used. However, the transfection mix contained 5 µl Lipofectamine 2000 (Invitrogen, Thermo Fisher Scientific) and 0.5 µg EB3-GFP construct (Ferreira et al., 2013), each diluted in 250 µl Opti-MEM.
Drug treatments
For the taxol cytotoxicity experiments in Fig. 3, C and C′, taxol (T7191; Sigma-Aldrich) was serially diluted (24; 12; 6; 3; 1.5; 0.75; 0.375 nM), and the different concentrations added for 120 h. The same concentrations of taxol were added in all other cytotoxicity experiments for 72 h. Pharmacological inhibition of HDAC6 and increasing α-tubulin acetylation was obtained using 1.5 µM of Tubastatin A (S8049; Selleck Chemicals) for 24 h. 20 nM of GSK923295 (CENP-E inhibitor; S7090; Selleck Chemicals) was added along with taxol in Fig. 6, G−I. 5 µM of MG132 (474790 Calbiochem) was used to induce metaphase arrest (less than 2 h of treatment to avoid cohesion fatigue). For live- and fixed-cell analysis, 6 nM of taxol was added before acquisition or for 24 h before fixation, respectively. DMSO was used as control for these drugs.
Cell viability assay
Cells with different treatments (controls, siRNAs, and Tubastatin A) were seeded in 96-well plates at low concentrations, and the following day treated with increasing concentrations of taxol (0–24 nM; serially diluted) for 72 h (Fig. 4, B, D, F, and G; Fig. 6, C, D, E, G, and H; and Fig. 7, B, D, G, and H) or 120 h (Fig. 3 C). Then, medium was removed and cells washed with PBS. Fresh medium containing 0.02 mg/ml of resazurin sodium salt (R7017; Sigma-Aldrich) was added and cells kept at 37°C in humidified conditions with 5% CO2, protected from light. After 4 h, supernatant medium was collected to a new 96-well plate and resorufin fluorescence monitored in a Synergy MX microplate reader using 530 nm excitation and 590 nm emission.
Photoactivation
PA-GFP-α-tubulin/mCherry-α-tubulin U2OS cells were seeded onto 22 × 22 mm no. 1.5 glass coverslips in DMEM supplemented with 10% of FBS, for αTAT1-depletion. 6–12 h before imaging, medium was changed to DMEM without phenol red, supplemented with 10% of FBS. For imaging, coverslips were mounted onto magnetic imaging chambers and 5 µM of MG132 added to the medium. Mitotic cells were imaged in a Nikon TE2000U microscope, equipped with a Yokogawa CSU-X1 spinning-disc confocal head and an iXonEM+ EM-CCD camera (Andor Technology), using the 100×, 1.4 NA, Plan-Apochromatic differential interference contrast (DIC) oil objective, 488 and 561 nm excitation laser, and NIS-Elements software. DIC and mCherry-α-tubulin were used to identify mitotic cells in metaphase. For photoactivation, the mosaic photoactivation system (Andor) was used with the 405 nm laser at 75% power (500-ms exposure). A thin region of interest (in one half-spindle, close to the equator) was activated, and seven z-planes (separated by 1 µm) centered at the middle of the mitotic spindle were captured every 15 s for 4.5 min. To determine fluorescence dissipation after photoactivation, a custom script in MATLAB was used to generate whole-spindle sum-projected kymographs and quantify fluorescent intensities of the photoactivated spindle region. The first time point after photoactivation was used to normalize the intensities, and the nonactivated other half-spindle was used to subtract background. For photobleaching correction, these values were normalized to whole-cell (including cytoplasm) fluorescence loss. To calculate MT turnover, each time point normalized intensity values were fitted to a double exponential curve A1∗exp(−k1∗t) + A2∗exp(−k2∗t) using MATLAB (Mathworks), where t, time; A1, less stable (non-kMTs) population; A2, more stable (kMTs) population; and k1 and k2, decay rates of A1 and A2, respectively (R squared value >0.98). From these curves were obtained the rate constants and the percentage of MTs for the fast (typically interpreted as the fraction corresponding non-kMTs) and the slow (typically interpreted as the fraction corresponding kMTs) processes. The half-life was calculated as ln2/k for each MT population.
EB3 tracking
HCT-116 and U2OS cells were seeded onto 22 × 22 mm no. 1.5 glass coverslips in RPMI-1640 (Corning) and DMEM (Gibco, Thermo Fisher Scientific), respectively, supplemented with 10% of FBS and different experiments (controls, siαTAT1, and Tubastatin A) were performed. 24 h before imaging, cells were transiently transfected with EB3-GFP, followed by replacement with Leibovitz’s L-15 Medium (HCT-116) or DMEM (U2OS) without phenol red. Then, the coverslips were mounted onto magnetic imaging chambers. Imaging was performed every 0.5 s for 2 min at 37°C in a Nikon TE2000U microscope, equipped with a Yokogawa CSU-X1 spinning-disc confocal head and an iXonEM+ EM-CCD camera (Andor Technology), using the 100×, 1.4 NA, Plan-Apochromatic oil objective, 488 nm excitation laser, and NIS-Elements software. Individual comets were detected, tracked, and analyzed using the MATLAB-based software u-track (Applegate et al., 2011). The following parameters were used: maximum gap to close = 8, minimum track length = 5, search radius range = 2 (lower bound)–8 (upper bound), maximum forward and backward angles = 30°–10°, maximum shrinkage factor = 2, fluctuation radius = 2. Due to the low frequency of shrinkage events observed in these cells during tracking, we focused our analysis on growth lifetime, length, and speed.
Immunofluorescence
HCT-116 cells with different treatments (siTTL, siMCAK, or control [72 h RNAi]) were seeded at low density onto 22 × 22 mm no. 1.5 glass coverslips in RPMI-1640 (Corning) supplemented with 10% of FBS (Gibco, Thermo Fisher Scientific), and the following day treated with taxol or DMSO for 24 h. Then, cells were fixed with cold methanol for 3 min at −20°C, rehydrated with cytoskeleton buffer containing glucose (137 mM NaCl, 5 mM KCl, 1.1 mM Na2HPO4, 0.4 mM KH2PO4, 2 mM EGTA, 2 mM MgCl2, 5 mM Pipes, 10 mM glucose, pH 6.1), and washed with PBS containing 0.01% Triton X-100 (PBST; Sigma-Aldrich). An incubation with blocking solution (PBST containing 10% FBS) for 1 h at RT preceded the incubation of the cells with primary antibodies anti-γ-tubulin (clone GTU-88, T6557; 1:2,000; Sigma-Aldrich) and anti-β-tubulin (ab6046; 1:1,000; Abcam) diluted in blocking solution overnight at 4°C. After PBST washes, secondary antibodies Alexa Fluor 488 and 568 (1:1,000; Thermo Fisher Scientific) were incubated for 1 h RT and DNA counterstained with DAPI (1 μg/ml in PBST; Sigma-Aldrich), followed by final PBST and PBS washes. The coverslips were mounted on glass slides with 20 mM Tris, pH 8, 0.5 N-propyl gallate, and 90% glycerol. The acquisition of the 3D wide-field images (stack of 34 z-planes separated by 0.24 µm, full range = 8 µm) was performed with an AxioObserver (Carl Zeiss), equipped with a CCD camera ORCA-R2 (Hamamatsu), using the 63×, 1.46 NA, Plan-Apochromatic oil differential interference contrast objective and Zen software (Carl Zeiss). Images were analyzed in ImageJ software, where γ-tubulin and β-tubulin were used to define spindle pole number. Representative images (Fig. 8 A) were 3D deconvolved with Autoquant X software (Media Cybernetics), and z-stacks were maximum-intensity projected in ImageJ software.
Time-lapse phase-contrast microscopy
For phase-contrast live-cell imaging, HCT-116 cells (siRNA-mediated depleted) were seeded at low density in 12-well plates with RPMI-1640 supplemented with 10% of FBS, and the following day, taxol was added before imaging. Controlled by the software LAS X, phase-contrast images were acquired every 15 min for 72 h at 37°C with 5% CO2 on a Leica DMI6000 Timelapse microscope (Leica Microsystems), equipped with a Hamamatsu FLASH4.0 camera (Hamamatsu), using the objective HCX PL FLUOTAR L 20×/0.40 CORR Ph1 (Leica Microsystems). Images were analyzed in ImageJ software.
Statistical analysis
Statistical analysis was performed in GraphPad Prism 9. To analyze normal (Gaussian) distribution, the Shapiro–Wilk normality test was used. The nonparametric Spearman correlation was used in all correlations. Mann–Whitney test was used to analyze differences between average taxol activity z score in the groups with different α-tubulin acetylation levels. In addition, Mann–Whitney test was used to analyze MT dynamic parameters in Fig. 5 H (siαTAT1), J (Tubastatin A), K, M (siαTAT1 and Tubastatin A), L (siαTAT1), and non-kMT half-life between conditions. IC50 calculations were also performed in GraphPad Prism 9 using recommended instructions. Unpaired two-tailed t test was used to analyze IC50 quantifications of αTAT1 depletion and Tubastatin A treatment in HCT-116 cells, kMT half-life, as well as MT dynamic parameters of Fig. 5 H (Tubastatin A), I (siαTAT1 and Tubastatin A), J (siαTAT1), and L (Tubastatin A). Comparison between IC50 quantifications of Fig. 6, F and I, and Fig. 7 E, as well as between time-points in double thymidine synchronization and cell confluency assay were performed using one-way ANOVA. Fisher’s exact two-tailed test was used to analyze the quantifications of mitotic cells with multipolar spindles and acentrosomal poles, as well as the quantifications of live-cell phase-contrast microscopy.
Online supplemental material
Fig. S1 shows representative immunoblots of the screen of tubulin PTMs in the NCI-60 cancer cell panel. Fig. S2 shows that tubulin PTMs only vary slightly throughout the cell cycle or distinct cell confluency. Fig. S3 shows that VASH2 expression weakly correlates with α-tubulin detyrosination, while VASH1 and MATCAP weakly correlates with TTL levels. Fig. S4 shows that α-tubulin detyrosination, Δ2, TTL, and MCAK levels do not correlate with taxol cytotoxicity, whereas α-tubulin detyrosination and TTL do not correlate with MCAK expression. Fig. S5 shows α-tubulin acetylation levels upon different experimental manipulations and characterization of α-tubulin PTMs in human U2OS cells. Table S1 is a summary of the NCI-60 cancer cell lines used in the study.
Supplementary Material
is a summary of the NCI-60 cancer cell lines used in the study.
contains original blots for Fig. 3.
contains original blots for Fig. 4.
contains original blots for Fig. 5.
contains original blots for Fig. 6.
contains original blots for Fig. 7.
contains original blots for Fig. S1.
contains original blots for Fig. S2.
contains original blots for Fig. S5.
Acknowledgments
We would like to thank Mónica Bettencourt-Dias (Instituto Gulbenkian de Ciência, Oeiras, Portugal) and Joana Paredes (i3S, University of Porto, Porto, Portugal) for the generous gift of cell lines of the NCI-60 panel and insightful discussions during this project. We also thank members of the Chromosome Instability & Dynamics Lab for feedback on the manuscript and throughout this work.
D. Lopes was supported by a PhD fellowship from Fundação para a Ciência e a Tecnologia of Portugal (SFRH/BD/135077/2017) in the context of the Graduate Program Science for Development. Work in the Maiato lab is funded by the European Research Council consolidator grant CODECHECK under the European Union’s Horizon 2020 research and innovation programme (grant agreement 681443), Fundação para a Ciência e a Tecnologia of Portugal (PTDC/MED-ONC/3479/2020), La Caixa Health Research Grant (LCF/PR/HR21/52410025), and NORTE 2020/PORTUGAL 2020 Partnership Agreement through the European Regional Development Fund (NORTE-01-0145-FEDER-000051).
Author contributions. Methodology (D. Lopes and B. Orr); Investigation, formal analysis, and validation (D. Lopes, B. Orr, and A.L. Seabra); visualization (D. Lopes, A.L. Seabra, and H. Maiato); Writing – original draft (D. Lopes and H. Maiato); Writing – review and editing (B. Orr and H. Maiato); Supervision (B. Orr and H. Maiato); Conceptualization, project administration, and funding acquisition (H. Maiato).
References
- Aillaud, C., Bosc C., Peris L., Bosson A., Heemeryck P., Van Dijk J., Le Friec J., Boulan B., Vossier F., Sanman L.E., et al. 2017. Vasohibins/SVBP are tubulin carboxypeptidases (TCPs) that regulate neuron differentiation. Science. 358:1448–1453. 10.1126/science.aao4165 [DOI] [PubMed] [Google Scholar]
- Akella, J.S., Wloga D., Kim J., Starostina N.G., Lyons-Abbott S., Morrissette N.S., Dougan S.T., Kipreos E.T., and Gaertig J.. 2010. MEC-17 is an alpha-tubulin acetyltransferase. Nature. 467:218–222. 10.1038/nature09324 [DOI] [PMC free article] [PubMed] [Google Scholar]
- Andrews, P.D., Ovechkina Y., Morrice N., Wagenbach M., Duncan K., Wordeman L., and Swedlow J.R.. 2004. Aurora B regulates MCAK at the mitotic centromere. Dev. Cell. 6:253–268. 10.1016/S1534-5807(04)00025-5 [DOI] [PubMed] [Google Scholar]
- Applegate, K.T., Besson S., Matov A., Bagonis M.H., Jaqaman K., and Danuser G.. 2011. plusTipTracker: Quantitative image analysis software for the measurement of microtubule dynamics. J. Struct. Biol. 176:168–184. 10.1016/j.jsb.2011.07.009 [DOI] [PMC free article] [PubMed] [Google Scholar]
- Bakhoum, S.F., Thompson S.L., Manning A.L., and Compton D.A.. 2009. Genome stability is ensured by temporal control of kinetochore-microtubule dynamics. Nat. Cell Biol. 11:27–35. 10.1038/ncb1809 [DOI] [PMC free article] [PubMed] [Google Scholar]
- Barisic, M., Silva e Sousa R., Tripathy S.K., Magiera M.M., Zaytsev A.V., Pereira A.L., Janke C., Grishchuk E.L., and Maiato H.. 2015. Mitosis. Microtubule detyrosination guides chromosomes during mitosis. Science. 348:799–803. 10.1126/science.aaa5175 [DOI] [PMC free article] [PubMed] [Google Scholar]
- Berglind, H., Pawitan Y., Kato S., Ishioka C., and Soussi T.. 2008. Analysis of p53 mutation status in human cancer cell lines: A paradigm for cell line cross-contamination. Cancer Biol. Ther. 7:699–708. 10.4161/cbt.7.5.5712 [DOI] [PubMed] [Google Scholar]
- Bian, M., Fu J., Yan Y., Chen Q., Yang C., Shi Q., Jiang Q., and Zhang C.. 2010. Short exposure to paclitaxel induces multipolar spindle formation and aneuploidy through promotion of acentrosomal pole assembly. Sci. China Life Sci. 53:1322–1329. 10.1007/s11427-010-4086-1 [DOI] [PubMed] [Google Scholar]
- Boggs, A.E., Vitolo M.I., Whipple R.A., Charpentier M.S., Goloubeva O.G., Ioffe O.B., Tuttle K.C., Slovic J., Lu Y., Mills G.B., and Martin S.S.. 2015. α-Tubulin acetylation elevated in metastatic and basal-like breast cancer cells promotes microtentacle formation, adhesion, and invasive migration. Cancer Res. 75:203–215. 10.1158/0008-5472.CAN-13-3563 [DOI] [PMC free article] [PubMed] [Google Scholar]
- Bonezzi, K., Belotti D., North B.J., Ghilardi C., Borsotti P., Resovi A., Ubezio P., Riva A., Giavazzi R., Verdin E., and Taraboletti G.. 2012. Inhibition of SIRT2 potentiates the anti-motility activity of taxanes: Implications for antineoplastic combination therapies. Neoplasia. 14:846–854. 10.1593/neo.12728 [DOI] [PMC free article] [PubMed] [Google Scholar]
- Butler, K.V., Kalin J., Brochier C., Vistoli G., Langley B., and Kozikowski A.P.. 2010. Rational design and simple chemistry yield a superior, neuroprotective HDAC6 inhibitor, tubastatin A. J. Am. Chem. Soc. 132:10842–10846. 10.1021/ja102758v [DOI] [PMC free article] [PubMed] [Google Scholar]
- Chen, J., Kholina E., Szyk A., Fedorov V.A., Kovalenko I., Gudimchuk N., and Roll-Mecak A.. 2021. alpha-tubulin tail modifications regulate microtubule stability through selective effector recruitment, not changes in intrinsic polymer dynamics. Dev. Cell. 56:2016–2028 e4. 10.1016/j.devcel.2021.05.005 [DOI] [PMC free article] [PubMed] [Google Scholar]
- Conway, W., Kiewisz R., Fabig G., Kelleher C.P., Wu H.Y., Anjur-Dietrich M., Müller-Reichert T., and Needleman D.J.. 2022. Self-organization of kinetochore-fibers in human mitotic spindles. Elife. 11:11. 10.7554/eLife.75458 [DOI] [PMC free article] [PubMed] [Google Scholar]
- Dal Piaz, F., Vassallo A., Lepore L., Tosco A., Bader A., and De Tommasi N.. 2009. Sesterterpenes as tubulin tyrosine ligase inhibitors. First insight of structure-activity relationships and discovery of new lead. J. Med. Chem. 52:3814–3828. 10.1021/jm801637f [DOI] [PubMed] [Google Scholar]
- Dowdy, S.C., Jiang S., Zhou X.C., Hou X., Jin F., Podratz K.C., and Jiang S.W.. 2006. Histone deacetylase inhibitors and paclitaxel cause synergistic effects on apoptosis and microtubule stabilization in papillary serous endometrial cancer cells. Mol. Cancer Ther. 5:2767–2776. 10.1158/1535-7163.MCT-06-0209 [DOI] [PubMed] [Google Scholar]
- Dumontet, C., and Jordan M.A.. 2010. Microtubule-binding agents: A dynamic field of cancer therapeutics. Nat. Rev. Drug Discov. 9:790–803. 10.1038/nrd3253 [DOI] [PMC free article] [PubMed] [Google Scholar]
- Ersfeld, K., Wehland J., Plessmann U., Dodemont H., Gerke V., and Weber K.. 1993. Characterization of the tubulin-tyrosine ligase. J. Cell Biol. 120:725–732. 10.1083/jcb.120.3.725 [DOI] [PMC free article] [PubMed] [Google Scholar]
- Ferreira, J.G., Pereira A.J., Akhmanova A., and Maiato H.. 2013. Aurora B spatially regulates EB3 phosphorylation to coordinate daughter cell adhesion with cytokinesis. J. Cell Biol. 201:709–724. 10.1083/jcb.201301131 [DOI] [PMC free article] [PubMed] [Google Scholar]
- Ferreira, L.T., Figueiredo A.C., Orr B., Lopes D., and Maiato H.. 2018. Dissecting the role of the tubulin code in mitosis. Methods Cell Biol. 144:33–74. 10.1016/bs.mcb.2018.03.040 [DOI] [PMC free article] [PubMed] [Google Scholar]
- Ferreira, L.T., Orr B., Rajendraprasad G., Pereira A.J., Lemos C., Lima J.T., Guasch Boldú C., Ferreira J.G., Barisic M., and Maiato H.. 2020. α-Tubulin detyrosination impairs mitotic error correction by suppressing MCAK centromeric activity. J. Cell Biol. 219:219. 10.1083/jcb.201910064 [DOI] [PMC free article] [PubMed] [Google Scholar]
- Fonrose, X., Ausseil F., Soleilhac E., Masson V., David B., Pouny I., Cintrat J.C., Rousseau B., Barette C., Massiot G., and Lafanechère L.. 2007. Parthenolide inhibits tubulin carboxypeptidase activity. Cancer Res. 67:3371–3378. 10.1158/0008-5472.CAN-06-3732 [DOI] [PubMed] [Google Scholar]
- Froidevaux-Klipfel, L., Targa B., Cantaloube I., Ahmed-Zaïd H., Poüs C., and Baillet A.. 2015. Septin cooperation with tubulin polyglutamylation contributes to cancer cell adaptation to taxanes. Oncotarget. 6:36063–36080. 10.18632/oncotarget.5373 [DOI] [PMC free article] [PubMed] [Google Scholar]
- Ganguly, A., Yang H., and Cabral F.. 2011a. Overexpression of mitotic centromere-associated Kinesin stimulates microtubule detachment and confers resistance to paclitaxel. Mol. Cancer Ther. 10:929–937. 10.1158/1535-7163.MCT-10-1109 [DOI] [PMC free article] [PubMed] [Google Scholar]
- Ganguly, A., Yang H., Pedroza M., Bhattacharya R., and Cabral F.. 2011b. Mitotic centromere-associated kinesin (MCAK) mediates paclitaxel resistance. J. Biol. Chem. 286:36378–36384. 10.1074/jbc.M111.296483 [DOI] [PMC free article] [PubMed] [Google Scholar]
- Girão, H., and Maiato H.. 2020. Measurement of microtubule half-life and poleward flux in the mitotic spindle by photoactivation of fluorescent tubulin. Methods Mol. Biol. 2101:235–246. 10.1007/978-1-0716-0219-5_15 [DOI] [PubMed] [Google Scholar]
- Gundersen, G.G., and Bulinski J.C.. 1986. Distribution of tyrosinated and nontyrosinated alpha-tubulin during mitosis. J. Cell Biol. 102:1118–1126. 10.1083/jcb.102.3.1118 [DOI] [PMC free article] [PubMed] [Google Scholar]
- Hedrick, D.G., Stout J.R., and Walczak C.E.. 2008. Effects of anti-microtubule agents on microtubule organization in cells lacking the kinesin-13 MCAK. Cell Cycle. 7:2146–2156. 10.4161/cc.7.14.6239 [DOI] [PubMed] [Google Scholar]
- Huang, P., Almeciga-Pinto I., Jarpe M., van Duzer J.H., Mazitschek R., Yang M., Jones S.S., and Quayle S.N.. 2017. Selective HDAC inhibition by ACY-241 enhances the activity of paclitaxel in solid tumor models. Oncotarget. 8:2694–2707. 10.18632/oncotarget.13738 [DOI] [PMC free article] [PubMed] [Google Scholar]
- Hubbert, C., Guardiola A., Shao R., Kawaguchi Y., Ito A., Nixon A., Yoshida M., Wang X.F., and Yao T.P.. 2002. HDAC6 is a microtubule-associated deacetylase. Nature. 417:455–458. 10.1038/417455a [DOI] [PubMed] [Google Scholar]
- Janke, C., and Magiera M.M.. 2020. The tubulin code and its role in controlling microtubule properties and functions. Nat. Rev. Mol. Cell Biol. 21:307–326. 10.1038/s41580-020-0214-3 [DOI] [PubMed] [Google Scholar]
- Kato, C., Miyazaki K., Nakagawa A., Ohira M., Nakamura Y., Ozaki T., Imai T., and Nakagawara A.. 2004. Low expression of human tubulin tyrosine ligase and suppressed tubulin tyrosination/detyrosination cycle are associated with impaired neuronal differentiation in neuroblastomas with poor prognosis. Int. J. Cancer. 112:365–375. 10.1002/ijc.20431 [DOI] [PubMed] [Google Scholar]
- Khawaja, S., Gundersen G.G., and Bulinski J.C.. 1988. Enhanced stability of microtubules enriched in detyrosinated tubulin is not a direct function of detyrosination level. J. Cell Biol. 106:141–149. 10.1083/jcb.106.1.141 [DOI] [PMC free article] [PubMed] [Google Scholar]
- Kline-Smith, S.L., Khodjakov A., Hergert P., and Walczak C.E.. 2004. Depletion of centromeric MCAK leads to chromosome congression and segregation defects due to improper kinetochore attachments. Mol. Biol. Cell. 15:1146–1159. 10.1091/mbc.e03-08-0581 [DOI] [PMC free article] [PubMed] [Google Scholar]
- Koyanagi, T., Saga Y., Takahashi Y., Tamura K., Yoshiba T., Takahashi S., Taneichi A., Takei Y., Urabe M., Mizukami H., and Fujiwara H.. 2021. Knockout of vasohibin-2 reduces tubulin carboxypeptidase activity and increases paclitaxel sensitivity in ovarian cancer. Cancer Med. 10:2732–2739. 10.1002/cam4.3841 [DOI] [PMC free article] [PubMed] [Google Scholar]
- Lafanechère, L., Courtay-Cahen C., Kawakami T., Jacrot M., Rüdiger M., Wehland J., Job D., and Margolis R.L.. 1998. Suppression of tubulin tyrosine ligase during tumor growth. J. Cell Sci. 111:171–181. 10.1242/jcs.111.2.171 [DOI] [PubMed] [Google Scholar]
- Lan, W., Zhang X., Kline-Smith S.L., Rosasco S.E., Barrett-Wilt G.A., Shabanowitz J., Hunt D.F., Walczak C.E., and Stukenberg P.T.. 2004. Aurora B phosphorylates centromeric MCAK and regulates its localization and microtubule depolymerization activity. Curr. Biol. 14:273–286. 10.1016/j.cub.2004.01.055 [DOI] [PubMed] [Google Scholar]
- Landskron, L., Bak J., Adamopoulos A., Kaplani K., Moraiti M., van den Hengel L.G., Song J.Y., Bleijerveld O.B., Nieuwenhuis J., Heidebrecht T., et al. 2022. Posttranslational modification of microtubules by the MATCAP detyrosinase. Science. 376:eabn6020. 10.1126/science.abn6020 [DOI] [PubMed] [Google Scholar]
- Liao, S., Rajendraprasad G., Wang N., Eibes S., Gao J., Yu H., Wu G., Tu X., Huang H., Barisic M., and Xu C.. 2019. Molecular basis of vasohibins-mediated detyrosination and its impact on spindle function and mitosis. Cell Res. 29:533–547. 10.1038/s41422-019-0187-y [DOI] [PMC free article] [PubMed] [Google Scholar]
- Lopes, D., and Maiato H.. 2020. The tubulin code in mitosis and cancer. Cells. 9:9. 10.3390/cells9112356 [DOI] [PMC free article] [PubMed] [Google Scholar]
- Magiera, M.M., Singh P., Gadadhar S., and Janke C.. 2018. Tubulin posttranslational modifications and emerging links to human disease. Cell. 173:1323–1327. 10.1016/j.cell.2018.05.018 [DOI] [PubMed] [Google Scholar]
- Maiato, H., and Logarinho E.. 2014. Mitotic spindle multipolarity without centrosome amplification. Nat. Cell Biol. 16:386–394. 10.1038/ncb2958 [DOI] [PubMed] [Google Scholar]
- Marteil, G., Guerrero A., Vieira A.F., de Almeida B.P., Machado P., Mendonça S., Mesquita M., Villarreal B., Fonseca I., Francia M.E., et al. 2018. Over-elongation of centrioles in cancer promotes centriole amplification and chromosome missegregation. Nat. Commun. 9:1258. 10.1038/s41467-018-03641-x [DOI] [PMC free article] [PubMed] [Google Scholar]
- Maruta, H., Greer K., and Rosenbaum J.L.. 1986. The acetylation of alpha-tubulin and its relationship to the assembly and disassembly of microtubules. J. Cell Biol. 103:571–579. 10.1083/jcb.103.2.571 [DOI] [PMC free article] [PubMed] [Google Scholar]
- Mialhe, A., Lafanechère L., Treilleux I., Peloux N., Dumontet C., Brémond A., Panh M.H., Payan R., Wehland J., Margolis R.L., and Job D.. 2001. Tubulin detyrosination is a frequent occurrence in breast cancers of poor prognosis. Cancer Res. 61:5024–5027 [PubMed] [Google Scholar]
- Nieuwenhuis, J., Adamopoulos A., Bleijerveld O.B., Mazouzi A., Stickel E., Celie P., Altelaar M., Knipscheer P., Perrakis A., Blomen V.A., and Brummelkamp T.R.. 2017. Vasohibins encode tubulin detyrosinating activity. Science. 358:1453–1456. 10.1126/science.aao5676 [DOI] [PubMed] [Google Scholar]
- North, B.J., Marshall B.L., Borra M.T., Denu J.M., and Verdin E.. 2003. The human Sir2 ortholog, SIRT2, is an NAD+-dependent tubulin deacetylase. Mol. Cell. 11:437–444. 10.1016/S1097-2765(03)00038-8 [DOI] [PubMed] [Google Scholar]
- Orr, G.A., Verdier-Pinard P., McDaid H., and Horwitz S.B.. 2003. Mechanisms of Taxol resistance related to microtubules. Oncogene. 22:7280–7295. 10.1038/sj.onc.1206934 [DOI] [PMC free article] [PubMed] [Google Scholar]
- Paoletti, A., Giocanti N., Favaudon V., and Bornens M.. 1997. Pulse treatment of interphasic HeLa cells with nanomolar doses of docetaxel affects centrosome organization and leads to catastrophic exit of mitosis. J. Cell Sci. 110:2403–2415. 10.1242/jcs.110.19.2403 [DOI] [PubMed] [Google Scholar]
- Paturle-Lafanechère, L., Eddé B., Denoulet P., Van Dorsselaer A., Mazarguil H., Le Caer J.P., Wehland J., and Job D.. 1991. Characterization of a major brain tubulin variant which cannot be tyrosinated. Biochemistry. 30:10523–10528. 10.1021/bi00107a022 [DOI] [PubMed] [Google Scholar]
- Paturle-Lafanechère, L., Manier M., Trigault N., Pirollet F., Mazarguil H., and Job D.. 1994. Accumulation of delta 2-tubulin, a major tubulin variant that cannot be tyrosinated, in neuronal tissues and in stable microtubule assemblies. J. Cell Sci. 107:1529–1543. 10.1242/jcs.107.6.1529 [DOI] [PubMed] [Google Scholar]
- Peris, L., Wagenbach M., Lafanechère L., Brocard J., Moore A.T., Kozielski F., Job D., Wordeman L., and Andrieux A.. 2009. Motor-dependent microtubule disassembly driven by tubulin tyrosination. J. Cell Biol. 185:1159–1166. 10.1083/jcb.200902142 [DOI] [PMC free article] [PubMed] [Google Scholar]
- Portran, D., Schaedel L., Xu Z., Théry M., and Nachury M.V.. 2017. Tubulin acetylation protects long-lived microtubules against mechanical ageing. Nat. Cell Biol. 19:391–398. 10.1038/ncb3481 [DOI] [PMC free article] [PubMed] [Google Scholar]
- Reinhold, W.C., Sunshine M., Liu H., Varma S., Kohn K.W., Morris J., Doroshow J., and Pommier Y.. 2012. CellMiner: A web-based suite of genomic and pharmacologic tools to explore transcript and drug patterns in the NCI-60 cell line set. Cancer Res. 72:3499–3511. 10.1158/0008-5472.CAN-12-1370 [DOI] [PMC free article] [PubMed] [Google Scholar]
- Rodrigues-Ferreira, S., Nehlig A., Moindjie H., Monchecourt C., Seiler C., Marangoni E., Chateau-Joubert S., Dujaric M.E., Servant N., Asselain B., et al. 2019. Improving breast cancer sensitivity to paclitaxel by increasing aneuploidy. Proc. Natl. Acad. Sci. USA. 116:23691–23697. 10.1073/pnas.1910824116 [DOI] [PMC free article] [PubMed] [Google Scholar]
- Sakaushi, S., Nishida K., Minamikawa H., Fukada T., Oka S., and Sugimoto K.. 2007. Live imaging of spindle pole disorganization in docetaxel-treated multicolor cells. Biochem. Biophys. Res. Commun. 357:655–660. 10.1016/j.bbrc.2007.03.205 [DOI] [PubMed] [Google Scholar]
- Scribano, C.M., Wan J., Esbona K., Tucker J.B., Lasek A., Zhou A.S., Zasadil L.M., Molini R., Fitzgerald J., Lager A.M., et al. 2021. Chromosomal instability sensitizes patient breast tumors to multipolar divisions induced by paclitaxel. Sci. Transl. Med. 13:eabd4811. 10.1126/scitranslmed.abd4811 [DOI] [PMC free article] [PubMed] [Google Scholar]
- Shida, T., Cueva J.G., Xu Z., Goodman M.B., and Nachury M.V.. 2010. The major alpha-tubulin K40 acetyltransferase alphaTAT1 promotes rapid ciliogenesis and efficient mechanosensation. Proc. Natl. Acad. Sci. USA. 107:21517–21522. 10.1073/pnas.1013728107 [DOI] [PMC free article] [PubMed] [Google Scholar]
- Shoemaker, R.H. 2006. The NCI60 human tumour cell line anticancer drug screen. Nat. Rev. Cancer. 6:813–823. 10.1038/nrc1951 [DOI] [PubMed] [Google Scholar]
- Sirajuddin, M., Rice L.M., and Vale R.D.. 2014. Regulation of microtubule motors by tubulin isotypes and post-translational modifications. Nat. Cell Biol. 16:335–344. 10.1038/ncb2920 [DOI] [PMC free article] [PubMed] [Google Scholar]
- Soucek, K., Kamaid A., Phung A.D., Kubala L., Bulinski J.C., Harper R.W., and Eiserich J.P.. 2006. Normal and prostate cancer cells display distinct molecular profiles of alpha-tubulin posttranslational modifications. Prostate. 66:954–965. 10.1002/pros.20416 [DOI] [PubMed] [Google Scholar]
- Steblyanko, Y., Rajendraprasad G., Osswald M., Eibes S., Jacome A., Geley S., Pereira A.J., Maiato H., and Barisic M.. 2020. Microtubule poleward flux in human cells is driven by the coordinated action of four kinesins. EMBO J. 39:e105432. 10.15252/embj.2020105432 [DOI] [PMC free article] [PubMed] [Google Scholar]
- Talje, L., Ben El Kadhi K., Atchia K., Tremblay-Boudreault T., Carreno S., and Kwok B.H.. 2014. DHTP is an allosteric inhibitor of the kinesin-13 family of microtubule depolymerases. FEBS Lett. 588:2315–2320. 10.1016/j.febslet.2014.05.024 [DOI] [PubMed] [Google Scholar]
- Verhey, K.J., and Gaertig J.. 2007. The tubulin code. Cell Cycle. 6:2152–2160. 10.4161/cc.6.17.4633 [DOI] [PubMed] [Google Scholar]
- Wattanathamsan, O., Thararattanobon R., Rodsiri R., Chanvorachote P., Vinayanuwattikun C., and Pongrakhananon V.. 2021. Tubulin acetylation enhances lung cancer resistance to paclitaxel-induced cell death through Mcl-1 stabilization. Cell Death Discov. 7:67. 10.1038/s41420-021-00453-9 [DOI] [PMC free article] [PubMed] [Google Scholar]
- Webster, D.R., Wehland J., Weber K., and Borisy G.G.. 1990. Detyrosination of alpha tubulin does not stabilize microtubules in vivo. J. Cell Biol. 111:113–122. 10.1083/jcb.111.1.113 [DOI] [PMC free article] [PubMed] [Google Scholar]
- Whipple, R.A., Matrone M.A., Cho E.H., Balzer E.M., Vitolo M.I., Yoon J.R., Ioffe O.B., Tuttle K.C., Yang J., and Martin S.S.. 2010. Epithelial-to-mesenchymal transition promotes tubulin detyrosination and microtentacles that enhance endothelial engagement. Cancer Res. 70:8127–8137. 10.1158/0008-5472.CAN-09-4613 [DOI] [PMC free article] [PubMed] [Google Scholar]
- Whipple, R.A., Vitolo M.I., Boggs A.E., Charpentier M.S., Thompson K., and Martin S.S.. 2013. Parthenolide and costunolide reduce microtentacles and tumor cell attachment by selectively targeting detyrosinated tubulin independent from NF-κB inhibition. Breast Cancer Res. 15:R83. 10.1186/bcr3477 [DOI] [PMC free article] [PubMed] [Google Scholar]
- Wilson, P., and Forer A.. 1989. Identifying the site of microtubule polymerization during regrowth of UV-sheared kinetochore fibres using antibodies against acetylated alpha-tubulin. Cell Biol. Int. Rep. 13:823–832. 10.1016/0309-1651(89)90123-9 [DOI] [PubMed] [Google Scholar]
- Wordeman, L., Wagenbach M., and von Dassow G.. 2007. MCAK facilitates chromosome movement by promoting kinetochore microtubule turnover. J. Cell Biol. 179:869–879. 10.1083/jcb.200707120 [DOI] [PMC free article] [PubMed] [Google Scholar]
- Xiao, H., Verdier-Pinard P., Fernandez-Fuentes N., Burd B., Angeletti R., Fiser A., Horwitz S.B., and Orr G.A.. 2006. Insights into the mechanism of microtubule stabilization by Taxol. Proc. Natl. Acad. Sci. USA. 103:10166–10173. 10.1073/pnas.0603704103 [DOI] [PMC free article] [PubMed] [Google Scholar]
- Xu, H., Wang L., Shi B., Hu L., Gan C., Wang Y., Xiang Z., Wang X., and Sheng J.. 2020. Caffeine inhibits the anticancer activity of paclitaxel via down-regulation of alpha-tubulin acetylation. Biomed Pharmacother. 129:110441. 10.1016/j.biopha.2020.110441 [DOI] [PubMed] [Google Scholar]
- Xu, Z., Schaedel L., Portran D., Aguilar A., Gaillard J., Marinkovich M.P., Théry M., and Nachury M.V.. 2017. Microtubules acquire resistance from mechanical breakage through intralumenal acetylation. Science. 356:328–332. 10.1126/science.aai8764 [DOI] [PMC free article] [PubMed] [Google Scholar]
- Zasadil, L.M., Andersen K.A., Yeum D., Rocque G.B., Wilke L.G., Tevaarwerk A.J., Raines R.T., Burkard M.E., and Weaver B.A.. 2014. Cytotoxicity of paclitaxel in breast cancer is due to chromosome missegregation on multipolar spindles. Sci. Transl. Med. 6:229ra43. 10.1126/scitranslmed.3007965 [DOI] [PMC free article] [PubMed] [Google Scholar]
- Zhu, J., Beattie E.C., Yang Y., Wang H.J., Seo J.Y., and Yang L.X.. 2005. Centrosome impairments and consequent cytokinesis defects are possible mechanisms of taxane drugs. Anticancer Res. 25:1919–1925 [PubMed] [Google Scholar]
- Zuco, V., De Cesare M., Cincinelli R., Nannei R., Pisano C., Zaffaroni N., and Zunino F.. 2011. Synergistic antitumor effects of novel HDAC inhibitors and paclitaxel in vitro and in vivo. PLoS One. 6:e29085. 10.1371/journal.pone.0029085 [DOI] [PMC free article] [PubMed] [Google Scholar]
Associated Data
This section collects any data citations, data availability statements, or supplementary materials included in this article.
Supplementary Materials
is a summary of the NCI-60 cancer cell lines used in the study.
contains original blots for Fig. 3.
contains original blots for Fig. 4.
contains original blots for Fig. 5.
contains original blots for Fig. 6.
contains original blots for Fig. 7.
contains original blots for Fig. S1.
contains original blots for Fig. S2.
contains original blots for Fig. S5.


