

Abstract
Background
Current guidelines recommend a higher‐dose inhaled corticosteroids (ICS) or adding a long‐acting muscarinic antagonist (LAMA) when asthma is not controlled with medium‐dose (MD) ICS/long‐acting beta2‐agonist (LABA) combination therapy.
Objectives
To assess the effectiveness and safety of dual (ICS/LABA) and triple therapies (ICS/LABA/LAMA) compared with each other and with varying doses of ICS in adolescents and adults with uncontrolled asthma.
Search methods
We searched multiple databases for pre‐registered randomised controlled trials (RCTs) of at least 12 weeks of study duration from 2008 to 18 February 2022.
Selection criteria
We searched studies, including adolescents and adults with uncontrolled asthma who had been treated with, or were eligible for, MD‐ICS/LABA, comparing dual and triple therapies. We excluded cluster‐ and cross‐over RCTs.
Data collection and analysis
We conducted a systematic review and network meta‐analysis according to the previously published protocol. We used Cochrane’s Screen4ME workflow to assess search results and Grading of Recommendations Assessment, Development and Evaluation (GRADE) to assess the certainty of evidence. The primary outcome was steroid‐requiring asthma exacerbations and asthma‐related hospitalisations (moderate to severe and severe exacerbations).
Main results
We included 17,161 patients with uncontrolled asthma from 17 studies (median duration 26 weeks; mean age 49.1 years; male 40%; white 81%; mean forced expiratory volume in 1 second (MEF 1)1.9 litres and 61% predicted). The quality of included studies was generally good except for some outcomes in a few studies due to high attrition rates.
Medium‐dose (MD) and high‐dose (HD) triple therapies reduce steroid‐requiring asthma exacerbations (hazard ratio (HR) 0.84 [95% credible interval (CrI) 0.71 to 0.99] and 0.69 [0.58 to 0.82], respectively) (high‐certainty evidence), but not asthma‐related hospitalisations, compared to MD‐ICS/LABA.
High‐dose triple therapy likely reduces steroid‐requiring asthma exacerbations compared to MD triple therapy (HR 0.83 [95% CrI 0.69 to 0.996], [moderate certainty]). Subgroup analyses suggest the reduction in steroid‐requiring exacerbations associated with triple therapies may be only for those with a history of asthma exacerbations in the previous year but not for those without.
High‐dose triple therapy, but not MD triple, results in a reduction in all‐cause adverse events (AEs) and likely reduces dropouts due to AEs compared to MD‐ICS/LABA (odds ratio (OR) 0.79 [95% CrI 0.69 to 0.90], [high certainty] and 0.50 [95% CrI 0.30 to 0.84], [moderate certainty], respectively). Triple therapy results in little to no difference in all‐cause or asthma‐related serious adverse events (SAEs) compared to dual therapy (high certainty).
The evidence suggests triple therapy results in little or no clinically important difference in symptoms or quality of life compared to dual therapy considering the minimal clinically important differences (MCIDs) and HD‐ICS/LABA is unlikely to result in any significant benefit or harm compared to MD‐ICS/LABA.
Authors' conclusions
Medium‐dose and HD triple therapies reduce steroid‐requiring asthma exacerbations, but not asthma‐related hospitalisations, compared to MD‐ICS/LABA especially in those with a history of asthma exacerbations in the previous year. High‐dose triple therapy is likely superior to MD triple therapy in reducing steroid‐requiring asthma exacerbations.
Triple therapy is unlikely to result in clinically meaningful improvement in symptoms or quality of life compared to dual therapy considering the MCIDs.
High‐dose triple therapy, but not MD triple, results in a reduction in all‐cause AEs and likely reduces dropouts due to AEs compared to MD‐ICS/LABA. Triple therapy results in little to no difference in all‐cause or asthma‐related SAEs compared to dual therapy.
HD‐ICS/LABA is unlikely to result in any significant benefit or harm compared to MD‐ICS/LABA, although long‐term safety of higher rather than MD‐
ICS remains to be demonstrated given the median duration of included studies was six months.
The above findings may assist deciding on a treatment option when asthma is not controlled with MD‐ICS/LABA.
Plain language summary
What is triple inhaled therapy, when is it used, and what does it do in asthma?
How are inhalers used for the management of asthma?
Management of asthma involves a series of stepwise therapies depending on the severity of the disease. Initial therapy typically starts with as needed short‐acting inhaler therapy (step 1), and a daily low‐ to medium‐dose inhaled steroids is added for better asthma control when needed (step 2). Subsequently, a bronchodilator known as long‐acting beta2‐agonist (LABA), which causes the passages of the airways to expand and relax so that breathing difficulty is reduced, is typically added to inhaled steroids if needed (steps 3 and 4).
What are the options when asthma is not controlled with a combination of inhaled steroids and LABA?
Current guidelines recommend a higher‐dose of inhaled steroids or adding another bronchodilator known as long‐acting muscarinic antagonist (LAMA), (i.e. triple inhaled therapy) (step 5), when asthma is not controlled with medium‐dose inhaled steroids and LABA dual inhaled therapy.
How did we answer the question?
We collected and analysed data from 17 studies, including a total of 17,161 adolescents and adults with uncontrolled asthma, using a special method called a network meta‐analysis, which enabled us to simultaneously compare multiple inhaler groups.
What did we find?
Triple inhaled therapy (i.e, inhaled steroids + LABA + LAMA) reduces asthma flare‐ups, but not asthma‐related hospitalisations. High‐dose triple therapy, not medium‐dose triple, is likely to be better tolerated due to less side effects compared to dual inhaled therapy (i.e. inhaled steroids + LABA).
Triple therapy may improve symptom and quality of life scores compared to dual therapy but not enough to be perceived by those being on it.
Higher than medium‐dose inhaled steroids in dual inhaled therapy are unlikely to result in any additional benefit or harm.
Conclusions
Triple inhaled therapy, especially high‐dose formulations, reduces asthma flare‐ups and is likely to be better tolerated due to less side effects compared to dual therapy.
Triple inhaled therapy may or may not to improve symptoms or quality of life compared to dual therapy.
Increasing the strength of inhaled steroids from medium to high dose is likely beneficial in triple inhaled therapy but probably not in dual therapy.
Immuno modulators, which are injectable medications, or other options may be considered if asthma symptoms are not well controlled or for those requiring asthma‐related hospitalisations despite being on medium‐dose dual inhaled therapy.
Summary of findings
Summary of findings 1. NMA Summary of Findings for severe exacerbations (asthma‐related hospitalisations).
|
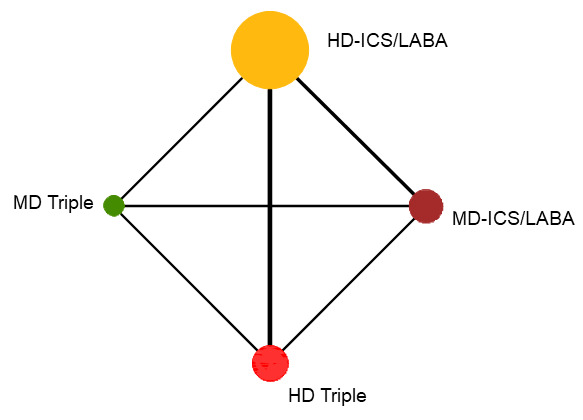
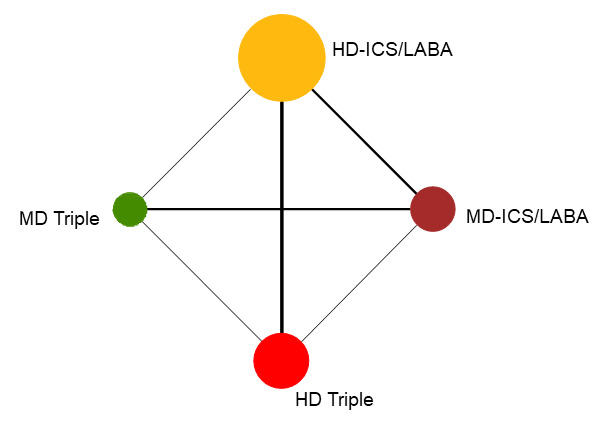
Patient or population: Adolescents and adults with symptomatic asthma Interventions: HD‐ICS/LABA, MD‐TRIPLE, HD‐TRIPLE Comparator (reference): Medium‐Dose ICS/LABA (MD‐ICS/LABA) Outcome: Severe exacerbations Setting(s): Outpatient |
Geometry of the Network in Figure 1* | |||||
|
Total studies: 8 RCTs Total Participants: 9983 |
Hazard ratio** (95% CrI) |
Anticipated absolute effect at the end of 1 year***(95% CrI) | Certainty of the evidence |
Ranking**** (95% CrI) |
Interpretation of Findings | |
|
With intervention (With MD‐ICS/LABA) |
Difference | |||||
| HD‐ICS/LABA (Direct evidence; 7 RCTs; 7023 participants) |
1.43 (0.76 to 2.77) |
15 per 1000 | 5 per 1000 more (from 2 fewer to 18 more) |
⊕⊕⊕◯ Moderate Due to substantial heterogeneity1 |
3.0 (1.0 to 4.0) |
Probably little or no difference |
| MD‐TRIPLE (Direct evidence; 2 RCTs; 1023 participants) |
1.73 (0.90 to 3.32) |
18 per 1000 | 8 per 1000 more (from 1 fewer to 24 more) |
⊕⊕◯◯ Low Due to imprecision2 |
4.0 (1.0 to 4.0) |
Suggest little or no difference |
| HD‐TRIPLE (Direct evidence; 2 RCTs; 1024 participants) |
1.14 (0.54 to 2.41) |
12 per 1000 | 2 per 1000 more (from 4 fewer to 15 more) |
⊕⊕◯◯ Low Due to imprecision2 |
2.0 (1.0 to 4.0) |
Suggest little or no difference |
| MD‐ICS/LABA | Reference Comparator | (10 per 1000)3 | Reference Comparator | Reference Comparator |
1.0 (1.0 to 3.0) |
Reference Comparator |
|
NMA‐SoF table definitions * The size of the nodes and the thickness of edges depend on the number of people randomised and the number of trials conducted. ** Network Meta‐Analysis estimates are reported as hazard ratio. Results are expressed in credible intervals as opposed to the confidence intervals since a Bayesian analysis has been conducted. *** Anticipated absolute effect (exacerbation rate at 1 year). Anticipated absolute effect compares two rates by calculating the difference between the rates of the intervention group with the rate of MD‐ICS/LABA group. **** Median and credible intervals are presented. Rank statistics is defined as the probabilities that a treatment out of n treatments in a network meta‐analysis is the best, the second, the third and so on until the least effective treatment. | ||||||
|
GRADE Working Group grades of evidence (or certainty in the evidence) High quality: We are very confident that the true effect lies close to that of the estimate of the effect Moderate quality: We are moderately confident in the effect estimate: The true effect is likely to be close to the estimate of the effect, but there is a possibility that it is substantially different Low quality: Our confidence in the effect estimate is limited: The true effect may be substantially different from the estimate of the effect Very low quality: We have very little confidence in the effect estimate: The true effect is likely to be substantially different from the estimate of effect | ||||||
|
Explanatory Footnotes 1 Substantial heterogeneity I2>= 50% to 90% in the direct pairwise comparison. 2 Very serious imprecision. Due to wide confidence intervals and suboptimal sample sizes in the direct and/or indirect estimate(s). 3 Based on the average rate in patients treated with MD‐ICS/LABA in the included studies. | ||||||
CrI: credible interval; HD: high dose; ICS: inhaled corticosteroids; LABA: long‐acting beta2 agonist; MD: medium dose; NMA: network meta‐analysis; RCT: randomised controlled trial.
1.
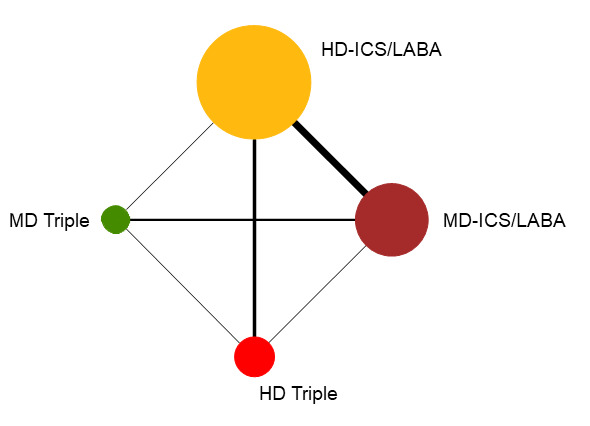
Network diagram for severe exacerbations for grouped interventions.
The size of the nodes and the thickness of edges depend on the number of people randomised and the number of trials conducted. HD: high dose; ICS: inhaled corticosteroids; LABA: long‐acting beta‐2 agonist; MD: medium dose.
Summary of findings 2. Asthma exacerbations ‐ pairwise comparisons.
| Outcome № of participants (studies) | Relative effect (95% CI) | Anticipated absolute effects (95% CI) | Certainty of the evidence | What happens | ||
| With active control | With experimental comparator | Difference | ||||
| Severe exacerbations ‐ HD‐ICA/LABA vs MD‐ICS LABA
№ of participants: 4492
(5 RCTs) Follow up: 3 to 12 months |
RR 1.49 (0.74 to 3.01) | 0.8% | 1.1% (0.6 to 2.3) | 0.4% more (0.2 fewer to 1.5 more) | ⨁⨁⨁◯ Moderatea | HD‐ICA/LABA likely results in little to no difference in severe exacerbations compared to MD‐ICS LABA. |
| Severe exacerbations ‐ MD TRIPLE vs MD‐ICS/LABA
№ of participants: 813
(1 RCT) Follow up: 12 months |
RR 1.00 (0.35 to 2.83) | 1.7% | 1.7% (0.6 to 4.9) | 0.0% fewer (1.1 fewer to 3.1 more) | ⨁⨁◯◯ Lowb, c | The evidence suggests that MD TRIPLE results in little to no difference in severe exacerbations compared to MD‐ICS/LABA. |
| Severe exacerbations ‐ HD TRIPLE vs MD‐ICS/LABA
№ of participants: 815
(1 RCT) Follow up: 12 months |
RR 0.57 (0.17 to 1.93) | 1.7% | 1.0% (0.3 to 3.3) | 0.7% fewer (1.4 fewer to 1.6 more) | ⨁⨁◯◯ Lowb, c | The evidence suggests that HD TRIPLE results in little to no difference in severe exacerbations compared to MD‐ICS/LABA. |
| Severe exacerbations ‐ MD TRIPLE vs HD‐ICS/LABA
№ of participants: 812
(1 RCT) Follow up: 12 months |
RR 1.40 (0.45 to 4.37) | 1.2% | 1.7% (0.6 to 5.4) | 0.5% more (0.7 fewer to 4.2 more) | ⨁⨁◯◯ Lowb, c | The evidence suggests that MD TRIPLE results in little to no difference in severe exacerbations compared to HD‐ICS/LABA. |
| Severe exacerbations ‐ HD TRIPLE vs HD‐ICS/LABA
№ of participants: 1727
(2 RCTs) Follow up: 12 months |
RR 0.80 (0.45 to 1.42) | 2.9% | 2.3% (1.3 to 4.1) | 0.6% fewer (1.6 fewer to 1.2 more) | ⨁⨁⨁◯ Moderateb | HD TRIPLE likely results in little to no difference in severe exacerbations compared to HD‐ICS LABA. |
| Severe exacerbations ‐ HD TRIPLE vs MD TRIPLE
№ of participants: 814
(1 RCT) Follow up: 12 months |
RR 0.57 (0.17 to 1.93) | 1.7% | 1.0% (0.3 to 3.3) | 0.7% fewer (1.4 fewer to 1.6 more) | ⨁⨁◯◯ Lowb, c | The evidence suggests that HD TRIPLE results in little to no difference in severe exacerbations compared to MD TRIPLE. |
| Severe exacerbations ‐ TRIPLE vs DUAL
№ of participants: 2540
(2 RCTs) Follow up: 12 months |
RR 0.84 (0.51 to 1.40) | 2.5% | 2.1% (1.3 to 3.5) | 0.4% fewer (1.2 fewer to 1 more) | ⨁⨁⨁◯ Moderated | TRIPLE likely results in little to no difference in severe exacerbations compared to DUAL. |
| Moderate to severe exacerbations ‐ HD‐ICS/LABA vs MD‐ICS/LABA
№ of participants: 5452
(6 RCTs) Follow up: 3 to 12 months |
RR 0.93 (0.82 to 1.05) | 15.0% | 14.0% (12.3 to 15.8) | 1.1% fewer (2.7 fewer to 0.8 more) | ⨁⨁⨁⨁ High | HD‐ICS/LABA results in little to no difference in moderate to severe exacerbations compared to MD‐ICS/LABA. |
| Moderate to severe exacerbations ‐ MD TRIPLE vs MD‐ICS/LABA
№ of participants: 3184
(3 RCTs) Follow up: 12 months |
RR 0.86 (0.75 to 0.99) | 22.8% | 19.6% (17.1 to 22.6) | 3.2% fewer (5.7 fewer to 0.2 fewer) | ⨁⨁⨁◯ Moderateb | MD TRIPLE likely reduces moderate to severe exacerbations compared to MD‐ICS/LABA. |
| Moderate to severe exacerbations ‐ HD TRIPLE vs MD‐ICS/LABA
№ of participants: 2037
(2 RCTs) Follow up: 12 months |
RR 0.78 (0.66 to 0.92) | 24.0% | 18.7% (15.8 to 22) | 5.3% fewer (8.1 fewer to 1.9 fewer) | ⨁⨁⨁⨁ High | HD TRIPLE reduces moderate to severe exacerbations compared to MD‐ICS/LABA. |
| Moderate to severe exacerbations ‐ MD TRIPLE vs HD‐ICS/LABA
№ of participants: 2651
(2 RCTs) Follow up: 12 months |
RR 1.05 (0.78 to 1.41) | 23.4% | 24.6% (18.2 to 33) | 1.2% more (5.1 fewer to 9.6 more) | ⨁⨁◯◯ Lowa, d | MD TRIPLE may result in little to no difference in moderate to severe exacerbations compared to HD‐ICS/LABA. |
| Moderate to severe exacerbations ‐ HD TRIPLE vs HD‐ICS/LABA
№ of participants: 4989
(4 RCTs) Follow up: 12 months |
RR 0.83 (0.75 to 0.92) | 25.2% | 20.9% (18.9 to 23.2) | 4.3% fewer (6.3 fewer to 2 fewer) | ⨁⨁⨁⨁ High | HD TRIPLE reduces moderate to severe exacerbations compared to HD‐ICS/LABA. |
| Moderate to severe exacerbations ‐ HD TRIPLE vs MD TRIPLE
№ of participants: 3470
(3 RCTs) Follow up: 6 to 12 months |
RR 0.85 (0.72 to 1.01) | 15.2% | 12.9% (10.9 to 15.3) | 2.3% fewer (4.2 fewer to 0.2 more) | ⨁⨁⨁◯ Moderatee | HD TRIPLE likely results in a slight reduction in moderate to severe exacerbations compared to MD TRIPLE. |
| Moderate to severe exacerbations ‐ TRIPLE vs DUAL
№ of participants: 8173
(5 RCTs) Follow up: 12 months |
RR 0.85 (0.78 to 0.92) | 24.3% | 20.6% (18.9 to 22.3) | 3.6% fewer (5.3 fewer to 1.9 fewer) | ⨁⨁⨁⨁ High | TRIPLE reduces moderate to severe exacerbations compared to DUAL. |
| *The risk in the intervention group (and its 95% confidence interval) is based on the assumed risk in the comparison group and the relative effect of the intervention (and its 95% CI). | ||||||
| GRADE Working Group grades of evidence High certainty: we are very confident that the true effect lies close to that of the estimate of the effect. Moderate certainty: we are moderately confident in the effect estimate: the true effect is likely to be close to the estimate of the effect, but there is a possibility that it is substantially different. Low certainty: our confidence in the effect estimate is limited: the true effect may be substantially different from the estimate of the effect. Very low certainty: we have very little confidence in the effect estimate: the true effect is likely to be substantially different from the estimate of effect. | ||||||
|
Explanations a. Substantial heterogeneity I2 > 50% to 90% b. Optimal information size is not met (Guyatt 2011b) c. Total size of less than 1000 participants may suggest small study effect (Dechartres 2013) d. Confidence interval includes a clinically important difference. e. Confidence interval includes the null effect. | ||||||
CI: confidence interval; HD: high dose; ICS: inhaled corticosteroids; LABA: long‐acting beta2 agonist; MD: medium dose; RCT: randomised controlled trial; RR: risk ratio.
Summary of findings 3. NMA Summary of Findings for moderate to severe (steroid‐requiring) exacerbations.
|
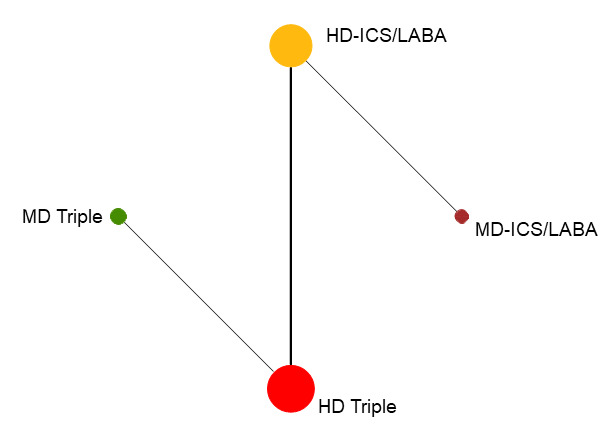
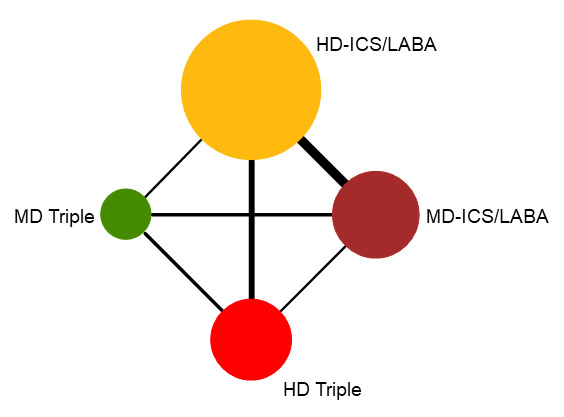
Patient or population: Adolescents and adults with symptomatic asthma Interventions: HD‐ICS/LABA, MD‐TRIPLE, HD‐TRIPLE Comparator (reference): Medium‐Dose ICS/LABA (MD‐ICS/LABA) Outcome: Moderate to severe exacerbations Setting(s): Outpatient |
Geometry of the Network in Figure 2* | |||||
|
Total studies: 10 RCTs Total Participants: 12407 |
Hazard ratio** (95% CrI) |
Anticipated absolute effect at the end of 1 year***(95% CrI) | Certainty of the evidence |
Ranking**** (95% CrI) |
Interpretation of Findings | |
| With intervention | Difference compared to MD‐ICS/LABA | |||||
| HD‐ICS/LABA (Direct evidence; 6 RCTs; 5452 participants) |
0.90 (0.77 to 1.04) |
176 per 1000 | 20 per 1000 fewer (from 45 fewer to 8 more) |
⊕⊕⊕⊕ High |
3.0 (2.0 to 4.0) |
Little or no difference |
| MD‐TRIPLE (Direct evidence; 3 RCTs; 3184 participants) |
0.84 (0.71 to 0.99) |
165 per 1000 | 31 per 1000 fewer (from 2 fewer to 57 fewer) |
⊕⊕⊕◯ Moderate Due to imprecision1 |
2.0 (2.0 to 3.0) |
Probably superior |
| HD‐TRIPLE (Direct evidence; 2 RCTs; 2037 participants) |
0.69 (0.58 to 0.82) |
135 per 1000 | 61 per 1000 fewer (from 35 fewer to 82 fewer) |
⊕⊕⊕⊕ High |
1.0 (1.0 to 1.0) |
Superior |
| MD‐ICS/LABA | Reference Comparator | 196 per 10002 | Reference Comparator | Reference Comparator |
4.0 (3.0 to 4.0) |
Reference Comparator |
| HD Triple vs. MD Triple | ||||||
| HD‐TRIPLE (Direct evidence; 3 RCTs; 3470 participants) |
0.83 (0.69 to 0.996) |
162 per 1000 | 34 per 1000 fewer (from 1 fewer to 61 fewer) |
⊕⊕⊕◯ Moderate Due to imprecision1 |
NA | Probably superior |
| MD Triple | Reference Comparator | 196 per 10003 | Reference Comparator | Reference Comparator | NA | Reference Comparator |
|
NMA‐SoF table definitions * The size of the nodes and the thickness of edges depend on the number of people randomised and the number of trials conducted, respectively. ** Network Meta‐Analysis estimates are reported as hazard ratio. Results are expressed in credible intervals as opposed to the confidence intervals since a Bayesian analysis has been conducted. *** Anticipated absolute effect (exacerbation rate at 1 year). Anticipated absolute effect compares two rates by calculating the difference between the rates of the intervention group with the rate of MD‐ICS/LABA group. **** Median and credible intervals are presented. Rank statistics is defined as the probabilities that a treatment out of n treatments in a network meta‐analysis is the best, the second, the third and so on until the least effective treatment. | ||||||
|
GRADE Working Group grades of evidence (or certainty in the evidence) High certainty: We are very confident that the true effect lies close to that of the estimate of the effect Moderate certainty: We are moderately confident in the effect estimate: The true effect is likely to be close to the estimate of the effect, but there is a possibility that it is substantially different Low certainty: Our confidence in the effect estimate is limited: The true effect may be substantially different from the estimate of the effect Very low certainty: We have very little confidence in the effect estimate: The true effect is likely to be substantially different from the estimate of effect | ||||||
|
Explanatory Footnotes 1 Serious imprecision. Due to suboptimal sample size(s) in the direct and/or indirect estimate(s). 2 Based on the average rate in participants treated with MD‐ICS/LABA in the included studies. 3 Based on the average rate in participants treated with MD Triple in the included studies. | ||||||
CrI: credible interval; HD: high dose; ICS: inhaled corticosteroids; LABA: long‐acting beta‐2 agonist; MD: medium dose; NA: not applicable; NMA: network meta‐analysis; RCT: randomised controlled trial.
2.
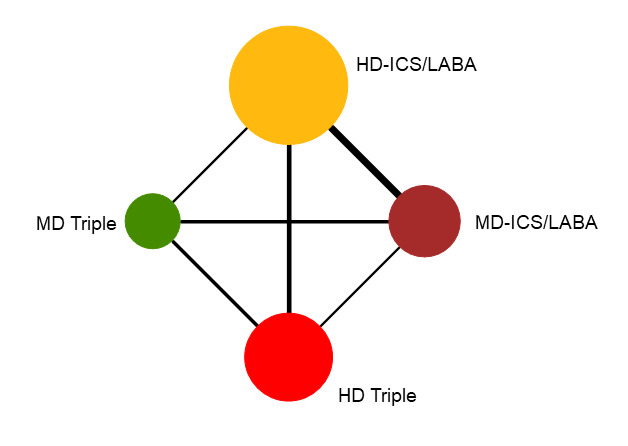
Network diagram for moderate to severe exacerbations for grouped interventions.
The size of the nodes and the thickness of edges depend on the number of people randomised and the number of trials conducted. HD: high dose; ICS: inhaled corticosteroids; LABA: long‐acting beta‐2 agonist; MD: medium dose.
Summary of findings 4. NMA Summary of Findings for change from baseline in ACQ scores at 3 months.
|
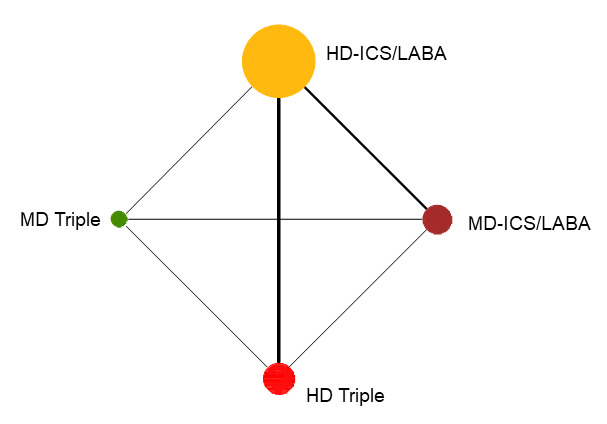
Patient or population: Adolescents and adults with symptomatic asthma Interventions: HD‐ICS/LABA, MD‐TRIPLE, HD‐TRIPLE Comparator (reference): Medium‐Dose ICS/LABA (MD‐ICS/LABA) Outcome: Change from baseline in ACQ scores at 3 months Setting(s): Outpatient |
Geometry of the Network in Figure 3* | |||||
|
Total studies: 4 RCTs Total Participants: 4529 |
Relative effect (95% CrI) |
Anticipated absolute effect**(95% CrI) | Certainty of the evidence |
Ranking*** (95% CrI) |
Interpretation of Findings | |
| With intervention | Difference compared to MD‐ICS/LABA1 | |||||
| HD‐ICS/LABA (Direct evidence; 3 RCTs; 2450 participants) |
0.01 (‐0.05 to 0.07) |
0.72 (0.67 to 0.78) |
Change from baseline in ACQ score was 0.01 lower (0.07 lower to 0.05 higher) | ⨁⨁⨁◯ Moderate Due to imprecision2 |
4.0 (2.0 to 4.0) |
Probably little or no clinically meaningful difference4 |
| MD‐TRIPLE (Direct evidence; 1 RCT; 768 participants) |
‐0.06 (‐0.14 to 0.03) |
0.78 (0.70 to 0.87) |
Change from baseline in ACQ score was 0.06 higher (0.03 lower to 0.14 higher) | ⊕⊕◯◯ Low Due to imprecision3 |
2.0 (1.0 to 4.0) |
Suggest little or no clinically meaningful difference4 |
| HD‐TRIPLE (Direct evidence; 1 RCT; 764 participants) |
‐0.09 (‐0.18 to ‐ 0.01) |
0.82 (0.74 to 0.90) |
Change from baseline in ACQ score was 0.09 higher (0.01 higher to 0.18 higher) | ⊕⊕◯◯ Low Due to imprecision3 |
1.0 (1.0 to 2.0) |
Suggest little or no clinically meaningful difference4 |
| MD‐ICS/LABA | Reference Comparator1 | 0.72 | Reference Comparator | Reference Comparator |
3.0 (2.0 to 4.0) |
Reference Comparator |
|
NMA‐SoF table definitions * The size of the nodes and the thickness of edges depend on the number of people randomised and the number of trials conducted, respectively. ** Estimates are reported as mean difference and credible interval (CrI). Results are expressed in credible intervals as opposed to the confidence intervals since a Bayesian analysis has been conducted. *** Ranking and confidence intervals for efficacy outcome are presented. Rank statistics is defined as the probabilities that a treatment out of n treatments in a network meta‐analysis is the best, the second, the third and so on until the least effective treatment. | ||||||
|
GRADE Working Group grades of evidence (or certainty in the evidence) High certainty: We are very confident that the true effect lies close to that of the estimate of the effect Moderate certainty: We are moderately confident in the effect estimate: The true effect is likely to be close to the estimate of the effect, but there is a possibility that it is substantially different Low certainty: Our confidence in the effect estimate is limited: The true effect may be substantially different from the estimate of the effect Very low certainty: We have very little confidence in the effect estimate: The true effect is likely to be substantially different from the estimate of effect | ||||||
|
Explanatory Footnotes 1 The mean change from baseline in ACQ scores was 0.72with MD‐ICS/LABA. 2 Serious imprecision. Due to small sample sizes in the direct and/or indirect estimate(s). 3 Very serious imprecision. Due to very small sample sizes in the direct and/or indirect estimate(s). 4 Minimal clinically important difference is 0.5. | ||||||
ACQ: Asthma Control Questionnaire; CrI: credible interval; HD: high dose; ICS: inhaled corticosteroids; LABA: long‐acting beta‐2 agonist; MD: medium dose; NMA: network meta‐analysis; RCT: randomised controlled trial.
3.
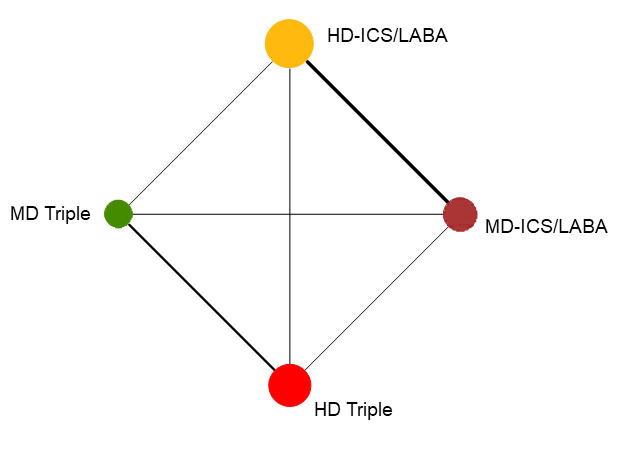
Network diagram for change from baseline ACQ score at 3 months for grouped interventions.
The size of the nodes and the thickness of edges depend on the number of people randomised and the number of trials conducted. HD: high dose; ICS: inhaled corticosteroids; LABA: long‐acting beta‐2 agonist; MD: medium dose.
Summary of findings 5. NMA Summary of Findings for change from baseline in ACQ scores at 6 months.
|
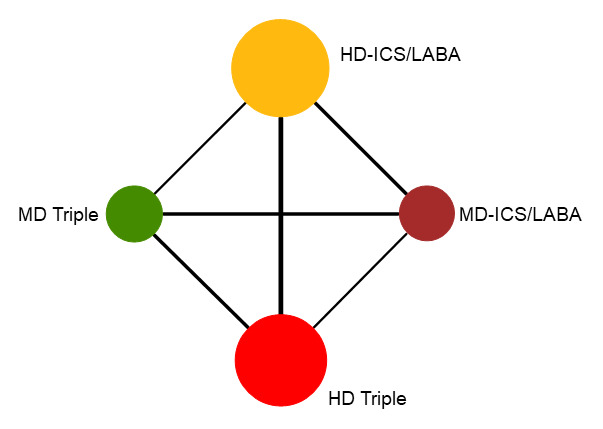
Patient or population: Adolescents and adults with symptomatic asthma Interventions: HD‐ICS/LABA, MD‐TRIPLE, HD‐TRIPLE Comparator (reference): Medium‐Dose ICS/LABA (MD‐ICS/LABA) Outcome: Change from baseline in ACQ scores at 6 months Setting(s): Outpatient |
Geometry of the Network in Figure 4* | |||||
|
Total studies: 6 RCTs Total Participants: 7957 |
Relative effect (95% CrI) |
Anticipated absolute effect**(95% CrI) | Certainty of the evidence |
Ranking*** (95% CrI) |
Interpretation of Findings | |
| With intervention | Difference compared to MD‐ICS/LABA1 | |||||
| HD‐ICS/LABA (Direct evidence; 3 RCTs; 3762 participants) |
‐0.03 (‐0.09 to 0.02) |
0.90 (0.84 to 0.95) |
Change from baseline in ACQ score was 0.03 higher (0.02 lower to 0.09 higher) | ⊕⊕⊕◯ Moderate Due to imprecision2 |
3.0 (2.0 to 4.0) |
Probably little or no clinically meaningful difference3 |
| MD‐TRIPLE (Direct evidence; 2 RCTs; 1961 participants) |
‐0.07 (‐0.13 to 0.00) |
0.93 (0.86 to 1.00) |
Change from baseline in ACQ score was 0.07 higher (0.00 lower to 0.13 higher) | ⊕⊕⊕◯ Moderate Due to imprecision2 |
2.0 (1.0 to 3.0) |
Probably little or no clinically meaningful difference3 |
| HD‐TRIPLE (Direct evidence; 2 RCTs; 1952 participants) |
‐0.10 (‐0.16 to ‐0.03) |
0.96 (0.90 to 1.02) |
Change from baseline in ACQ score was 0.1 higher (0.03 higher to 0.16 higher) | ⊕⊕⊕◯ Moderate Due to imprecision2 |
1.0 (1.0 to 2.0) |
Probably little or no clinically meaningful difference3 |
| MD‐ICS/LABA | Reference Comparator1 | 0.86 | Reference Comparator | Reference Comparator |
4.0 (3.0 to 4.0) |
Reference Comparator |
|
NMA‐SoF table definitions * The size of the nodes and the thickness of edges depend on the number of people randomised and the number of trials conducted, respectively. ** Estimates are reported as mean difference and credible interval (CrI). Results are expressed in credible intervals as opposed to the confidence intervals since a Bayesian analysis has been conducted. *** Ranking and confidence intervals for efficacy outcome are presented. Rank statistics is defined as the probabilities that a treatment out of n treatments in a network meta‐analysis is the best, the second, the third and so on until the least effective treatment. | ||||||
|
GRADE Working Group grades of evidence (or certainty in the evidence) High certainty: We are very confident that the true effect lies close to that of the estimate of the effect Moderate certainty: We are moderately confident in the effect estimate: The true effect is likely to be close to the estimate of the effect, but there is a possibility that it is substantially different Low certainty: Our confidence in the effect estimate is limited: The true effect may be substantially different from the estimate of the effect Very low certainty: We have very little confidence in the effect estimate: The true effect is likely to be substantially different from the estimate of effect | ||||||
|
Explanatory Footnotes 1 The mean change from baseline in ACQ scores was 0.86 with MD‐ICS/LABA. 2 Serious imprecision due to small sample sizes in the direct and/or indirect estimate(s). 3 Minimal clinically important difference is 0.5. | ||||||
ACQ: Asthma Control Questionnaire; CrI: credible interval; HD: high dose; ICS: inhaled corticosteroids; LABA: long‐acting beta2 agonist; MD: medium dose; NMA: network meta‐analysis; RCT: randomised controlled trial.
4.
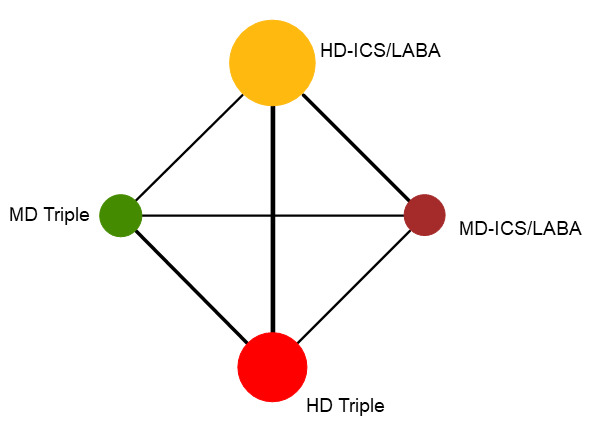
Network diagram for change from baseline ACQ score at 6 months for grouped interventions.
The size of the nodes and the thickness of edges depend on the number of people randomised and the number of trials conducted. HD: high dose; ICS: inhaled corticosteroids; LABA: long‐acting beta‐2 agonist; MD: medium dose.
Summary of findings 6. NMA Summary of Findings for change from baseline in ACQ scores at 12 months.
|
Patient or population: Adolescents and adults with symptomatic asthma Interventions: HD‐ICS/LABA, MD‐TRIPLE, HD‐TRIPLE Comparator (reference): Medium‐Dose ICS/LABA (MD‐ICS/LABA) Outcome: Change from baseline in ACQ scores at 12 months Setting(s): Outpatient |
Geometry of the Network in Figure 5* | ||||||
|
Total studies: 5 RCTs Total Participants: 5440 |
Relative effect (95% CrI) |
Anticipated absolute effect**(95% CrI) | Certainty of the evidence |
Ranking*** (95% CrI) |
Interpretation of Findings | ||
| With intervention | Difference compared to MD‐ICS/LABA1 | ||||||
| HD‐ICS/LABA (Direct evidence; 3 RCTs; 3152 participants) |
0.00 (‐0.06 to 0.06) |
1.00 (0.94 to 1.06) |
Change from baseline in ACQ score was 0.00 (0.06 lower to 0.06 higher) | ⊕⊕⊕◯ Moderate Due to imprecision2 |
3.0 (2.0 to 4.0) |
Probably little or no clinically meaningful difference3 | |
| MD‐TRIPLE (Direct evidence; 2 RCTs; 1366 participants) |
0.02 (‐0.07 to 0.11) |
0.98 (0.89 to 1.07) |
Change from baseline in ACQ score was 0.08 higher (0.01 lower to 0.17 higher) | ⊕⊕⊕◯ Moderate Due to imprecision2 |
4.0 (2.0 to 4.0) |
Probably little or no clinically meaningful difference3 | |
| HD‐TRIPLE (Direct evidence; 2 RCTs; 1379 participants) |
‐0.08 (‐0.16 to 0.00) |
1.08 (1.00 to 1.16) |
Change from baseline in ACQ score was 0.08 higher (0.00 lower to 0.16 higher) | ⊕⊕⊕◯ Moderate Due to imprecision2 |
1.0 (1.0 to 2.0) |
Probably little or no clinically meaningful difference3 | |
| MD‐ICS/LABA | Reference Comparator1 | 1.00 | Reference Comparator | Reference Comparator |
3.0 (2.0 to 4.0) |
Reference Comparator | |
|
NMA‐SoF table definitions * The size of the nodes and the thickness of edges depend on the number of people randomised and the number of trials conducted, respectively. ** Estimates are reported as mean difference and credible interval (CrI). Results are expressed in credible intervals as opposed to the confidence intervals since a Bayesian analysis has been conducted. *** Ranking and confidence intervals for efficacy outcome are presented. Rank statistics is defined as the probabilities that a treatment out of n treatments in a network meta‐analysis is the best, the second, the third and so on until the least effective treatment. | |||||||
|
GRADE Working Group grades of evidence (or certainty in the evidence) High certainty: We are very confident that the true effect lies close to that of the estimate of the effect Moderate certainty: We are moderately confident in the effect estimate: The true effect is likely to be close to the estimate of the effect, but there is a possibility that it is substantially different Low certainty: Our confidence in the effect estimate is limited: The true effect may be substantially different from the estimate of the effect Very low certainty: We have very little confidence in the effect estimate: The true effect is likely to be substantially different from the estimate of effect | |||||||
|
Explanatory Footnotes 1 The mean change from baseline in ACQ scores was 1.00with MD‐ICS/LABA. 2 Serious imprecision due to small sample sizes in the direct and/or indirect estimate(s). 3 Minimal clinically important difference is 0.5. | |||||||
ACQ: Asthma Control Questionnaire; CrI: credible interval; HD: high dose; ICS: inhaled corticosteroids; LABA: long‐acting beta2 agonist; MD: medium dose; NMA: network meta‐analysis; RCT: randomised controlled trial.
5.
Network diagram for change from baseline ACQ score at 12 months for grouped interventions.
The size of the nodes and the thickness of edges depend on the number of people randomised and the number of trials conducted. HD: high dose; ICS: inhaled corticosteroids; LABA: long‐acting beta‐2 agonist; MD: medium dose.
Summary of findings 7. Asthma Control Questionnaire: change from baseline ‐ pairwise comparisons ‡.
| Outcome № of participants (studies) | Relative effect (95% CI) | Anticipated absolute effects (95% CI)* | Certainty of the evidence | What happens† | |
| With active control | Difference | ||||
| CFB in ACQ at 3 months ‐ HD‐ICS/LABA vs MD‐ICS/LABA № of participants: 2450 (3 RCTs) | ‐ | ‐0.72 | MD 0.01 higher (0.05 lower to 0.07 higher) | ⨁⨁⨁◯ Moderatea | HD‐ICS/LABA likely results in little to no difference in CFB in ACQ at 3 months compared to MD‐ICS/LABA. |
| CFB in ACQ at 3 months ‐ MD TRIPLE vs MD‐ICS/LABA № of participants: 768 (1 RCT) | ‐ | ‐0.58 | MD 0.06 lower (0.16 lower to 0.04 higher) | ⨁⨁◯◯ Lowa, b | The evidence suggests that MD TRIPLE results in little to no difference in CFB in ACQ at 3 months compared to MD‐ICS/LABA. |
| CFB in ACQ at 3 months ‐ HD TRIPLE vs MD‐ICS/LABA № of participants: 764 (1 RCT) | ‐ | ‐0.58 | MD 0.12 lower (0.22 lower to 0.02 lower) | ⨁⨁◯◯ Lowa, b | The evidence suggests that HD TRIPLE results in little to no difference in CFB in ACQ at 3 months compared to MD‐ICS/LABA. |
| CFB in ACQ at 3 months ‐ MD TRIPLE vs HD‐ICS/LABA № of participants: 771 (1 RCT) | ‐ | ‐0.61 | MD 0.04 lower (0.14 lower to 0.06 higher) | ⨁⨁◯◯ Lowa, b | The evidence suggests that MD TRIPLE results in little to no difference in CFB in ACQ at 3 months compared to HD‐ICS/LABA. |
| CFB in ACQ at 3 months ‐ HD TRIPLE vs HD‐ICS/LABA № of participants: 767 (1 RCT) | ‐ | ‐0.61 | MD 0.09 lower (0.19 lower to 0.01 higher) | ⨁⨁◯◯ Lowa, b | The evidence suggests that HD TRIPLE results in little to no difference in CFB in ACQ at 3 months compared to HD‐ICS/LABA. |
| CFB in ACQ at 3 months ‐ HD TRIPLE vs MD TRIPLE № of participants: 2079 (2 RCTs) | ‐ | ‐0.85 | MD 0.04 lower (0.11 lower to 0.03 higher) | ⨁⨁⨁◯ Moderatea | HD TRIPLE likely results in little to no difference in CFB in ACQ at 3 months compared to MD TRIPLE. |
| CFB in ACQ at 3 months ‐ TRIPLE vs DUAL № of participants: 1535 (1 RCT) | ‐ | ‐0.59 | MD 0.08 lower (0.15 lower to 0.01 lower) | ⨁⨁⨁◯ Moderatea | TRIPLE likely results in little to no difference in CFB in ACQ at 3 months compared to DUAL. |
| CFB in ACQ at 6 months ‐ HD‐ICS/LABA vs MD‐ICS/LABA № of participants: 3762 (3 RCTs) | ‐ | ‐0.86 | MD 0.04 lower (0.12 lower to 0.04 higher) | ⨁⨁⨁◯ Moderatec | HD‐ICS/LABA likely results in little to no difference in CFB in ACQ at 6 months compared to MD‐ICS/LABA. |
| CFB in ACQ at 6 months ‐ MD TRIPLE vs MD‐ICS/LABA № of participants: 1961 (2 RCTs) | ‐ | ‐0.79 | MD 0.09 lower (0.17 lower to 0.02 lower) | ⨁⨁⨁◯ Moderatea | MD TRIPLE likely results in little to no difference in CFB in ACQ at 6 months compared to MD‐ICS/LABA. |
| CFB in ACQ at 6 months ‐ HD TRIPLE vs MD‐ICS/LABA № of participants: 1952 (2 RCTs) | ‐ | ‐0.79 | MD 0.11 lower (0.18 lower to 0.04 lower) | ⨁⨁⨁◯ Moderatea | HD TRIPLE likely results in little to no difference in CFB in ACQ at 6 months compared to MD‐ICS/LABA. |
| CFB in ACQ at 6 months ‐ MD TRIPLE vs HD‐ICS/LABA № of participants: 2561 (2 RCTs) | ‐ | ‐0.91 | MD 0.01 lower (0.08 lower to 0.06 higher) | ⨁⨁⨁◯ Moderatea | MD TRIPLE likely results in little to no difference in CFB in ACQ at 6 months compared to HD‐ICS/LABA. |
| CFB in ACQ at 6 months ‐ HD TRIPLE vs HD‐ICS/LABA № of participants: 3459 (3 RCTs) | ‐ | ‐0.82 | MD 0.06 lower (0.15 lower to 0.03 higher) | ⨁⨁◯◯ Lowa, c | The evidence suggests that HD TRIPLE results in little to no difference in CFB in ACQ at 6 months compared to HD‐ICS/LABA. |
| CFB in ACQ at 6 months ‐ HD TRIPLE vs MD TRIPLE № of participants: 3288 (3 RCTs) | ‐ | ‐0.94 | MD 0.02 lower (0.08 lower to 0.04 higher) | ⨁⨁⨁◯ Moderatea | HD TRIPLE likely results in little to no difference in CFB in ACQ at 6 months compared to MD‐ICS/LABA. |
| CFB in ACQ at 6 months ‐ TRIPLE vs DUAL № of participants: 5408 (4 RCTs) | ‐ | ‐0.81 | MD 0.07 lower (0.14 lower to 0.01 lower) | ⨁⨁⨁◯ Moderatea | TRIPLE likely results in little to no difference in CFB in ACQ at 6 months compared to DUAL. |
| CFB in ACQ at 12 months ‐ HD‐ICS/LABA vs MD‐ICS/LABA № of participants: 3152 (3 RCTs) | ‐ | ‐1.00 | MD 0 (0.12 lower to 0.12 higher) | ⨁⨁◯◯ Lowa, c, d | The evidence suggests that HD‐ICS/LABA results in little to no difference in CFB in ACQ at 12 months compared to MD‐ICS/LABA. |
| CFB in ACQ at 12 months ‐ MD TRIPLE vs MD‐ICS/LABA № of participants: 1366 (2 RCTs) | ‐ | ‐0.93 | MD 0.01 lower (0.11 lower to 0.08 higher) | ⨁⨁⨁◯ Moderatea, d | MD TRIPLE likely results in little to no difference in CFB in ACQ at 12 months compared to MD‐ICS/LABA. |
| CFB in ACQ at 12 months ‐ HD TRIPLE vs MD‐ICS/LABA № of participants: 1379 (2 RCTs) | ‐ | ‐0.93 | MD 0.09 lower (0.23 lower to 0.06 higher) | ⨁⨁⨁◯ Moderatea, d | HD TRIPLE likely results in little to no difference in CFB in ACQ at 12 months compared to MD‐ICS/LABA. |
| CFB in ACQ at 12 months ‐ MD TRIPLE vs HD‐ICS/LABA № of participants: 1967 (2 RCTs) | ‐ | ‐1.03 | MD 0.01 higher (0.2 lower to 0.21 higher) | ⨁⨁◯◯ Lowa, c, d | The evidence suggests that MD TRIPLE results in little to no difference in CFB in ACQ at 12 months compared to HD‐ICS/LABA. |
| CFB in ACQ at 12 months ‐ HD TRIPLE vs HD‐ICS/LABA № of participants: 2887 (3 RCTs) | ‐ | ‐0.89 | MD 0.07 lower (0.15 lower to 0) | ⨁⨁⨁◯ Moderatea, d | HD TRIPLE likely results in little to no difference in CFB in ACQ at 12 months compared to HD‐ICS/LABA. |
| CFB in ACQ at 12 months ‐ HD TRIPLE vs MD TRIPLE № of participants: 1381 (2 RCTs) | ‐ | ‐0.94 | MD 0.07 lower (0.23 lower to 0.09 higher) | ⨁⨁⨁◯ Moderatea, d | HD TRIPLE likely results in little to no difference in CFB in ACQ at 12 months compared to MD TRIPLE. |
| CFB in ACQ at 12 months ‐ DUAL vs TRIPLE № of participants: 4253 (4 RCTs) | ‐ | ‐0.91 | MD 0.04 lower (0.1 lower to 0.02 higher) | ⨁⨁⨁◯ Moderatea, d | TRIPLE likely results in little to no difference in CFB in ACQ at 12 months compared to DUAL. |
| ‡ ACQ scores range from 0 to 6 with lower scores indicating better asthma control. *The effect in the intervention group (and its 95% confidence interval) is based on the assumed effect in the comparison group and the relative effect of the intervention (and its 95% CI). † Minimal Clinically Important Difference is 0.5 | |||||
| GRADE Working Group grades of evidence High certainty: we are very confident that the true effect lies close to that of the estimate of the effect. Moderate certainty: we are moderately confident in the effect estimate: the true effect is likely to be close to the estimate of the effect, but there is a possibility that it is substantially different. Low certainty: our confidence in the effect estimate is limited: the true effect may be substantially different from the estimate of the effect. Very low certainty: we have very little confidence in the effect estimate: the true effect is likely to be substantially different from the estimate of effect. | |||||
|
Explanations a. Optimal information size is not met (Guyatt 2011b) b. Total size of less than 1000 participants may suggest small study effect (Dechartres 2013) c. Substantial heterogeneity I2 > 50% to 90% d. Lee 2020 had very high attrition rates and is considered at high risk of bias. However, excluding the study did not change the results. | |||||
ACQ:Asthma Control Questionnaire; CFB: change from baseline; CI: confidence interval; HD: high dose; ICS: inhaled corticosteroids; LABA: long‐acting beta2 agonist; MD: mean difference; MD: medium dose; RCT: randomised controlled trial.
Summary of findings 8. NMA Summary of Findings for change from baseline in AQLQ scores at 6 months.
|
Patient or population: Adolescents and adults with symptomatic asthma Interventions: HD‐ICS/LABA, MD‐TRIPLE, HD‐TRIPLE Comparator (reference): Medium‐Dose ICS/LABA (MD‐ICS/LABA) Outcome: Change from baseline in AQLQ score at 6 months Setting(s): Outpatient |
Geometry of the Network in Figure 6* | |||||
|
Total studies: 4 RCTs Total Participants: 3454 |
Relative effect (95% CrI) |
Anticipated absolute effect**(95% CrI) | Certainty of the evidence |
Ranking*** (95% CrI) |
Interpretation of Findings | |
| With intervention | Difference compared to MD‐ICS/LABA1 | |||||
| HD‐ICS/LABA (Direct evidence; 1 RCT; 1223 participants) |
‐0.06 (‐0.14 to 0.03) |
0.71 (0.63 to 0.80) |
Change from baseline in AQLQ score was 0.06 lower (0.14 lower to 0.03 higher) | ⊕⊕⊕◯ Moderate Due to imprecision2 |
4.0 (2.0 to 4.0) |
Probably little or no clinically meaningful difference4 |
| MD‐TRIPLE (Direct evidence; 0 RCTs; 0 participants) |
0.03 (‐0.23 to 0.29) |
0.80 (0.54 to 1.06) |
Change from baseline in AQLQ score was 0.03 higher (0.23 lower to 0.29 higher) | ⊕⊕◯◯ Low Due to imprecision3 |
2.0 (1.0 to 4.0) |
Suggest little or no clinically meaningful difference4 |
| HD‐TRIPLE (Direct evidence; 0 RCTs; 0 participants) |
0.11 (‐0.09 to 0.30) |
0.88 (0.68 to 1.07) |
Change from baseline in AQLQ score was 0.11 higher (0.09 lower to 0.30 higher) | ⊕⊕◯◯ Low Due to imprecision3 |
1.0 (1.0 to 3.0) |
Suggest little or no clinically meaningful difference4 |
| MD‐ICS/LABA | Reference Comparator1 | 0.77 | Reference Comparator | Reference Comparator |
3.0 (1.0 to 4.0) |
Reference Comparator |
|
NMA‐SoF table definitions * The size of the nodes and the thickness of edges depend on the number of people randomised and the number of trials conducted. ** Estimates are reported as mean difference and credible interval (CrI). Results are expressed in credible intervals as opposed to the confidence intervals since a Bayesian analysis has been conducted. *** Ranking and confidence intervals for efficacy outcome are presented. Rank statistics is defined as the probabilities that a treatment out of n treatments in a network meta‐analysis is the best, the second, the third and so on until the least effective treatment. | ||||||
|
GRADE Working Group grades of evidence (or certainty in the evidence) High certainty: We are very confident that the true effect lies close to that of the estimate of the effect Moderate certainty: We are moderately confident in the effect estimate: The true effect is likely to be close to the estimate of the effect, but there is a possibility that it is substantially different Low certainty: Our confidence in the effect estimate is limited: The true effect may be substantially different from the estimate of the effect Very low certainty: We have very little confidence in the effect estimate: The true effect is likely to be substantially different from the estimate of effect | ||||||
|
Explanatory Footnotes 1 The mean change from baseline in AQLQ scores was 0.77 with MD‐ICS/LABA. 2 Serious imprecision due to small sample sizes in the direct and/or indirect estimate(s). 3 Very serious imprecision due to very small sample sizes in the indirect estimate. 4 Minimal clinically important difference is 0.5. | ||||||
AQLQ: Asthma Quality of Life Questionnaire; CrI: credible interval; HD: high dose; ICS: inhaled corticosteroids; LABA: long‐acting beta2 agonist; MD: medium dose; NMA: network meta‐analysis; RCT: randomised controlled trial.
6.
Network diagram for change from baseline AQLQ scores at 6 months for grouped interventions.
The size of the nodes and the thickness of edges depend on the number of people randomised and the number of trials conducted. HD: high dose; ICS: inhaled corticosteroids; LABA: long‐acting beta‐2 agonist; MD: medium dose.
Summary of findings 9. NMA Summary of Findings for change from baseline in AQLQ scores at 12 months.
|
Patient or population: Adolescents and adults with symptomatic asthma Interventions: HD‐ICS/LABA, MD‐TRIPLE, HD‐TRIPLE Comparator (reference): Medium‐Dose ICS/LABA (MD‐ICS/LABA) Outcome: Change from baseline in AQLQ score at 12 months Setting(s): Outpatient |
Geometry of the Network in Figure 7* | ||||||
|
Total studies: 4 RCTs Total Participants: 4809 |
Relative effect (95% CrI) |
Anticipated absolute effect**(95% CrI) | Certainty of the evidence |
Ranking*** (95% CrI) |
Interpretation of Findings | ||
| With intervention | Difference compared to MD‐ICS/LABA1 | ||||||
| HD‐ICS/LABA (Direct evidence; 2 RCTs; 2815 participants) |
‐0.02 (‐0.09 to 0.04) |
0.81 (0.74 to 0.87) |
Change from baseline in AQLQ score was 0.02 lower (0.09 lower to 0.04 higher) | ⊕⊕⊕◯ Moderate Due to imprecision2 |
3.0 (2.0 to 4.0) |
Probably little or no clinically meaningful difference3 | |
| MD‐TRIPLE (Direct evidence; 1 RCT; 1071 participants) |
‐0.08 (‐0.17 to 0.02) |
0.75 (0.66 to 0.85) |
Change from baseline in AQLQ score was 0.08 lower (0.17 lower to 0.12 higher) | ⊕⊕⊕◯ Moderate Due to imprecision2 |
4.0 (2.0 to 4.0) |
Probably little or no clinically meaningful difference3 | |
| HD‐TRIPLE (Direct evidence; 1 RCT; 1088 participants) |
0.05 (‐0.04 to 0.13) |
0.88 (0.79 to 0.13) |
Change from baseline in AQLQ score was 0.05 higher (0.04 lower to 0.13 higher) | ⊕⊕⊕◯ Moderate Due to imprecision2 |
1.0 (1.0 to 3.0) |
Probably little or no clinically meaningful difference3 | |
| MD‐ICS/LABA | Reference Comparator1 | 0.83 | Reference Comparator | Reference Comparator |
2.0 (1.0 to 4.0) |
Reference Comparator | |
|
NMA‐SoF table definitions * The size of the nodes and the thickness of edges depend on the number of people randomised and the number of trials conducted, respectively. ** Estimates are reported as mean difference and credible interval (CrI). Results are expressed in credible intervals as opposed to the confidence intervals since a Bayesian analysis has been conducted. *** Ranking and confidence intervals for efficacy outcome are presented. Rank statistics is defined as the probabilities that a treatment out of n treatments in a network meta‐analysis is the best, the second, the third and so on until the least effective treatment. | |||||||
|
GRADE Working Group grades of evidence (or certainty in the evidence) High certainty: We are very confident that the true effect lies close to that of the estimate of the effect Moderate certainty: We are moderately confident in the effect estimate: The true effect is likely to be close to the estimate of the effect, but there is a possibility that it is substantially different Low certainty: Our confidence in the effect estimate is limited: The true effect may be substantially different from the estimate of the effect Very low certainty: We have very little confidence in the effect estimate: The true effect is likely to be substantially different from the estimate of effect | |||||||
|
Explanatory Footnotes 1 The mean change from baseline in ACQ scores was 0.83 with MD‐ICS/LABA. 2 Serious imprecision due to small sample sizes in the direct and/or indirect estimate(s). 3 Minimal clinically important difference is 0.5. | |||||||
AQLQ: Asthma Quality of Life Questionnaire; CrI: credible interval; HD: high dose; ICS: inhaled corticosteroids; LABA: long‐acting beta2 agonist; MD: medium dose; NMA: network meta‐analysis; RCT: randomised controlled trial.
7.
Network diagram for change from baseline AQLQ scores at 12 months for grouped interventions.
The size of the nodes and the thickness of edges depend on the number of people randomised and the number of trials conducted. HD: high dose; ICS: inhaled corticosteroids; LABA: long‐acting beta‐2 agonist; MD: medium dose.
Summary of findings 10. Asthma Quality of Life Questionnaire: change from baseline ‐ pairwise comparisons ‡.
| Outcome № of participants (studies) | Relative effect (95% CI) | Anticipated absolute effects (95% CI)* | Certainty of the evidence | What happens† | |
| With active control | Difference | ||||
| CFB in AQLQ at 6 months ‐ HD‐ICS/LABA vs MD‐ICS/LABA № of participants: 1223 (1 RCT) | ‐ | 0.77 | MD 0.06 lower (0.14 lower to 0.03 higher) | ⨁⨁⨁◯ Moderatea | HD‐ICS/LABA likely results in little to no difference in CFB in AQLQ at 6 months compared to MD‐ICS/LABA. |
| CFB in AQLQ at 6 months ‐ HD TRIPLE vs HD‐ICS/LABA № of participants: 907 (2 RCTs) | ‐ | 0.32 ‐ |
MD 0.16 higher (0.01 lower to 0.34 higher) | ⨁⨁◯◯ Lowa, b | The evidence suggests that HD TRIPLE results in little to no difference in CFB in AQLQ at 6 months compared to HD‐ICS/LABA. |
| CFB in AQLQ at 6 months ‐ HD TRIPLE vs MD TRIPLE № of participants: 1426 (1 RCT) | ‐ | 0.71 | MD 0.08 higher (0.09 lower to 0.25 higher) | ⨁⨁⨁◯ Moderatea | HD TRIPLE likely results in little to no difference in CFB in AQLQ at 6 months compared to MD‐ICS/LABA. |
| CFB in AQLQ at 6 months ‐ TRIPLE vs DUAL № of participants: 907 (2 RCTs) | ‐ | 0.32 | MD 0.16 higher (0.01 lower to 0.34 higher) | ⨁⨁◯◯ Lowa | The evidence suggests that TRIPLE results in little to no difference in CFB in AQLQ at 6 months compared to DUAL. |
| CFB in AQLQ at 12 months ‐ HD‐ICS/LABA vs MD‐ICS/LABA № of participants: 2815 (2 RCTs) | ‐ | 0.83 | MD 0.02 lower (0.08 lower to 0.04 higher) | ⨁⨁⨁◯ Moderatea | HD‐ICS/LABA likely results in little to no difference in CFB in AQLQ at 12 months compared to MD‐ICS/LABA. |
| CFB in AQLQ at 12 months ‐ MD TRIPLE vs MD‐ICS/LABA № of participants: 1071 (1 RCT) | ‐ | 0.81 | MD 0.05 lower (0.15 lower to 0.05 higher) | ⨁⨁⨁◯ Moderatea | MD TRIPLE likely results in little to no difference in CFB in AQLQ at 12 months compared to MD‐ICS/LABA. |
| CFB in AQLQ at 12 months ‐ HD TRIPLE vs MD‐ICS/LABA № of participants: 1088 (1 RCT) | ‐ | 0.81 | MD 0.06 higher (0.04 lower to 0.16 higher) | ⨁⨁⨁◯ Moderatea | HD TRIPLE likely results in little to no difference in CFB in AQLQ at 12 months compared to MD‐ICS/LABA. |
| CFB in AQLQ at 12 months ‐ MD TRIPLE vs HD‐ICS/LABA № of participants: 1628 (1 RCT) | ‐ | 0.83 | MD 0.07 lower (0.16 lower to 0.02 higher) | ⨁⨁⨁◯ Moderatea | HD‐ICS/LABA likely results in little to no difference in CFB in AQLQ at 12 months compared to MD‐ICS/LABA. |
| CFB in AQLQ at 12 months ‐ HD TRIPLE vs HD‐ICS/LABA № of participants: 2552 (3 RCTs) | ‐ | 0.70 | MD 0.06 higher (0.02 lower to 0.14 higher) | ⨁⨁⨁◯ Moderatea | MD TRIPLE likely results in little to no difference in CFB in AQLQ at 12 months compared to HD‐ICS/LABA. |
| CFB in AQLQ at 12 months ‐ HD TRIPLE vs MD TRIPLE № of participants: 1087 (1 RCT) | ‐ | 0.76 | MD 0.11 higher (0.01 higher to 0.21 higher) | ⨁⨁⨁◯ Moderatea | HD TRIPLE likely results in little to no difference in CFB in AQLQ at 12 months compared to MD TRIPLE. |
| CFB in AQLQ at 12 months ‐ TRIPLE vs DUAL № of participants: 3623 (3 RCTs) | ‐ | 0.73 | MD 0.01 higher (0.05 lower to 0.07 higher) | ⨁⨁⨁◯ Moderatea | TRIPLE likely results in little to no difference in CFB in AQLQ at 12 months compared to DUAL. |
| ‡ AQLQ scores range from 1 to 7 with higher scores indicating better asthma control. *The effect in the intervention group (and its 95% confidence interval) is based on the assumed effect in the comparison group and the relative effect of the intervention (and its 95% CI). † Minimal Clinically Important Difference is 0.5 | |||||
| GRADE Working Group grades of evidence High certainty: we are very confident that the true effect lies close to that of the estimate of the effect. Moderate certainty: we are moderately confident in the effect estimate: the true effect is likely to be close to the estimate of the effect, but there is a possibility that it is substantially different. Low certainty: our confidence in the effect estimate is limited: the true effect may be substantially different from the estimate of the effect. Very low certainty: we have very little confidence in the effect estimate: the true effect is likely to be substantially different from the estimate of effect. | |||||
|
Explanations a. Optimal information size is not met (Guyatt 2011b) b. Total size of less than 1000 participants may suggest small study effect (Dechartres 2013) | |||||
AQLQ: Asthma Quality of Life Questionnaire; CFB: change from baseline; CI: confidence interval; HD: high dose; ICS: inhaled corticosteroids; LABA: long‐acting beta2 agonist; MD: mean difference; MD: medium dose; RCT: randomised controlled trial.
Summary of findings 11. NMA Summary of Findings for ACQ responders at 6 months.
|
Patient or population: Adolescents and adults with symptomatic asthma Interventions: HD‐ICS/LABA, MD‐TRIPLE, HD‐TRIPLE Comparator (reference): Medium‐Dose ICS/LABA (MD‐ICS/LABA) Outcome: ACQ responders at 6 months Setting(s): Outpatient |
Geometry of the Network in Figure 8* | ||||||
|
Total studies: 7 RCTs Total Participants: 10453 |
Risk ratio** (95% CrI) |
Anticipated absolute effect***(95% CrI) | Certainty of the evidence |
Ranking**** (95% CrI) |
Interpretation of Findings | ||
| With intervention | Difference compared to MD‐ICS/LABA | ||||||
| HD‐ICS/LABA (Direct evidence; 3 RCTs; 3700 participants) |
1.05 (0.92 to 1.20) |
632 per 1000 | 12 per 1000 more (from 19 fewer to 43 more) |
⊕⊕⊕◯ Moderate Due to imprecision1 |
3.0 (3.0 to 4.0) |
Probably little or no difference | |
| MD‐TRIPLE (Direct evidence; 3 RCTs; 3063 participants) |
1.25 (1.09 to 1.44) |
670 per 1000 | 50 per 1000 more (from 19 more to 81 more) |
⊕⊕◯◯ Low Due to imprecision1 and heterogeneity2 |
1.0 (1.0 to 2.0) |
Possibly superior | |
| HD‐TRIPLE (Direct evidence; 2 RCTs; 1916 participants) |
1.25 (1.07 to 1.45) |
670 per 1000 | 50 per 1000 more (19 more to 81 more) |
⊕⊕◯◯ Low Due to imprecision1 and heterogeneity2 |
2.0 (1.0 to 2.0) |
Possibly superior | |
| MD‐ICS/LABA | Reference Comparator | 620 per 10003 | Reference Comparator | Reference Comparator |
4.0 (3.0 to 4.0) |
Reference Comparator | |
|
NMA‐SoF table definitions * The size of the nodes and the thickness of edges depend on the number of people randomised and the number of trials conducted, respectively. ** Network Meta‐Analysis estimates are reported as risk ratio. Results are expressed in credible intervals as opposed to the confidence intervals since a Bayesian analysis has been conducted. *** Anticipated absolute effect. Anticipated absolute effect compares two rates by calculating the difference between the rates of the intervention group with the rate of MD‐ICS/LABA group. **** Median and credible intervals are presented. Rank statistics is defined as the probabilities that a treatment out of n treatments in a network meta‐analysis is the best, the second, the third and so on until the least effective treatment. | |||||||
|
GRADE Working Group grades of evidence (or certainty in the evidence) High certainty: We are very confident that the true effect lies close to that of the estimate of the effect Moderate certainty: We are moderately confident in the effect estimate: The true effect is likely to be close to the estimate of the effect, but there is a possibility that it is substantially different Low certainty: Our confidence in the effect estimate is limited: The true effect may be substantially different from the estimate of the effect Very low certainty: We have very little confidence in the effect estimate: The true effect is likely to be substantially different from the estimate of effect | |||||||
|
Explanatory Footnotes 1 Serious imprecision due to suboptimal sample size in the direct and/or indirect estimate(s). 2 Serious heterogeneity in the direct estimate. 3 Based on the average rate in participants treated with MD‐ICS/LABA in the included studies. | |||||||
ACQ: Asthma Control Questionnaire; CrI: credible interval; HD: high dose; ICS: inhaled corticosteroids; LABA: long‐acting beta2 agonist; MD: medium dose; NMA: network meta‐analysis; RCT: randomised controlled trial.
8.
Network diagram for ACQ Responders at 6 months for grouped interventions.
The size of the nodes and the thickness of edges depend on the number of people randomised and the number of trials conducted. HD: high dose; ICS: inhaled corticosteroids; LABA: long‐acting beta‐2 agonist; MD: medium dose.
Summary of findings 12. NMA Summary of Findings for ACQ responders at 12 months.
|
Patient or population: Adolescents and adults with symptomatic asthma Interventions: HD‐ICS/LABA, MD‐TRIPLE, HD‐TRIPLE Comparator (reference): Medium‐Dose ICS/LABA (MD‐ICS/LABA) Outcome: ACQ responders at 12 months |
Geometry of the Network in Figure 9* | |||||
|
Total studies: 5 RCTs Total Participants: 7391 |
Risk ratio** (95% CrI) |
Anticipated absolute effect***(95% CrI) | Certainty of the evidence |
Ranking**** (95% CrI) |
Interpretation of Findings | |
| With intervention | Difference compared to MD‐ICS/LABA | |||||
| HD‐ICS/LABA (Direct evidence; 2 RCTs; 2817 participants) |
1.00 (0.94 to 1.05) |
676 per 1000 | 0 per 1000 fewer (from 41 fewer to 30 more) |
⊕⊕⊕◯ Moderate Due to imprecision1 |
3.0 (2.0 to 4.0) |
Probably little or no difference |
| MD‐TRIPLE (Direct evidence; 2 RCTs; 2237 participants) |
0.99 (0.94 to 1.05) |
669 per 1000 | 7 per 1000 more (from 41 fewer to 34 more) |
⊕⊕⊕◯ Moderate Due to imprecision1 |
3.0 (2.0 to 4.0) |
Probably little or no difference |
| HD‐TRIPLE (Direct evidence; 1 RCT; 1088 participants) |
1.08 (1.02 to 1.14) |
730 per 1000 | 54 per 1000 more (14 more to 95 more) |
⊕⊕⊕◯ Moderate Due to imprecision2 |
1.0 (1.0 to 1.0) |
Probably superior |
| MD‐ICS/LABA | Reference Comparator | 676 per 10003 | Reference Comparator | Reference Comparator |
3.0 (2.0 to 4.0) |
Reference Comparator |
|
NMA‐SoF table definitions * The size of the nodes and the thickness of edges depend on the number of people randomised and the number of trials conducted, respectively. ** Network Meta‐Analysis estimates are reported as risk ratio. Results are expressed in credible intervals as opposed to the confidence intervals since a Bayesian analysis has been conducted. *** Anticipated absolute effect. Anticipated absolute effect compares two rates by calculating the difference between the rates of the intervention group with the rate of MD‐ICS/LABA group. **** Median and credible intervals are presented. Rank statistics is defined as the probabilities that a treatment out of n treatments in a network meta‐analysis is the best, the second, the third and so on until the least effective treatment. | ||||||
|
GRADE Working Group grades of evidence (or certainty in the evidence) High certainty: We are very confident that the true effect lies close to that of the estimate of the effect Moderate certainty: We are moderately confident in the effect estimate: The true effect is likely to be close to the estimate of the effect, but there is a possibility that it is substantially different Low certainty: Our confidence in the effect estimate is limited: The true effect may be substantially different from the estimate of the effect Very low certainty: We have very little confidence in the effect estimate: The true effect is likely to be substantially different from the estimate of effect | ||||||
|
Explanatory Footnotes 1 Serious imprecision due to suboptimal sample size in the direct and/or indirect estimate(s). 2 Serious imprecision due 95% CI or CrI including the null effect in the direct and/or indirect estimate(s). 3 Based on the average rate in participants treated with MD‐ICS/LABA in the included studies. | ||||||
ACQ: Asthma Control Questionnaire; CrI: credible interval; HD: high dose; ICS: inhaled corticosteroids; LABA: long‐acting beta2 agonist; MD: medium dose; NMA: network meta‐analysis; RCT: randomised controlled trial.
9.
Network diagram for ACQ responders at 12 months for grouped interventions.
The size of the nodes and the thickness of edges depend on the number of people randomised and the number of trials conducted. HD: high dose; ICS: inhaled corticosteroids; LABA: long‐acting beta‐2 agonist; MD: medium dose.
Summary of findings 13. Asthma Control Questionnaire responders ‐ pairwise comparisons.
| Outcome № of participants (studies) | Relative effect (95% CI) | Anticipated absolute effects* (95% CI) | Certainty of the evidence | What happens | ||
| With active control | With experimental comparator | Difference | ||||
| ACQ responders at 6 months ‐ HD‐ICS/LABA vs MD‐ICS/LABA № of participants: 3700 (3 RCTs) | RR 1.02 (0.96 to 1.08) | 66.8% | 68.1% (64.1 to 72.2) | 1.3% more (2.7 fewer to 5.3 more) | ⨁⨁⨁◯ Moderatea, b | HD‐ICS/LABA likely results in little to no difference in ACQ responders at 6 months compared to MD‐ICS/LABA. |
| ACQ responders at 6 months ‐ MD TRIPLE vs MD‐ICS/LABA № of participants: 3063 (3 RCTs) | RR 1.09 (0.99 to 1.19) | 58.3% | 63.5% (57.7 to 69.3) | 5.2% more (0.6 fewer to 11.1 more) | ⨁⨁◯◯ Lowc, d | The evidence suggests MD TRIPLE increases ACQ responders at 6 months compared to MD‐ICS/LABA. |
| ACQ responders at 6 months ‐ HD TRIPLE vs MD‐ICS/LABA № of participants: 1916 (2 RCTs) | RR 1.11 (0.91 to 1.35) | 62.8% | 69.7% (57.2 to 84.8) | 6.9% more (5.7 fewer to 22 more) | ⨁◯◯◯ Very lowe, f | HD TRIPLE may increase ACQ responders at 6 months compared to MD‐ICS/LABA, but the evidence is very uncertain. |
| ACQ responders at 6 months ‐ MD TRIPLE vs HD‐ICS/LABA № of participants: 2480 (2 RCTs) | RR 1.02 (0.97 to 1.08) | 67.5% | 68.9% (65.5 to 72.9) | 1.4% more (2 fewer to 5.4 more) | ⨁⨁⨁◯ Moderateb | MD TRIPLE likely results in little to no difference in ACQ responders at 6 months compared to HD‐ICS/LABA. |
| ACQ responders at 6 months ‐ HD TRIPLE vs HD‐ICS/LABA № of participants: 4818 (4 RCTs) | RR 1.07 (1.01 to 1.14) | 61.2% | 65.5% (61.8 to 69.8) | 4.3% more (0.6 more to 8.6 more) | ⨁⨁⨁◯ Moderateb | HD TRIPLE likely results in little to no difference in ACQ responders at 6 months compared to HD‐ICS/LABA. |
| ACQ responders at 6 months ‐ HD TRIPLE vs MD TRIPLE № of participants: 2821 (3 RCTs) | RR 0.99 (0.95 to 1.03) | 73.2% | 72.5% (69.6 to 75.4) | 0.7% fewer (3.7 fewer to 2.2 more) | ⨁⨁⨁◯ Moderateb | HD TRIPLE likely results in little to no difference in ACQ responders at 6 months compared to MD TRIPLE. |
| ACQ responders at 6 months ‐ TRIPLE vs DUAL № of participants: 7881 (5 RCTs) | RR 1.09 (1.02 to 1.15) | 60.1% | 65.5% (61.3 to 69.1) | 5.4% more (1.2 more to 9 more) | ⨁⨁◯◯ Lowb, c | The evidence suggests TRIPLE increases ACQ responders at 6 months compared to DUAL. |
| ACQ responders at 12 months ‐ HD‐ICS/LABA vs MD‐ICS/LABA № of participants: 2817 (2 RCTs) | RR 0.99 (0.90 to 1.07) | 77.0% | 76.2% (69.3 to 82.3) | 0.8% fewer (7.7 fewer to 5.4 more) | ⨁⨁◯◯ Lowa, b, c | HD‐ICS/LABA likely results in little to no difference in ACQ responders at 12 months compared to MD‐ICS/LABA. |
| ACQ responders at 12 months ‐ MD TRIPLE vs MD‐ICS/LABA № of participants: 2222 (2 RCTs) | RR 1.01 (0.95 to 1.07) | 65.9% | 66.6% (62.6 to 70.6) | 0.7% more (3.3 fewer to 4.6 more) | ⨁⨁⨁◯ Moderateb | MD TRIPLE likely results in little to no difference in ACQ responders at 12 months compared to MD‐ICS/LABA. |
| ACQ responders at 12 months ‐ HD TRIPLE vs MD‐ICS/LABA № of participants: 1088 (1 RCT) | RR 1.08 (1.01 to 1.15) | 73.1% | 79.0% (73.9 to 84.1) | 5.9% more (0.7 more to 11 more) | ⨁⨁⨁◯ Moderateb | HD TRIPLE likely results in an increase in ACQ responders at 12 months compared to MD‐ICS/LABA. |
| ACQ responders at 12 months ‐ MD TRIPLE vs HD‐ICS/LABA № of participants: 1631 (1 RCT) | RR 0.97 (0.91 to 1.03) | 75.3% | 73.1% (68.5 to 77.6) | 2.3% fewer (6.8 fewer to 2.3 more) | ⨁⨁⨁◯ Moderateb | MD TRIPLE likely results in little to no difference in ACQ responders at 12 months compared to HD‐ICS/LABA. |
| ACQ responders at 12 months ‐ HD TRIPLE vs HD‐ICS/LABA № of participants: 3982 (3 RCTs) | RR 1.11 (0.99 to 1.23) | 64.2% | 71.3% (63.6 to 79) | 7.1% more (0.6 fewer to 14.8 more) | ⨁◯◯◯ Very lowb, c, d | HD TRIPLE may increase ACQ responders at 12 months compared to HD‐ICS/LABA, but the evidence is very uncertain. |
| ACQ responders at 12 months ‐ HD TRIPLE vs MD TRIPLE № of participants: 1089 (1 RCT) | RR 1.08 (1.01 to 1.16) | 72.8% | 78.6% (73.5 to 84.5) | 5.8% more (0.7 more to 11.6 more) | ⨁⨁⨁◯ Moderateb | HD TRIPLE likely increases ACQ responders at 12 months compared to MD TRIPLE. |
| ACQ responders at 12 months ‐ TRIPLE vs DUAL № of participants: 6204 (4 RCTs) | RR 1.07 (0.99 to 1.17) | 64.8% | 69.4% (64.2 to 75.8) | 4.5% more (0.6 fewer to 11 more) | ⨁◯◯◯ Very lowb, c, d | TRIPLE may increase ACQ responders at 12 months compared to DUAL, but the evidence is very uncertain. |
| *The risk in the intervention group (and its 95% confidence interval) is based on the assumed risk in the comparison group and the relative effect of the intervention (and its 95% CI). | ||||||
| GRADE Working Group grades of evidence High certainty: we are very confident that the true effect lies close to that of the estimate of the effect. Moderate certainty: we are moderately confident in the effect estimate: the true effect is likely to be close to the estimate of the effect, but there is a possibility that it is substantially different. Low certainty: our confidence in the effect estimate is limited: the true effect may be substantially different from the estimate of the effect. Very low certainty: we have very little confidence in the effect estimate: the true effect is likely to be substantially different from the estimate of effect. | ||||||
|
Explanations a. van Zyl‐Smit 2020 had very high attrition rates and is considered at high risk of bias. However, excluding the study did not change the results. b. Optimal information size is not met (Guyatt 2011b) c. Substantial heterogeneity I2 > 50% to 90% d. Confidence interval includes the line of no effect e. Considerable heterogeneity. I2 >75% to 100% f. Confidence intervals include clinically important outcomes. | ||||||
ACQ: Asthma Control Questionnaire; CI: confidence interval; HD: high dose; ICS: inhaled corticosteroids; LABA: long‐acting beta2 agonist; MD: medium dose; RCT: randomised controlled trial; RR: risk ratio.
Summary of findings 14. NMA Summary of Findings for all‐cause SAEs.
|
Patient or population: Adolescents and adults with symptomatic asthma Interventions: HD‐ICS/LABA, MD‐TRIPLE, HD‐TRIPLE Comparator (reference): Medium‐Dose ICS/LABA (MD‐ICS/LABA) Outcome: All‐cause serious adverse events (SAEs) Setting(s): Outpatient |
Geometry of the Network in Figure 10* | ||||||
|
Total studies: 13 RCTs Total Participants: 144476 |
Risk ratio** (95% CrI) |
Anticipated absolute effect***(95% CrI) | Certainty of the evidence |
Ranking**** (95% CrI) |
Interpretation of Findings | ||
| With intervention | Difference compared to MD‐ICS/LABA | ||||||
| HD‐ICS/LABA (Direct evidence; 8 RCTs; 7511 participants) |
1.06 (0.86 to 1.33) |
54 per 1000 | 3 per 1000 more (from 7 fewer to 16 more) |
⊕⊕⊕⊕ High |
3.0 (1.0 to 4.0) |
Little or no difference | |
| MD‐TRIPLE (Direct evidence; 3 RCTs; 3187 participants) |
1.10 (0.84 to 1.45) |
56 per 1000 | 5 per 1000 more (from 8 fewer to 21 more) |
⊕⊕⊕◯ Moderate Due to imprecision1 |
3.0 (1.0 to 4.0) |
Probably little or no difference | |
| HD‐TRIPLE (Direct evidence; 2 RCT; 2039 participants) |
1.05 (0.81 to 1.64) |
54 per 1000 | 3 per 1000 more (from 10 fewer to 33 more) |
⊕⊕⊕◯ Moderate Due to imprecision1 |
2.0 (1.0 to 4.0) |
Probably little or no difference | |
| MD‐ICS/LABA | Reference Comparator | 51 per 10002 | Reference Comparator | Reference Comparator |
2.0 (1.0 to 4.0) |
Reference Comparator | |
|
NMA‐SoF table definitions * The size of the nodes and the thickness of edges depend on the number of people randomised and the number of trials conducted, respectively. ** Network Meta‐Analysis estimates are reported as risk ratio. Results are expressed in credible intervals as opposed to the confidence intervals since a Bayesian analysis has been conducted. *** Anticipated absolute effect. Anticipated absolute effect compares two rates by calculating the difference between the rates of the intervention group with the rate of MD‐ICS/LABA group. **** Median and credible intervals are presented. Rank statistics is defined as the probabilities that a treatment out of n treatments in a network meta‐analysis is the best, the second, the third and so on until the least effective treatment. | |||||||
|
GRADE Working Group grades of evidence (or certainty in the evidence) High certainty: We are very confident that the true effect lies close to that of the estimate of the effect Moderate certainty: We are moderately confident in the effect estimate: The true effect is likely to be close to the estimate of the effect, but there is a possibility that it is substantially different Low certainty: Our confidence in the effect estimate is limited: The true effect may be substantially different from the estimate of the effect Very low certainty: We have very little confidence in the effect estimate: The true effect is likely to be substantially different from the estimate of effect | |||||||
|
Explanatory Footnotes 1 Serious imprecision due to wide confidence intervals in the direct and/or indirect estimate(s). 2 Based on the average rate in participants treated with MD‐ICS/LABA in the included studies. | |||||||
CrI: credible interval; HD: high dose; ICS: inhaled corticosteroids; LABA: long‐acting beta2 agonist; MD: medium dose; NMA: network meta‐analysis; RCT: randomised controlled trial; SAE: serious adverse event.
10.
Network diagram for all‐cause SAEs for grouped interventions.
The size of the nodes and the thickness of edges depend on the number of people randomised and the number of trials conducted. HD: high dose; ICS: inhaled corticosteroids; LABA: long‐acting beta‐2 agonist; MD: medium dose.
Summary of findings 15. Serious adverse events, adverse events, and dropouts due to adverse event ‐ pairwise comparisons.
| Outcome № of participants (studies) | Relative effect (95% CI) | Anticipated absolute effects* (95% CI) | Certainty of the evidence | What happens | ||
| With active control | With experimental comparator | Difference | ||||
| All cause SAEs ‐ HD‐ICS/LABA vs MD‐ICS LABA
№ of participants: 7511
(8 RCTs) Follow up: 3 to 12 months |
RR 1.03 (0.83 to 1.29) | 4.4% | 4.5% (3.6 to 5.6) | 0.1% more (0.7 fewer to 1.3 more) | ⨁⨁⨁⨁ High | HD‐ICS/LABA results in little to no difference in all cause SAEs compared to MD‐ICS LABA. |
| All cause SAEs ‐ MD TRIPLE vs MD‐ICS/LABA
№ of participants: 3187
(3 RCTs) Follow up: 12 months |
RR 1.13 (0.85 to 1.50) | 5.3% | 6.0% (4.5 to 8) | 0.7% more (0.8 fewer to 2.7 more) | ⨁⨁⨁◯ Moderatea | MD TRIPLE likely results in little to no difference in all cause SAEs compared to MD‐ICS/LABA. |
| All cause SAEs ‐ HD TRIPLE vs MD‐ICS/LABA
№ of participants: 2039
(2 RCTs) Follow up: 12 months |
RR 1.05 (0.76 to 1.47) | 6.2% | 6.5% (4.7 to 9.1) | 0.3% more (1.5 fewer to 2.9 more) | ⨁⨁⨁◯ Moderatea | HD TRIPLE likely results in little to no difference in all cause SAEs compared to MD‐ICS/LABA. |
| All cause SAEs ‐ MD TRIPLE vs HD‐ICS/LABA
№ of participants: 2660
(2 RCTs) Follow up: 12 months |
RR 1.08 (0.81 to 1.44) | 6.8% | 7.4% (5.5 to 9.9) | 0.5% more (1.3 fewer to 3 more) | ⨁⨁⨁◯ Moderatea | MD TRIPLE likely results in little to no difference in all cause SAEs compared to HD‐ICS/LABA. |
| All cause SAEs ‐ HD TRIPLE vs HD‐ICS/LABA
№ of participants: 5004
(4 RCTs) Follow up: 12 months |
RR 0.95 (0.77 to 1.18) | 6.9% | 6.6% (5.3 to 8.2) | 0.3% fewer (1.6 fewer to 1.2 more) | ⨁⨁⨁◯ Moderatea | HD TRIPLE likely results in little to no difference in all cause SAEs compared to HD‐ICS/LABA. |
| All cause SAEs ‐ HD TRIPLE vs MD TRIPLE
№ of participants: 2998
(3 RCTs) Follow up: 6 to 12 months |
RR 0.96 (0.72 to 1.27) | 6.0% | 5.8% (4.3 to 7.6) | 0.2% fewer (1.7 fewer to 1.6 more) | ⨁⨁⨁◯ Moderatea | HD TRIPLE likely results in little to no difference in all cause SAEs compared to MD TRIPLE. |
| All cause SAEs ‐ TRIPLE vs DUAL
№ of participants: 8192
(6 RCTs) Follow up: 12 months |
RR 1.03 (0.87 to 1.21) | 6.3% | 6.5% (5.5 to 7.7) | 0.2% more (0.8 fewer to 1.3 more) | ⨁⨁⨁⨁ High | TRIPLE results in little to no difference in all cause SAEs compared to DUAL. |
| Asthma‐related SAEs ‐ HD‐ICS/LABA vs MD‐ICS LABA
№ of participants: 6244
(6 RCTs) Follow up: 3 to 12 months |
RR 1.33 (0.80 to 2.21) | 1.1% | 1.5% (0.9 to 2.5) | 0.4% more (0.2 fewer to 1.4 more) | ⨁⨁⨁⨁ High | HD‐ICS/LABA results in little to no difference in asthma‐related SAEs compared to MD‐ICS LABA. |
| Asthma‐related SAEs ‐ MD TRIPLE vs MD‐ICS/LABA
№ of participants: 3188
(3 RCTs) Follow up: 12 months |
RR 1.52 (0.85 to 2.69) | 1.2% | 1.8% (1 to 3.2) | 0.6% more (0.2 fewer to 2 more) | ⨁⨁⨁◯ Moderatea | MD TRIPLE likely results in little to no difference in asthma‐related SAEs compared to MD‐ICS/LABA. |
| Asthma‐related SAEs ‐ HD TRIPLE vs MD‐ICS/LABA
№ of participants: 2039
(2 RCTs) Follow up: 12 months |
RR 0.86 (0.41 to 1.80) | 1.5% | 1.3% (0.6 to 2.7) | 0.2% fewer (0.9 fewer to 1.2 more) | ⨁⨁⨁⨁ High | HD TRIPLE results in little to no difference in asthma‐related SAEs compared to MD‐ICS LABA. |
| Asthma‐related SAEs ‐ MD TRIPLE vs HD‐ICS/LABA
№ of participants: 2660
(2 RCTs) Follow up: 12 months |
RR 1.35 (0.77 to 2.36) | 1.6% | 2.2% (1.3 to 3.9) | 0.6% more (0.4 fewer to 2.2 more) | ⨁⨁⨁◯ Moderatea | Safety outcomes likely results in little to no difference in asthma‐related SAEs ‐ MD TRIPLE vs HD‐ICS/LABA. |
| Asthma‐related SAEs ‐ HD TRIPLE vs HD‐ICS/LABA
№ of participants: 5004
(4 RCTs) Follow up: 12 months |
RR 0.86 (0.58 to 1.27) | 2.2% | 1.9% (1.3 to 2.8) | 0.3% fewer (0.9 fewer to 0.6 more) | ⨁⨁⨁⨁ High | HD TRIPLE results in little to no difference in asthma‐related SAEs compared to HD‐ICS LABA. |
| Asthma‐related SAEs ‐ HD TRIPLE vs MD TRIPLE
№ of participants: 3472
(3 RCTs) Follow up: 6 to 12 months |
RR 0.57 (0.31 to 1.05) | 1.7% | 1.0% (0.5 to 1.8) | 0.7% fewer (1.2 fewer to 0.1 more) | ⨁⨁⨁⨁ High | HD TRIPLE results in little to no difference in asthma‐related SAEs compared to MD TRIPLE. |
| Asthma‐related SAEs ‐ TRIPLE vs DUAL
№ of participants: 8192
(6 RCTs) Follow up: 12 months |
RR 1.04 (0.76 to 1.42) | 1.8% | 1.9% (1.4 to 2.6) | 0.1% more (0.4 fewer to 0.8 more) | ⨁⨁⨁⨁ Highb | TRIPLE results in little to no difference in asthma‐related SAEs compared to DUAL. |
| All cause AEs ‐ HD‐ICS/LABA vs MD‐ICS LABA
№ of participants: 5949
(7 RCTs) Follow up: 3 to 12 months |
RR 1.01 (0.97 to 1.06) | 43.8% | 44.3% (42.5 to 46.4) | 0.4% more (1.3 fewer to 2.6 more) | ⨁⨁⨁⨁ High | HD‐ICS/LABA results in little to no difference in all cause AEs compared to MD‐ICS LABA. |
| All cause AEs ‐ MD TRIPLE vs MD‐ICS/LABA
№ of participants: 3188
(3 RCTs) Follow up: 12 months |
RR 0.96 (0.91 to 1.00) | 61.9% | 59.4% (56.3 to 61.9) | 2.5% fewer (5.6 fewer to 0 fewer) | ⨁⨁⨁◯ Moderatec | MD TRIPLE likely results in a slight reduction in all cause AEs compared to MD‐ICS/LABA. |
| All cause AEs ‐ HD TRIPLE vs MD‐ICS/LABA
№ of participants: 2039
(2 RCTs) Follow up: 12 months |
RR 0.92 (0.85 to 1.00) | 52.0% | 47.9% (44.2 to 52) | 4.2% fewer (7.8 fewer to 0 fewer) | ⨁⨁⨁◯ Moderatec | HD TRIPLE likely results in a reduction in all cause AEs compared to MD‐ICS/LABA. |
| All cause AEs ‐ MD TRIPLE vs HD‐ICS/LABA
№ of participants: 2659
(2 RCTs) Follow up: 12 months |
RR 0.99 (0.83 to 1.18) | 56.1% | 55.5% (46.5 to 66.2) | 0.6% fewer (9.5 fewer to 10.1 more) | ⨁⨁◯◯ Lowa, b | The evidence suggests that MD TRIPLE results in little to no difference in all cause AEs compared to HD‐ICS/LABA. |
| All cause AEs ‐ HD TRIPLE vs HD‐ICS/LABA
№ of participants: 5004
(4 RCTs) Follow up: 12 months |
RR 0.91 (0.87 to 0.96) | 63.0% | 57.3% (54.8 to 60.5) | 5.7% fewer (8.2 fewer to 2.5 fewer) | ⨁⨁⨁⨁ High | HD TRIPLE results in a reduction in all cause AEs ‐compared to HD‐ICS/LABA. |
| All cause AEs ‐ HD TRIPLE vs MD TRIPLE
№ of participants: 3473
(3 RCTs) Follow up: 6 to 12 months |
RR 0.95 (0.90 to 1.02) | 51.7% | 49.1% (46.5 to 52.7) | 2.6% fewer (5.2 fewer to 1 more) | ⨁⨁⨁◯ Moderatec | HD TRIPLE likely results in a slight reduction in all cause AEs ‐compared to MD TRIPLE. |
| All cause AEs ‐ TRIPLE vs DUAL
№ of participants: 8192
(6 RCTs) Follow up: 12 months |
RR 0.93 (0.90 to 0.96) | 62.6% | 58.2% (56.3 to 60.1) | 4.4% fewer (6.3 fewer to 2.5 fewer) | ⨁⨁⨁⨁ High | TRIPLE results in a reduction in all cause AEs compared to DUAL. |
| Dropouts due to adverse event ‐ HD‐ICS/LABA vs MD‐ICS LABA
№ of participants: 5969
(7 RCTs) Follow up: 3 to 12 months |
RR 1.00 (0.68 to 1.48) | 1.8% | 1.8% (1.2 to 2.7) | 0.0% fewer (0.6 fewer to 0.9 more) | ⨁⨁⨁⨁ High | HD ICS/LABA results in little to no difference in dropouts due to adverse event compared to MD‐ICS LABA. |
| Dropouts due to adverse event ‐ MD TRIPLE vs MD‐ICS/LABA
№ of participants: 3205
(3 RCTs) Follow up: 12 months |
RR 0.42 (0.08 to 2.14) | 2.1% | 0.9% (0.2 to 4.4) | 1.2% fewer (1.9 fewer to 2.4 more) | ⨁◯◯◯ Very lowb, d, e | The evidence is very uncertain about the effect of MD TRIPLE on dropouts due to adverse event compared to MD‐ICS/LABA. |
| Dropouts due to adverse event ‐ HD TRIPLE vs MD‐ICS/LABA
№ of participants: 2670
(2 RCTs) Follow up: 12 months |
RR 0.47 (0.19 to 1.18) | 2.9% | 1.3% (0.5 to 3.4) | 1.5% fewer (2.3 fewer to 0.5 more) | ⨁⨁⨁◯ Moderatee | HD TRIPLE likely results in a slight reduction in dropouts due to adverse event compared to MD‐ICS/LABA. |
| Dropouts due to adverse event ‐ MD TRIPLE vs HD‐ICS/LABA
№ of participants: 2668
(2 RCTs) Follow up: 12 months |
RR 1.24 (0.76 to 2.02) | 2.4% | 3.0% (1.9 to 4.9) | 0.6% more (0.6 fewer to 2.5 more) | ⨁⨁⨁◯ Moderatee | MD TRIPLE likely results in little to no difference in dropouts due to adverse event compared to HD‐ICS/LABA. |
| Dropouts due to adverse event ‐ HD TRIPLE vs HD‐ICS/LABA
№ of participants: 5018
(4 RCTs) Follow up: 12 months |
RR 0.60 (0.38 to 0.95) | 2.3% | 1.4% (0.9 to 2.2) | 0.9% fewer (1.4 fewer to 0.1 fewer) | ⨁⨁⨁⨁ High | HD TRIPLE results in a slight reduction in dropouts due to adverse event compared to HD‐ICS/LABA. |
| Dropouts due to adverse event ‐ HD TRIPLE vs MD TRIPLE
№ of participants: 1765
(2 RCTs) Follow up: 6 to 12 months |
RR 1.00 (0.29 to 3.44) | 0.6% | 0.6% (0.2 to 2) | 0.0% fewer (0.4 fewer to 1.4 more) | ⨁⨁⨁◯ Moderatee | HD TRIPLE likely results in little to no difference in dropouts due to adverse event compared to MD TRIPLE. |
| Dropouts due to adverse event ‐ TRIPLE vs DUAL
№ of participants: 8223
(5 RCTs) Follow up: 12 months |
RR 0.59 (0.33 to 1.03) | 2.2% | 1.3% (0.7 to 2.3) | 0.9% fewer (1.5 fewer to 0.1 more) | ⨁⨁⨁◯ Moderatec | TRIPLE likely results in a slight reduction in dropouts due to adverse event compared to DUAL. |
| *The risk in the intervention group (and its 95% confidence interval) is based on the assumed risk in the comparison group and the relative effect of the intervention (and its 95% CI). | ||||||
| GRADE Working Group grades of evidence High certainty: we are very confident that the true effect lies close to that of the estimate of the effect. Moderate certainty: we are moderately confident in the effect estimate: the true effect is likely to be close to the estimate of the effect, but there is a possibility that it is substantially different. Low certainty: our confidence in the effect estimate is limited: the true effect may be substantially different from the estimate of the effect. Very low certainty: we have very little confidence in the effect estimate: the true effect is likely to be substantially different from the estimate of effect. | ||||||
|
Explanations a. Confidence interval includes a clinically important difference. b. Substantial heterogeneity I2 > 50% to 90% c. Confidence interval includes the line of no effect. d. Optimal information size is not met (Guyatt 2011b) e. Very wide confidence interval. | ||||||
AE: adverse event; CI: confidence interval; HD: high dose; ICS: inhaled corticosteroids; LABA: long‐acting beta2 agonist; LD: low dose; MD: medium dose; RCT: randomised controlled trial; RR: risk ratio; SAE: serious adverse event.
Summary of findings 16. NMA Summary of Findings for asthma‐related SAEs.
|
Patient or population: Adolescent sand adults with symptomatic asthma Interventions: HD‐ICS/LABA, MD‐TRIPLE, HD‐TRIPLE Comparator (reference): Medium‐Dose ICS/LABA (MD‐ICS/LABA) Outcome: Asthma‐related serious adverse events (SAEs) Setting(s): Outpatient |
Geometry of the Network in Figure 11* | ||||||
|
Total studies: 11 RCTs Total Participants: 13209 |
Relative risk** (95% CrI) |
Anticipated absolute effect***(95% CrI) | Certainty of the evidence |
Ranking**** (95% CrI) |
Interpretation of Findings | ||
| With intervention | Difference compared to MD‐ICS/LABA | ||||||
| HD‐ICS/LABA (Direct evidence; 6 RCTs; 6244 participants) |
1.27 (0.79 to 2.05) |
13 per 1000 | 3 per 1000 more (from 2 fewer to 12 more) |
⊕⊕⊕⊕ High |
3.0 (1.0 to 4.0) |
Little or no difference | |
| MD‐TRIPLE (Direct evidence; 3 RCTs; 3188 participants) |
1.70 (0.99 to 1.8) |
18 per 1000 | 8 per 1000 more (from 0 fewer to 9 more) |
⊕⊕⊕◯ Moderate Due to imprecision1 |
4.0 (2.0 to 4.0) |
Probably little or no difference | |
| HD‐TRIPLE (Direct evidence; 2 RCTs; 2039 participants) |
1.05 (0.60 to 1.80) |
11 per 1000 | 1 per 1000 more (from 4 fewer to 9 more) |
⊕⊕⊕⊕ High |
2.0 (1.0 to 3.0) |
Little or no difference | |
| MD‐ICS/LABA | Reference Comparator | 10 per 10002 | Reference Comparator | Reference Comparator |
1.0 (1.0 to 3.0) |
Reference Comparator | |
|
NMA‐SoF table definitions * The size of the nodes and the thickness of edges depend on the number of people randomised and the number of trials conducted, respectively. ** Network Meta‐Analysis estimates are reported as risk ratio. Results are expressed in credible intervals as opposed to the confidence intervals since a Bayesian analysis has been conducted. *** Anticipated absolute effect. Anticipated absolute effect compares two risks by calculating the difference between the risk of the intervention group with the risk of the control group. **** Median and credible intervals are presented. Rank statistics is defined as the probabilities that a treatment out of n treatments in a network meta‐analysis is the best, the second, the third and so on until the least effective treatment. | |||||||
|
GRADE Working Group grades of evidence (or certainty in the evidence) High certainty: We are very confident that the true effect lies close to that of the estimate of the effect Moderate certainty: We are moderately confident in the effect estimate: The true effect is likely to be close to the estimate of the effect, but there is a possibility that it is substantially different Low certainty: Our confidence in the effect estimate is limited: The true effect may be substantially different from the estimate of the effect Very low certainty: We have very little confidence in the effect estimate: The true effect is likely to be substantially different from the estimate of effect | |||||||
|
Explanatory Footnotes 1 Serious imprecision due to wide confidence intervals in the direct and/or indirect estimate(s). 2 Based on the average rate in participants treated with MD‐ICS/LABA in the included studies. | |||||||
CrI: credible interval; HD: high dose; ICS: inhaled corticosteroids; LABA: long‐acting beta2 agonist; MD: medium dose; NMA: network meta‐analysis; RCT: randomised controlled trial; SAE: serious adverse event.
11.
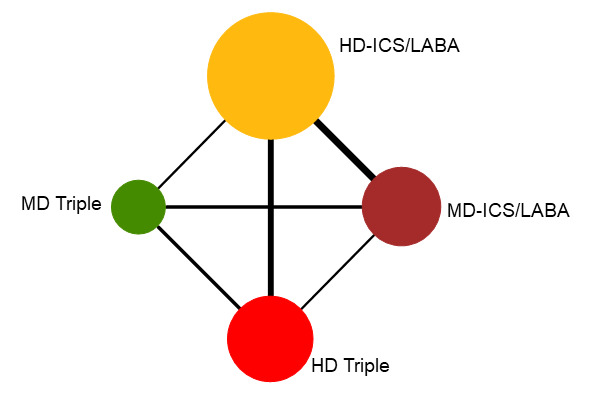
Network diagram for asthma‐related SAEs for grouped interventions
The size of the nodes and the thickness of edges depend on the number of people randomised and the number of trials conducted. HD: high dose; ICS: inhaled corticosteroids; LABA: long‐acting beta‐2 agonist; MD: medium dose.
Summary of findings 17. NMA Summary of Findings for all‐cause AEs.
|
Patient or population: Adolescents and adults with symptomatic asthma Interventions: HD‐ICS/LABA, MD‐TRIPLE, HD‐TRIPLE Comparator (reference): Medium‐Dose ICS/LABA (MD‐ICS/LABA) Outcome: All‐cause adverse events (AEs) Setting(s): Outpatient |
Geometry of the Network in Figure 12* | ||||||
|
Total studies: 12 RCTs Total Participants: 12915 |
Relative effect** (95% CrI) |
Anticipated absolute effect***(95% CrI) | Certainty of the evidence |
Ranking**** (95% CrI) |
Interpretation of Findings | ||
| With intervention | Difference compared to MD‐ICS/LABA | ||||||
| HD‐ICS/LABA (Direct evidence; 7 RCTs; 5949 participants) |
1.00 (0.89 to 1.12) |
508 per 1000 | 0 per 1000 more (from 29 fewer to 28 more) |
⊕⊕⊕⊕ High |
3.0 (2.0 to 4.0) |
Little or no difference | |
| MD‐TRIPLE (Direct evidence; 3 RCTs; 3188 participants) |
0.89 (0.78 to 1.02) |
479 per 1000 | 29 per 1000 fewer (from 62 fewer to 5 more) |
⊕⊕⊕◯ Moderate Due to imprecision1 |
2.0 (1.0 to 3.0) |
Probably little or no difference | |
| HD‐TRIPLE (Direct evidence; 2 RCTs; 2039 participants) |
0.79 (0.69 to 0.90) |
449 per 1000 | 59 per 1000 fewer (from 26 fewer to 92 fewer) |
⊕⊕⊕⊕ High |
1.0 (1.0 to 2.0) |
Superior | |
| MD‐ICS/LABA | Reference Comparator | 508 per 10002 | Reference Comparator | Reference Comparator |
3.0 (2.0 to 4.0) |
Reference Comparator | |
|
NMA‐SoF table definitions * The size of the nodes and the thickness of edges depend on the number of people randomised and the number of trials conducted, respectively. ** Network Meta‐Analysis estimates are reported as risk ratio. Results are expressed in credible intervals as opposed to the confidence intervals since a Bayesian analysis has been conducted. *** Anticipated absolute effect. Anticipated absolute effect compares two rates by calculating the difference between the rates of the intervention group with the rate of MD‐ICS/LABA group. **** Median and credible intervals are presented. Rank statistics is defined as the probabilities that a treatment out of n treatments in a network meta‐analysis is the best, the second, the third and so on until the least effective treatment. | |||||||
|
GRADE Working Group grades of evidence (or certainty in the evidence) High certainty: We are very confident that the true effect lies close to that of the estimate of the effect Moderate certainty: We are moderately confident in the effect estimate: The true effect is likely to be close to the estimate of the effect, but there is a possibility that it is substantially different Low certainty: Our confidence in the effect estimate is limited: The true effect may be substantially different from the estimate of the effect Very low certainty: We have very little confidence in the effect estimate: The true effect is likely to be substantially different from the estimate of effect | |||||||
|
Explanatory Footnotes 1 Serious imprecision due to 95% CIs including the null effect. 2 Based on the average rate in participants treated with MD‐ICS/LABA in the included studies. | |||||||
AE: adverse event; CrI: credible interval; HD: high dose; ICS: inhaled corticosteroids; LABA: long‐acting beta2 agonist; MD: medium dose; NMA: network meta‐analysis; RCT: randomised controlled trial.
12.
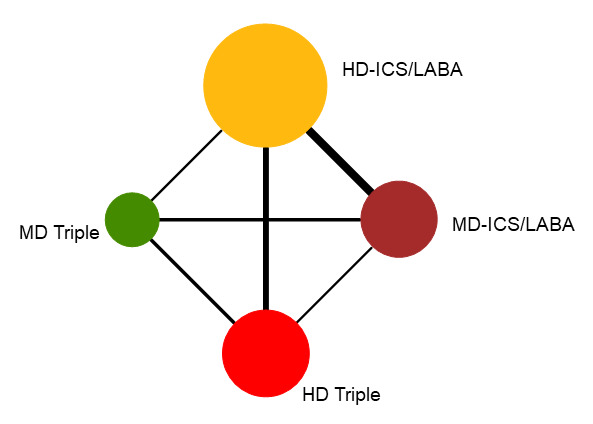
Network diagram for all‐cause AEs for grouped interventions.
Node colors denote the treatment group. The size of the nodes and the thickness of edges depend on the number of people randomised and the number of trials conducted. HD: high dose; ICS: inhaled corticosteroids; LABA: long‐acting beta‐2 agonist; MD: medium dose.
Summary of findings 18. NMA summary of findings table for dropouts due to AEs.
|
‐Patient or population: Adolescents and adults with symptomatic asthma Interventions: HD‐ICS/LABA, MD‐TRIPLE, HD‐TRIPLE Comparator (reference): Medium‐Dose ICS/LABA (MD‐ICS/LABA) Outcome: Dropouts due to adverse events (AEs) Setting(s): Outpatient |
Geometry of the Network in Figure 13* | ||||||
| Total studies: 12 RCTs Total Participants: 12915 |
Risk ratio** (95% CrI) |
Anticipated absolute effect***(95% CrI) | Certainty of the evidence | Ranking**** (95% CrI) |
Interpretation of Findings | ||
| With intervention | Difference compared to MD‐ICS/LABA | ||||||
| HD‐ICS/LABA (Direct evidence; 7 RCTs; 5969 participants) |
0.91 (0.64 to 1.36) |
15 per 1000 | 1 per 1000 fewer (from 6 fewer to 5 more) |
⊕⊕⊕⊕ High |
3.0 (2.0 to 4.0) |
Little or no difference | |
| MD‐TRIPLE (Direct evidence; 3 RCTs; 3205 participants) |
0.88 (0.53 to 1.43) |
14 per 1000 | 2 per 1000 fewer (from 8 fewer to 7 more) |
⊕⊕⊕◯ Moderate Due to imprecision1 |
3.0 (2.0 to 4.0) |
Probably little or no difference | |
| HD‐TRIPLE (Direct evidence; 2 RCTs; 2051 participants) |
0.50 (0.30 to 0.84) |
8 per 1000 | 8 per 1000 fewer (from 11 fewer to 3 fewer) |
⊕⊕⊕◯ Moderate Due to imprecision1 |
1.0 (1.0 to 2.0) |
Probably superior | |
| MD‐ICS/LABA | Reference Comparator | 16 per 10002 | Reference Comparator | Reference Comparator | 4.0 (2.0 to 4.0) |
Reference Comparator | |
|
NMA‐SoF table definitions * The size of the nodes and the thickness of edges depend on the number of people randomised and the number of trials conducted, respectively. ** Network Meta‐Analysis estimates are reported as risk ratio. Results are expressed in credible intervals as opposed to the confidence intervals since a Bayesian analysis has been conducted. *** Anticipated absolute effect. Anticipated absolute effect compares two rates by calculating the difference between the rates of the intervention group with the rate of MD‐ICS/LABA group. **** Median and credible intervals are presented. Rank statistics is defined as the probabilities that a treatment out of n treatments in a network meta‐analysis is the best, the second, the third and so on until the least effective treatment. | |||||||
|
GRADE Working Group grades of evidence (or certainty in the evidence) High certainty: We are very confident that the true effect lies close to that of the estimate of the effect Moderate certainty: We are moderately confident in the effect estimate: The true effect is likely to be close to the estimate of the effect, but there is a possibility that it is substantially different Low certainty: Our confidence in the effect estimate is limited: The true effect may be substantially different from the estimate of the effect Very low certainty: We have very little confidence in the effect estimate: The true effect is likely to be substantially different from the estimate of effect | |||||||
|
Explanatory Footnotes 1 Serious imprecision due to wide confidence intervals in the direct and/or indirect estimate(s). 2 Based on the average rate in participants treated with MD‐ICS/LABA in the included studies. | |||||||
AE: adverse event; CrI: credible interval; HD: high dose; ICS: inhaled corticosteroids; LABA: long‐acting beta‐2 agonist; MD: medium dose; NMA: network meta‐analysis; RCT: randomised controlled trial.
13.
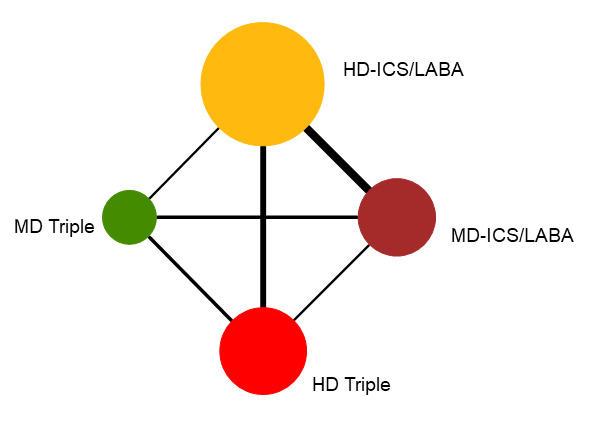
Network diagram for drop‐outs due to AEs for grouped interventions.
The size of the nodes and the thickness of edges depend on the number of people randomised and the number of trials conducted. HD: high dose; ICS: inhaled corticosteroids; LABA: long‐acting beta‐2 agonist; MD: medium dose.
Background
Description of the condition
Asthma is a chronic inflammatory airway disease characterised by reversible airway obstruction. The disease often starts in childhood, although it can be first diagnosed during adulthood. It is characterised by symptoms such as wheezing, shortness of breath, coughing and chest tightness. These symptoms are usually reversible with bronchodilator therapy and inhaled corticosteroids (ICS). Asthma is a common condition with global prevalence rates ranging from 7% to 25% (Sears 2014). It affects as many as 339 million people with estimated annual deaths of 420,000 worldwide (Global Asthma Report 2018). It also has significant economic impacts and accounts for 1.1% of global disability‐adjusted life years (Soriano 2017). The main objectives in asthma management are to achieve symptom control, reduce exacerbations, and meet patient and family expectations (GINA 2021).
Description of the intervention
Management of asthma involves a series of stepwise therapies depending on the severity of the disease. Initial therapy typically starts with a short‐acting beta2‐agonist as needed (step 1), and a daily low‐dose (LD) ICS is added for persistent symptoms (step 2) (O'Byrne 2019). Subsequently, a long‐acting beta2‐agonist (LABA), such as formoterol, typically is added to LD‐ to medium‐dose (MD) ICS if needed (steps 3 and 4) (Ducharme 2010; Sobieraj 2018a). Current guidelines recommend adding a long‐acting muscarinic antagonist (LAMA) or a biologic agent and/or consideration of high dose ICS‐LABA (step 5), when asthma is not controlled with MD‐ICS/LABA combination therapy (GINA 2021).
How the intervention might work
Inhaled corticosteroids work by their anti‐inflammatory effects in reducing bronchial hyper‐responsiveness and mucus hypersecretion (Barnes 2010). They are currently the first‐line therapeutic agents in the management of persistent asthma.
The LABA class of medications works by stimulation of the beta2 receptors on smooth muscles of the airways, which results in prolonged bronchodilation and a membrane stabilisation effect (Derom 1992; Kips 2001). LABA therapy plays a role in the treatment of asthma. However, it has long been established that LABA should play an adjunctive role with ICS as LABA was found to be inferior to ICS in the management of asthma when used as monotherapy (Haahtela 1991). Therefore, in the management of asthma, LABA medications are not utilised until failure with ICS monotherapy has been identified.
Long‐acting muscarinic antagonists (LAMAs) inhibit the action of acetylcholine at muscarinic receptors in bronchial smooth muscle and submucosal glands, resulting in bronchodilation as well as decreased mucus production (Gosens 2018). Their side effects are related to anticholinergic effects and typically comprise dry mouth, urinary retention and mydriasis (dilated pupils) (McIvor 2014). These side effects can impact participants’ adherence and potentially affect outcomes. Recent evidence has suggested a role for LAMAs in the treatment of persistent asthma not controlled with ICS/LABA (Aalbers 2017; Kerstjens 2012). The premise of the addition of LAMA is to synergistically increase bronchodilation and thus alleviate asthma symptoms.
Why it is important to do this review
A recent meta‐analysis by Sobieraj and colleagues demonstrated that addition of a LAMA to ICS compared to ICS alone reduced asthma exacerbations (Sobieraj 2018a). Other studies also support the benefit of LAMA when added to ICS (Anderson 2015; Befekadu 2014). However, ICS/LABA/LAMA or ICS/LAMA combinations failed to show any benefit compared to ICS/LABA (Sobieraj 2018b). This review involved a network meta‐analysis assessing outcomes in people with asthma whose symptoms are not well‐controlled with an ICS/LABA combination by comparing higher dose ICS/LABA and triple therapy (ICS/LABA/LAMA). If a triple combination (ICS/LABA/LAMA) is no more effective than a medium dose (MD) or high‐dose (HD) ICS/LABA combination, healthcare providers could consider other options such as a biologic agent (step 6) when an MD‐ or HD‐ICS/LABA combination fails.
There is a question of whether there are added benefits of HD versus MD ICS and a concern for increased side effects with higher‐dose ICS (Beasley 2019; Kew 2016; Zhang 2019). Inhaled corticosteroids are associated with systemic adverse events driven by increased dosages. These include osteoporosis, cataracts, skin changes (thinning and bruising) and adrenal suppression (Pandya 2014). Most studies comparing dual and triple combination therapies did not consider ICS doses (i.e. low‐, medium‐ and high‐doses) in their combinations. Therefore, this review also analysed the impact of HD versus MD ICS within the dual and triple combination therapies. If this review confirms the notion that an HD ICS increases side effects with no additional benefits compared with an MD ICS in combination inhalers, healthcare providers could be discouraged from using an HD ICS in combination inhalers.
Objectives
To assess the effectiveness and safety of dual and triple combination inhaler therapies, using a network‐meta‐analysis (NMA), compared with each other and with varying doses of inhaled corticosteroids (ICS) in adolescents and adults with uncontrolled asthma who have been treated with or are eligible for medium dose (MD)‐ ICS/long‐acting beta2‐agonist (LABA) combination therapy.
Methods
Criteria for considering studies for this review
Types of studies
We included pre‐registered randomised controlled trials (RCTs) of at least 12 weeks of study duration. To minimise publication bias and selective reporting, studies could be either published or unpublished. We did not consider cluster or‐ cross‐over RCTs to minimise unit of analysis errors, overestimating the treatment effects, and residual effects of crossed over inhaled corticosteroids (ICS) doses.
Types of participants
We included studies in adolescents and adults (age 12 years or older) with uncontrolled asthma who had been treated with or were eligible for MD‐ICS/LABA combination therapy. In this review, uncontrolled asthma is defined as: Asthma Control Questionnaire (ACQ) score equal to or greater than 1.5 (Juniper 2006); Asthma Control Test (ACT) score less than 20 (Schatz 2006); persistent asthma (symptoms or rescue medication usage two days per week or nighttime awakenings three times per month); or at least one asthma exacerbation in the past 12 months prior to randomisation (Gessner 2020; Kerstjens 2012; Papi 2007).
Types of interventions
We included studies comparing at least two of the following therapies.
MD‐ or HD‐ICS/LABA, a fixed dose (a combination of two active ingredients in a fixed ratio of doses) or free combination of two separate inhalers (beclomethasone/formoterol, budesonide/formoterol, ciclesonide/formoterol, fluticasone/formoterol, mometasone/formoterol, mometasone/indacaterol, fluticasone/salmeterol, fluticasone/vilanterol, etc.)
ICS/LABA/LAMA, a fixed‐dose (a combination of three active ingredients in a fixed ratio of doses) triple combination (fluticasone furoate/vilanterol/umeclidinium, mometasone/glycopyrronium/indacaterol (MF/GLY/IND), etc.), or an ICS/LABA fixed combination plus a LAMA (aclidinium, glycopyrronium, tiotropium, umeclidinium, etc.)
We classified doses of the ICS component in combination inhalers into low, medium, or high dose based on clinical comparability (BTS/SIGN 2019; GINA 2021). We considered fluticasone furoate 100 μg once daily a medium dose which was approximately equivalent to fluticasone propionate 250 μg twice daily according to the manufacturer's summary of product characteristics (Bernstein 2018; NICE 2018). We had originally classified MF/GLY/IND 160/50/150 µg and 80/50/150 µg as MD and LD Triple according to Vaidya 2016 which was later reclassified as HD and MD triple when new data became available (Buhl 2021).
We allowed the use of a short‐acting bronchodilator, such as albuterol (salbutamol) and ipratropium as rescue treatment. Network diagrams of individual treatment and grouped comparisons in each outcome for the NMAs are presented in the Figures section.
Types of outcome measures
We analysed the following outcomes in this review.
Primary outcomes
Asthma exacerbations (moderate, defined as requiring a short course of oral corticosteroids and severe, defined as resulting in hospitalisation, mechanical ventilation, or death)
Secondary outcomes
Asthma Control Questionnaire (ACQ‐7: seven item question) and its responders (Juniper 2006)
Asthma Quality of Life Questionnaire (AQLQ) (Juniper 1994)
All‐cause adverse events (AEs) and serious adverse events (SAEs)
Asthma‐related SAEs
Dropouts due to AEs
An SAE is defined by the US Food and Drug Administration (FDA) as any untoward medical occurrence that at any dose: results in death; is life‐threatening; requires inpatient hospitalisation or causes prolongation of existing hospitalisation; results in persistent or significant disability or incapacity; may have caused a congenital anomaly or birth defect; or requires intervention to prevent permanent impairment or damage (FDA 2016).
Search methods for identification of studies
Electronic searches
We identified studies from searches of the following databases and trial registries.
Cochrane Airways Trials Register (Cochrane Airways 2019), via the Cochrane Register of Studies, 2008 to 18 February 2022.
Cochrane Central Register of Controlled Trials (CENTRAL), via the Cochrane Register of Studies, 2008 to 18 February 2022
MEDLINE Ovid SP 2008 to18 February 2022
Embase Ovid SP 2008 to 18 February 2022
Global Health Ovid SP 2008 to 18 February 2022
US National Institutes of Health Ongoing Trials Register ClinicalTrials.gov (www.clinicaltrials.gov)
World Health Organisation International Clinical Trials Registry Platform (apps.who.int/trialsearch)
The database search strategies are listed in Appendix 1. The original search strategy was drafted in MEDLINE and adapted for use in the other databases. We structured the search strategy to search for articles containing terms for asthma, a LABA and an ICS. This structure facilitated searching for all the possible comparisons. The Cochrane Airways Information Specialist developed the search strategy in collaboration with the authors.
We searched all databases and trials registries from 2008, when the International Committee of Medical Journal Editors started to implement an updated policy requiring trial registration as a condition of publication, to 18 February 2022. There was no restriction on language or type of publication. We identified conference abstracts and grey literature to be hand searched through the Cochrane Airways Trials Register and the CENTRAL database.
Searching other resources
We checked the reference lists of all primary studies and review articles for additional references. We searched relevant manufacturers' websites for study information. We searched on PubMed for errata or retractions from included studies published in full text. We contacted investigators or study sponsors in order to obtain missing numerical outcome data as necessary.
Data collection and analysis
Selection of studies
We used Cochrane’s Screen4Me workflow to help assess the search results. Screen4Me comprises three components: known assessments – a service that matches records in the search results to records that have already been screened in Cochrane Crowd and been labelled as an RCT or as Not an RCT; the RCT classifier – a machine learning model that distinguishes RCTs from non‐RCTs; and if appropriate, Cochrane Crowd (http://crowd.cochrane.org) – Cochrane’s citizen science platform where the Crowd help to identify and describe health evidence. More detailed information about the Screen4Me components can be found in these publications: Marshall 2018; McDonald 2017; Noel‐Storr 2018; Thomas 2017.
Following this initial assessment, two review authors (YO, TM) independently screened titles and abstracts of the search results using Covidence and coded them as 'retrieve' (eligible or potentially eligible or unclear) or 'do not retrieve'. We retrieved the full‐text study reports of all potentially eligible studies and two review authors (YO, TM) independently screened them for inclusion, recording the reasons for exclusion of ineligible studies. We resolved any disagreement through discussion or, if required, we consulted a third review author (TP). We identified and excluded duplicates and collated multiple reports of the same study so that each study, rather than each report, was the unit of interest in the review. We recorded the selection process in sufficient detail to complete a PRISMA flow diagram and 'Characteristics of excluded studies' table (Moher 2009).
Data extraction and management
We used a data collection form for study characteristics and outcome data, which had been piloted on at least one study in the review. Three review authors (YO, TM, TP) extracted the following study characteristics from the included studies.
Methods: study design, total duration of study, details of any 'run‐in' period, study centres and location, study setting, withdrawals, and date of study.
Participants: number, mean age, age range, gender, race, smoking history, exacerbation history, diagnostic criteria, baseline lung function, and inclusion and exclusion criteria.
Interventions: intervention, comparison, concomitant medications, and excluded medications.
Outcomes: primary and secondary outcomes specified and collected, and time points reported. We used change from baseline (CFB) data, i.e., the difference between baseline and post‐intervention values at 3, 6, and 12 months.
Notes: funding for studies, website address for industry generated reports (e.g., Clinical Study Report), and trial registration number.
Two review authors (YO, TM) independently extracted outcome data from the included studies. We chose estimated effects of intervention in the following order of preference: (1) full intention‐to‐treat analysis (ITT); (2) modified ITT; (3) per‐protocol analysis. We noted in the 'Characteristics of included studies' table if outcome data were not reported in a usable way. We resolved disagreements by consensus or by involving a third review author (TP). One review author (YO) transferred data into the Review Manager file (Review Manager 2020). We double‐checked that data were entered correctly by comparing the data presented in the systematic review with the study reports. A second review author (TM) spot‐checked study characteristics for accuracy.
Assessment of risk of bias in included studies
Two review authors (YO, TM) independently assessed risk of bias for each study using the criteria outlined in the revised Cochrane risk of bias 2 (RoB 2) tool (Higgins 2019; Sterne 2019). We used the RoB 2 Excel tool to implement RoB 2 and presented consensus decisions for signalling questions in a general repository as supplemental data to be transparent. We assessed the risk of bias according to the following domains in all outcome measures and time points as necessary.
Randomisation processes
Deviations from intended interventions
Missing outcome data
Measurement of outcome
Selective outcome reporting
We categorised each domain as being 'high risk', 'low risk' or 'some concerns' using the algorithms proposed in RoB 2. We assessed overall risk of bias and considered a study: to be at high risk of bias when at least one domain was judged as being at high risk; to be at low risk when all domains were judged as being at low risk (Guyatt 2011a), and to raise some concerns when at least one domain was judged to raise some concerns but no domains were judged as being at high risk of bias. We resolved any disagreement through discussion or, if required, we consulted a third review author (TP).
Assessment of bias in conducting the systematic review
We conducted this review according to the previously published protocol (Oba 2020) and justified any deviations from it in the 'Differences between protocol and review' section of this review. We used the overall risk of bias judgements in the GRADE approach and summary of finding tables (Guyatt 2011b).
Network meta‐analysis
We compared each pair of treatments by estimating a hazard ratio (HR) for time‐to‐event outcomes (e.g. asthma exacerbations), a mean difference for continuous outcomes, and an odds ratio (OR) for dichotomous outcomes, along with their 95% credible intervals (CrIs).
We used a shared parameter model for exacerbation outcomes, whereby data on the log hazard ratio (lnHR) were modelled with the assumption that continuous treatment differences (lnHR and standard error)(SE) had a normal likelihood. When lnHR data were not available, or when appropriate covariance matrices could not be extracted or calculated for studies with more than two arms, we modelled data on dichotomous data at a given time as lnHR by using a binomial likelihood with a cloglog link. We used HR data in preference to dichotomous data when available and considered only the HR for the first event for exacerbation outcomes. When there were no dichotomous data available for a multi‐arm study for which a covariance matrix could not be calculated, we included unconnected pairwise comparisons as separate studies.
We used a normal likelihood with an identity link for continuous outcomes and a binomial likelihood with a logit link for dichotomous outcomes.
Direct pairwise meta‐analysis
We analysed dichotomous data as risk ratio (RR) or risk difference (RD) and continuous data as the mean difference(MD) along with their 95% confidence intervals (CIs).
Unit of analysis issues
For dichotomous outcomes, we used participants, rather than events, as the unit of analysis (i.e. number of participants admitted to hospital, rather than number of admissions).
Dealing with missing data
We contacted investigators or study sponsors in order to obtain missing numerical outcome data where possible (e.g. when a study was identified as an abstract only). When this was not possible and a large proportion of data was missing, we considered the missing data would introduce serious bias using the criteria proposed by Guyatt 2017. We took this into consideration in the GRADE rating for the affected outcomes.
Network meta‐analysis
We assessed heterogeneity by comparing the between‐trials standard deviation (SD) to the size of relative treatment effects, on the log‐scale for HRs and ORs. We assessed consistency between direct and indirect estimates by fitting node splitting models (van Valkenhoef 2016) and inspecting the resulting Bayesian p‐values for inconsistency, as well as comparing the model fit and between‐study heterogeneity to the standard NMA model. We extracted potential effect modifiers such as age, gender, race, smoking status, and exacerbation history. We assessed clinical heterogeneity by comparing them across different treatment comparisons. We qualitatively compared direct estimates from pairwise meta‐analysis with NMA estimates to check for broad agreement.
Direct pairwise meta‐analysis
We used the I2 statistic to measure heterogeneity amongst the studies in each analysis with I2 greater than 50% suggesting substantial heterogeneity (Deeks 2020). We also visually inspected forest plots and assess p values from the Chi2 test to identify heterogeneity. We reported substantial heterogeneity when identified and rated down the certainty of evidence when appropriate (Guyatt 2011a).
Network meta‐analysis
We minimised reporting bias from unpublished studies or selective outcome reporting by using a broad search strategy and by checking references of included studies and relevant systematic reviews. For each outcome, we estimated and presented the proportion of studies contributing data to the NMAs.
Direct pairwise meta‐analysis
For pairwise meta‐analyses, we assessed small‐study and publication bias through visual inspection of a funnel plot if more than 10 studies were being pooled. We assumed the presence of small‐study bias when the number of participants was fewer than 50 per study, 1000 per pooled analysis, or 100 per arm when no more than 10 studies could be pooled (Dechartres 2013; Nüesch 2010).
Network meta‐analysis (NMA)
We conducted NMAs in OpenBUGS (version 3.2.3) and sampled 100,000 iterations for three chains after a burn‐in of 50,000 iterations for exacerbations outcomes. NMAs for moderate‐severe exacerbations were conducted in R (version 4.0.5) using the GeMTC package, as there were only dichotomous data for the outcome. Models were sampled over 100,000 iterations forfour4 chains, after a burn‐in of 50,000 iterations. We used half‐normal prior distributions (Röver 2021) for the between‐study heterogeneity in severe exacerbations.
For continuous outcomes, we sampled over 100,000 iterations for four chains, after a burn‐in of 50,000 iterations using R (version 4.0.5) with GeMTC package. We analysed group comparisons only as there were sufficient data to allow for individual treatment comparisons.
For dichotomous outcomes, we mostly conducted NMAs in R (version 4.0.5) using GeMTC package, but exceptions were made for individual treatment outcomes that reported zero counts for events (asthma‐related SAEs and dropouts due to AEs). As the data for individual treatments were sparse, we added a continuity correction of 0.5 to make the models stable and ensure convergence when necessary. GeMTC does not allow a continuity correction to be added, so we fit these models in OpenBUGS. We sampled 100,000 iterations for four chains after a burn‐in of 50,000 iterations for models in GeMTC and 100,000 iterations for three chains after a burn‐in of 50,000 iterations for models in OpenBUGS. We used prior distributions for the comparison of pharmacological interventions for between‐study heterogeneity as suggested by Turner and colleagues. (Turner 2015).
We included all eligible studies in the primary analysis as long as a trial was connected to the main network. We based model comparison on the Deviance Information Criterion (DIC) (Spiegelhalter 2002). Differences of three points or more were considered meaningful. If models differed by less than three points, we selected the simplest model. We also calculated the posterior mean of the residual deviance to assess model fit. We considered this adequate when the posterior mean of the residual deviance approximated the number of unconstrained data points (Dias 2013a).
We estimated the probability that each treatment group ranked at one of the five possible positions in the grouped comparisons and presented mean and median ranks along with their 95% CrIs for all the primary and secondary outcomes with rank one, meaning that group was best for that outcome. We presented specific methodological details for each analysis in the result sections.
Direct pairwise meta‐analysis
We performed direct pairwise meta‐analyses using a fixed‐effect or random‐effects model in case of significant heterogeneity (I2 greater than 50%) using Review Manager 5.4 (Review Manager 2020). We undertook a pairwise meta‐analysis only where this was meaningful; that is, if the treatments, participants, and the underlying clinical question were similar enough for pooling to make sense.
Subgroup analysis and investigation of heterogeneity
We classified doses of the ICS component in combination inhalers into medium and high dose and the results were reported individually as well as combining MD‐ and HD‐ICS formulations of each combination therapy (i.e., dual versus triple therapy). We performed a subgroup analysis for exacerbation outcomes separating studies which required a history exacerbation in the previous year vs. those that did not to assess clinical heterogeneity (intransitivity) in the NMAs.
Sensitivity analysis
We performed sensitivity analyses for all the primary and secondary outcomes excluding studies at high risk of bias from the overall analysis and analysed studies of different duration separately for continuous outcomes and ACQ responders. We identified studies at high risk of bias using RoB 2 as described above. We used a model not used in the primary analysis (fixed‐effect or random‐effects) as a sensitivity analysis for all pairwise meta‐analyses and some outcomes in the NMA depending on the model fit.
Threshold analysis
We conducted threshold analyses at the contrast level for the exacerbation outcomes as part of a sensitivity analysis (Phillippo 2018; Phillippo 2019) to examine the impact of potential bias on each treatment contrast of the group comparisons. We did not conduct a threshold analysis for individual treatment comparisons as there was too much uncertainty in the estimates.
Summary of findings and assessment of the certainty of the evidence
We created summary of findings tables using the outcomes listed under Types of outcome measures. We used the five GRADE considerations (risk of bias, consistency of effect, imprecision, indirectness and publication bias) to assess the certainty of a body of evidence as it related to the studies that contributed data for the prespecified outcomes (Guyatt 2011b). We used the methods and recommendations described in Chapter 14 of the Cochrane Handbook for Systematic Reviews of Interventions (Schünemann 2020), using GRADEpro software (GRADEpro GDT). We estimated anticipated absolute effects from each reference comparator (active control) in the included studies. We justified all decisions to downgrade the certainty of evidence using footnotes, and we made comments to aid the reader's understanding of the review where necessary. We presented NMA‐summary of findings tables, proposed by Yepes‐Nuñez and colleagues, for all outcomes in the NMA (Yepes‐Nuñez 2019). It consisted of details of questions and interventions for a specific outcome, relative effect estimates for each intervention, anticipated absolute effects, GRADE certainty of evidence, rank probabilities of the intervention, and interpretations of findings.
Results
Description of studies
Results of the search
Database searching identified 5974 records, after we removed duplicates 3061records remained. The search was conducted up to 18 February 2022. 541 records were excluded by Crowd Known Assessments, and Classifier. We excluded 2402 studies on abstract review. We reviewed the remaining 118 studies for further details and excluded additional 101 studies for various reasons as shown in Figure 14.
14.
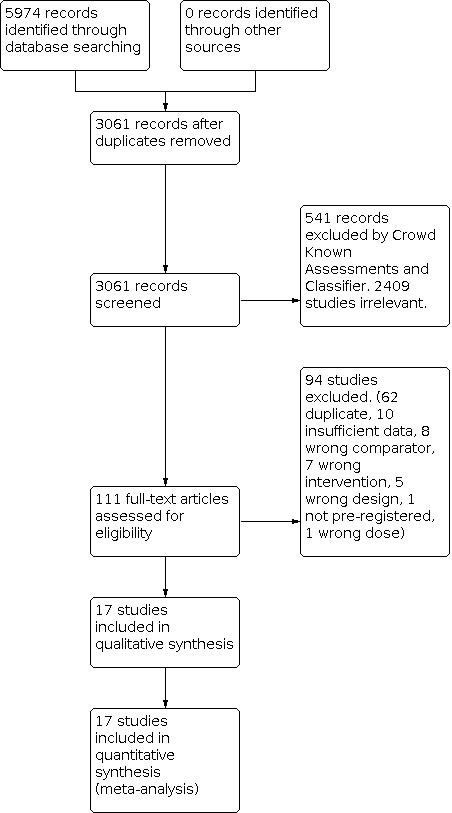
PRISMA flow diagram
Included studies
We included 17 studies (19 trials) with a total of 17,161 participants. The study and patient characteristics including study durations, treatment arms, demographics of participants, and baseline pulmonary function are presented in Table 19 and details of each study are shown in Characteristics of included studies. The median duration of trials was 26 weeks (range 12 to 52). A history of at least one asthma exacerbation within the past year was required in five studies (Gessner 2020; Kerstjens 2012; Kerstjens 2020; Stempel 2016; Virchow 2019). Five studies only included an intra group comparison of MD‐ICS/LABAs (Bernstein 2011; Bodzenta‐Lukaszyk 2012; Cukier 2013; Papi 2007; Woodcock 2013). The number of included studies varied with each outcome due to data availability which is summarised in summary of findings tables. All studies were industry funded and conducted in multiple centres.
1. Study characteristics of included trials.
| Study, year |
Arms included Dose in micrograms |
Duration (weeks) | No. of participants included | Mean age | Male (%) | White (%) | Current smoker excluded/ maximum PYs allowed for ex‐smokers | Baseline FEV1 (L) prebronchodilator (% predicted) | History of at least one asthma exacerbation |
| Bernstein 2011 | MF/FM 200/10 bid | 12 | 371 | 44.8 | 87 | 87 | Y/10 | 2.3 (74) | Not required |
| FP/SAL 250/50 bid | 351 | 45.1 | 86 | 86 | 2.4 (74) | ||||
| Bernstein 2015 | FF/VI 100/25 qd | 12 | 346 | 44.7 | 41 | 89 | Y/10 | 2.0 (63) | Not required |
| FF/VI 200/25 qd | 346 | 45.9 | 35 | 87 | 2.0 (62) | ||||
| Bodzenta‐Lukaszyk 2012 | FP/FM 250/10 bid | 12 | 140 | 49.8 | 37 | 96 | Y/10 | NR (65) | Not required |
| BUD/FM 400/12 bid | 139 | 48.1 | 27 | 96 | NR (64) | ||||
| Busse 2008 | BUD/FM 320/9 bid | 24 | 427 | 39.4 | 34 | 82 | N/20 | 2.5 (79) | Not required |
| FP/SAL 250/50 bid | 406 | 38.8 | 43 | 84 | 2.6 (78) | ||||
| Cukier 2013 | FP/FM 250/12 bid | 12 | 97 | 34.5 | 24 | 67 | Y/10 | 2.5 (86) | Not required |
| BUD/FM 400/12 bid | 99 | 35.6 | 27 | 72 | 2.5 (85) | ||||
| Gessner 2020 | MF/GLY/IND 80/50/150 qd | 24 | 474 | 51.9 | 35 | 85 | N/20 | NR (63) | Required |
| MF/GLY/IND 160/50/150 qd | 476 | 52.7 | 39 | 82 | NR (62) | ||||
| FP/SAL 500/50 bid + Tio 5 qd | 476 | 53.1 | 36 | 82 | NR(63) | ||||
| Kerstjens 2012a | HD‐ICS/LABA | 48 | 237 | 52.9 | 38 | 84 | Y/10 | 1.6 (55) | Required |
| HD‐ICS/LABA+Tio 5 qd | 222 | 53.9 | 36 | 84 | 1.6 (55) | ||||
| Kerstjens 2012b | HD‐ICS/LABA | 48 | 219 | 51.4 | 42 | 80 | Y/10 | 1.7 (55) | Required |
| HD‐ICS/LABA+Tio 5 qd | 234 | 53.6 | 42 | 84 | 1.6 (55) | ||||
| Kerstjens 2020 | MF/GLY/IND 80/50/150 qd | 52 | 620 | 52.4 | 42 | 74 | Y/10 | 1.6 (54) | Required |
| MF/GLY/IND 160/50/150 qd | 619 | 52.1 | 38 | 74 | 1.6 (55) | ||||
| MF/IND 160/150 qd | 617 | 51.8 | 39 | 73 | 1.6 (55) | ||||
| MF/IND 320/150 qd | 618 | 52.0 | 39 | 73 | 1.6 (54) | ||||
| FP/SAL 500/50 bid | 618 | 52.9 | 33 | 76 | 1.6 (55) | ||||
| Lee 2020 | FF/VI 100/25 qd | 24‐52 | 407 | 53.3 | 38 | 80 | Y/10 | 1.7 (58) | Not required |
| FF/UMEC/VI 100/62.5/25 qd | 406 | 52.9 | 39 | 83 | 1.8 (59) | ||||
| FF/VI 200/25 qd | 406 | 53.9 | 38 | 78 | 1.7 (59) | ||||
| FF/UMEC/VI 200/62.5/25 qd | 408 | 53.7 | 37 | 80 | 1.7 (59) | ||||
| Mansfield 2017 | FP/SAL 250/50 bid | 26 | 41 | 45.9 | 51 | 78 | Y/10 | 2.4 (NR) | Not required |
| FP/SAL 200/12.5 bid | 133 | 46.1 | 46 | 71 | 2.3 (NR) | ||||
| FP/SAL 500/50 bid | 44 | 45.6 | 48 | 70 | 2.5 (NR) | ||||
| Papi 2007 | BDP/FM 200/12 bid | 12 | 115 | 47.3 | 45 | NR | Y/10 | 2.1 (68) | Not required |
| FP/SAL 250/50 bid | 113 | 49.7 | 43 | 2.0 (67) | |||||
| Peters 2008 | BUD/FM 640/18 bid | 52 | 443 | 41.0 | 37 | 87 | Y/20 | 2.4 (75) | Not required |
| BUD/FM 320/9 bid | 132 | 38.6 | 41 | 89 | 2.4 (72) | ||||
| Stempel 2016 | FP/SAL 250/50 bid | 26 | 580 | 43.4 | 34 | 75 | Y/10 | NR (PEF>=50%) | Required |
| FP/SAL 500/50 bid | 982 | 43.4 | 34 | 75 | |||||
| van Zyl‐Smit 2020 | MF/IND 320/150 qd | 26‐52 | 445 | 47.1 | 41 | 70 | Y/10 | 2.1 (67) | Not required |
| MF/IND 160/150 qd | 439 | 47.4 | 42 | 71 | 2.1 (67) | ||||
| FP/SAL 500/50 bid | 446 | 48.9 | 43 | 68 | 2.1 (67) | ||||
| Virchow 2019a | BDP/FM/G 200/12/20 bid | 26‐52 | 576 | 52.6 | 38 | 100 | Y/10 | 1.7 (55) | Required |
| BDP/FM 200/12 bid | 574 | 52.5 | 39 | 100 | 1.7 (56) | ||||
| Virchow 2019b | BDP/FM/GLY 400/12/20 bid | 26‐52 | 571 | 53.1 | 37 | 100 | Y/10 | 1.6 (52) | Required |
| BDP/FM 400/12 bid | 573 | 54.0 | 43 | 100 | 1.6 (52) | ||||
| BDP/FM 400/12 bid +Tio 5 qd | 287 | 51.6 | 36 | 100 | 1.6 (52) | ||||
| Weinstein 2010 | MF/FM 200/10 bid | 12 | 233 | 48.4 | 42 | 90 | Y/10 | 2.1 (67) | Not required |
| MF/FM 400/10 bid | 255 | 47.7 | 46 | 89 | 2.0 (66) | ||||
| Woodcock 2013 | FF/VI 100/25 qd | 24 | 403 | 43.8 | 39 | 60 | Y/10 | 2.0 (68) | Not required |
| FP/SAL 250/50 bid | 403 | 41.9 | 39 | 58 | 2.0 (69) |
Abbreviations: bid= twice daily; BDP= beclomethasone dipropionate; BUD=budesonide; FEV1= forced expiratory volume in 1 second; FF=fluticasone furoate; FM=formoterol; FP=fluticasone propionate; GLY= glycopyrronium; IND=indacaterol; MF=mometasone furoate; NR= not reported; PEF=peak flow; PY= pack‐year; qd=once daily; SAL=salmeterol; Tio=tiotropium; UMEC= umeclidinium; VI=vilanterol.
Participants
The mean age and proportion of male and white participants were 49.1 (standard deviation (SD) 15.0) years, 40 %, and 81 %, respectively. Current smokers were excluded in all studies. Previous smokers who had smoked 20 pack‐years or greater were excluded in two studies (Busse 2008 and Gessner 2020) and those who had smoked 10 pack‐years or greater were excluded in the rest. The mean forced expiratory volume in 1 second (FEV1) and FEV1 % predicted at the baseline were reported in 14 and 15 studies and 1.9 L and 61%, respectively.
Excluded studies
We excluded 94 studies after full‐text review (Figure 14) which are recorded in Characteristics of excluded studies, with reasons for exclusion. We excluded Kerwin 2021 because ICS doses were not reported and glycopyrronium formulations used in the trial were not approved for clinical use or commercially available at the time of data extraction.
Risk of bias in included studies
Assessment of risk of bias in each study and outcome is available on the following website: https://www.dropbox.com/s/hi7z3h0ccabdhpb/RoB2%20Figure.xlsx?dl=0 and a summary is presented in Figure 15. ROB 2 judgements and supporting statements are reported in the analysis section for each study and outcome. There were no studies that we should clearly have excluded from this review because of differences in baseline characteristics or poor quality.
15.
Summary of risk of bias assessment using Cochrane 'Risk of bias 2' tool.
ACQ: Asthma Control Questionnaire; AE: adverse event; AQLQ: Asthma Quality of Life Questionnaire; CFB: change from baseline; HD: high dose; ICS: inhaled corticosteroids; LABA: long‐acting beta‐2 agonist; MD: medium dose; SAE: serious adverse event.
Allocation (selection bias)
All studies were randomised controlled trials (RCT)s and industry sponsored. We confirmed a random allocation sequence using a validated computerised system in 12 studies and assumed an industry‐standard method was used forfive5 studies (Busse 2008; Cukier 2013; Kerstjens 2012; Mansfield 2017; Papi 2007). We considered them to be at low risk for random sequence generation and allocation concealment (concealment assumed by automatisation).
Blinding (performance bias and detection bias)
Three studies (Busse 2008; Cukier 2013; Mansfield 2017) were open label and judged to raise “some concerns”. The rest of the studies were double‐blinded which were rated as at low risk of bias (blinding of participants, personnel, and outcome assessors).
Incomplete outcome data (attrition bias)
Attrition rates for CFB in ACQ at 12 months in Lee 2020 and ACQ responders at 6 and 12 months in van Zyl‐Smit 2020 were 80%, 18% to 23%, and 24%, respectively. We rated the risk of the bias to be high for these outcomes. We tested whether the above studies compromised the validity of the results by excluding them which is reported in the results section.
Selective reporting (reporting bias)
We included pre‐registered trials only and all studies reported expected outcomes in publications or industry generated reports on their websites (e.g., Clinical Study Report).
Other potential sources of bias
Study characteristics across the treatment groups are presented in Table 20 for clinical heterogeneity assessment. The MD‐ICS/LABA group had a lower proportion of participants who had an asthma exacerbation within the previous year (33%) compared to other groups (60% or greater). Otherwise, demographic and clinical characteristics of participants were similar across the treatment groups. We conducted a subgroup analysis for exacerbation outcomes separating studies requiring or not requiring a history of asthma exacerbation in the previous year and labelled them as high and low risk group, respectively.
2. Study characteristics of participants across the treatment groups for clinical heterogeneity assessment.
| Treatment arm | No. of participants included | Mean age | Male % | White % | Maximum pack years allowed for smokers | Baseline FEV1 % predicted | History asthma exacerbation (%) |
| MD‐ICS/LABA | 3502 | 48.4 | 39 | 82 | 10 | 60.3 | 33 |
| HD‐ICS/LABA | 5377 | 51.2 | 40 | 83 | 10 | 63.8 | 60 |
| MD TRIPLE | 2652 | 52.5 | 39 | 88 | 10‐20 | 57.0 | 85 |
| HD TRIPLE | 4151 | 52.8 | 37 | 88 | 10‐20 | 55.9 | 90 |
FEV1: forced expiratory volume in 1 second; HD: high dose; ICS: inhaled corticosteroids; LABA: long‐acting beta2 agonist; MD: medium dose.
Effects of interventions
See: Table 1; Table 2; Table 3; Table 4; Table 5; Table 6; Table 7; Table 8; Table 9; Table 10; Table 11; Table 12; Table 13; Table 14; Table 15; Table 16; Table 17; Table 18
1. Primary outcome, asthma exacerbations
1.1 Severe asthma exacerbations (asthma‐related hospitalisations)
1.1.1 Grouped treatments
For this outcome, 7 trials (6911 participants) comparing four treatments provided evidence as dichotomous data, and 1 trial (3072 participants) provided evidence as logHR data (Kerstjens 2020). A network diagram for the studies included in the NMA is presented in Figure 1.
A summary of the studies included in the analysis is presented in Appendix 2. Bernstein 2015 was excluded from the NMA, as both treatment arms reported zero events, effectively not contributing any evidence to the network. A single study (Kerstjens 2020) contributed logHR evidence on the LD Triple versus MD‐ICS/LABA and MD Triple versus HD‐ICS/LABA comparisons, but only two unconnected pairwise comparisons could be included in the NMA as there was no way to calculate the covariance matrix from the evidence available. These two comparisons were included as if they were from independent studies as they had no treatment arms in common.
1.1.1.1 Model selection and inconsistency checking
A half‐normal (0.52) prior distribution was used to model the between‐study heterogeneity in the random‐effects model (Röver 2021). Model fit parameters for the fixed‐effect and random‐effects models are reported in Appendix 3. Both models fit the data well. The between‐study heterogeneity was low but had a wide credible interval (Crl). As the difference in Deviance Information Criterion (DIC) between the fixed‐effect and random‐effects models was less than 3, the simpler fixed‐effect model was chosen for the overall analysis, as well as the subgroup analyses. Results for the fixed‐effect model are presented in Section 1.1.1.2.
A node‐splitting model was fit to assess the inconsistency in the model. The results of the node‐splitting model are presented in Table 21. There was no evidence to suggest there was any inconsistency in the model.
3. Node‐splitting results for severe exacerbations.
| Model | p |
Mean LHR (95% CrI) |
| MD Triple vs. HD‐ICS/LABA | ||
| Direct | 0.717 | 0.091 (‐0.928, 0.995) |
| Indirect | 0.328 (‐0.785, 1.422) |
|
| Network | 0.184 (‐0.586, 0.930) |
|
| HD Triple vs. MD‐ICS/LABA | ||
| Direct | 0.492 | ‐0.189 (‐1.519, 0.912) |
| Indirect | 0.250 (‐0.606, 1.124) |
|
| Network | 0.131 (‐0.621, 0.880) |
|
| HD Triple vs. MD Triple | ||
| Direct | 0.506 | ‐0.700 (‐2.004, 0.392) |
| Indirect | ‐0.261 (‐1.234, 0.694) |
|
| Network | ‐0.416 (‐1.235, 0.414) |
|
Negative valued LHR favours the first named treatment. CrI: credible interval; HD: high dose; ICS: inhaled corticosteroids; LABA: long‐acting beta‐2 agonist; LHR: log hazard ratio; MD: medium dose.
1.1.1.2 NMA results
Hazard ratios (HRs) for severe exacerbations in grouped treatments are presented in Figure 16. The HRs for the comparison of all treatment groups against each other are reported in Table 22. There is insufficient evidence to suggest that there is a change in hazards of severe exacerbations for any of the treatment comparisons. An NMA summary of findings is presented in Table 1
16.
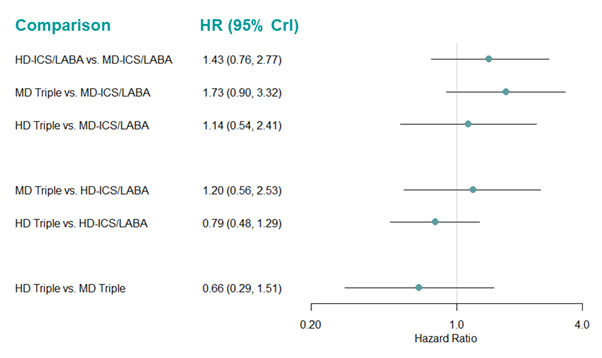
Forest plot of hazard ratios for severe exacerbations for grouped treatments. Hazard ratios less than one favors the first named treatment.
CrI: Credible Interval; HD: high dose; HR: hazard ratio; ICS: inhaled corticosteroids; LABA: long‐acting beta‐2 agonist; MD: medium dose.
4. Hazard ratio for severe exacerbations (fixed‐effect model).
| Median HR (95% CrI) | |||
| Comparison | Overall | High Risk | Low Risk |
| HD‐ICS/LABA vs MD‐ICS/LABA | 1.43 (0.76, 2.77) | 13.41 (2.04, 191.20)* | 0.76 (0.33, 1.80) |
| MD Triple vs. MD‐ICS/LABA | 1.73 (0.90, 3.32) | 1.89 (0.80, 4.47) | 1.03 (0.36, 2.78) |
| HD Triple vs MD‐ICS/LABA | 1.14 (0.54, 2.41) | 11.77 (1.61, 169.90)* | 0.56 (0.14, 1.79) |
| MD Triple vs. HD‐ICS/LABA | 1.20 (0.56, 2.53) | 0.14 (0.01, 1.14) | 1.34 (0.45, 3.87) |
| HD Triple vs HD‐ICS/LABA | 0.79 (0.48, 1.29) | 0.85 (0.49, 1.48) | 0.73 (0.18, 2.45) |
| HD Triple vs MD Triple | 0.66 (0.29, 1.51) | 6.23 (0.70, 104.30)* | 0.55 (0.14, 1.85) |
The second named treatment is the baseline intervention. Hazard ratio less than one favours the first named treatment. *HRs are extremely uncertain due to network sparsity and should be treated with caution. CrI: credible interval; HD: high dose; HR: hazard ratio; ICS: inhaled corticosteroids; LABA: long‐acting beta‐2 agonist; MD: medium dose.
The rank plots for grouped treatments are presented in Figure 17, and the mean and median ranks with their corresponding 95% CrIs are presented in Table 23. MD‐ICS/LABA and HD Triple have a higher probability of being better than the other three treatments (median rank 1.0 [95% CrI 1 to 3] and 2 [1 to 4], respectively). However, treatment ranks are very uncertain, displaying wide credible intervals, and all treatments have rank probabilities of 50% and below.
17.
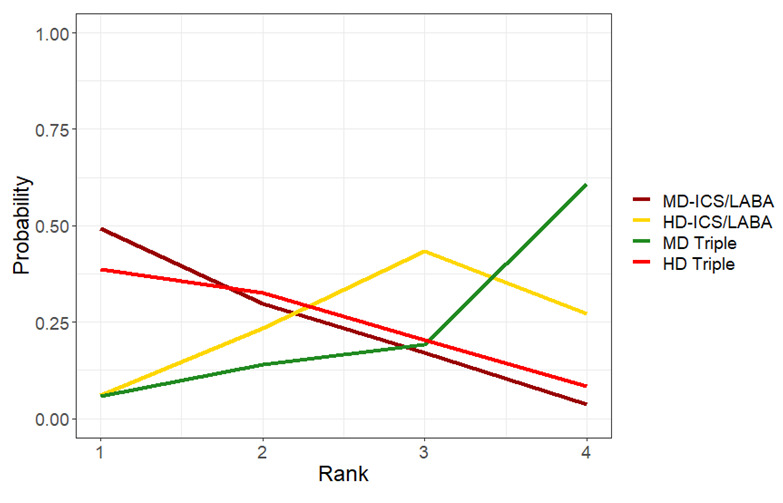
Rank plots for grouped treatments for severe exacerbations (fixed effect model).
HD: high dose; ICS: inhaled corticosteroids; LABA: long‐acting beta‐2 agonist; MD: medium dose.
5. Mean and median ranking for severe exacerbations sorted by mean rank (fixed‐effect model).
| Overall | High Risk Subgroup | Low Risk Subgroup | |||||||
| Treatments | Mean Rank | Median Rank | 95% CrI | Mean Rank | Median Rank | 95% CrI | Mean Rank | Median Rank | 95% CrI |
| MD‐ICS/LABA | 1.55 | 1.0 | (1.0, 3.0) | 1.077 | 1.0 | (1.0, 2.0) | 3.05 | 3.0 | (1.0, 4.0) |
| HD Triple | 1.97 | 2.0 | (1.0, 4.0) | 3.223 | 3.0 | (2.0, 4.0) | 1.64 | 1.0 | (1.0, 4.0) |
| HD‐ICS/LABA | 3.01 | 3.0 | (1.0, 4.0) | 3.679 | 4.0 | (3.0, 4.0) | 2.25 | 2.0 | (1.0, 4.0) |
| MD Triple | 3.47 | 4.0 | (1.0, 4.0) | 2.021 | 2.0 | (1.0, 4.0) | 3.06 | 3.0 | (1.0, 4.0) |
CrI: credible interval; HD: high dose; ICS: inhaled corticosteroids; LABA: long‐acting beta‐2 agonist; MD: medium dose.
Results for the subgroups were largely consistent with the overall analysis (Table 22). The only exception is the comparison of HD‐ICS/LABA vs. MD‐ICS/LABA where HD‐ICS/LABA increased the hazards of severe exacerbations compared to MD‐ICS/LABA in the high‐risk group (HR 13.4 [95% CrI 2.0 to 191.2]), although the credible interval indicates that this estimate is very uncertain. Due to the sparse nature of the network for the high‐risk group, HRs for the HD‐ICS/LABA vs. MD‐ICS/LABA, HD Triple vs. MD‐ICS/LABA, and HD Triple vs. MD Triple comparisons were extremely uncertain. Details of the subgroup analyses are described below.
1.1.1.2.1 High‐risk subgroup
For this outcome, 5 trials (7063 participants) provided evidence as dichotomous data across four individual treatments. A network diagram for the studies included in the NMA is presented as Figure 18. This network is very sparse, treatments are only connected by a single study and there are no evidence loops.
18.
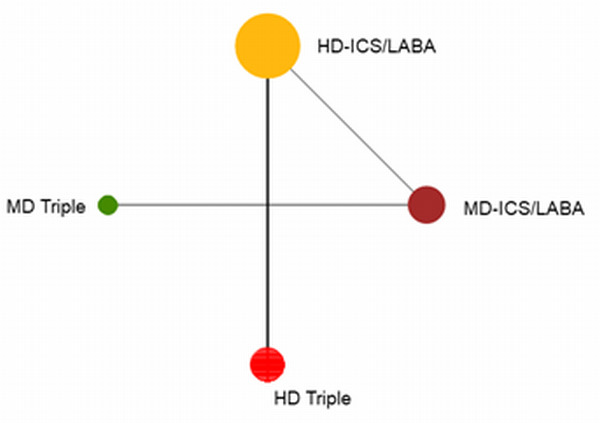
Network diagram for severe exacerbations for high‐risk individuals.
The size of the nodes and the thickness of edges depend on the number of people randomised and the number of trials conducted. HD: high dose; ICS: inhaled corticosteroids; LABA: long‐acting beta‐2 agonist; MD: medium dose.
A summary of the studies included in the analysis is presented in Appendix 2. A single study (Kerstjens 2020) contributed logHR evidence, but only two unconnected pairwise comparisons were included in the NMA as independent studies as there was no way to calculate the covariance matrix from the evidence available.
A half‐normal(0.502) prior distribution was used to model the between‐study heterogeneity in the random‐effects model (Röver 2021). Model fit parameters for the fixed‐ and random‐effects models are reported in Appendix 3. Both fixed‐effect and random‐effects models fit the data well. There was moderate between‐study heterogeneity with a wide 95% credible interval. As the difference in DIC between the fixed‐ and random‐effects models was less than 3, the simpler fixed‐effect model was chosen. There is no potential for inconsistency in this network as there is no independent, indirect evidence for any of the comparisons.
Hazard ratios for severe exacerbations in high‐risk studies are presented in Figure 19. The HRs for the comparison of all treatment groups against each other are reported in Table 22. The impact of the sparse evidence, exhibited in the network diagram can be seen in the number of comparisons for which HRs were extremely uncertain (highlighted in yellow in Table 22).
19.
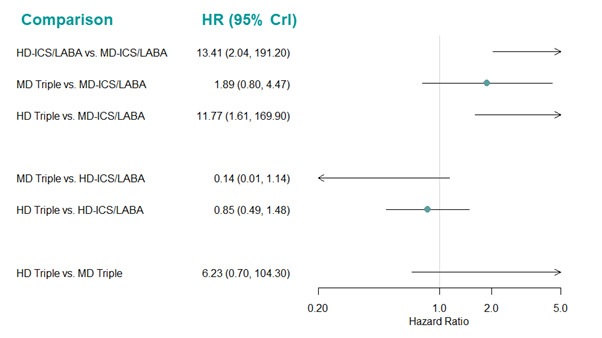
Forest plot of hazard ratios for severe exacerbations for high‐risk individuals.
Hazard ratio less than one favours the first named treatment. Crl: credible interval, HD: high dose; ICS: inhaled corticosteroids; LABA: long‐acting beta‐2 agonist; MD: medium dose.
The rank plots are presented in Figure 20, and the mean and median ranks with their corresponding 95% CrIs are presented in Table 23. MD‐ICS/LABA had the highest probability of being ranked the best treatment (median rank 1 [95% CrI 1 to 2]). However, the 95% credible intervals for all other treatments are wide, reflecting the high uncertainty in the HRs estimated and treatment rankings.
20.
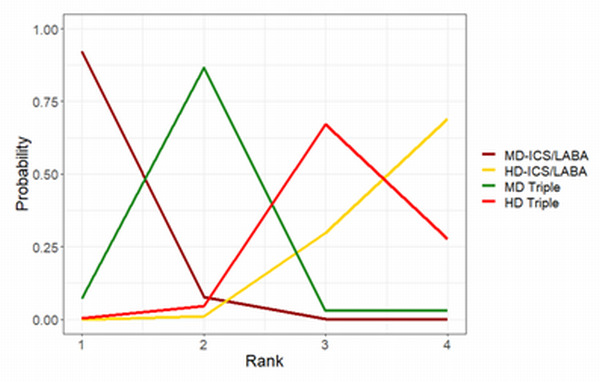
Rank plots for severe exacerbations for high‐risk individuals. (fixed effect model).
HD: high dose; ICS: inhaled corticosteroids; LABA: long‐acting beta‐2 agonist; MD: medium dose.
1.1.1.2.2 Low‐risk subgroup
For this outcome, 5 trials (4436 participants) comparing four treatments provided evidence as dichotomous data. A network diagram for the studies included in the NMA is presented in Figure 21. A summary of the studies included in the analysis is presented in Appendix 2. Bernstein 2015 was excluded from the NMA, as both treatment arms reported zero events, effectively not contributing any evidence to the network.
21.
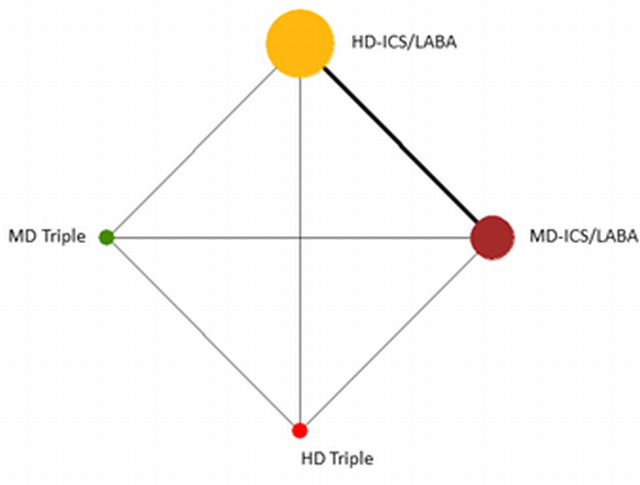
Network diagram for severe exacerbations for low‐risk individuals.
The size of the nodes and the thickness of edges depend on the number of people randomised and the number of trials conducted. HD: high dose; ICS: inhaled corticosteroids; LABA: long‐acting beta‐2 agonist; MD: medium dose.
A half‐normal(0.52) prior distribution was used to model the between‐study heterogeneity in the random‐effects model (Röver 2021). Model fit parameters for the fixed‐effect and random‐effects models are reported in Appendix 3. Both models fit the data well. There was moderate between‐study heterogeneity, with a wide 95% credible interval. As the difference in DICs between the fixed‐effect and random‐effects models was less than 3, the simpler fixed‐effect model was chosen. There is no potential for inconsistency in this network as there is no independent indirect evidence for any of the comparisons.
Hazard ratios for severe exacerbations in low‐risk studies are presented in Figure 22. The HRs for the comparison of all treatment groups against each other are reported in Table 22. There is insufficient evidence to suggest that there is a change in hazards of severe exacerbations for any of the treatment comparisons.
22.
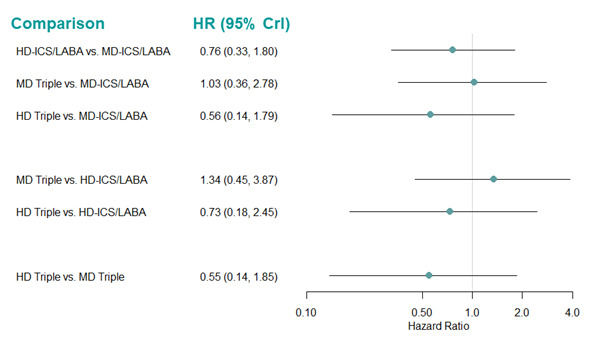
Forest plot of hazard ratios for severe exacerbations for low‐risk individuals.
Hazard ratio less than one favours the first named treatment. Crl: credible interval, HD: high dose; ICS: inhaled corticosteroids; LABA: long‐acting beta‐2 agonist; MD: medium dose.
The rank plots for grouped treatments are presented in Figure 23, and the mean and median ranks with their corresponding 95% CrIs are presented in Table 23. HD Triple ranks higher than the other treatments (median rank 1 [95% CrI 1 to 4]), but the wide credible intervals demonstrate the uncertainty in treatment rankings.
23.
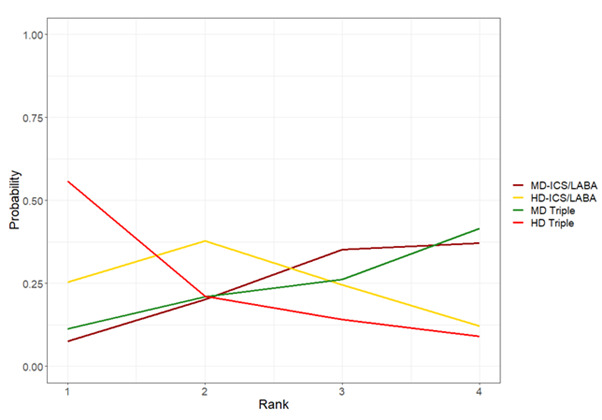
Rank plots for severe exacerbations for low‐risk individuals. (fixed effect model).
HD: high dose; ICS: inhaled corticosteroids; LABA: long‐acting beta‐2 agonist; MD: medium dose.
1.1.1.3 Threshold analysis
The forest plot for the threshold analysis is presented in Figure 24 and the thresholds and new optimum treatments, based only on the treatment with the best relative effect, are presented in Table 24. Credible intervals for the HD‐ICS/LABA vs. MD‐ICS/LABA, MD Triple versus MD‐ICS/LABA, HD Triple versus HD‐ICS/LABA, and HD Triple versus MD Triple comparisons extend beyond the limits of the invariance intervals, suggesting the recommended treatment is sensitive to uncertainty in the data. The recommended treatment did seem to be sensitive to moderate potential bias in the negative direction for the HD‐ICS/LABA vs. MD‐ICS/LABA, MD Triple vs. MD‐ICS/LABA, and HD Triple versus HD‐ICS/LABA comparisons, which would make HD Triple the recommended treatment. This is consistent with the ranks discussed in Section 1.1.1.2, where HD Triple is ranked the next best treatment after MD‐ICS/LABA.
24.
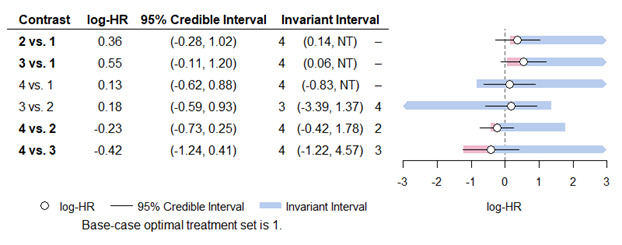
Forest plot for threshold analysis for grouped treatments for severe exacerbations (fixed effect model)
Treatment Codes: 1=MD‐ICS/LABA, 2= HD‐ICS/LABA, 3=MD Triple, 4= HD Triple. The optimum treatment for this analysis was MD‐ICS/LABA.
HD: high dose; HR: hazard ratio; ICS: inhaled corticosteroids; LABA: long‐acting beta‐2 agonist; LD: low dose; MD: medium dose; NT: no threshold (no amount of change in this direction would change the recommendation).
6. Thresholds for severe exacerbations.
| Lower Threshold | Upper Threshold | |||
| Comparison | New Optimal Treatment | Change in lnHR | New Optimal Treatment | Change in lnHR |
| HD‐ICS/LABA vs. MD‐ICS/LABA | HD Triple | ‐0.220 | N/A | Inf |
| MD Triple vs. MD‐ICS/LABA | HD Triple | ‐0.481 | N/A | Inf |
| HD Triple vs. MD‐ICS/LABA | HD Triple | ‐0.958 | N/A | Inf |
| MD Triple vs. HD‐ICS/LABA | MD Triple | ‐3.574 | HD Triple | 1.190 |
| HD Triple vs. HD‐ICS/LABA | HD Triple | ‐0.186 | HD‐ICS/LABA | 2.013 |
| HD Triple vs. MD Triple | HD Triple | ‐0.807 | MD Triple | 4.990 |
CrI: credible interval; HD: high dose; ICS: inhaled corticosteroids; Inf= Infinity; lnHR=log hazard ratio; LABA: long‐acting beta‐2 agonist; MD: medium dose; N/A= Not Applicable.
1.1.1.4 Pairwise meta‐analysis
The evidence suggests there is little or no difference in severe exacerbations for any of the treatment comparisons (7 trials, 6911 participants; [low to moderate certainty]) (Analysis 1.1: Table 2). The results are qualitatively similar to those of the NMA as shown in Table 21. There is no difference in severe exacerbations comparing triple (ICS/LABA/LAMA) with dual therapy (ICS/LABA) when analysed combining MD‐ and HD‐ICS formulations in each combination therapy. There was no difference in the results between fixed‐effect and random‐effects models.
1.1. Analysis.
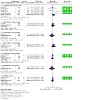
Comparison 1: Asthma exacerbations, Outcome 1: Severe exacerbations
The results of subgroup analyses are presented in Analysis 6.1; Analysis 6.2; Analysis 6.3; Analysis 6.4; Analysis 6.5; Analysis 6.6; Analysis 6.7). The results are consistent with the whole group analysis except for HD‐ICS/LABA vs. MD‐ICS/LABA in the high‐risk group in which HD‐ICS/LABA was associated with a higher risk of severe exacerbations compared to MD‐ICS/LABA (1 trial, 1562 participants; RR 8.27 [95% CI 1.09 to 62.72], Analysis 6.1).
6.1. Analysis.
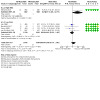
Comparison 6: Severe exacerbations (high and low risk subgroups), Outcome 1: HD‐ICS/LABA vs MD‐ICS/LABA
6.2. Analysis.

Comparison 6: Severe exacerbations (high and low risk subgroups), Outcome 2: MD TRIPLE vs MD‐ICS/LABA
6.3. Analysis.
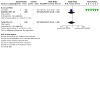
Comparison 6: Severe exacerbations (high and low risk subgroups), Outcome 3: HD TRIPLE vs MD‐ICS/LABA
6.4. Analysis.

Comparison 6: Severe exacerbations (high and low risk subgroups), Outcome 4: MD TRIPLE vs HD‐ICS/LABA
6.5. Analysis.
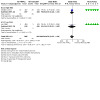
Comparison 6: Severe exacerbations (high and low risk subgroups), Outcome 5: HD TRIPLE vs HD‐ICS/LABA
6.6. Analysis.

Comparison 6: Severe exacerbations (high and low risk subgroups), Outcome 6: HD TRIPLE vs MD TRIPLE
6.7. Analysis.
Comparison 6: Severe exacerbations (high and low risk subgroups), Outcome 7: TRIPLE vs DUAL
1.1.2 Individual treatments
For this outcome, 9 trials (7217 participants) provided evidence as dichotomous data, and 1 trial (3072 participants) provided evidence as logHR data (Kerstjens 2020), comparing 14 treatments across the network. A network diagram for the studies included in the NMA is presented as Figure 25. A summary of the studies included in the analysis is presented in Appendix 4. The dichotomous study Bernstein 2015 was excluded from the NMA, as both treatment arms reported zero events, effectively not contributing any evidence to the network. A single study (Kerstjens 2020) contributed logHR evidence, but only two unconnected pairwise comparisons were included in the NMA as independent studies as there was no way to calculate the covariance matrix from the evidence available. We added a continuity correction of 0.5 to the zero count events to help improve model convergence due to the sparsity of the evidence in Mansfield 2017.
25.
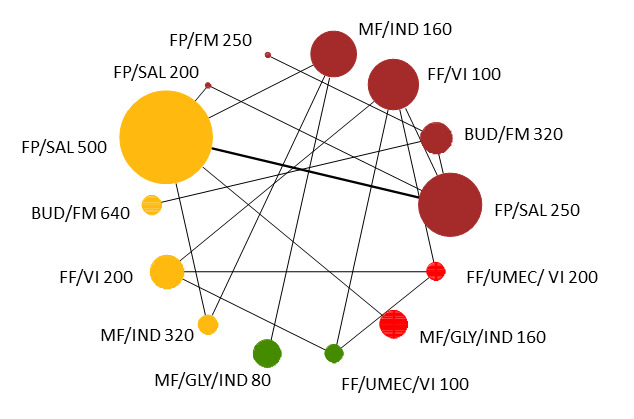
Network diagram for severe exacerbations for individual interventions.
Node colors denote the treatment group. The size of the nodes and the thickness of edges depend on the number of people randomised and the number of trials conducted. BUD:budesonide, CrI:Credible Interval, FF:fluticasone furoate, FM:formoterol, FP:fluticasone propionate, GLY: glycopyrronium, IND:indacaterol, MF:mometasone furoate, SAL:salmeterol, Tio: tiotropium, UMEC: umeclidinium, VI:vilanterol.
1.1.2.1 Model selection and inconsistency checking
A half‐normal (0, 0.52) prior was used to model the between‐study heterogeneity in the random‐effects model (Röver 2021). Model fit parameters for the fixed‐effect and random‐effects models are reported in Appendix 3. Both fixed‐effect and random‐effects models fit the data well. The between‐study heterogeneity was low but with a wide credible interval. As the difference in DICs between the fixed‐effect and random‐effects models was less than 3, the simpler fixed‐effect model was chosen. Results for the fixed‐effect model are presented in Section 1.1.2.2. There is no potential for inconsistency in this network as there is no independent, indirect evidence for any of the comparisons.
1.1.2.2 NMA results
Hazard ratios for severe exacerbations in individual treatments, compared to fluticasone propionate/salmeterol (FP/SAL) 250/50 µg (MD‐ICS/LABA) are presented in Figure 26. The HRs for the comparison of all treatment groups against each other are reported in Table 25. The impact of the sparse evidence available for each comparison can be seen in the number of comparisons for which the HRs are extremely uncertain (highlighted in yellow in Table 25).
26.
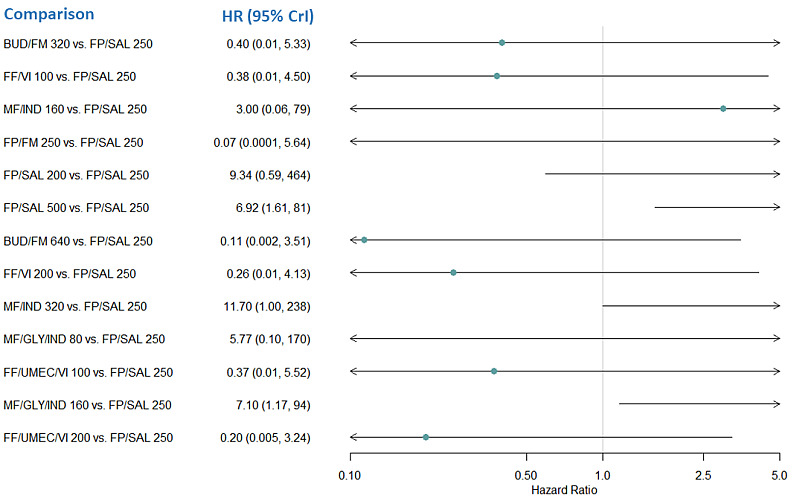
Forest plot of hazard ratios relative to FP/SAL 250 for severe exacerbations for individual treatments.
Hazard ratio less than one favors the first named treatment. BUD:budesonide, CrI:Credible Interval, FF:fluticasone furoate, FM:formoterol, FP:fluticasone propionate, GLY: glycopyrronium, HR: hazard ratio; IND:indacaterol, MF:mometasone furoate, SAL:salmeterol, UMEC: umeclidinium, VI:vilanterol
7. Hazard ratio for severe exacerbations for individual treatments (fixed‐effect model).
| Comparison | Median HR (95% CrI) |
| BUD/FM 320 vs. FP/SAL 250 | 0.40 (0.01, 5.33) |
| FF/VI 100 vs. FP/SAL 250 | 0.38 (0.01, 4.50) |
| MF/IND 160 vs. FP/SAL 250 | 3.00 (0.06, 78.87)* |
| FP/FM 250 vs. FP/SAL 250 | 0.07 (0.0001, 5.64) |
| FP/SAL 200 vs. FP/SAL 250 | 9.34 (0.59, 464.10)* |
| FP/SAL 500 vs. FP/SAL 250 | 6.92 (1.61, 80.79)* |
| BUD/FM 640 vs. FP/SAL 250 | 0.11 (0.002, 3.51) |
| FF/VI 200 vs. FP/SAL 250 | 0.26 (0.01, 4.13) |
| MF/IND 320 vs. FP/SAL 250 | 11.70 (1.00, 237.80)* |
| MF/GLY/IND 80 vs. FP/SAL 250 | 5.77 (0.10, 170.20)* |
| FF/UMEC/VI 100 vs. FP/SAL 250 | 0.37 (0.010, 5.52) |
| MF/GLY/IND 160 vs. FP/SAL 250 | 7.10 (1.17, 93.56)* |
| FF/UMEC/VI 200 vs. FP/SAL 250 | 0.20 (0.005, 3.24) |
| FF/VI 100 vs. BUD/FM 320 | 0.94 (0.012, 62.44)* |
| MF/IND 160 vs. BUD/FM 320 | 7.87 (0.06, 812.80)* |
| FP/FM 250 vs. BUD/FM 320 | 0.20 (0.0004, 5.64) |
| FP/SAL 200 vs. BUD/FM 320 | 26.98 (0.53, 3628)* |
| FP/SAL 500 vs. BUD/FM 320 | 19.87 (0.88, 1034)* |
| BUD/FM 640 vs. BUD/FM 320 | 0.29 (0.03, 2.82) |
| FF/VI 200 vs. BUD/FM 320 | 0.64 (0.007, 50.68)* |
| MF/IND 320 vs. BUD/FM 320 | 32.17 (0.84, 2463)* |
| MF/GLY/IND 80 vs. BUD/FM 320 | 14.87 (0.11, 1687)* |
| FF/UMEC/VI 100 vs. BUD/FM 320 | 0.92 (0.01, 70.48)* |
| MF/GLY/IND 160 vs. BUD/FM 320 | 19.92 (0.74, 1124)* |
| FF/UMEC/VI 200 vs. BUD/FM 320 | 0.49 (0.006, 38.79) |
| MF/IND 160 vs. FF/VI 100 | 8.54 (0.08, 785.50)* |
| FP/FM 250 vs. FF/VI 100 | 0.18 (0.0002, 46.45) |
| FP/SAL 200 vs. FF/VI 100 | 28.91 (0.60, 3650)* |
| FP/SAL 500 vs. FF/VI 100 | 21.04 (0.93, 1036)* |
| BUD/FM 640 vs. FF/VI 100 | 0.32 (0.003, 39.12) |
| FF/VI 200 vs. FF/VI 100 | 0.69 (0.20, 2.21) |
| MF/IND 320 vs. FF/VI 100 | 34.58 (0.84, 2500)* |
| MF/GLY/IND 80 vs. FF/VI 100 | 16.25 (0.13, 1628)* |
| FF/UMEC/VI 100 vs. FF/VI 100 | 0.99 (0.34, 2.93) |
| MF/GLY/IND 160 vs. FF/VI 100 | 21.23 (0.79, 1173)* |
| FF/UMEC/VI 200 vs. FF/VI 100 | 0.54 (0.14,1.84) |
| FP/FM 250 vs. MF/IND 160 | 0.02 (0.00001, 8.51) |
| FP/SAL 200 vs. MF/IND 160 | 3.35 (0.09, 372.80)* |
| FP/SAL 500 vs. MF/IND 160 | 2.41 (0.20, 100.10)* |
| BUD/FM 640 vs. MF/IND 160 | 0.04 (0.0002, 8.01) |
| FF/VI 200 vs. MF/IND 160 | 0.08 (0.0007, 10.23) |
| MF/IND 320 vs. MF/IND 160 | 3.79 (0.41, 147.00)* |
| MF/GLY/IND 80 vs. MF/IND 160 | 1.89 (0.80, 4.47) |
| FF/UMEC/VI 100 vs. MF/IND 160 | 0.12 (0.001, 14.12) |
| MF/GLY/IND 160 vs. MF/IND 160 | 2.45 (0.17, 109.20)* |
| FF/UMEC/VI 200 vs. MF/IND 160 | 0.06 (0.0006, 8.22) |
| FP/SAL 200 vs. FP/FM 250 | 170.90 (0.74, 284800)* |
| FP/SAL 500 vs. FP/FM 250 | 121.20 (0.98, 127600)* |
| BUD/FM 640 vs. FP/FM 250 | 1.61 (0.03, 949.80)* |
| FF/VI 200 vs. FP/FM 250 | 3.81 (0.01, 5159)* |
| MF/IND 320 vs. FP/FM 250 | 200.60 (1.10, 272600)* |
| MF/GLY/IND 80 vs. FP/FM 250 | 91.20 (0.21, 145100)* |
| FF/UMEC/VI 100 vs. FP/FM 250 | 5.51 (0.02, 7370)* |
| MF/GLY/IND 160 vs. FP/FM 250 | 122.10 (0.86, 136600)* |
| FF/UMEC/VI 200 vs. FP/FM 250 | 2.96 (0.01, 4057)* |
| FP/SAL 500 vs. FP/SAL 200 | 0.82 (0.03, 8.69) |
| BUD/FM 640 vs. FP/SAL 200 | 0.01 (0.0001, 1.03) |
| FF/VI 200 vs. FP/SAL 200 | 0.02 (0.0002, 1.38) |
| MF/IND 320 vs. FP/SAL 200 | 1.25 (0.03, 30.15) |
| MF/GLY/IND 80 vs. FP/SAL 200 | 0.56 (0.005, 23.05) |
| FF/UMEC/VI 100 vs. FP/SAL 200 | 0.03 (0.0002, 1.91) |
| MF/GLY/IND 160 vs. FP/SAL 200 | 0.81 (0.03, 10.71) |
| FF/UMEC/VI 200 vs. FP/SAL 200 | 0.02 (0.0001, 1.13) |
| BUD/FM 640 vs. FP/SAL 500 | 0.01 (0.0002, 0.71) |
| FF/VI 200 vs. FP/SAL 500 | 0.03 (0.001, 0.93) |
| MF/IND 320 vs. FP/SAL 500 | 1.57 (0.24, 12.53) |
| MF/GLY/IND 80 vs. FP/SAL 500 | 0.77 (0.02, 10.92) |
| FF/UMEC/VI 100 vs. FP/SAL 500 | 0.05 (0.001, 1.26) |
| MF/GLY/IND 160 vs. FP/SAL 500 | 1.00 (0.37, 2.68) |
| FF/UMEC/VI 200 vs. FP/SAL 500 | 0.02 (0.0004, 0.73) |
| FF/VI 200 vs. BUD/FM 640 | 2.15 (0.01, 299.50)* |
| MF/IND 320 vs. BUD/FM 640 | 112.30 (1.463, 15230)* |
| MF/GLY/IND 80 vs. BUD/FM 640 | 51.28 (0.23, 9561)* |
| FF/UMEC/VI 100 vs. BUD/FM 640 | 3.09 (0.02, 410.20)* |
| MF/GLY/IND 160 vs. BUD/FM 640 | 69.57 (1.25, 6911)* |
| FF/UMEC/VI 200 vs. BUD/FM 640 | 1.66 (0.01, 228.10)* |
| MF/IND 320 vs. FF/VI 200 | 51.33 (1.03, 4278)* |
| MF/GLY/IND 80 vs. FF/VI 200 | 23.70 (0.17, 2801)* |
| FF/UMEC/VI 100 vs. FF/VI 200 | 1.43 (0.44,4.97) |
| MF/GLY/IND 160 vs. FF/VI 200 | 31.90 (0.94, 2048)* |
| FF/UMEC/VI 200 vs. FF/VI 200 | 0.78 (0.18, 3.10) |
| MF/GLY/IND 80 vs. MF/IND 320 | 0.49 (0.01, 5.52) |
| FF/UMEC/VI 100 vs. MF/IND 320 | 0.03 (0.0003, 1.39) |
| MF/GLY/IND 160 vs. MF/IND 320 | 0.64 (0.06, 5.34) |
| FF/UMEC/VI 200 vs. MF/IND 320 | 0.02 (0.0002, 0.80) |
| FF/UMEC/VI 100 vs. MF/GLY/IND 80 | 0.06 (0.0005, 8.15) |
| MF/GLY/IND 160 vs. MF/GLY/IND 80 | 1.31 (0.08, 62.71)* |
| FF/UMEC/VI 200 vs. MF/GLY/IND 80 | 0.03 (0.0003, 4.74) |
| MF/GLY/IND 160 vs. FF/UMEC/VI 100 | 21.94 (0.68, 1362)* |
| FF/UMEC/VI 200 vs. FF/UMEC/VI 100 | 0.55 (0.14, 1.89) |
| FF/UMEC/VI 200 vs. MF/GLY/IND/160 | 0.02 (0.0004, 0.85) |
The second named treatment is the baseline intervention. Hazard ratio less than one favours the first named treatment. Treatment comparisons in bold do not include the “null” effect. *HRs are extremely uncertain due to network sparsity and should be interpreted with caution. BUD=budesonide, CrI=Credible Interval, FF=fluticasone furoate, FM=formoterol, FP=fluticasone propionate, GLY= glycopyrronium, HR=hazard ratio, IND=indacaterol, MF=mometasone furoate, SAL=salmeterol, UMEC= umeclidinium, VI=vilanterol.
The rank plots for individual treatments are presented in Figure 27, and the mean and median ranks with their corresponding 95% CrIs are presented in Table 26. Overall, treatment ranks are very uncertain displaying wide credible intervals, and all treatments have rank probabilities of less than 50%.
27.
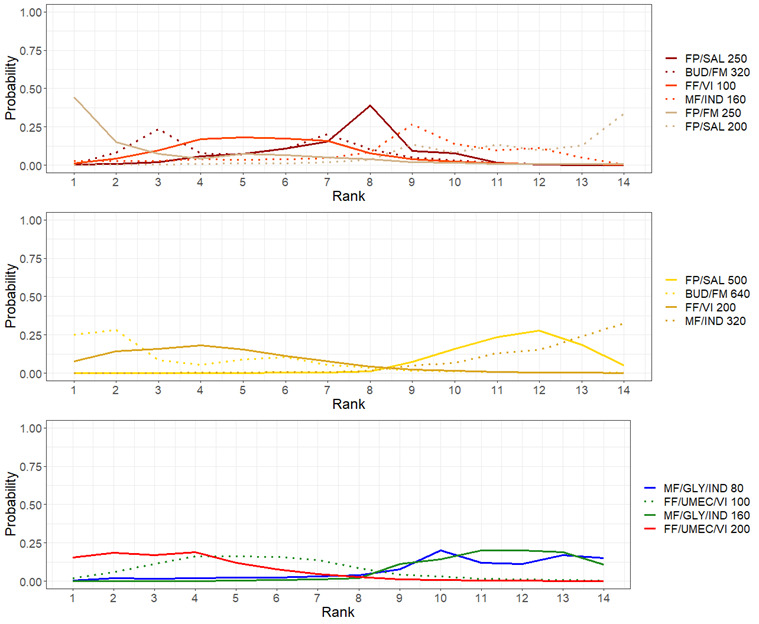
Rank plots for individual treatments for severe exacerbations (fixed effect model).
Line colors denote the treatment group. BUD:budesonide, FF:fluticasone furoate, FM:formoterol, FP:fluticasone propionate, GLY: glycopyrronium, IND:indacaterol, MF:mometasone furoate, SAL:salmeterol, Tio:tiotropium, UMEC: umeclidinium, VI:vilanterol.
8. Mean and median ranking for individual treatments for severe exacerbations sorted by mean rank (fixed‐effect model).
| Treatments | Mean Rank | Median Rank | 95% CrI |
| FP/FM 250 | 3.24 | 2.0 | (1.0, 11.0) |
| BUD/FM 640 | 3.49 | 2.0 | (1.0, 10.0) |
| FF/UMEC/VI 200 | 3.71 | 3.0 | (1.0, 9.0) |
| FF/VI 200 | 4.42 | 4.0 | (1.0, 10.0) |
| BUD/FM 320 | 5.62 | 6.0 | (2.0, 11.0) |
| FF/VI 100 | 5.64 | 5.0 | (2.0, 11.0) |
| FF/UMEC/VI 100 | 5.64 | 5.0 | (2.0, 11.0) |
| FP/SAL 250 | 7.31 | 8.0 | (3.0, 10.0) |
| MF/IND 160 | 8.70 | 9.0 | (1.0, 13.0) |
| MF/GLY/IND 80 | 10.60 | 11.0 | (3.0, 14.0) |
| MF/GLY/IND 160 | 11.36 | 11.0 | (8.0, 14.0) |
| FP/SAL 500 | 11.41 | 12.0 | (9.0, 14.0) |
| FP/SAL 200 | 11.59 | 12.0 | (6.0, 14.0) |
| MF/IND 320 | 12.27 | 13.0 | (8.0, 14.0) |
BUD=budesonide, CrI=Credible Interval, FF=fluticasone furoate, FM=formoterol, FP=fluticasone propionate, GLY= glycopyrronium, IND=indacaterol, MF=mometasone furoate, SAL=salmeterol, UMEC= umeclidinium, VI=vilanterol
1.2 Primary outcome: moderate to severe (steroid‐requiring) asthma exacerbations
1.2.1 Grouped treatments
For this outcome, 10 trials (12,407 participants) comparing four treatments provided evidence as dichotomous data. A network diagram for the studies included in the NMA is presented as Figure 2. A summary of the studies included in the analysis is presented in Appendix 5.
1.2.1.1 Model selection and inconsistency checking
Model fit parameters for the fixed‐effect and random‐effects models are reported in Appendix 3. Both fixed‐effect‐ and random‐effects models fit the data well. The between‐study heterogeneity was low. As the difference in DICs between the fixed‐effect and random‐effects models was less than 3, the simpler fixed‐effect model was chosen for the overall analysis, as well as the subgroup analyses. Results for the fixed‐effect model are presented in Section 1.2.1.2.
A node‐splitting model was fit to assess the inconsistency in the model. The results of the node‐splitting model are presented in Table 27. There was no evidence to suggest any inconsistency in the model.
9. Node‐splitting results for moderate to severe exacerbations for grouped treatments.
| Overall | High Risk Subgroup | ||||
| Model | p |
Mean LHR (95% CrI) |
Model | p |
Mean LHR (95% CrI) |
| HD‐ICS/LABA vs. MD‐ICS/LABA | HD‐ICS/LABA vs. MD‐ICS/LABA | ||||
| Direct | 0.556 | ‐0.100 (‐0.318, 0.118) |
Direct | 0.616 | ‐0.043 (‐0.705, 0.639) |
| Indirect | ‐0.268 (‐0.858, 0.289) |
Indirect | ‐0.250 (‐1.361, 0.706) |
||
| Network | ‐0.120 (‐0.303, 0.059) |
Network | ‐0.087 (‐0.456, 0.236) |
||
| MD Triple vs. MD‐ICS/LABA | MD Triple vs. MD‐ICS/LABA | ||||
| Direct | 0.439 | ‐0.192 (‐0.409, 0.020) |
Direct | 0.505 | ‐0.302 (‐0.987, 0.365) |
| Indirect | 0.368 (‐1.196, 1.931) |
Indirect | ‐0.574 (‐1.654, 0.325) |
||
| Network | ‐0.177 (‐0.376, 0.026) |
Network | ‐0.369 (‐0.748, ‐0.046) |
||
| HD Triple vs. MD‐ICS/LABA | NA | ||||
| Direct | 0.574 | ‐0.324 (‐0.650, ‐0.007) |
Direct | NA | NA |
| Indirect | ‐0.460 (‐0.885, ‐0.039) |
Indirect | NA | ||
| Network | ‐0.377 (‐0.581, ‐0.168) |
Network | NA | ||
| MD Triple vs. HD‐ICS/LABA | MD Triple vs. HD‐ICS/LABA | ||||
| Direct | 0.313 | 0.019 (‐0.254, 0.341) |
Direct | 0.803 | ‐0.108 (‐0.790, 0.582) |
| Indirect | ‐0.244 (‐0.704, 0.255) |
Indirect | ‐0.208 (‐1.016, 0.892) |
||
| Network | ‐0.059 (‐0.255, 0.162) |
Network | ‐0.140 (‐0.457, 0.218) |
||
| HD Triple vs. HD‐ICS/LABA | NA | ||||
| Direct | 0.413 | ‐0.238 (‐0.418, ‐0.047) |
Direct | NA | NA |
| Indirect | ‐0.858 (‐2.616, 0.627) |
Indirect | NA | ||
| Network | ‐0.258 (‐0.421, ‐0.085) |
Network | NA | ||
| HD Triple vs. MD Triple | NA | ||||
| Direct | 0.573 | ‐0.221 (‐0.526, 0.053) |
Direct | NA | NA |
| Indirect | ‐0.061 (‐0.604, 0.490) |
Indirect | NA | ||
| Network | ‐0.199 (‐0.430, 0.017) |
Network | NA | ||
CrI: credible interval; HD: high dose; ICS: inhaled corticosteroids; LABA: long‐acting beta‐2 agonist; LHR: log hazard ratio; MD: medium dose; NA: not applicable.
1.2.1.2 NMA results
Hazard ratios for moderate to severe exacerbations in grouped treatments are presented in Figure 28. The HRs for the comparison of all treatment groups against each other are reported in Table 28. There is evidence to suggest that HD Triple reduces the hazards of moderate‐severe exacerbations compared to MD‐ICS/LABA and HD‐ICS/LABA (HR 0.69 [95% CrI 0.58 to 0.82] and 0.93 [0.79 to 0.88], respectively). There is also marginal evidence to suggest that MD Triple reduces the hazards of moderate‐severe exacerbations compared to MD‐ICS/LABA (HR 0.84 [95% CrI 0.71 to 0.99] and HD Triple reduces the hazards of moderate‐severe exacerbations compared to MD Triple (HR 0.83, 95% CrI [0.69 to 0.996], absolute risk reduction (ARR) 34 fewer per 1000 patients). An NMA summary of findings is presented in Table 3.
28.
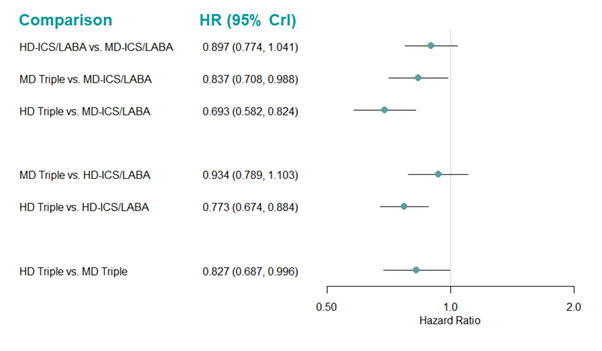
Forest plot of hazard ratios relative for moderate to severe exacerbations for grouped treatments.
Hazard ratio less than one favors the first named treatment. CrI: Credible Interval; HD: high dose; HR: hazard ratio; ICS: inhaled corticosteroids; LABA: long‐acting beta‐2 agonist; MD: medium dose.
10. Hazard ratio for moderate to severe exacerbations (fixed‐effect model).
| Median HR (95% CrI) | |||
| Comparison | Overall | High Risk | Low Risk |
| HD‐ICS/LABA vs MD‐ICS/LABA | 0.90 (0.77, 1.04) | 0.92 (0.76, 1.12) | 0.85 (0.67, 1.08) |
| MD Triple vs. MD‐ICS/LABA | 0.84 (0.71, 0.99) | 0.80 (0.66, 0.97) | 1.01 (0.72, 1.41) |
| HD Triple vs MD‐ICS/LABA | 0.69 (0.58, 0.82) | 0.70 (0.56, 0.87) | 0.76 (0.53, 1.08) |
| MD Triple vs. HD‐ICS/LABA | 0.93 (0.79, 1.10) | 0.87 (0.71, 1.06) | 1.19 (0.84, 1.66) |
| HD Triple vs HD‐ICS/LABA | 0.77 (0.67, 0.88) | 0.76 (0.65, 0.88) | 0.89 (0.62, 1.27) |
| HD Triple vs MD Triple | 0.83 (0.69, 1.00) | 0.87 (0.70, 1.08) | 0.75 (0.51, 1.09) |
The second named treatment is the baseline intervention. Hazard ratio less than one favours the first named treatment. Treatment comparisons in bold do not include the “null” effect. CrI: credible interval; HD: high dose; HR: hazard ratio; ICS: inhaled corticosteroids; LABA: long‐acting beta‐2 agonist; MD: medium dose.
The rank plots for grouped treatments are presented in Figure 29, and the mean and median ranks with their corresponding 95% CrIs are presented in Table 29. HD Triple ranks higher than the other treatments (median rank 1 [95%CrI 1 to 1]).
29.
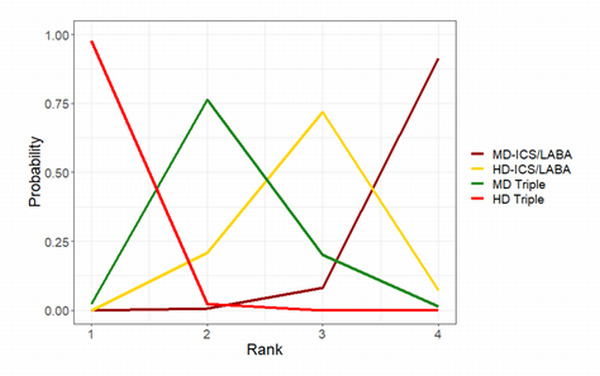
Rank plots for grouped treatments for moderate to severe exacerbations (fixed effect model).
HD: high dose; ICS: inhaled corticosteroids; LABA: long‐acting beta‐2 agonist; MD: medium dose.
11. Mean and median ranking for moderate to severe exacerbations sorted by mean rank (fixed‐effect model).
| Overall | High Risk Subgroup | Low Risk Subgroup | |||||||
| Treatments | Mean Rank | Median Rank | 95% CrI | Mean Rank | Median Rank | 95% CrI | Mean Rank | Median Rank | 95% CrI |
| HD Triple | 1.02 | 1.0 | (1.0, 1.0) | 1.11 | 1.0 | (1.0, 2.0) | 1.39 | 1.0 | (1.0, 3.0) |
| MD Triple | 2.21 | 2.0 | (2.0, 3.0) | 1.98 | 2.0 | (1.0, 3.0) | 3.29 | 4.0 | (1.0, 4.0) |
| HD‐ICS/LABA | 2.86 | 3.0 | (2.0, 4.0) | 3.13 | 3.0 | (2.0, 4.0) | 1.98 | 2.0 | (1.0, 4.0) |
| MD‐ICS/LABA | 3.91 | 4.0 | (3.0, 4.0) | 3.78 | 4.0 | (3.0, 4.0) | 3.33 | 3.0 | (2.0, 4.0) |
CrI: credible interval; HD: high dose; ICS: inhaled corticosteroids; LABA: long‐acting beta‐2 agonist; MD: medium dose.
1.2.1.2.1 High‐risk subgroup
For this outcome, 5 trials (7063 participants) provided evidence as dichotomous data across four individual treatments. A network diagram for the studies included in the NMA is presented in Figure 30. A summary of the studies included in the analysis is presented in Appendix 5.
30.
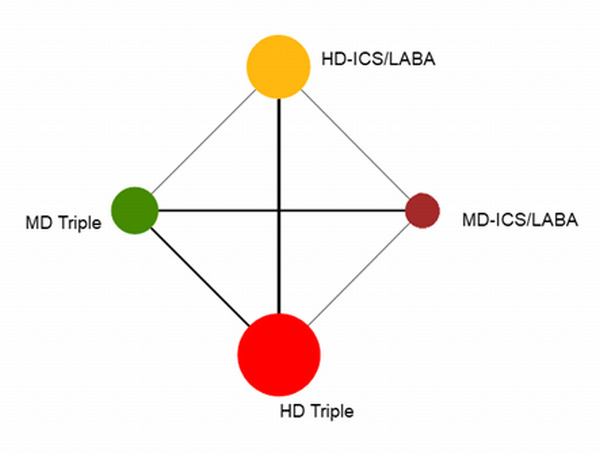
Network diagram for moderate to severe exacerbations for high‐risk individuals.
The size of the nodes and the thickness of edges depend on the number of people randomised and the number of trials conducted. HD: high dose; ICS: inhaled corticosteroids; LABA: long‐acting beta‐2 agonist; MD: medium dose.
Model fit parameters for the fixed‐effect‐ and random‐effects models are reported in Appendix 3. Both fixed‐effect and random‐effects models fit the data well. The between‐study heterogeneity was low, but the credible interval was wide. As the difference in DICs between the fixed‐effect and random‐effects models was less than 3, the simpler fixed‐effect model was chosen.
A node‐splitting model was fit to assess the inconsistency in the model. The results of the node‐splitting model are presented in Table 27. There was no evidence to suggest there was any inconsistency in the model.
Hazard ratios for moderate‐severe exacerbations are presented in Figure 31. The HRs for the comparison of all treatment groups against each other are reported in Table 28. There is evidence to suggest that MD Triple and HD Triple reduce the hazards of moderate‐severe exacerbations compared to MD‐ICS/LABA (HR 0.80 [95% CrI 0.66 to 0.97] and 0.70 [0.56 to 0.87], respectively) and HD Triple reduces the hazards of moderate‐severe exacerbations compared to HD‐ICS/LABA (HR 0.76 [95% CrI 0.65 to 0.88]). This is consistent with the results for the overall NMA (Table 28).
31.
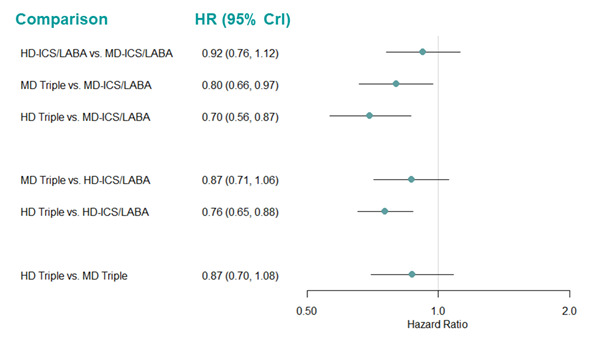
Forest plot of hazard ratios for moderate to severe exacerbations for high‐risk individuals.
Hazard ratio less than one favours the first named treatment. Crl: credible interval, HD: high dose; ICS: inhaled corticosteroids; LABA: long‐acting beta‐2 agonist; MD: medium dose.
The rank plots for grouped treatments are presented in Figure 32, and the mean and median ranks with their corresponding 95% CrIs are presented in Table 29. HD Triple ranked marginally better than MD Triple, both of which ranked better than the other treatments (median rank 1 [95% CrI 1 to 2] and 2 [1 to 3], respectively), but overall, treatment ranks are very uncertain, with very wide credible intervals.
32.
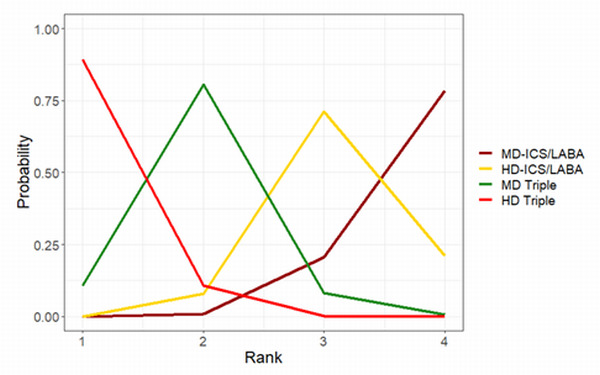
Rank plots for modearate to severe exacerbations for high‐risk individuals. (fixed effect model).
HD: high dose; ICS: inhaled corticosteroids; LABA: long‐acting beta‐2 agonist; MD: medium dose.
1.2.1.2.2 Low‐risk subgroup
For this outcome, 5 trials (4436 participants) comparing four treatments provided evidence as dichotomous data. A network diagram for the studies included in the NMA is presented as Figure 33. A summary of the studies included in the analysis is presented in Appendix 5.
33.
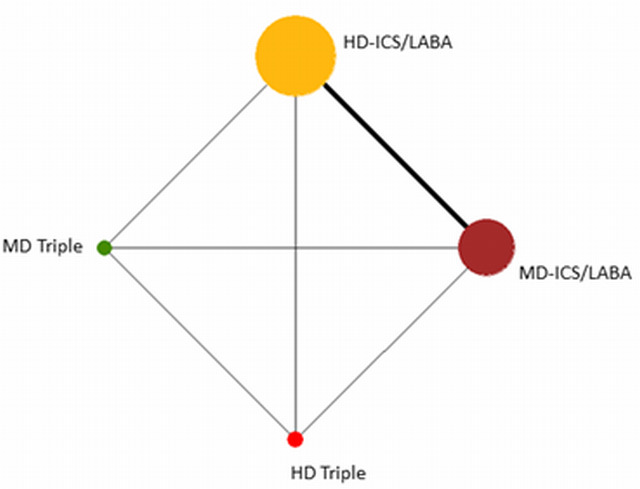
Network diagram for moderate to severe exacerbations for low‐risk individuals.
The size of the nodes and the thickness of edges depend on the number of people randomised and the number of trials conducted. HD: high dose; ICS: inhaled corticosteroids; LABA: long‐acting beta‐2 agonist; MD: medium dose.
Model fit parameters for the fixed‐effect‐ and random‐effects models are reported in Appendix 3. Both fixed‐effect‐ and random‐effects models fit the data well. There was moderate between‐study heterogeneity in the random‐effects model with a wide credible interval. As the difference in DICs between the fixed‐effect and random‐effects models was less than 3, the simpler fixed‐effect model was chosen. A node‐splitting analysis was not performed because there is no potential for inconsistency in this network as there is no independent, indirect evidence for any of the comparisons.
Hazard ratios for moderate‐severe exacerbations in low‐risk individuals are presented in Figure 34. The HRs for the comparison of all treatment groups against each other are reported in Table 28. There is insufficient evidence to suggest that there is a change in hazards of moderate‐severe exacerbations for any of the treatment comparisons.
34.
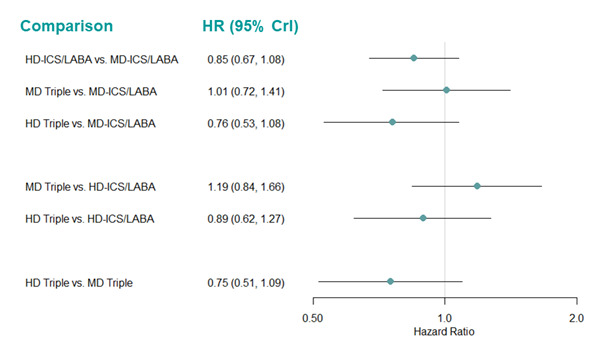
Forest plot of hazard ratios for moderate to severe exacerbations for low‐risk individuals.
Hazard ratio less than one favours the first named treatment. Crl: credible interval, HD: high dose; ICS: inhaled corticosteroids; LABA: long‐acting beta‐2 agonist; MD: medium dose.
The rank plots are presented in Figure 35, and the mean and median ranks with their corresponding 95% CrIs are presented in Table 29. HD Triple ranks higher than the other treatments, but the wide credible intervals demonstrate the uncertainty in treatment rankings (median rank 1 [95% CrI 1 to 3]).
35.
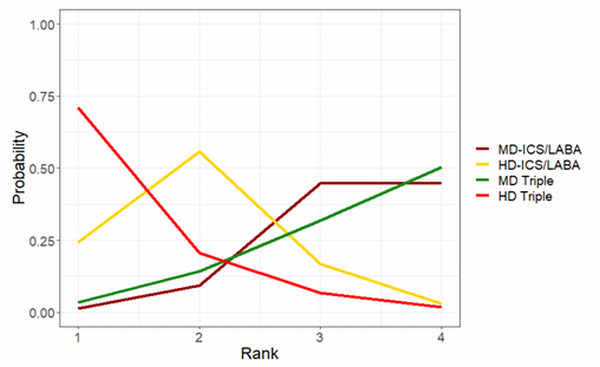
Rank plots for modearate to severe exacerbations for low‐risk individuals. (fixed effect model).
HD: high dose; ICS: inhaled corticosteroids; LABA: long‐acting beta‐2 agonist; MD: medium dose.
1.2.1.3 Threshold analysis
The forest plot for the threshold analysis is presented in Figure 36 and the thresholds and new optimum treatments are presented in Table 30.
36.
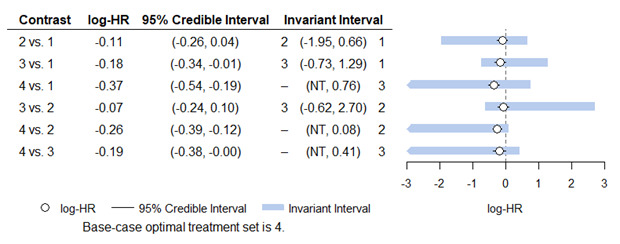
Forest plot for threshold analysis for moderate to severe exacerbations for grouped treatments (fixed effect model).
Treatment Codes: 1=MD‐ICS/LABA, 2= HD‐ICS/LABA, 3=MD Triple, 4= HD Triple. The optimum treatment for this analysis was HD Triple.
HD: high dose; HR: hazard ratio; ICS: inhaled corticosteroids; LABA: long‐acting beta‐2 agonist; MD: medium dose; NT: no threshold (no amount of change in this direction would change the recommendation).
12. Thresholds and new optimum treatments for moderate to severe exacerbations for grouped treatments.
| Lower Threshold | Upper Threshold | |||
| Comparison | New Optimal Treatment | Change in lnHR | New Optimal Treatment | Change in lnHR |
| HD‐ICS/LABA vs. MD‐ICS/LABA | HD‐ICS/LABA | ‐1.84 | MD‐ICS/LABA | 0.77 |
| MD Triple vs. MD‐ICS/LABA | MD Triple | ‐0.56 | MD‐ICS/LABA | 1.47 |
| HD Triple vs. MD‐ICS/LABA | N/A | ‐Inf | MD Triple | 1.13 |
| MD Triple vs. HD‐ICS/LABA | MD Triple | ‐0.55 | HD‐ICS/LABA | 2.78 |
| HD Triple vs. HD‐ICS/LABA | N/A | ‐Inf | HD‐ICS/LABA | 0.34 |
| HD Triple vs. MD Triple | N/A | ‐Inf | MD Triple | 0.60 |
CrI: credible interval; HD: high dose; ICS: inhaled corticosteroids; Inf= Infinity; LABA: long‐acting beta‐2 agonist; lnHR: log hazard ratio; MD: medium dose; N/A; not applicable
No credible intervals extended beyond the limits of the invariant intervals for any comparison, therefore the recommended treatment is not sensitive to the uncertainty in the data. The recommended treatment did seem to be sensitive to moderate potential bias in the negative direction for MD Triple versus MD‐ICS/LABA, MD Triple vs. HD‐ICS/LABA, which would make MD Triple the recommended treatment. This is consistent with the ranks discussed in Section 1.2.1.2, where MD Triple is ranked the next best treatment after HD Triple.
A change in the positive direction in the HD Triple versus HD‐ICS/LABA comparison could also change the preferred treatment to HD‐ICS/LABA. However, all these thresholds (Table 30) are relatively high and changes do not seem to be very plausible.
1.2.1.4 Pairwise meta‐analysis
Results from the pairwise meta‐analysis are qualitatively similar to those of the NMA (Analysis 1.2; Table 2). There is no qualitative difference between direct and NMA estimates (Table 27). There is little evidence to suggest HD‐ICS/LABA reduces moderate to severe exacerbations compared to MD‐ICS/LABA (6 trials, 5452 participants, RR 0.93 [95% CI 0.82 to 1.05]; I2 =0% [high certainty]).
1.2. Analysis.
Comparison 1: Asthma exacerbations, Outcome 2: Moderate to severe exacerbations
HD TRIPLE likely results in a slight reduction in moderate to severe exacerbations compared to MD TRIPLE (3 trials, 3470 participants, RR 0.85 [95% CI 0.72 to 1.01]; I2 = 0%; ARR 23 fewer per 1000 patients [moderate certainty]).
Triple therapy (ICS/LABA/LAMA) reduces moderate to severe exacerbations compared to dual (ICS/LABA) therapy when analysed combining all MD‐ and HD‐ICS formulations in each combination therapy (5 trials, 8173 participants; RR 0.85 [95% CI 0.78 to 0.92]; I2 =0% [high certainty]). There was no difference in the results between fixed‐effect and random‐effects models.
In the subgroup analyses, the evidence suggests HD TRIPLE reduces moderate to severe exacerbations compared to MD TRIPLE slightly in the high risk subgroup (RR 0.89 [95% CI 0.73 to 1.09]; ARR 15 fewer per 1000 patients; [moderate certainty] and moderately in the low risk subgroup (RR 0.79 [95% CI 0.57 to 1.08]; ARR 37 fewer per 1000 patients; [low certainty] Analysis 7.6).
7.6. Analysis.
Comparison 7: Moderate to severe exacerbations (high and low risk subgroups), Outcome 6: HD TRIPLE vs MD TRIPLE
Triple therapy (ICS/LABA/LAMA) reduces moderate to severe exacerbations compared to dual therapy (ICS/LABA) only in the high‐risk subgroup (RR 0.84 [95% CI 0.77 to 0.92]; ARR 42 fewer per 1000 patients; [high certainty]) but not in the low‐risk subgroup (RR 0.96 [95% CI 0.77 to 1.20]; [moderate certainty] Analysis 7.7).
7.7. Analysis.
Comparison 7: Moderate to severe exacerbations (high and low risk subgroups), Outcome 7: TRIPLE vs DUAL
1.2.2 Individual treatments
For this outcome, 14 trials (13,127 participants) provided evidence as dichotomous data across 18 individual treatments. There were no studies that provided evidence as logHR data. A network diagram for the studies included in the NMA is presented in Figure 37. A summary of the studies included in the analysis is presented in Appendix 6. We added a continuity correction of 0.5 to the zero count events to help improve model convergence due to the sparsity of the evidence in Mansfield 2017.
37.
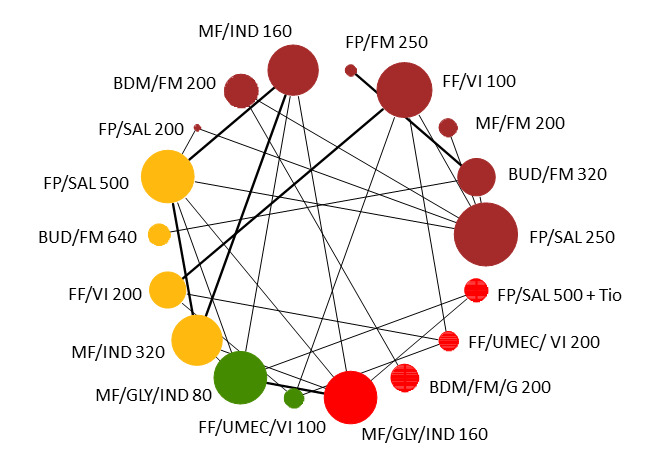
Network diagram for moderate to severe exacerbations for individual interventions.
Node colors denote the treatment group. The size of the nodes and the thickness of edges depend on the number of people randomised and the number of trials conducted. BDP: beclomethasone dipropionate, BUD:budesonide, FF:fluticasone furoate, FM:formoterol, FP:fluticasone propionate, GLY: glycopyrronium, IND:indacaterol, MF:mometasone furoate, SAL:salmeterol, UMEC: umeclidinium, VI:vilanterol
1.2.2. 1 Model selection and inconsistency checking
Model fit parameters for the fixed‐effect and random‐effects models are reported in Appendix 3. Both fixed‐effect and random‐effects models fit the data well. The between‐study heterogeneity was low, but the credible interval was wide. As the DIC for the fixed‐effect model was lower than for the random‐effects model, the fixed‐effect model was chosen. Results for the fixed‐effect model are presented in Section 1.2.2.2. There is no potential for inconsistency in this network as there is no independent, indirect evidence for any of the comparisons.
1.2.2.2 NMA results
Hazard ratios for moderate‐severe exacerbations in individual treatments, compared to FP/SAL 250/50 µg (MD‐ICS/LABA) are presented in Figure 38. The HRs for the comparison of all treatment groups against each other are reported in Table 31. The impact of the sparse evidence available for each comparison can be seen in the number of comparisons for which the HRs are extremely uncertain (highlighted in yellow in Table 31).
38.
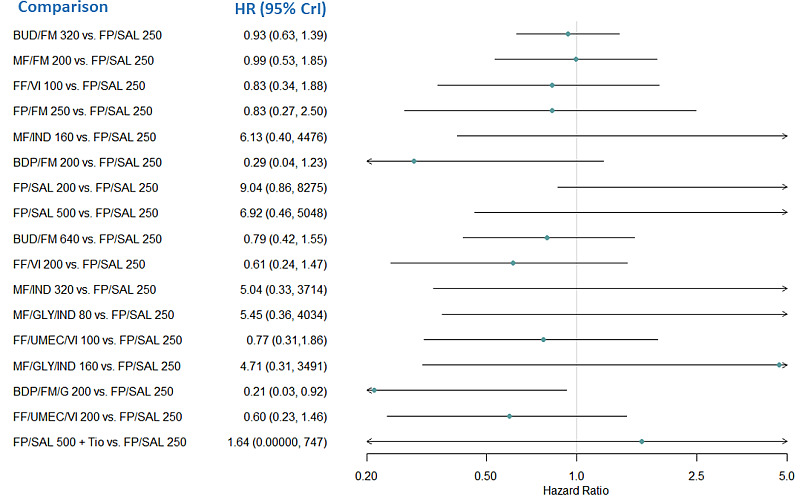
Forest plot of hazard ratios relative to FP/SAL 250 for moderate to severe exacerbations for individual treatments. Hazard Ratios greater than one favor the comparator treatment over FP/SAL 250.
BUD:budesonide, CrI:Credible Interval; FF:fluticasone furoate, FM:formoterol, FP:fluticasone propionate, GLY: glycopyrronium, HR: hazard ratio; IND:indacaterol, MF:mometasone furoate, SAL:salmeterol, Tio:tiotropium, UMEC: umeclidinium, VI:vilanterol.
13. Hazard ratio for moderate to severe exacerbations for individual treatments (fixed‐effect model).
| Comparison | Median HR (95% CrI) |
| BUD/FM 320 vs. FP/SAL 250 | 0.93 (0.63, 1.39) |
| MF/FM 200 vs. FP/SAL 250 | 0.99 (0.53, 1.85) |
| FF/VI 100 vs. FP/SAL 250 | 0.83 (0.34, 1.88) |
| FP/FM 250 vs. FP/SAL 250 | 0.83 (0.27, 2.50) |
| MF/IND 160 vs. FP/SAL 250 | 6.13 (0.40, 4476)* |
| BDP/FM 200 vs. FP/SAL 250 | 0.29 (0.04, 1.23) |
| FP/SAL 200 vs. FP/SAL 250 | 9.04 (0.86, 8275)* |
| FP/SAL 500 vs. FP/SAL 250 | 6.92 (0.46, 5048)* |
| BUD/FM 640 vs. FP/SAL 250 | 0.79 (0.42, 1.55) |
| FF/VI 200 vs. FP/SAL 250 | 0.61 (0.24, 1.47) |
| MF/IND 320 vs. FP/SAL 250 | 5.04 (0.33, 3714)* |
| MF/GLY/IND 80 vs. FP/SAL 250 | 5.45 (0.36, 4034)* |
| FF/UMEC/VI 100 vs. FP/SAL 250 | 0.77 (0.31,1.86) |
| MF/GLY/IND 160 vs. FP/SAL 250 | 4.71 (0.31, 3491)* |
| BDP/FM/G 200 vs. FP/SAL 250 | 0.21 (0.03, 0.92) |
| FF/UMEC/VI 200 vs. FP/SAL 250 | 0.60 (0.23, 1.46) |
| FP/SAL 500 + Tio vs. FP/SAL 250 | 1.64 (0.00000, 747.40)* |
| MF/FM 200 vs. BUD/FM 320 | 1.06 (0.51, 2.23) |
| FF/VI 100 vs. BUD/FM 320 | 0.88 (0.34, 2.21) |
| FP/FM 250 vs. BUD/FM 320 | 0.89 (0.31, 2.49) |
| MF/IND 160 vs. BUD/FM 320 | 6.60 (0.41, 4954)* |
| BDP/FM 200 vs. BUD/FM 320 | 0.30 (0.05, 1.44) |
| FP/SAL 200 vs. BUD/FM 320 | 9.68 (0.89, 8950)* |
| FP/SAL 500 vs. BUD/FM 320 | 7.46 (0.47, 5555)* |
| BUD/FM 640 vs. BUD/FM 320 | 0.85 (0.51, 1.47) |
| FF/VI 200 vs. BUD/FM 320 | 0.65 (0.24, 1.72) |
| MF/IND 320 vs. BUD/FM 320 | 5.43 (0.34, 4094)* |
| MF/GLY/IND 80 vs. BUD/FM 320 | 5.87 (0.37 4445)* |
| FF/UMEC/VI 100 vs. BUD/FM 320 | 0.83 (0.30, 2.17) |
| MF/GLY/IND 160 vs. BUD/FM 320 | 5.08 (0.32, 3893)* |
| BDP/FM/G 200 vs. BUD/FM 320 | 0.22 (0.03, 1.07) |
| FF/UMEC/VI 200 vs. BUD/FM 320 | 0.64 (0.23, 1.69) |
| FP/SAL 500 + Tio vs. BUD/FM 320 | 1.75 (0.00000, 805.70)* |
| FF/VI 100 vs. MF/FM 200 | 0.82 (0.28, 2.33) |
| FP/FM 250 vs. MF/FM 200 | 0.83 (0.23, 2.98) |
| MF/IND 160 vs. MF/FM 200 | 6.22 (0.37, 4697)* |
| BDP/FM 200 vs. MF/FM 200 | 0.28 (0.04, 1.42) |
| FP/SAL 200 vs. MF/FM 200 | 9.14 (0.78, 8495)* |
| FP/SAL 500 vs. MF/FM 200 | 7.02 (0.42, 5303)* |
| BUD/FM 640 vs. MF/FM 200 | 0.80 (0.32, 1.99) |
| FF/VI 200 vs. MF/FM 200 | 0.61 (0.20, 1.80) |
| MF/IND 320 vs. MF/FM 200 | 5.11 (0.31, 3891)* |
| MF/GLY/IND 80 vs. MF/FM 200 | 5.52 (0.33, 4208)* |
| FF/UMEC/VI 100 vs. MF/FM 200 | 0.77 (0.26, 2.30) |
| MF/GLY/IND 160 vs. MF/FM 200 | 4.77 (0.28, 3694)* |
| BDP/FM/G 200 vs. MF/FM 200 | 0.21 (0.03, 1.06) |
| FF/UMEC/VI 200 vs. MF/FM 200 | 0.60 (0.20, 1.78) |
| FP/SAL 500 + Tio vs. MF/FM 200 | 1.64 (0.00000, 729.20)* |
| FP/FM 250 vs. FF/VI 100 | 1.02 (0.25, 4.06) |
| MF/IND 160 vs. FF/VI 100 | 7.62 (0.43, 6048.00)* |
| BDP/FM 200 vs. FF/VI 100 | 0.35 (0.04, 1.89) |
| FP/SAL 200 vs. FF/VI 100 | 11.28 (0.92, 10640)* |
| FP/SAL 500 vs. FF/VI 100 | 8.62 (0.49, 6794)* |
| BUD/FM 640 vs. FF/VI 100 | 0.97 (0.34, 2.90) |
| FF/VI 200 vs. FF/VI 100 | 0.74 (0.53, 1.03) |
| MF/IND 320 vs. FF/VI 100 | 6.29 (0.36, 5002)* |
| MF/GLY/IND 80 vs. FF/VI 100 | 6.78 (0.38, 5449)* |
| FF/UMEC/VI 100 vs. FF/VI 100 | 0.94 (0.68, 1.30) |
| MF/GLY/IND 160 vs. FF/VI 100 | 5.86 (0.33, 4673)* |
| BDP/FM/G 200 vs. FF/VI 100 | 0.26 (0.03, 1.41) |
| FF/UMEC/VI 200 vs. FF/VI 100 | 0.72 (0.51, 1.02) |
| FP/SAL 500 + Tio vs. FF/VI 100 | 1.98 (0.00000, 915.90)* |
| MF/IND 160 vs. FP/FM 250 | 7.65 (0.38, 6227)* |
| BDP/FM 200 vs. FP/FM 250 | 0.34 (0.04, 2.28) |
| FP/SAL 200 vs. FP/FM 250 | 11.22 (0.79, 10490)* |
| FP/SAL 500 vs. FP/FM 250 | 8.65 (0.44, 6995)* |
| BUD/FM 640 vs. FP/FM 250 | 0.96 (0.30, 3.16) |
| FF/VI 200 vs. FP/FM 250 | 0.73 (0.17, 3.13) |
| MF/IND 320 vs. FP/FM 250 | 6.30 (0.32, 5113)* |
| MF/GLY/IND 80 vs. FP/FM 250 | 6.79 (0.34, 5448)* |
| FF/UMEC/VI 100 vs. FP/FM 250 | 0.93 (0.23, 3.97) |
| MF/GLY/IND 160 vs. FP/FM 250 | 5.87 (0.30, 4851)* |
| BDP/FM/G 200 vs. FP/FM 250 | 0.25 (0.03, 1.69) |
| FF/UMEC/VI 200 vs. FP/FM 250 | 0.71 (0.17, 3.07) |
| FP/SAL 500 + Tio vs. FP/FM 250 | 1.97 (0.00000, 950.10)* |
| BDP/FM 200 vs. MF/IND 160 | 0.04 (0.0001, 1.06) |
| FP/SAL 200 vs. MF/IND 160 | 1.48 (0.38, 8.60) |
| FP/SAL 500 vs. MF/IND 160 | 1.13 (0.94, 1.36) |
| BUD/FM 640 vs. MF/IND 160 | 0.13 (0.0002, 2.20) |
| FF/VI 200 vs. MF/IND 160 | 0.10 (0.0001, 1.76) |
| MF/IND 320 vs. MF/IND 160 | 0.83 (0.68, 1.01) |
| MF/GLY/IND 80 vs. MF/IND 160 | 0.89 (0.72, 1.10) |
| FF/UMEC/VI 100 vs. MF/IND 160 | 0.12 (0.0002, 2.23) |
| MF/GLY/IND 160 vs. MF/IND 160 | 0.77 (0.62, 0.96) |
| BDP/FM/G 200 vs. MF/IND 160 | 0.03 (0.00004, 0.79) |
| FF/UMEC/VI 200 vs. MF/IND 160 | 0.09 (0.0001, 1.73) |
| FP/SAL 500 + Tio vs. MF/IND 160 | 0.37 (0.00000, 2.08) |
| FP/SAL 200 vs. BDP/FM 200 | 34.04 (1.97, 33480)* |
| FP/SAL 500 vs. BDP/FM 200 | 25.58 (1.08, 21010)* |
| BUD/FM 640 vs. BDP/FM 200 | 2.83 (0.55, 19.55) |
| FF/VI 200 vs. BDP/FM 200 | 2.13 (0.39, 17.16) |
| MF/IND 320 vs. BDP/FM 200 | 18.69 (0.78, 15450)* |
| MF/GLY/IND 80 vs. BDP/FM 200 | 20.17 (0.84, 16660)* |
| FF/UMEC/VI 100 vs. BDP/FM 200 | 2.70 (0.49, 21.82) |
| MF/GLY/IND 160 vs. BDP/FM 200 | 17.39 (0.72, 14470)* |
| BDP/FM/G 200 vs. BDP/FM 200 | 0.74 (0.56, 0.97) |
| FF/UMEC/VI 200 vs. BDP/FM 200 | 2.08 (0.38, 17.12) |
| FP/SAL 500 + Tio vs. BDP/FM 200 | 5.82 (0.00000, 3115)* |
| FP/SAL 500 vs. FP/SAL 200 | 0.76 (0.13, 2.92) |
| BUD/FM 640 vs. FP/SAL 200 | 0.09 (0.0001, 1.05) |
| FF/VI 200 vs. FP/SAL 200 | 0.07 (0.0001, 0.82) |
| MF/IND 320 vs. FP/SAL 200 | 0.56 (0.10, 2.16) |
| MF/GLY/IND 80 vs. FP/SAL 200 | 0.60 (0.10, 2.35) |
| FF/UMEC/VI 100 vs. FP/SAL 200 | 0.08 (0.0001, 1.04) |
| MF/GLY/IND 160 vs. FP/SAL 200 | 0.52 (0.09, 2.02) |
| BDP/FM/G 200 vs. FP/SAL 200 | 0.02 (0.00002, 0.38) |
| FF/UMEC/VI 200 vs. FP/SAL 200 | 0.06 (0.0001, 0.80) |
| FP/SAL 500 + Tio vs. FP/SAL 200 | 0.21 (0.00000, 2.30) |
| BUD/FM 640 vs. FP/SAL 500 | 0.11 (0.0002, 1.92) |
| FF/VI 200 vs. FP/SAL 500 | 0.09 (0.0001, 1.54) |
| MF/IND 320 vs. FP/SAL 500 | 0.73 (0.60, 0.89) |
| MF/GLY/IND 80 vs. FP/SAL 500 | 0.79 (0.64, 0.97) |
| FF/UMEC/VI 100 vs. FP/SAL 500 | 0.11 (0.0001, 1.95) |
| MF/GLY/IND 160 vs. FP/SAL 500 | 0.68 (0.55, 0.84) |
| BDP/FM/G 200 vs. FP/SAL 500 | 0.03 (0.00003, 0.69) |
| FF/UMEC/VI 200 vs. FP/SAL 500 | 0.08 (0.0001, 1.51) |
| FP/SAL 500 + Tio vs. FP/SAL 500 | 0.33 (0.00000, 1.84) |
| FF/VI 200 vs. BUD/FM 640 | 0.76 (0.25, 2.29) |
| MF/IND 320 vs. BUD/FM 640 | 6.42 (0.38, 5053)* |
| MF/GLY/IND 80 vs. BUD/FM 640 | 6.95 (0.40, 5493)* |
| FF/UMEC/VI 100 vs. BUD/FM 640 | 0.97 (0.31, 2.92) |
| MF/GLY/IND 160 vs. BUD/FM 640 | 6.00 (0.35, 4786)* |
| BDP/FM/G 200 vs. BUD/FM 640 | 0.26 (0.04, 1.37) |
| FF/UMEC/VI 200 vs. BUD/FM 640 | 0.75 (0.24, 2.24) |
| FP/SAL 500 + Tio vs. BUD/FM 640 | 2.04 (0.00000, 958.30)* |
| MF/IND 320 vs. FF/VI 200 | 8.53 (0.47, 6736)* |
| MF/GLY/IND 80 vs. FF/VI 200 | 9.18 (0.51, 7364)* |
| FF/UMEC/VI 100 vs. FF/VI 200 | 1.27 (0.90, 1.80) |
| MF/GLY/IND 160 vs. FF/VI 200 | 7.95 (0.44, 6432)* |
| BDP/FM/G 200 vs. FF/VI 200 | 0.34 (0.04, 1.92) |
| FF/UMEC/VI 200 vs. FF/VI 200 | 0.98 (0.68, 1.41) |
| FP/SAL 500 + Tio vs. FF/VI 200 | 2.68 (0.00000, 1223)* |
| MF/GLY/IND 80 vs. MF/IND 320 | 1.08 (0.86, 1.35) |
| FF/UMEC/VI 100 vs. MF/IND 320 | 0.15 (0.0002, 2.69) |
| MF/GLY/IND 160 vs. MF/IND 320 | 0.93 (0.74, 1.17) |
| BDP/FM/G 200 vs. MF/IND 320 | 0.04 (0.0001, 0.94) |
| FF/UMEC/VI 200 vs. MF/IND 320 | 0.11 (0.0001, 2.09) |
| FP/SAL 500 + Tio vs. MF/IND 320 | 0.45 (0.00000, 2.53) |
| FF/UMEC/VI 100 vs. MF/GLY/IND 80 | 0.14 (0.0002, 2.50) |
| MF/GLY/IND 160 vs. MF/GLY/IND 80 | 0.86 (0.69, 1.09) |
| BDP/FM/G 200 vs. MF/GLY/IND 80 | 0.04 (0.00004, 0.88) |
| FF/UMEC/VI 200 vs. MF/GLY/IND 80 | 0.11 (0.0001, 1.95) |
| FP/SAL 500 + Tio vs. MF/GLY/IND 80 | 0.41 (0.00000, 2.33) |
| MF/GLY/IND 160 vs. FF/UMEC/VI 100 | 6.25 (0.35, 4959)* |
| BDP/FM/G 200 vs. FF/UMEC/VI 100 | 0.27 (0.03, 1.52) |
| FF/UMEC/VI 200 vs. FF/UMEC/VI 100 | 0.77 (0.54, 1.10) |
| FP/SAL 500 + Tio vs. FF/UMEC/VI 100 | 2.12 (0.00000, 969)* |
| BDP/FM/G 200 vs. MF/GLY/IND 160 | 0.04 (0.0001, 1.03) |
| FF/UMEC/VI 200 vs. MF/GLY/IND 160 | 0.12 (0.0002, 2.26) |
| FP/SAL 500 + Tio vs. MF/GLY/IND 160 | 0.48 (0.00000, 2.70) |
| FF/UMEC/VI 200 vs. BDP/FM/G 200 | 2.82 (0.50, 23.33) |
| FP/SAL 500 + Tio vs. BDP/FM/G 200 | 7.86 (0.00000, 4308)* |
| FP/SAL 500 + Tio vs. FF/UMEC/VI 200 | 2.74 (0.00000, 1260)* |
The second named treatment is the baseline intervention. Hazard Ratio less than one favours the first named treatment. Treatment comparisons in bold do not include the “null” effect. *HRs are extremely uncertain due to network sparsity and should be treated with caution. Abbreviations: BUD=budesonide, CrI= credible interval, FF=fluticasone furoate, FM=formoterol, FP=fluticasone propionate, GLY= glycopyrronium, HR=hazard ratio, IND=indacaterol, MF=mometasone furoate, SAL=salmeterol, Tio=tiotropium, UMEC= umeclidinium, VI=vilanterol.
The rank plots for individual treatments are presented in Figure 39, and the mean and median ranks with their corresponding 95% CrIs are presented in Table 32. Beclomethasone dipropionate/formoterol/glycopyrronium (BDP/FM/GLY) 200/12/20 µg (MD Triple) has the highest probability of being the best treatment, but overall, treatment ranks are very uncertain, and most treatments have probabilities less than 50% for all ranks.
39.
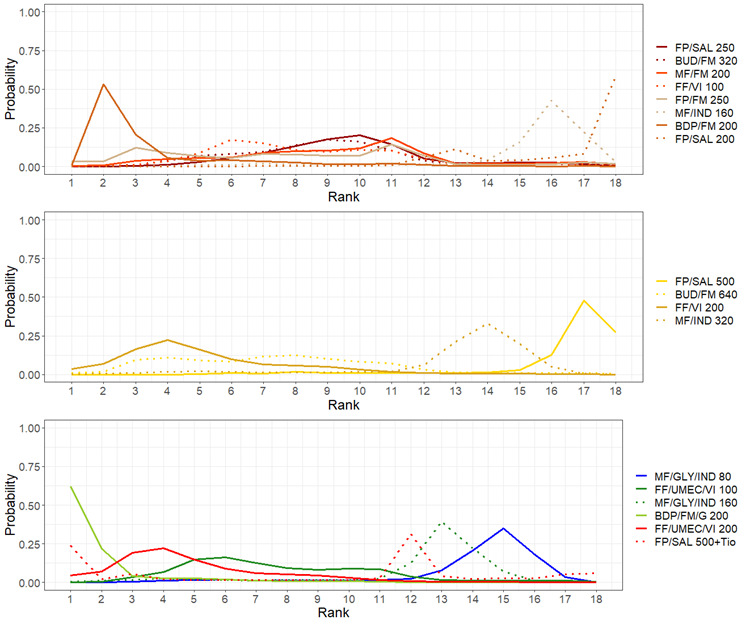
Rank plots for individual treatments for moderate to severe exacerbations (fixed effect model)
Line colors denote the treatment group. BUD:budesonide, FF:fluticasone furoate, FM:formoterol, FP:fluticasone propionate, GLY: glycopyrronium, IND:indacaterol, MF:mometasone furoate, SAL:salmeterol, Tio:tiotropium, UMEC: umeclidinium, VI:vilanterol.
14. Mean and median ranking for individual treatments for moderate to severe exacerbations (fixed‐effect model).
| Treatments | Mean Rank | Median Rank | 95% CrI |
| BDP/FM/G 200 | 1.96 | 1.0 | (1.0, 9.0) |
| BDP/FM 200 | 3.51 | 2.0 | (2.0, 11.0) |
| FF/UMEC/VI 200 | 5.03 | 4.0 | (1.0, 12.0) |
| FF/VI 200 | 5.24 | 5.0 | (1.0, 12.0) |
| BUD/FM 640 | 7.42 | 7.0 | (2.0, 16.0) |
| FF/UMEC/VI 100 | 7.78 | 7.0 | (3.0, 16.0) |
| FP/FM 250 | 7.87 | 8.0 | (1.0, 17.0) |
| FF/VI 100 | 8.44 | 8.0 | (4.0, 16.0) |
| BUD/FM 320 | 8.91 | 9.0 | (4.0, 16.0) |
| FP/SAL 500 + Tio | 9.00 | 12.0 | (1.0, 18.0) |
| MF/FM 200 | 9.32 | 10.0 | (3.0, 17.0) |
| FP/SAL 250 | 9.65 | 10.0 | (5.0, 16.0) |
| MF/GLY/IND 160 | 12.14 | 13.0 | (3.0, 15.0) |
| MF/IND 320 | 12.92 | 14.0 | (4.0, 16.0) |
| MF/GLY/IND 80 | 13.87 | 15.0 | (5.0, 17.0) |
| MF/IND 160 | 15.21 | 16.0 | (7.0, 18.0) |
| FP/SAL 200 | 16.32 | 18.0 | (11.0, 18.0) |
| FP/SAL 500 | 16.41 | 17.0 | (8.0, 18.0) |
BUD=budesonide, FF=fluticasone furoate, FM=formoterol, FP=fluticasone propionate, GLY= glycopyrronium, IND=indacaterol, MF=mometasone furoate, SAL=salmeterol, UMEC= umeclidinium, VI=vilanterol.
2. Secondary, continuous outcomes
2.1 Asthma Control Questionnaire (ACQ) score
2.1.1 Change from baseline at three months
2.1.1.1 Grouped treatments
For this outcome, 4 trials (4529 participants) comparing four treatment groups were included in the NMA (Figure 3). A summary of the studies included in the analysis is presented in Appendix 7.
2.1.1.1.1 Model selection and inconsistency checking
Model fit parameters for the fixed‐effect and random‐effects models are reported in Appendix 3. Both fixed‐effect and random‐effects models fit the data well. The between‐study heterogeneity was low. As the difference in DICs between the fixed‐effect and random‐effects models was less than 3, the simpler fixed‐effect model was chosen. Results for the fixed‐effect model are presented in Section 2.1.1.1.2. There is no potential for inconsistency in this network as there is no independent, indirect evidence for any of the comparisons.
2.1.1.1.2 NMA results
Mean differences in CFB in ACQ scores at three months are presented in Figure 40. The mean differences in CFB in ACQ scores at three months comparing all treatment groups against each other are reported in Table 33.
40.
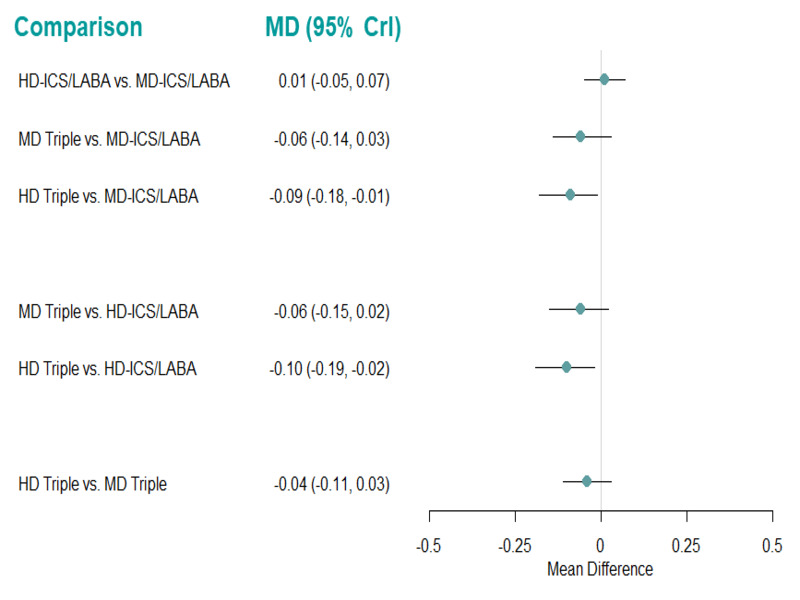
Forest plot of relative effects for the change from baseline ACQ score at 3 months using the fixed effect model.
Mean differences less than zero favor the first named treatment. CrI:Credible Interval; HD: high dose; ICS: inhaled corticosteroids; LABA: long‐acting beta‐2 agonist; MD: mean difference; MD: medium dose.
15. Mean difference for change from baseline in ACQ scores at 3 months.
| Comparison | Median Mean Difference (95% CrI) |
| HD‐ICS/LABA vs MD‐ICS/LABA | 0.008 (‐0.053, 0.069) |
| MD Triple vs. MD‐ICS/LABA | ‐0.056 (‐0.141, 0.029) |
| HD Triple vs MD‐ICS/LABA | ‐0.094 (‐0.178,‐0.011) |
| MD Triple vs. HD‐ICS/LABA | ‐0.064 (‐0.149, 0.022) |
| HD Triple vs HD‐ICS/LABA | ‐0.103 (‐0.187, ‐0.018) |
| HD Triple vs MD Triple | ‐0.039 (‐0.111, 0.034) |
Mean difference less than zero favours the first named treatment. Treatment comparisons in bold do not include the “null” effect. CrI: credible interval; HD: high dose; ICS: inhaled corticosteroids; LABA: long‐acting beta‐2 agonist; MD: medium dose.
There is evidence to suggest that HD Triple reduces the ACQ score at three months compared to HD‐ICS/LABA (mean difference ‐0.09 [95% CrI ‐0.18 to ‐0.01]). However, this difference does not satisfy the minimal clinically important difference (MCID) of 0.5 (Juniper 2005). An NMA summary of findings is presented in Table 4
The rank plots for grouped treatments are presented in Figure 41, and the mean and median ranks are presented in Table 34. HD Triple ranks higher than the other treatments (median rank 1 [95% CrI 1 to 2]). All other treatment ranks display wide credible intervals, reflecting high uncertainty in treatment rankings.
41.
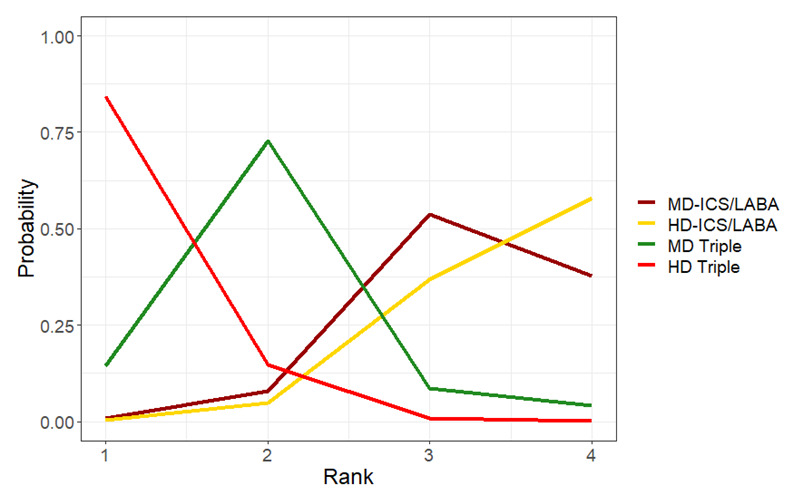
Rank plots for grouped treatments for change from baseline in ACQ scores at 3 months (fixed effect model).
HD: high dose; ICS: inhaled corticosteroids; LABA: long‐acting beta‐2 agonist; MD: medium dose
16. Mean and median ranking for change from baseline in ACQ scores at 3 months sorted by mean rank (fixed‐effect model).
| Treatments | Mean Rank | Median Rank | 95% CrI |
| HD Triple | 1.17 | 1 | (1.00, 2.00) |
| MD Triple | 2.02 | 2 | (1.00, 4.00) |
| MD‐ICS/LABA | 3.28 | 3 | (2.00, 4.00) |
| HD‐ICS/LABA | 3.52 | 4 | (2.00, 4.00) |
CrI: credible interval; HD: high dose; ICS: inhaled corticosteroids; LABA: long‐acting beta‐2 agonist; MD: medium dose.
2.1.2 Change from baseline at six months
2.1.2.1 Grouped treatments
For this outcome, 6 trials (7957 participants) comparing four treatment groups were included in the NMA (Figure 4). A summary of the studies included in the analysis is presented in Appendix 8.
2.1.2.1.1 Model selection and inconsistency checking
Model fit parameters for the fixed‐effect and random‐effects models are reported in Appendix 3. Both fixed‐effect and random‐effects models fit the data well. The between‐study heterogeneity was low. As the difference in DICs between the fixed‐effect and random‐effects models was less than 3, the simpler fixed‐effect model was chosen.
A node‐splitting model was fit to assess inconsistency. The results of node‐splitting are presented in Table 35. There was no evidence to suggest any inconsistency in the model.
17. Node‐splitting results for change from baseline in ACQ scores at 6 months.
| Model | p |
Mean Difference (95% CrI) |
| MD Triple vs. MD‐ICS/LABA | ||
| Direct | 0.472 | ‐0.092 (‐0.231, 0.047) |
| Indirect | 0.003 (‐0.302, 0.283) |
|
| Network | ‐0.071 (‐0.173, 0.026) |
|
| HD Triple vs. MD‐ICS/LABA | ||
| Direct | 0.733 | ‐0.108 (‐0.229, 0.016) |
| Indirect | ‐0.075 (‐0.295, 0.128) |
|
| Network | ‐0.103 (‐0.204, ‐0.015) |
|
| MD Triple vs. HD‐ICS/LABA | ||
| Direct | 0.266 | ‐0.007 (‐0.115, 0.101) |
| Indirect | ‐0.121 (‐0.323, 0.077) |
|
| Network | ‐0.038 (‐0.135, 0.050) |
|
Mean difference less than zero favours the first named treatment. CrI: credible interval; HD: high dose; ICS: inhaled corticosteroids; LABA: long‐acting beta‐2 agonist; MD: medium dose.
2.1.2.1.2 NMA results
The mean difference in CFB in ACQ scores at six months are presented in Figure 42. The mean difference in CFB in ACQ scores at six months comparing all treatment groups against each other are reported in Table 36.
42.
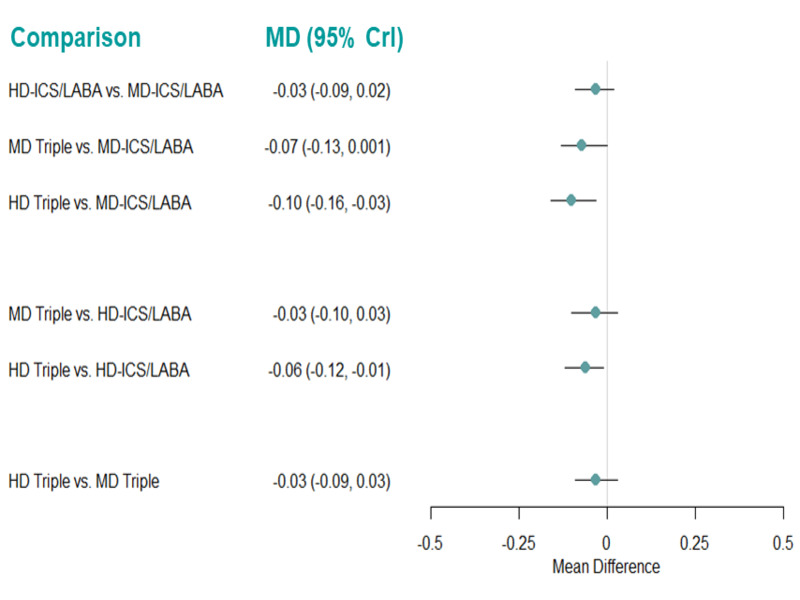
Forest plot of relative effects for the change from baseline in ACQ score at 6 months using fixed‐ and random‐effects models.
Mean differences less than zero favor the first named treatment. CrI:Credible Interval; FE: fixed effect; HD: high dose; ICS: inhaled corticosteroids; LABA: long‐acting beta‐2 agonist; MD: mean difference; MD: medium dose; RE: random effects.
18. Mean difference for change from baseline in ACQ scores at 6 months.
| Comparison | Median Mean Difference (95% CrI) |
| HD‐ICS/LABA vs MD‐ICS/LABA | ‐0.033 (‐0.086, 0.019) |
| MD Triple vs. MD‐ICS/LABA | ‐0.066 (‐0.134, 0.001) |
| HD Triple vs MD‐ICS/LABA | ‐0.098 (‐0.161, ‐0.034) |
| MD Triple vs. HD‐ICS/LABA | ‐0.033 (‐0.095, 0.029) |
| HD Triple vs HD‐ICS/LABA | ‐0.064 (‐0.121, ‐0.008) |
| HD Triple vs MD Triple | ‐0.031 (‐0.092, 0.029) |
Mean difference less than zero favours the first named treatment. Treatment comparisons in bold do not include the “null” effect. CrI: credible interval; HD: high dose; ICS: inhaled corticosteroids; LABA: long‐acting beta‐2 agonist; MD: medium dose.
There is evidence to suggest that HD Triple reduces the ACQ score at six months compared to MD‐ICS/LABA and HD‐ICS/LABA (mean difference ‐0.10 [95% CrI ‐0.16 to ‐0.03] and ‐0.06 [‐0.12 to ‐0.01], respectively). However, these differences do not satisfy the MCID of 0.5 (Juniper 2005). An NMA summary of findings is presented in Table 5
The rank plots for grouped treatments are presented in Figure 43, and the mean and median ranks are presented in Table 37. HD Triple ranks higher than the other three grouped treatments (median rank 1 [95% CrI 1 to 2]).
43.
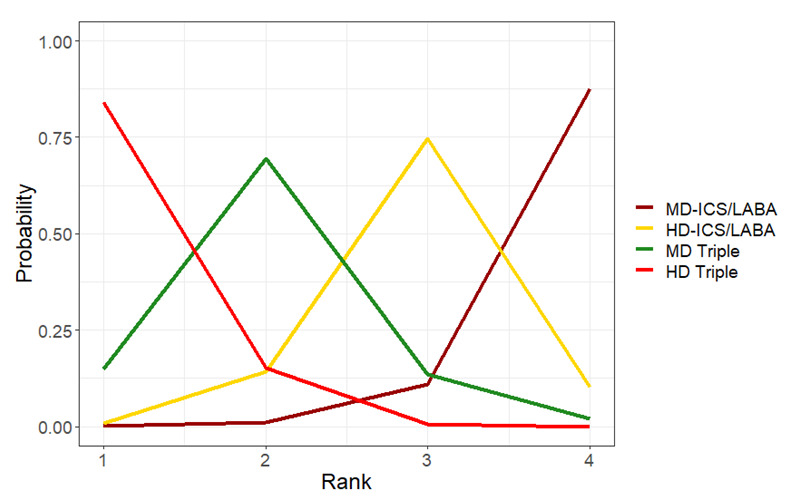
Rank plots for grouped treatments for change from baseline in ACQ scores at 6 months for the fixed effect (A) and random effects (B) models.
HD: high dose; ICS: inhaled corticosteroids; LABA: long‐acting beta‐2 agonist; MD: medium dose.
19. Mean and median ranking for change from baseline in ACQ scores at 6 months sorted by mean rank (fixed effect model).
| Treatments | Mean Rank | Median Rank | 95% CrI |
| HD Triple | 1.17 | 1 | (1.00, 2.00) |
| MD Triple | 2.02 | 2 | (1.00, 3.00) |
| HD‐ICS/LABA | 2.95 | 3 | (2.00, 4.00) |
| MD‐ICS/LABA | 3.86 | 4 | (3.00, 4.00) |
CrI: credible interval; HD: high dose; ICS: inhaled corticosteroids; LABA: long‐acting beta‐2 agonist; MD: medium dose.
2.1.3 Change from baseline at 12 months
2.1.3.1 Grouped treatments
For this outcome, 5 trials (5440 participants) comparing 4 treatment groups were included in the NMA (Figure 5). A summary of the studies included in the analysis is presented in Appendix 9.
2.1.3.1.1 Model selection and inconsistency checking
Model fit parameters for the fixed‐effect and random‐effects models are reported in Appendix 3. Both fixed‐effect and random‐effects models fit the data well. The between‐study heterogeneity was low. As the difference in DICs between the fixed‐effect and random‐effects models was less than 3, the simpler fixed‐effect model was chosen. Results for the fixed‐effect model are presented in Section 2.1.3.1.2. A node‐splitting model was fit to assess inconsistency. The results of node‐splitting are presented in Table 38. There was no evidence to suggest inconsistency in the network.
20. Node‐splitting results for change from baseline in ACQ scores at 12 months.
| Model | p |
Mean Difference (95% CrI) |
| HD Triple vs. MD‐ICS/LABA | ||
| Direct | 0.946 | ‐0.090 (‐0.237, 0.074) |
| Indirect | ‐0.080 (‐0.335, 0.178) |
|
| Network | ‐0.082 (‐0.204, 0.042) |
|
Mean differences less than zero favour the first named treatment. CrI: credible interval; HD: high dose; ICS: inhaled corticosteroids; LABA: long‐acting beta‐2 agonist; MD: medium dose.
2.1.3.1.2 NMA results
Mean differences in CFB in ACQ scores at 12 months are presented in Figure 44. The mean differences in CFB in ACQ scores at 12 months comparing all treatment groups against each other are reported in Table 39. There is evidence to suggest that there is a change in ACQ scores at 12 months for HD Triple compared to HD‐ICS/LABA and MD Triple (mean difference ‐0.08 [95% CrI ‐0.15 to ‐0.01] and ‐0.10 [‐0.20 to ‐0.01], respectively). However, none of these differences reach the MCID of 0.5 (Juniper 2005). An NMA summary of findings is presented in Table 6.
44.
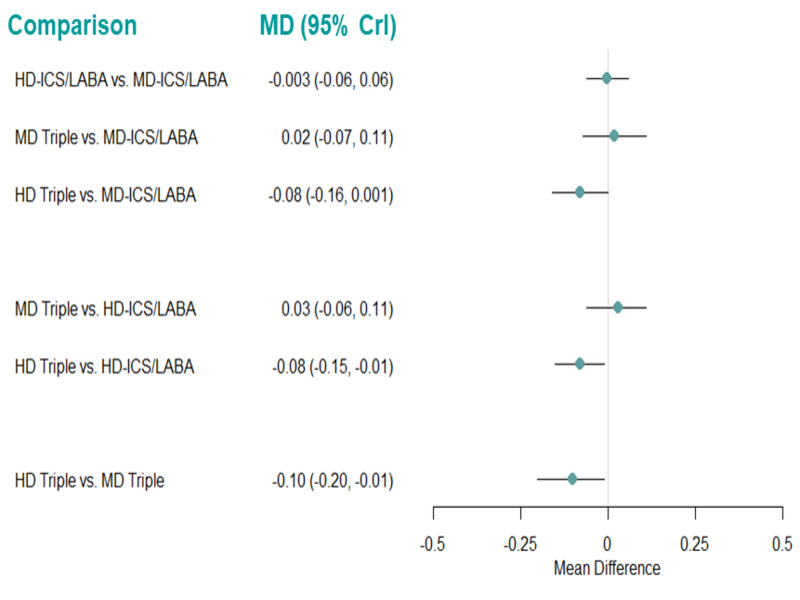
Forest plot of mean differences for change from baseline in ACQ scores at 12 months using the fixed effect model.
Mean differences less than zero favor the first named treatment. CrI: Credible Interval; HD: high dose; ICS: inhaled corticosteroids; LABA: long‐acting beta‐2 agonist; MD: mean difference; MD: medium dose.
21. Mean difference for change from baseline in ACQ scores at 12 months (fixed‐effect model).
| Comparison | Median Mean Difference (95% CrI) |
| HD‐ICS/LABA vs MD‐ICS/LABA | ‐0.003 (‐0.063, 0.057) |
| MD Triple vs. MD‐ICS/LABA | 0.024 (‐0.066, 0.114) |
| HD Triple vs MD‐ICS/LABA | ‐0.081 (‐0.162, 0.001) |
| MD Triple vs. HD‐ICS/LABA | 0.027 (‐0.056, 0.111) |
| HD Triple vs HD‐ICS/LABA | ‐0.077 (‐0.148, ‐0.007) |
| HD Triple vs MD Triple | ‐0.105 (‐0.199, ‐0.011) |
Mean difference less than zero favours the first named treatment. Treatment comparisons in bold do not include the “null” effect. CrI: credible interval; HD: high dose; ICS: inhaled corticosteroids; LABA: long‐acting beta‐2 agonist; MD: medium dose.
The rank plots for grouped treatments are presented in Figure 45, and the mean ranks are presented in Table 40. HD Triple ranks higher than the other treatments (median rank 1 [95%CrI 1 to 2]). All other treatment ranks display wide credible intervals, reflecting high uncertainty in treatment rankings.
45.
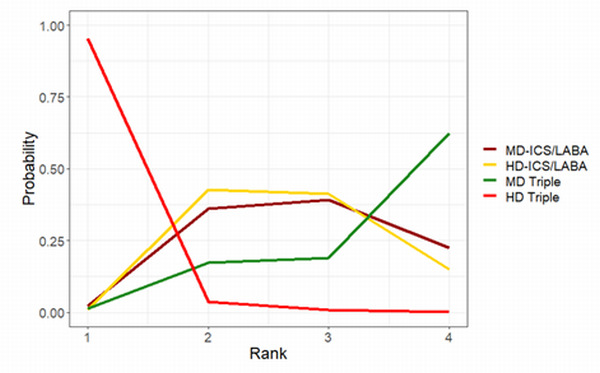
Rank plots for grouped treatments for change from baseline in ACQ scores at 12 months (fixed effect model) HD: high dose; ICS: inhaled corticosteroids; LABA: long‐acting beta‐2 agonist; MD: medium dose.
22. Mean and median ranks for change from baseline in ACQ scores at 12 months sorted by mean rank (fixed‐effect model).
| Treatments | Mean Rank | Median Rank | 95% CrI |
| HD Triple | 1.06 | 1.0 | (1.00, 2.00) |
| HD‐ICS/LABA | 2.70 | 3.0 | (2.00, 4.00) |
| MD‐ICS/LABA | 2.82 | 3.0 | (2.00, 4.00) |
| MD Triple | 3.43 | 4.0 | (2.00, 4.00) |
CrI: credible interval; HD: high dose; ICS: inhaled corticosteroids; LABA: long‐acting beta‐2 agonist; MD: medium dose.
2.1.4 Pairwise meta‐analysis
2.1.4.1 Change from baseline in ACQ scores at three, six, and 12 months
There is insufficient evidence to suggest that there is a clinically meaningful change in ACQ scores (MCID 0.5) at three, six, and 12 months for any of the treatment comparisons (Analysis 2.1, Analysis 2.2, and Analysis 2.3). The results were unchanged when Lee 2020,which is considered at high risk of bias due to high attrition rates, was removed in CFB in ACQ scores at 12 months. The certainty of evidence ranges from low to moderate (Table 7). There was no difference in the results between fixed‐effect and random‐effects models. Above results are qualitatively similar to those of the NMA.
2.1. Analysis.
Comparison 2: Asthma Control Questionnaire: change from baseline, Outcome 1: CFB in ACQ at 3 months
2.2. Analysis.
Comparison 2: Asthma Control Questionnaire: change from baseline, Outcome 2: CFB in ACQ at 6 months
2.3. Analysis.
Comparison 2: Asthma Control Questionnaire: change from baseline, Outcome 3: CFB in ACQ at 12 months
2.2 Asthma Quality of Life Questionnaire (AQLQ) score
2.2.1 Change from baseline at six months
2.2.1.1 Grouped treatments
For this outcome, 4 trials (3556 participants) comparing four treatment groups were included in the NMA (Figure 6). A summary of the studies included in the analysis is presented in Appendix 10.
2.2.1.1.1 Model selection and inconsistency checking
Model fit parameters for the fixed‐effect and random‐effects models are reported in Appendix 3. Both fixed‐effect‐ and random‐effects models fit the data well. The between‐study heterogeneity was low. As the difference in DICs between the fixed‐effect‐ and random‐effects models was less than 3, the simpler fixed‐effect model was chosen. Results for the fixed‐effect model are presented in Section 2.2.1.1.2. There is no potential for inconsistency in this network as there is no independent, indirect evidence for any of the comparisons.
2.2.1.1.2 NMA results
Mean differences in CFB in AQLQ scores at six months are presented in Figure 46. The mean differences in CFB in AQLQ scores at six months comparing all treatment groups against each other are reported in Table 41. There is insufficient evidence to suggest that there is a change in AQLQ scores at six months for any of the treatment comparisons. An NMA summary of findings is presented in Table 8.
46.
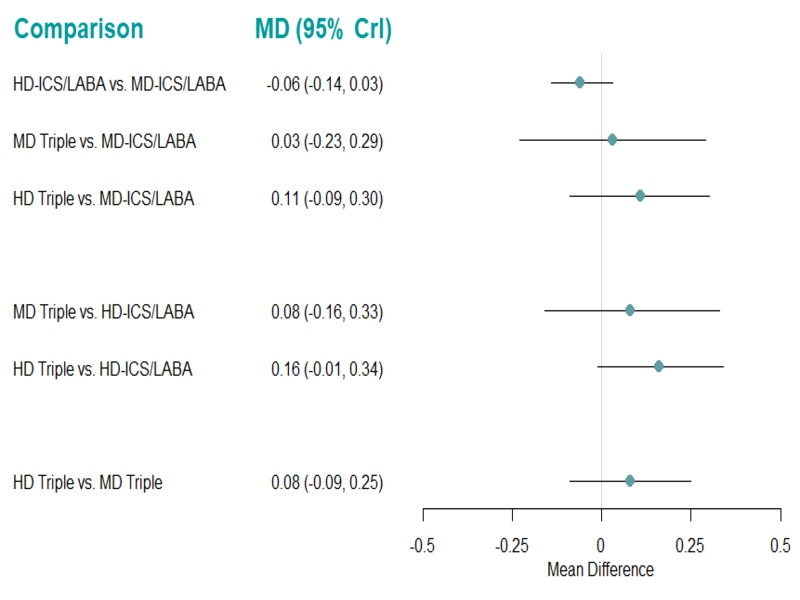
Forest plot of mean differences for change from baseline in AQLQ scores at 6 months using the fixed effect model.
Mean differences less than zero favor the first named treatment. CrI: Credible Interval; HD: high dose; ICS: inhaled corticosteroids; LABA: long‐acting beta‐2 agonist; MD: mean difference; MD: medium dose.
23. Mean difference for change from baseline in AQLQ scores at 6 months (fixed‐effect model).
| Comparison | Median Mean Difference (95% CrI) |
| HD‐ICS/LABA vs MD‐ICS/LABA | ‐0.056 (‐0.138, 0.026) |
| MD Triple vs. MD‐ICS/LABA | 0.028 (‐0.229, 0.287) |
| HD Triple vs MD‐ICS/LABA | 0.108 (‐0.088, 0.304) |
| MD Triple vs. HD‐ICS/LABA | 0.084 (‐0.159, 0.330) |
| HD Triple vs HD‐ICS/LABA | 0.164 (‐0.013, 0.342) |
| HD Triple vs MD Triple | 0.080 (‐0.088, 0.247) |
Mean difference less than zero favours the first named treatment. CrI: credible interval; HD: high dose; ICS: inhaled corticosteroids; LABA: long‐acting beta‐2 agonist; MD: medium dose.
The rank plots for grouped treatments are presented in Figure 47, and the mean and median ranks are presented in Table 42. HD Triple ranks the highest of all the grouped treatments (median rank 1 [95% CrI 1 to 3]). All other treatment ranks display wide credible intervals, reflecting high uncertainty in treatment rankings.
47.
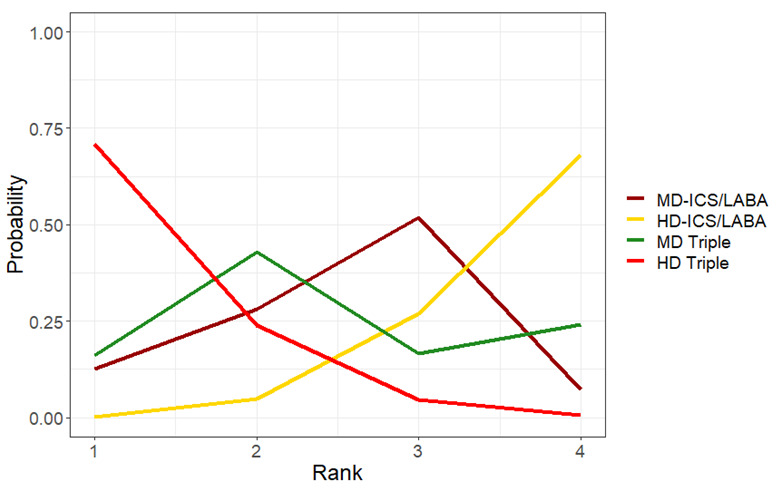
Rank plots for grouped treatments for change from baseline in AQLQ scores at 6 months (fixed effect model)
HD: high dose; ICS: inhaled corticosteroids; LABA: long‐acting beta‐2 agonist; MD: medium dose.
24. Mean and median ranking for change from baseline in AQLQ scores at 6 months sorted by mean rank (fixed‐effect model).
| Treatments | Mean Rank | Median Rank | 95% CrI |
| HD Triple | 1.35 | 1.00 | (1.00, 3.00) |
| MD Triple | 2.49 | 2.00 | (1.00, 4.00) |
| MD‐ICS/LABA | 2.54 | 3.00 | (1.00, 4.00) |
| HD‐ICS/LABA | 3.63 | 4.00 | (2.00, 4.00) |
CrI: credible interval; HD: high dose; ICS: inhaled corticosteroids; LABA: long‐acting beta‐2 agonist; MD: medium dose.
2.2.2 Change from baseline at 12 months
2.2.2.1 Grouped treatments
For this outcome, 4 trials (4809 participants) comparing four treatment groups were included in the NMA (Figure 7). A summary of the studies included in the analysis is presented in Appendix 11.
2.2.2.1.1 Model selection and inconsistency checking
Model fit parameters for the fixed‐effect and random‐effects models are reported in Appendix 3. Both fixed‐effect and random‐effects models fit the data well. The between‐study heterogeneity was low. As the difference in DICs between the fixed‐effect and random‐effects models was less than 3, the simpler fixed‐effect model was chosen. Results for the fixed‐effect model are presented in Section 2.2.2.1.2. A node‐splitting model was fit to assess inconsistency in the model. The results of node‐splitting are presented in Table 43. There was no evidence to suggest inconsistency in the network.
25. Node‐splitting results for CFB in AQLQ scores at 12 months.
| Model | p |
Mean Difference (95% CrI) |
| HD Triple vs. MD‐ICS/LABA | ||
| Direct | 0.944 | 0.060 (‐0.247, 0.362) |
| Indirect | 0.073 (‐0.324, 0.471) |
|
| Network | 0.053 (‐0.126, 0.258) |
|
Mean differences less than zero favour the first named treatment. CrI: credible interval; HD: high dose; ICS: inhaled corticosteroids; LABA: long‐acting beta‐2 agonist; MD: medium dose.
2.2.2.1.2 NMA results
Mean differences in CFB in AQLQ scores at 12 months are presented in Figure 48. The mean differences in CFB in AQLQ scores at 12 months comparing all treatment groups against each other are reported in Table 44.
48.
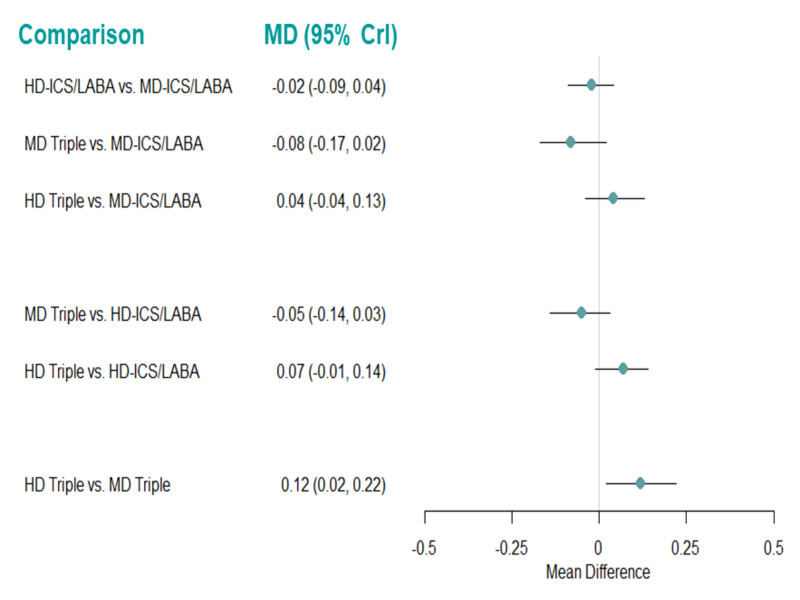
Forest plot of mean differences for change from baseline in AQLQ scores at 12 months using the fixed effect model.
Mean differences less than zero favor the first named treatment. CrI: Credible Interval; HD: high dose; ICS: inhaled corticosteroids; LABA: long‐acting beta‐2 agonist; MD: mean difference; MD: medium dose.
26. Mean difference for change from baseline in AQLQ scores at 12 months (fixed‐effect model).
| Comparison | Median Mean Difference (95% CrI) |
| HD‐ICS/LABA vs MD‐ICS/LABA | ‐0.024 (‐0.087, 0.039) |
| MD Triple vs. MD‐ICS/LABA | ‐0.076 (‐0.167, 0.016) |
| HD Triple vs MD‐ICS/LABA | 0.045 (‐0.041, 0.131) |
| MD Triple vs. HD‐ICS/LABA | ‐0.052 (‐0.135, 0.032) |
| HD Triple vs HD‐ICS/LABA | 0.069 (‐0.006, 0.144) |
| HD Triple vs MD Triple | 0.121 (0.025, 0.216) |
Mean difference less than zero favours the first named treatment. Treatment comparisons in bold do not include the “null” effect. CrI: credible interval; HD: high dose; ICS: inhaled corticosteroids; LABA: long‐acting beta‐2 agonist; MD: medium dose.
There is evidence to suggest that there is a change in AQLQ scores at 12 months for HD Triple compared to MD Triple (MD 0.12 [95% CrI 0.02 to 0.22]). However, this difference does not reach the MCID of 0.5 (Juniper 1994). An NMA summary of findings is presented in Table 9.
The rank plots for grouped treatments are presented in Figure 49, and the mean and median ranks are presented in Table 45. HD Triple ranks the highest of all the grouped treatments (median rank 1 [95% CrI 1 to 3]), but credible intervals for treatment ranks are wide.
49.
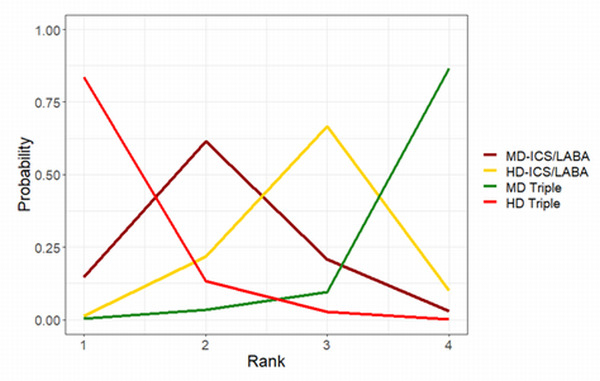
Rank plots for grouped treatments for change from baseline in AQLQ scores at 12 months (fixed effect model)
HD: high dose; ICS: inhaled corticosteroids; LABA: long‐acting beta‐2 agonist; MD: medium dose.
27. Mean and median ranking for change from baseline in AQLQ scores at 12 months sorted by mean rank (fixed‐effect model).
| Treatments | Mean Rank | Median Rank | 95% CrI |
| HD Triple | 1.20 | 1 | (1.00, 3.00) |
| MD‐ICS/LABA | 2.12 | 2 | (1.00, 4.00) |
| HD‐ICS/LABA | 2.85 | 3 | (2.00, 4.00) |
| MD Triple | 3.83 | 4 | (2.00, 4.00) |
CrI: credible interval; HD: high dose; ICS: inhaled corticosteroids; LABA: long‐acting beta‐2 agonist; MD: medium dose.
2.2.3 Pairwise meta‐analysis
2.2.3. 1 change from baseline in AQLQ scores at six and 12 months
There is insufficient evidence to suggest that there is a clinically meaningful change in AQLQ scores (MCID 0.5) at six or 12 months for any of the treatment comparisons (Analysis 3.1 and Analysis 3.2). The certainty of evidence ranges from low to moderate (Table 10). There was no difference in the results between fixed‐effect and random‐effects models. Above results are similar to those of the NMA.
3.1. Analysis.
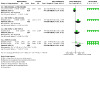
Comparison 3: Asthma Quality of Life Questionnaire: change from baseline, Outcome 1: CFB in AQLQ at 6 months
3.2. Analysis.
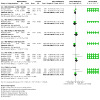
Comparison 3: Asthma Quality of Life Questionnaire: change from baseline, Outcome 2: CFB in AQLQ at 12 months
3. Secondary, dichotomous outcomes
3.1 Asthma Control Questionnaire (ACQ) responders
3.1.1 ACQ responders at six months.
3.1.1.1 Grouped treatments
For this outcome, 7 trials (10,453 participants) comparing four treatment groups were included in the NMA (Figure 8). A summary of the studies included in the analysis is presented in Appendix 12.
3.1.1.1.1 Model selection and inconsistency checking
The Turner prior comparing pharmacological interventions for subjective outcomes, i.e. a Log‐Normal (‐2.93, 1.582) prior distribution, was used for the between‐study heterogeneity (Turner 2015).
Model fit parameters for the fixed‐effect and random‐effects models are reported in Appendix 3. Both fixed‐effect and random‐effects models fit the data well. The between‐study heterogeneity was low. As the difference in DICs between the fixed‐effect and random‐effects models was less than 3, the simpler fixed‐effect model was chosen. Results for the fixed‐effect model are presented in Section 3.1.1.1.2.
A node‐splitting model was fit to assess inconsistency. The results of node‐splitting are presented in Table 46. There was no evidence to suggest inconsistency in the network.
28. Node‐splitting results for ACQ responders at 6 months for grouped treatments.
| Model | p |
LORs (95% CrI) |
| HD‐ICS/LABA vs. MD‐ICS/LABA | ||
| Direct | 0.360 | 0.080 (‐0.142, 0.306) |
| Indirect | ‐0.14 (‐0.664, 0.373) |
|
| Network | 0.046 (‐0.150, 0.236) |
|
| MD Triple vs. MD‐ICS/LABA | ||
| Direct | 0.402 | 0.207 (‐0.026, 0.441) |
| Indirect | 0.472 (‐0.167, 1.117) |
|
| Network | 0.228 (0.028, 0.432) |
|
| HD Triple vs. MD‐ICS/LABA | ||
| Direct | 0.720 | 0.247 (‐0.114, 0.612) |
| Indirect | 0.156 (‐0.327, 0.620) |
|
| Network | 0.216 (0.005, 0.425) |
|
| MD Triple vs. HD‐ICS/LABA | ||
| Direct | 0.267 | 0.089 (‐0.218, 0.408) |
| Indirect | 0.343 (‐0.058, 0.781) |
|
| Network | 0.183 (‐0.020, 0.394) |
|
| HD Triple vs. HD‐ICS/LABA | ||
| Direct | 0.391 | 0.185 (‐0.006, 0.383) |
| Indirect | ‐0.077 (‐0.718, 0.584) |
|
| Network | 0.172 (‐0.001, 0.343) |
|
| HD Triple vs. MD Triple | ||
| Direct | 0.359 | ‐0.061 (‐0.305, 0.171) |
| Indirect | 0.158 (‐0.339, 0.672) |
|
| Network | ‐0.011 (‐0.222, 0.188) |
|
CrI: credible interval; HD: high dose; ICS: inhaled corticosteroids; LABA: long‐acting beta‐2 agonist; LOR: log odds ratio; MD: medium dose.
3.1.1.1.2 NMA results
The odds ratios of ACQ responders at six months are presented in Figure 50. The odds ratios of ACQ responders at six months comparing all treatment groups against each other are reported in Table 47.
50.
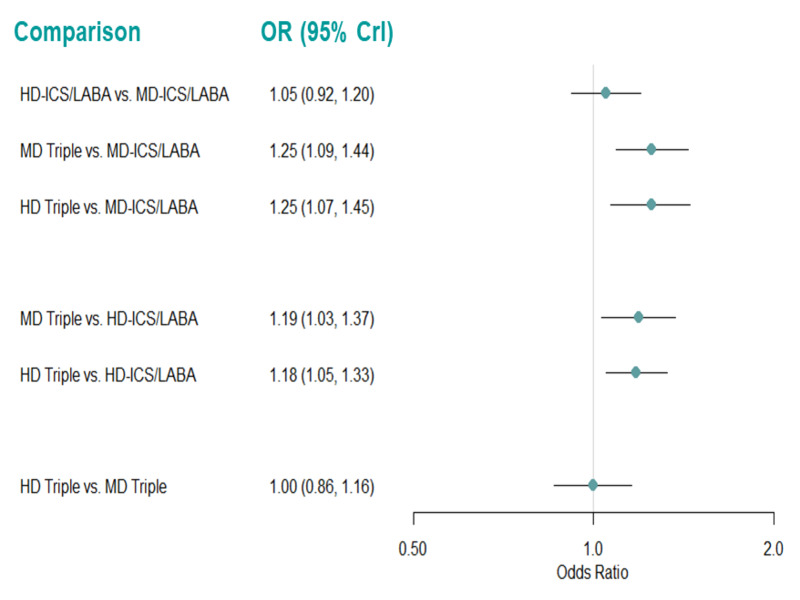
Forest plot of odds ratios relative for ACQ responders at 6 months for grouped treatments.
Odds ratio greater than one favors the first named treatment. CrI: Credible Interval; HD: high dose; ICS: inhaled corticosteroids; LABA: long‐acting beta‐2 agonist; MD: medium dose.
29. Odds ratio for ACQ responders at 6 months (fixed‐effect model).
| Comparison | Odds Ratio (95% CrI) |
| HD‐ICS/LABA vs MD‐ICS/LABA | 1.052 (0.919, 1.203) |
| MD Triple vs. MD‐ICS/LABA | 1.248 (1.086, 1.437) |
| HD Triple vs MD‐ICS/LABA | 1.246 (1.073, 1.446) |
| MD Triple vs. HD‐ICS/LABA | 1.187 (1.030, 1.370) |
| HD Triple vs HD‐ICS/LABA | 1.184 (1.054, 1.331) |
| HD Triple vs MD Triple | 0.998 (0.861, 1.155) |
The second named treatment is the baseline intervention. Odds ratio greater than one favours the first named treatment.Treatment comparisons in bold do not include the “null” effect. CrI: credible interval; HD: high dose; ICS: inhaled corticosteroids; LABA: long‐acting beta‐2 agonist; MD: medium dose.
There is evidence to suggest that MD Triple and HD Triple increase the odds of patient response compared to MD‐ICS/LABA (OR 1.25 [95% CrI 1.09 to 1.44] and 1.25 [1.07 to 1.45]) and HD‐ICS/LABA (OR 1.19 [95% CrI 1.03 to 1.37] and 1.18 [1.05 to 1.33]). An NMA summary of findings is presented in Table 11.
The rank plots for grouped treatments are presented in Figure 51, and the mean and median ranks are presented in Table 48. MD Triple and HD Triple rank higher than the other treatments (median rank 1 [95% CrI 1 to 2] and 2 [1 to 2], respectively). However, it is difficult to differentiate between MD Triple and HD Triple, and MD‐ICS/LABA and HD‐ICS/LABA in terms of treatment ranks.
51.
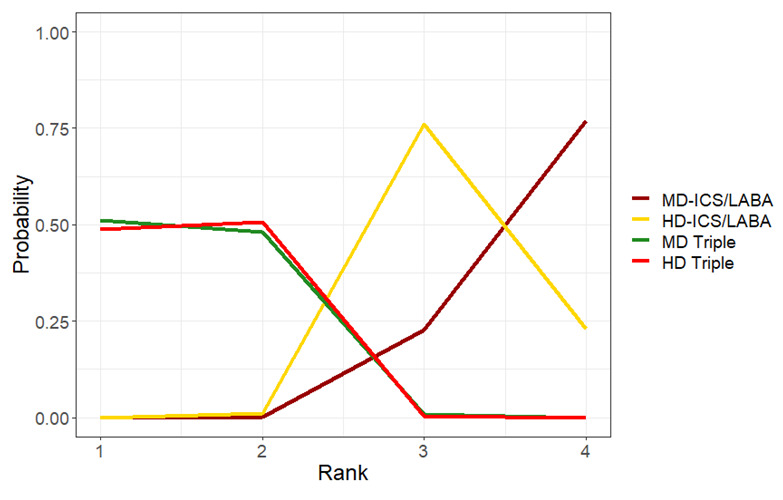
Rank plots for grouped treatments for ACQ responders at 6 months (fixed effect model)
HD: high dose; ICS: inhaled corticosteroids; LABA: long‐acting beta‐2 agonist; MD: medium dose.
30. Mean and median ranking for grouped treatments for ACQ responders at 6 months sorted by mean rank (fixed‐effect model).
| Treatments | Mean Rank | Median Rank | 95% CrI |
| MD Triple | 1.50 | 1 | (1.00, 2.00) |
| HD Triple | 1.52 | 2 | (1.00, 2.00) |
| HD‐ICS/LABA | 3.22 | 3 | (3.00, 4.00) |
| MD‐ICS/LABA | 3.77 | 4 | (3.00, 4.00) |
CrI: credible interval; HD: high dose; ICS: inhaled corticosteroids; LABA: long‐acting beta‐2 agonist; MD: medium dose.
3.1.1.1.3 Pairwise meta‐analysis
Results of pairwise meta‐analysis are presented in Analysis 4.1 and Table 13). The evidence suggests that HD and MD Triple increase ACQ responders at six months compared to MD‐ICS/LABA (RR 1.11 [95% CI 0.91 to 1.35]; absolute benefit increase (ABI) 69 more per 1000 patients; [very low certainty] and RR 1.09 [95% CI 0.99 to 1.19]; ABI 52 more per 1000 patients; [low certainty], respectively).
4.1. Analysis.
Comparison 4: Asthma Control Questionnaire responders, Outcome 1: ACQ responders at 6 months
There is evidence to suggest that triple therapy (ICS/LABA/LAMA) increases ACQ responders at six months compared to dual therapy (ICS/LABA) (RR1.09 [95% CI 1.02 to 1.15]; ABI 54 more per 1000 patients; [low certainty]).
The results were unchanged when van Zyl‐Smit 2020, which is considered at high risk of bias due to high attrition rates, was removed. There was no difference in the results between fixed‐effect and random‐effects models.
3.1.1.2 Individual treatments
For this outcome, 3 trials (5380 participants) comparing six distinct treatments were included in the NMA (Figure 52). A summary of the studies included is presented in Appendix 13. Three studies (Kerstjens 2012, Lee 2020, and Virchow 2019a) that were identified were excluded from this analysis, as they were disconnected from the main network shown in Figure 52.
52.
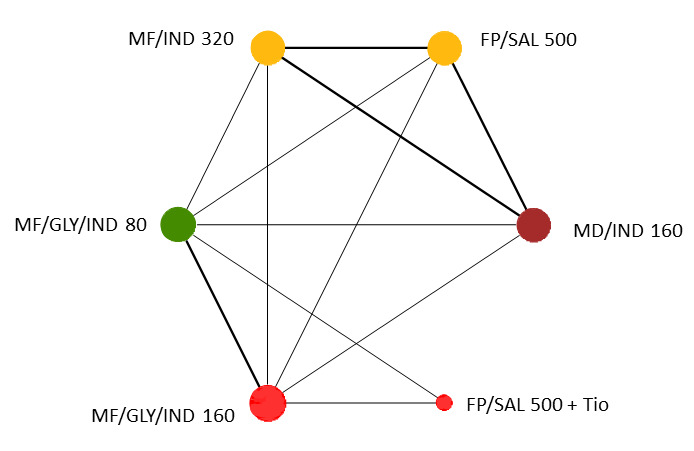
Network diagram for ACQ responders at 6 months for individual interventions.
Node colors denote the treatment group. The size of the nodes and the thickness of edges depend on the number of people randomised and the number of trials conducted. FP:fluticasone propionate, GLY: glycopyrronium, IND:indacaterol, MF:mometasone furoate, SAL:salmeterol, Tio:tiotropium.
3.1.1.2.1 Model selection and inconsistency checking
The Turner prior comparing pharmacological interventions for subjective outcomes, i.e. a Log‐Normal (‐2.93, 1.582) prior distribution, was used for the between‐study heterogeneity (Turner 2015).
Model fit parameters for the fixed‐effect and random‐effects models are reported in Appendix 3. Both fixed‐effect and random‐effects models fit the data well. The between‐study heterogeneity was low. As the difference in DICs between the fixed‐effect and random‐effects models was less than 3, the simpler fixed‐effect model was chosen. Results for the fixed‐effect model are presented in Section 3.1.1.2.2. There is no potential for inconsistency in this network as there is no independent, indirect evidence for any of the comparisons.
3.1.1.2.2 NMA results
The odds ratios of ACQ responders at six months, compared to mometasone furoate/indacaterol (MF/IND)160/150 µg (MD‐ICS/LABA), are presented in Figure 53. The odds ratios of ACQ responders at six months comparing all treatment groups against each other are reported in Table 49.
53.
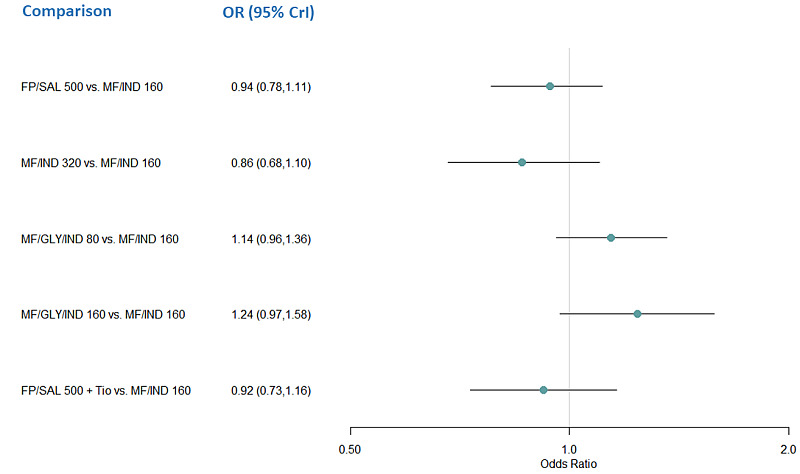
Forest plot of odds ratios relative to MF/IND160 for ACQ responders at 6 months for individual treatments.
Odds ratio greater than one favors the comparator treatment over MF/IND 160. CrI: credible interval, FP:fluticasone propionate, GLY: glycopyrronium, IND:indacaterol, MF:mometasone furoate, SAL:salmeterol, Tio:tiotropium.
31. Odds ratio for ACQ responders at 6 months for individual treatments (fixed‐effect model).
| Comparison | Odds Ratio (95% CrI) |
| FP/SAL 500 vs. MF/IND 160 | 0.935 (0.785,1.114) |
| MF/IND 320 vs. MF/IND 160 | 0.860 (0.677,1.097) |
| MF/GLY/IND 80 vs. MF/IND 160 | 1.140 (0.957,1.360) |
| MF/GLY/IND 160 vs. MF/IND 160 | 1.241 (0.974,1.581) |
| FP/SAL 500 + Tio vs. MF/IND 160 | 0.919 (0.732,1.157) |
| MF/IND 320 vs. FP/SAL 500 | 1.220 (0.998,1.491) |
| MF/GLY/IND 80 vs. FP/SAL500 | 1.327 (1.124,1.568) |
| MF/GLY/IND 160 vs. FP/SAL 500 | 1.326 (1.029,1.704) |
| FP/SAL 500 + Tio vs. FP/SAL 500 | 1.443 (1.087,1.913) |
| MF/GLY/IND 80 vs. MF/IND 320 | 1.088 (0.838,1.412) |
| MF/GLY/IND 160 vs. MF/IND 320 | 0.935 (0.785,1.114) |
| FP/SAL 500 + Tio vs. MF/IND 320 | 0.860 (0.677,1.097) |
| MF/GLY/IND 160 vs. MF/GLY/IND 80 | 1.140 (0.957,1.360) |
| FP/SAL 500 + Tio vs. MF/GLY/IND 80 | 1.241 (0.974,1.581) |
| FP/SAL 500 + Tio vs. MF/GLY/IND 160 | 0.919 (0.732,1.157) |
The second named treatment is the baseline intervention. Odds ratio greater than one favours the treatment named first in the comparisons. Treatment comparisons in bold do not include the “null” effect. CrI=credible interval, FP=fluticasone propionate, GLY= glycopyrronium, IND=indacaterol, MF=mometasone furoate, SAL=salmeterol, Tio=tiotropium.
There is no evidence to suggest that there is a change in odds of ACQ responders at six months for any individual treatments compared to MF/IND 160/150 µg (MD‐ICS/LABA), but there was evidence to suggest that LD and MD triple therapies with mometasone furoate/glycopyrronium/indacaterol (80/50/150 µg and160/50/150 µg) and FP/SAL 500/50 µg plus tiotropium 5 µg (HD Triple) increase the odds of ACQ responders compared to FP/SAL 500/50 µg (HD‐ICS/LABA).
The rank plots for individual treatments are presented in Figure 54, and the mean and median ranks are presented in Table 50. MF/IND 320/150 µg (HD‐ICS/LABA) has the highest probability of being better than the other individual treatments (median rank 1 [95% CrI,1 to 4]).
54.
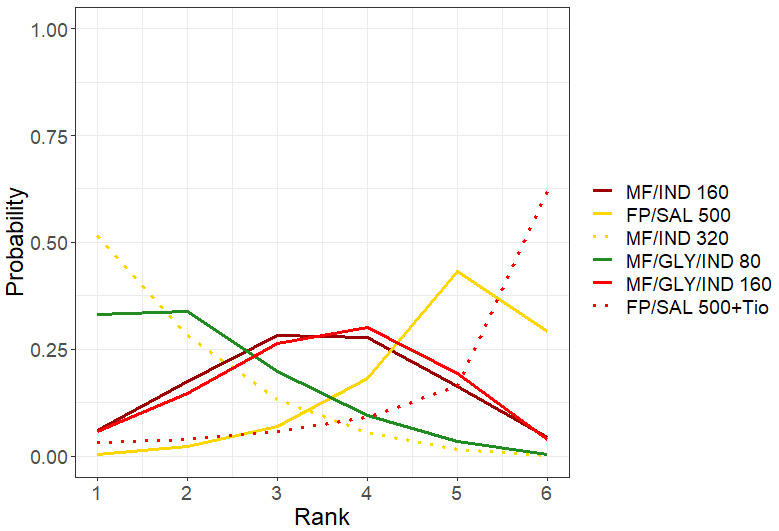
Rank plots for individual treatments for ACQ responders at 6 months (fixed effect model)
Line colors denote the treatment group. FP:fluticasone propionate, GLY: glycopyrronium, IND:indacaterol, MF:mometasone furoate, SAL:salmeterol, Tio:tiotropium.
32. Mean and median ranking for individual treatments for ACQ responders at 6 months sorted by mean rank (fixed‐effect model).
| Treatments | Mean Rank | Median | 95% CrI |
| MF/IND 320 | 1.78 | 1 | (1.00, 4.00) |
| MF/GLY/IND 80 | 2.17 | 2 | (1.00, 5.00) |
| MF/IND 160 | 3.44 | 3 | (1.00, 6.00) |
| MF/GLY/IND 160 | 3.54 | 4 | (1.00, 6.00) |
| FP/SAL 500 | 4.89 | 5 | (3.00, 6.00) |
| FP/SAL 500 + Tio | 5.17 | 6 | (1.00, 6.00) |
CrI=credible interval, FP=fluticasone propionate, GLY= glycopyrronium, IND=indacaterol, MF=mometasone furoate, SAL=salmeterol, Tio=tiotropium.
3.1.2 Asthma control questionnaire (ACQ) responders at 12 months.
3.1.2.1 Grouped treatments
For this outcome, 5 trials (7391 participants) comparing four treatment groups were included in the NMA (Figure 9). A summary of the studies included in the analysis is presented in Appendix 14.
3.1.2.1.1 Model selection and inconsistency checking
For this subjective outcome comparing pharmacological interventions, a Log‐Normal (‐2.93, 1.582) prior distribution was used for the between‐study heterogeneity (Turner 2015).
Model fit parameters for the fixed‐effect and random‐effects models are reported in Appendix 3. While the random‐effects model appears to fit the data well, the total residual deviance for the fixed‐effect model is a little high. The between‐study heterogeneity was low. As the difference in DICs between the fixed‐effect and random‐effects models was less than 3, the simpler fixed‐effect model was chosen, however due to the poor fit of this model, results for the random‐effects model are presented along with the results for the fixed‐effect model in Section 3.1.2.1.2.
A node‐splitting model was fit to assess inconsistency. The results of node‐splitting are presented in Table 51. There was no evidence to suggest inconsistency in the network.
33. Node‐splitting results for ACQ responders at 12 months for grouped treatments.
| Model | p |
LOR (95% CrI) |
| HD Triple vs. MD‐ICS/LABA | ||
| Direct | 0.804 | 0.310 (‐0.404, 1.018) |
| Indirect | 0.203 (‐0.566, 0.960) |
|
| Network | 0.263 (‐0.172, 0.672) |
|
| MD Triple vs. HD‐ICS/LABA | ||
| Direct | 0.412 | ‐0.129 (‐0.775, 0.527) |
| Indirect | 0.228 (‐0.599, 1.077) |
|
| Network | 0.014 (‐0.408, 0.469) |
|
| HD Triple vs. MD Triple | ||
| Direct | 0.752 | 0.327 (‐0.384, 1.033) |
| Indirect | 0.167 (‐0.822, 1.143) |
|
| Network | 0.286 (‐0.192, 0.747) |
|
Negative LOR favours the second named treatment. CrI: credible interval; HD: high dose; ICS: inhaled corticosteroids; LABA: long‐acting beta‐2 agonist; LOR log odds ratio; MD: medium dose.
3.1.2.1.2 NMA results
The odds ratios of ACQ responders at 12 months are presented in Figure 55. The odds ratios of ACQ responders at 12 months comparing all treatment groups against each other are reported in Table 52.
55.
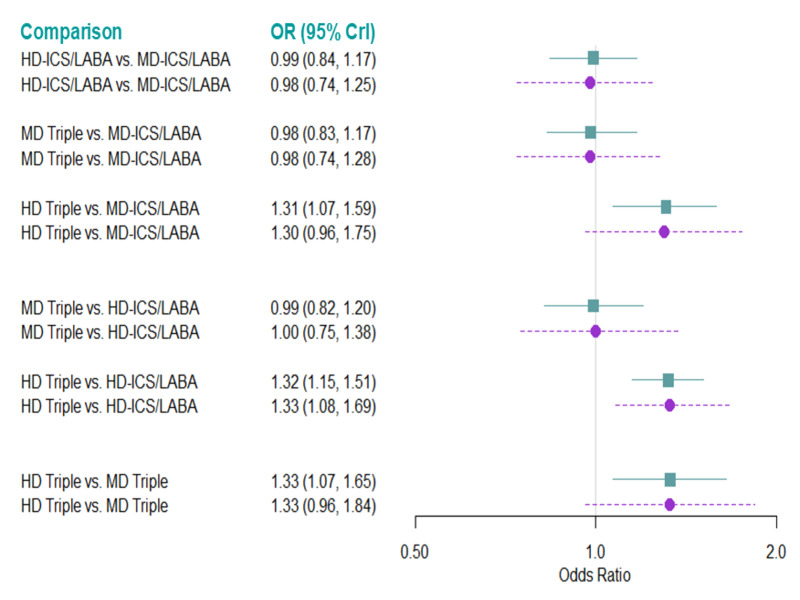
Forest plot of odds ratios relative to MD‐ICS/LABA for ACQ responders at 12 months for grouped treatments (fixed‐ and random‐effectsmodel).
Odds ratio greater than one favors the comparator treatment over MD‐ICS/LABA. CrI: credible interval, HD: high dose; ICS: inhaled corticosteroids; LABA: long‐acting beta‐2 agonist; MD: medium dose.
34. Odds ratio for ACQ responders at 12 months for grouped treatments.
| Comparison | Odds Ratio (95% CrI) | |
| Fixed Effect Model | Random Effects Model | |
| HD‐ICS/LABA vs MD‐ICS/LABA | 0.993 (0.839, 1.173) | 0.978 (0.736, 1.245) |
| MD Triple vs. MD‐ICS/LABA | 0.983 (0.826, 1.169) | 0.979 (0.742, 1.280) |
| HD Triple vs MD‐ICS/LABA | 1.306 (1.072, 1.592) | 1.303 (0.959, 1.750) |
| MD Triple vs. HD‐ICS/LABA | 0.990 (0.819, 1.199) | 1.000 (0.752, 1.382) |
| HD Triple vs HD‐ICS/LABA | 1.316 (1.148, 1.509) | 1.331 (1.084, 1.690) |
| HD Triple vs MD Triple | 1.329 (1.072, 1.647) | 1.332 (0.957, 1.844) |
The second named treatment is the baseline intervention. Odds Ratio greater than one favours the treatment named first in the comparisons. CrI: credible interval; HD: high dose; ICS: inhaled corticosteroids; LABA: long‐acting beta‐2 agonist; MD: medium dose.
Results for the fixed‐effect and random‐effects models are largely consistent in terms of odds ratios; in both models HD Triple increases the odds of ACQ response at 12 months compared to HD‐ICS/LABA (OR 1.32 [95%CrI 1.15 to 1.51] and 1.33 [1.08 to 1.69] for the fixed‐effect and random‐effects models, respectively). In the fixed‐effect model, HD Triple increases the odds of ACQ response compared to MD‐ICS/LABA and MD Triple (OR 1.31 [95% CrI 1.07 to 1.59] and 1.33 [1.07 to 1.65], respectively). The credible intervals for these comparisons for the random‐effects model include the “null” effect. An NMA summary of findings is presented in Table 12.
The density plot for the between‐study heterogeneity is presented in Figure 56. Its high peak close to zero is consistent with the fixed‐effect model, although higher values cannot be discarded.
56.
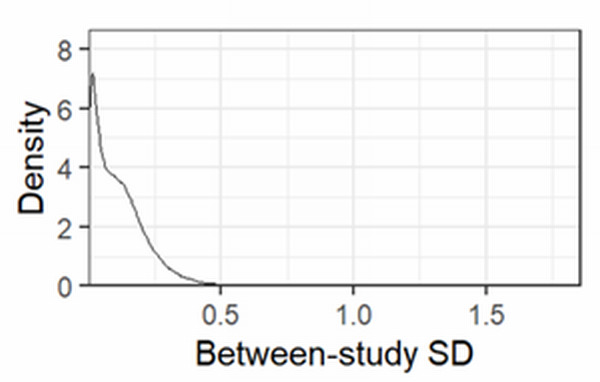
Density plot for the between‐study standard deviation (SD) for the random effects model for ACQ Responders at 12 months for grouped interventions
The rank plots for grouped treatments are presented in Figure 57, and the mean and median ranks are presented in Table 53. HD Triple ranks higher than the other grouped treatments (median rank 1 [95% CrI 1 to 1] for the fixed‐effect model, median rank 1 [95% CrI 1 to 2] for the random‐effects model).
57.
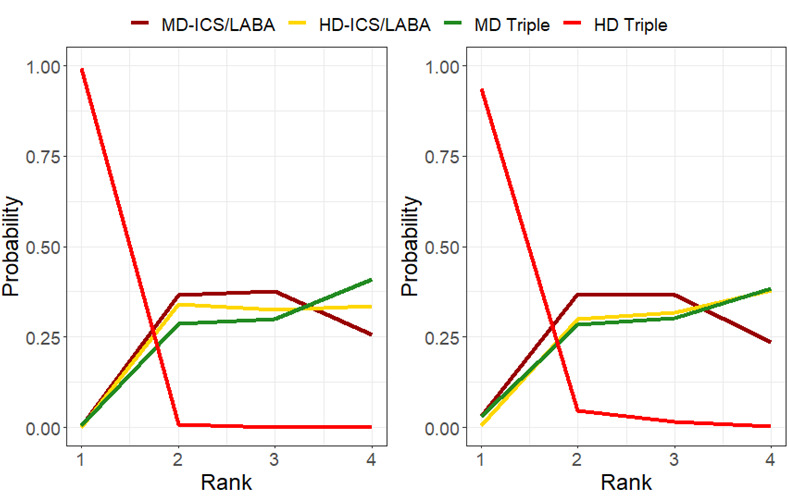
Rank plots for grouped treatments for ACQ responders at 12 months for the fixed effect (A) and random effects (B) model.
HD: high dose; ICS: inhaled corticosteroids; LABA: long‐acting beta‐2 agonist; MD: medium dose.
35. Mean and median ranking for grouped treatments for ACQ responders at 12 months sorted by mean rank.
| Fixed Effects Model | |||
| Treatments | Mean Rank | Median Rank | 95% CrI |
| HD Triple | 1.01 | 1 | (1.00, 1.00) |
| MD‐ICS/LABA | 2.88 | 3 | (2.00, 4.00) |
| HD‐ICS/LABA | 2.99 | 3 | (2.00, 4.00) |
| MD Triple | 3.11 | 3 | (2.00, 4.00) |
| Random Effects Model | |||
| Treatments | Mean Rank | Median Rank | 95% CrI |
| HD Triple | 1.09 | 1 | (1.00, 2.00) |
| MD‐ICS/LABA | 2.81 | 3 | (1.00, 4.00) |
| MD Triple | 3.04 | 3 | (1.00, 4.00) |
| HD‐ICS/LABA | 3.07 | 3 | (2.00, 4.00) |
CrI: credible interval; HD: high dose; ICS: inhaled corticosteroids; LABA: long‐acting beta‐2 agonist; MD: medium dose.
3.1.2.1.3 Pairwise meta‐analysis
Results of pairwise meta‐analysis are presented in Analysis 4.2 and Table 13. There is moderate evidence that HD Triple increases ACQ responders at 12 months compared to MD Triple (RR 1.08 [95% CI 1.01 to 1.16]; ABI 58 more per 1000 patients and HD Triple compared to MD‐ICS/LABA (RR 1.08 [95% CI 1.01 to 1.16]; ABI 58 more per 1000 patients).
4.2. Analysis.
Comparison 4: Asthma Control Questionnaire responders, Outcome 2: ACQ responders at 12 months
The evidence suggests triple therapy (ICS/LABA/LAMA) increases ACQ responders at 12 months compared to dual therapy (ICS/LABA) (RR 1.05 [95% CI 1.02 to 1.09]; I2 = 75%) when analysed using the fixed‐effect model. However, the confidence intervals included the null effect when Kerstjens 2012 was removed or the random‐effects model was used. Therefore, it is very uncertain if triple therapy (ICS/LABA/LAMA) increases ACQ responders at 12 months compared to dual therapy (ICS/LABA).
The results were unchanged when van Zyl‐Smit 2020, which is considered at high risk of bias due to high attrition rates, was removed. The use of fixed‐effect or random‐effect analysis did not change the results except for triple versus dual therapy as mentioned above and HD Triple vs. HD‐ICS/LABA in which the confidence intervals included the “null” effect with the random‐effects analysis.
3.1.2.2 Individual treatments
For this outcome, 2 trials (3906 participants) comparing five distinct treatments were included in the NMA (Figure 58). A summary of the studies included is presented in Appendix 15. Two studies (Kerstjens 2012, and Virchow 2019) that were identified were excluded from this analysis, as they were disconnected from the main network shown in Figure 58.
58.
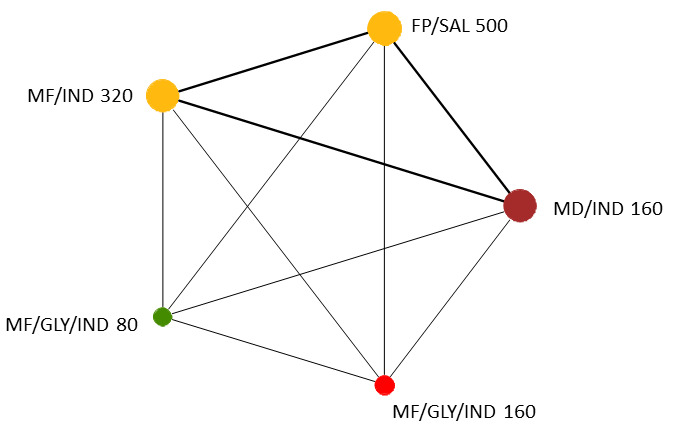
Network diagram for ACQ responders at 12 months for individual interventions.
Node colors denote the treatment group. The size of the nodes and the thickness of edges depend on the number of people randomised and the number of trials conducted. FP:fluticasone propionate, GLY: glycopyrronium, IND:indacaterol, MF:mometasone furoate, SAL:salmeterol.
3.1.2.2.1 Model selection and inconsistency checking
Model fit parameters for the fixed‐effect and random‐effects models are reported in Appendix 3. Both fixed‐effect and random‐effects models fit the data well. The between‐study heterogeneity was low. As the difference in DICs between the fixed‐effect and random‐effects models was less than 3, the simpler fixed‐effect model was chosen. Results for the fixed‐effect model are presented in Section 3.1.2.2.2. There is no potential for inconsistency in this network as there is no independent, indirect evidence for any of the comparisons.
3.1.2.2.2 NMA results
The odds ratios of ACQ responders at 12 months, compared to MF/IND 160/150 (MD‐ICS/LABA), are presented in Figure 59. The odds ratios of ACQ responders at 12 months comparing all treatment groups against each other are reported in Table 54.
59.
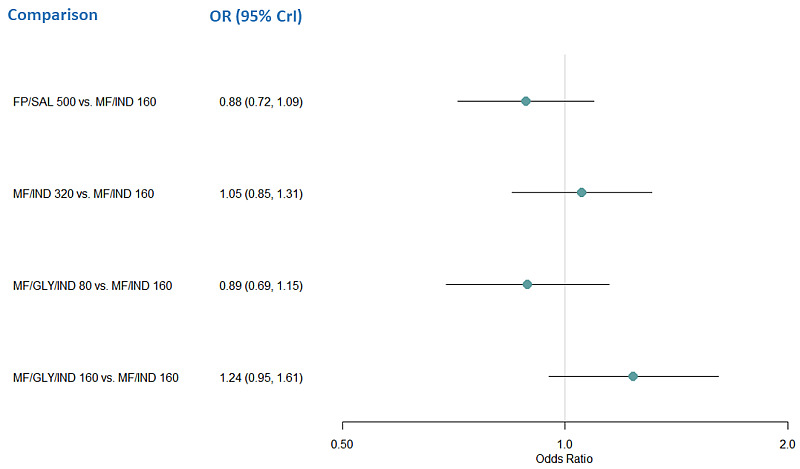
Forest plot of odds ratios relative to MF/IND160 for ACQ responders at 12 months for individual treatments (fixed effect model)
Odds Ratio greater than one favors the comparator treatment over MF/IND 160.CrI: credible interval, FP:fluticasone propionate, GLY: glycopyrronium, IND:indacaterol, MF:mometasone furoate, SAL:salmeterol.
36. Odds ratio for ACQ responders at 12 months for individual treatments (fixed‐effect model).
| Comparison | Odds Ratio (95% CrI) |
| FP/SAL 500 vs. MF/IND 160 | 0.884 (0.715, 1.093) |
| MF/IND 320 vs. MF/IND 160 | 1.053 (0.847, 1.309) |
| MF/GLY/IND 80 vs. MF/IND 160 | 0.889 (0.690, 1.146) |
| MF/GLY/IND 160 vs. MF/IND 160 | 1.235 (0.950, 1.612) |
| MF/IND 320 vs. FP/SAL 500 | 1.192 (0.964, 1.475) |
| MF/GLY/IND 80 vs. FP/SAL 500 | 1.006 (0.783, 1.293) |
| MF/GLY/IND 160 vs. FP/SAL 500 | 1.397 (1.078, 1.819) |
| MF/GLY/IND 80 vs. MF/IND 320 | 0.844 (0.654, 1.090) |
| MF/GLY/IND 160 vs. MF/IND 320 | 1.173 (0.901, 1.532) |
| MF/GLY/IND 160 vs. MF/GLY/IND 80 | 1.389 (1.051, 1.838) |
The second named treatment is the baseline intervention. Odds ratio greater than one favours the treatment named first in the comparisons. Treatment comparisons in bold do not include the “null” effect. CrI=credible interval, FP=fluticasone propionate, GLY= glycopyrronium, IND=indacaterol, MF=mometasone furoate, SAL=salmeterol, Tio=tiotropium.
There is no evidence to suggest that there is a change in odds of ACQ responders at 12 months for any individual treatments compared to MF/IND 160/150 µg (MD‐ICS/LABA). However, there is evidence to suggest that MF/GLY/IND 160/50/150 µg (MD Triple) increases the odds of ACQ responders at 12 months compared to MF/GLY/IND 80/50/150 µg (LD Triple) (OR 1.39 [95% CrI 1.05 to 1.84]) and MF/GLY/IND 160/50/150 µg (MD Triple) increases the odds of ACQ responders at 12 months compared to FP/SAL 500/50 µg (HD‐ICS/LABA) (OR 1.40 [95% CrI 1.08 to 1.82]).
The rank plots for individual treatments are presented in Figure 60, and the mean and median ranks are presented in Table 55. MF/GLY/IND 160/50/150 µg (MD Triple) has the highest probability of being the best treatment (median rank 1 [95% CrI 1 to 3]), but credible intervals for treatment ranks are very wide.
60.
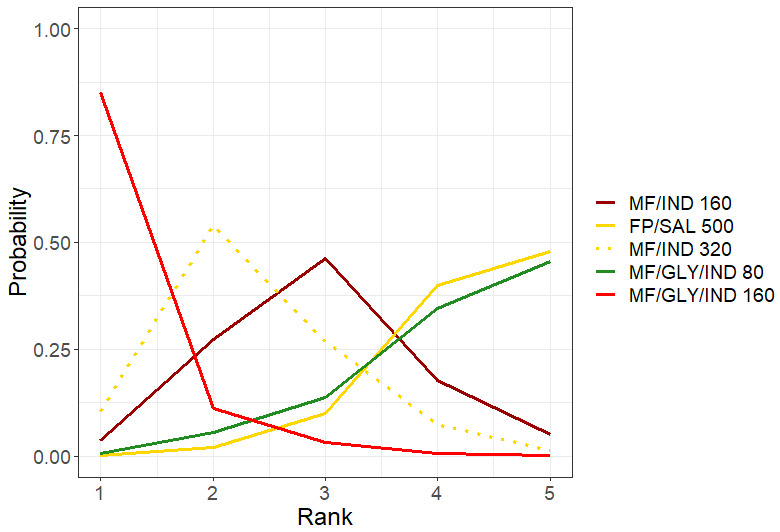
Rank plots for individual treatments for ACQ responders at 12 months (fixed effect model)
Line colors denote the treatment group. FP:fluticasone propionate, GLY: glycopyrronium, IND:indacaterol, MF:mometasone furoate, SAL:salmeterol.
37. Mean and median ranks for individual treatments for ACQ responders at 12 months sorted by mean rank (fixed‐effect model).
| Treatments | Mean Rank | Median Rank | 95% CrI |
| MF/GLY/IND 160 | 1.19 | 1 | (1.00, 3.00) |
| MF/IND 320 | 2.35 | 2 | (1.00, 4.00) |
| MF/IND 160 | 2.93 | 3 | (1.00, 5.00) |
| MF/GLY/IND 80 | 4.19 | 4 | (2.00, 5.00) |
| FP/SAL 500 | 4.33 | 4 | (3.00, 5.00) |
CrI=credible interval, FP=fluticasone propionate, GLY= glycopyrronium, IND=indacaterol, MF=mometasone furoate, SAL=salmeterol.
3.2 Serious adverse events (SAEs)
3.2.1 All‐cause SAEs
3.2.1.1 Grouped treatments
For this outcome, 13 trials (14,476 participants) comparing four treatment groups were included in the NMA (Figure 10). A summary of the studies included in the analysis is presented in Appendix 16.
3.2.1.1.1 Model selection and inconsistency checking
The Turner prior for adverse event outcomes comparing pharmacological interventions, i.e. a Log‐Normal (‐2.10, 1.582) prior distribution, was used for the between‐study heterogeneity (Turner 2015).
Model fit parameters for the fixed‐effect and random‐effects models are reported in Appendix 3. Both fixed‐effect and random‐effects models fit the data well. The between‐study heterogeneity was low. As the difference in DICs between the fixed‐effect and random‐effects models was less than 3, the simpler fixed‐effect model was chosen. Results for the fixed‐effect model are presented in Section 3.2.1.1.2.
A node‐splitting model was fit to assess inconsistency. The results of node‐splitting are presented in Table 56. There was no evidence to suggest inconsistency in the network.
38. Node‐splitting results for all‐cause SAEs for grouped treatments.
| Model | p | LORs (95% CrI) |
| HD‐ICS/LABA vs. MD‐ICS/LABA | ||
| Direct | 0.410 | ‐0.005 (‐0.364, 0.298) |
| Indirect | 0.388 (‐0.612, 1.359) |
|
| Network | 0.044 (‐0.232, 0.298) |
|
| MD Triple vs. MD‐ICS/LABA | ||
| Direct | 0.237 | 0.166 (‐0.258, 0.563) |
| Indirect | ‐0.409 (‐1.401, 0.485) |
|
| Network | 0.087 (‐0.250, 0.402) |
|
| HD Triple vs. MD‐ICS/LABA | ||
| Direct | 0.961 | 0.035 (‐0.502, 0.555) |
| Indirect | 0.012 (‐0.565, 0.543) |
|
| Network | 0.039 (‐0.293, 0.349) |
|
| MD Triple vs. HD‐ICS/LABA | ||
| Direct | 0.746 | 0.083 (‐0.424, 0.587) |
| Indirect | ‐0.038 (‐0.656, 0.625) |
|
| Network | 0.042 (‐0.276, 0.368) |
|
| HD Triple vs. HD‐ICS/LABA | ||
| Direct | 0.248 | ‐0.051 (‐0.379, 0.267) |
| Indirect | 0.511 (‐0.442, 1.523) |
|
| Network | ‐0.005 (‐0.282, 0.261) |
|
| HD Triple vs. MD Triple | ||
| Direct | 0.456 | 0.013 (‐0.390, 0.438) |
| Indirect | ‐0.340 (‐1.315, 0.547) |
|
| Network | ‐0.050 (‐0.381, 0.270) |
|
Negative LOR favours the second named treatment. CrI: credible interval; HD: high dose; ICS: inhaled corticosteroids; LABA: long‐acting beta‐2 agonist; LOR log odds ratio; MD: medium dose.
3.2.1.1.2 NMA results
The odds ratios of all‐cause SAEs are presented in Figure 61. The odds ratios of all‐cause SAEs comparing all treatment groups against each other are reported in Table 57. There is no evidence to suggest there is a change in odds of all‐cause SAEs for any of the treatment comparisons. An NMA summary of findings is presented in Table 14.
61.
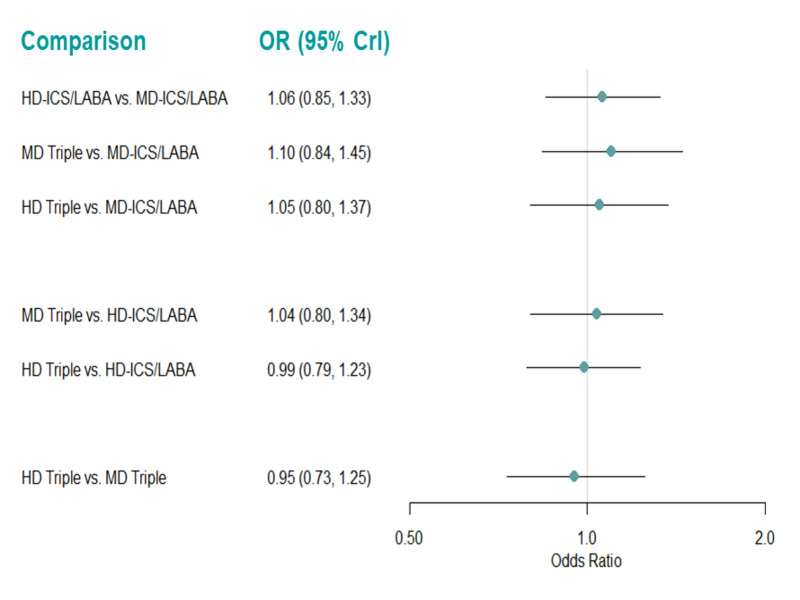
Forest plots of odds ratios for all‐cause SAEs for grouped treatments (fixed effect model).
Odds ratio less than one favors the first named treatment. CrI: credible interval, HD: high dose; ICS: inhaled corticosteroids; LABA: long‐acting beta‐2 agonist; MD: medium dose.
39. Odds ratios for all‐cause SAEs for grouped treatments (fixed‐effect model).
| Comparison | Odds Ratio (95% CrI) |
| HD‐ICS/LABA vs MD‐ICS/LABA | 1.063 (0.853, 1.329) |
| MD Triple vs. MD‐ICS/LABA | 1.102 (0.839, 1.446) |
| HD Triple vs MD‐ICS/LABA | 1.049 (0.803, 1.372) |
| MD Triple vs. HD‐ICS/LABA | 1.037 (0.799, 1.340) |
| HD Triple vs HD‐ICS/LABA | 0.986 (0.793, 1.227) |
| HD Triple vs MD Triple | 0.952 (0.727, 1.250) |
The second named treatment is the baseline intervention. Odds ratio less than one favours the treatment named first in the comparisons. CrI: credible interval; HD: high dose; ICS: inhaled corticosteroids; LABA: long‐acting beta‐2 agonist; MD: medium dose.
The rank plots for grouped treatments are presented in Figure 62, and the mean and median ranks are presented in Table 58. Treatment ranks are very uncertain, ‐ none of the treatments have over 50% probability of ranking in any of the four possible positions, and all treatments have the same, very wide, 95% CrIs.
62.
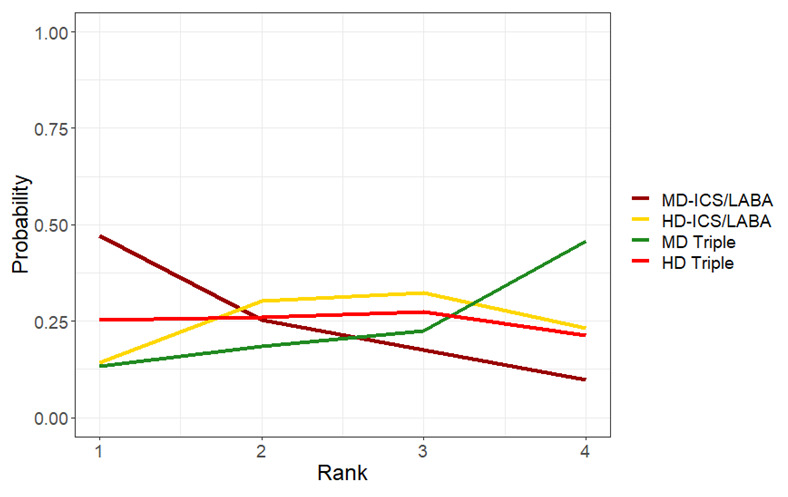
Rank plots for grouped treatments for all‐cause SAEs (fixed effect model)
HD: high dose; ICS: inhaled corticosteroids; LABA: long‐acting beta‐2 agonist; MD: medium dose.
40. Mean and median ranking for grouped treatments for all‐cause SAEs sorted by mean rank (fixed‐effect model).
| Treatments | Mean Rank | Median Rank | 95% CrI |
| MD‐ICS/LABA | 1.90 | 2 | (1.00, 4.00) |
| HD Triple | 2.45 | 2 | (1.00, 4.00) |
| HD‐ICS/LABA | 2.65 | 3 | (1.00, 4.00) |
| MD Triple | 3.01 | 3 | (1.00, 4.00) |
CrI: credible interval; HD: high dose; ICS: inhaled corticosteroids; LABA: long‐acting beta‐2 agonist; MD: medium dose.
3.2.1.1.3 Pairwise meta‐analysis
The evidence suggests there is no or little difference in all‐cause SAEs for any of the treatment comparisons [moderate to high certainty] (Analysis 5.1, Table 15). There was no difference in the results between fixed‐ and random‐effects analyses.
5.1. Analysis.
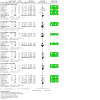
Comparison 5: Serious adverse events, adverse events, and dropouts due to adverse event, Outcome 1: All cause SAEs
3.2.1.2 Individual treatments
For this outcome, 10 trials (11,936 participants) comparing 14 distinct treatments were included in the NMA (Figure 63). A summary of the studies included is presented in Appendix 17. Seven studies (Bodzenta‐Lukaszyk 2012, Cukier 2013, Kerstjens 2012a, Kerstjens 2012b, Peters 2008, Virchow 2019a, and Virchow 2019b) that were identified were excluded from this analysis as they were disconnected from the main network shown in Figure 63.
63.
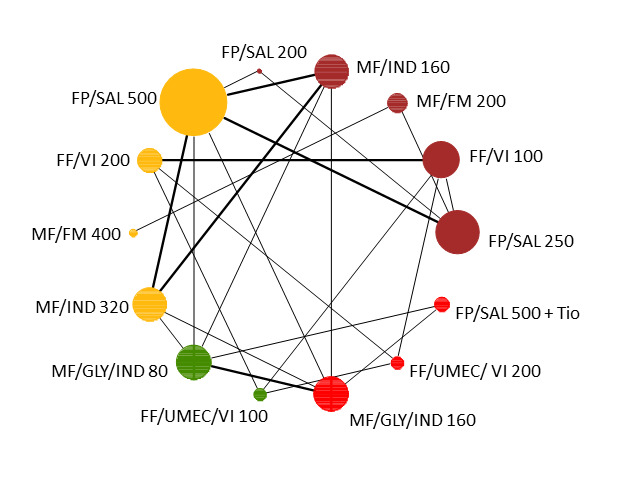
Network diagram for all‐cause SAEs for individual interventions.
Node colors denote the treatment group. The size of the nodes and the thickness of edges depend on the number of people randomised and the number of trials conducted. FF:fluticasone furoate, FM:formoterol, FP:fluticasone propionate, GLY: glycopyrronium, IND:indacaterol, MF:mometasone furoate, SAL:salmeterol, Tio:tiotropium, UMEC: umeclidinium, VI:vilanterol.
3.2.1.2.1 Model selection and inconsistency checking
The Turner prior for adverse event outcomes comparing pharmacological interventions, i.e. a Log‐Normal (‐2.10, 1.582) prior distribution, was used for the between‐study heterogeneity (Turner 2015).
Model fit parameters for the fixed‐effect and random‐effects models are reported in Appendix 3. Both fixed‐effect and random‐effects models fit the data well. The between‐study heterogeneity was low. As the difference in DICs between the fixed‐effect and random‐effects models was less than 3, the simpler fixed‐effect model was chosen. Results for the fixed‐effect model are presented in Section 3.2.1.2.2. There is no potential for inconsistency in this network as there is no independent, indirect evidence for any of the comparisons.
3.2.1.2.2 NMA results
The odds ratios of all‐cause SAEs, compared to FP/SAL 250/50 µg (MD‐ICS/LABA), are presented in Figure 64. The odds ratios of all‐cause AEs comparing all treatment groups against each other are reported in Table 59.
64.
Forest plot of odds ratios relative to FP/SAL 250 for all‐cause SAEs for individual treatments.
Odds ratio less than one favors the comparator treatment over FP/SAL 250. Crl:credible interval, FF:fluticasone furoate, FM:formoterol, FP:fluticasone propionate, GLY: glycopyrronium, IND:indacaterol, MF:mometasone furoate, SAL:salmeterol, Tio:tiotropium, UMEC: umeclidinium, VI:vilanterol.
41. Odds Ratios for all‐cause SAEs for individual treatments (fixed‐effect model).
| Comparison | Odds Ratio (95% CrI) |
| FF/VI 100 vs. FP/SAL 250 | 0.781 (0.184, 3.075) |
| MF/FM 200 vs. FP/SAL 250 | 0.694 (0.220, 2.042) |
| MF/IND 160 vs. FP/SAL 250 | 1.956 (0.934, 4.339) |
| FP/SAL 200 vs. FP/SAL 250 | 2.741 (0.897, 9.796) |
| FP/SAL 500 vs. FP/SAL 250 | 1.988 (1.052, 4.036) |
| FF/VI 200 vs. FP/SAL 250 | 0.581 (0.123, 2.567) |
| MF/FM 400 vs. FP/SAL 250 | 0.390 (0.034, 3.439) |
| MF/IND 320 vs. FP/SAL 250 | 2.480 (1.195, 5.452) |
| MF/GLY/IND 80 vs. FP/SAL 250 | 2.347 (1.109, 5.275) |
| FF/UMEC/VI 100 vs. FP/SAL 250 | 0.679 (0.144, 3.027) |
| MF/GLY/IND 160 vs. FP/SAL 250 | 2.391 (1.130, 5.357) |
| FF/UMEC/VI 200 vs. FP/SAL 250 | 0.613 (0.129, 2.729) |
| FP/SAL 500 +Tio vs. FP/SAL 250 | 2.827 (1.101, 7.467) |
| MF/FM 200 vs. FF/VI 100 | 0.887 (0.149, 5.342) |
| MF/IND 160 vs. FF/VI 100 | 2.525 (0.525, 13.046) |
| FP/SAL 200 vs. FF/VI 100 | 3.555 (0.598, 23.952) |
| FP/SAL 500 vs. FF/VI 100 | 2.571 (0.563, 12.702) |
| FF/VI 200 vs. FF/VI 100 | 0.746 (0.416, 1.314) |
| MF/FM 400 vs. FF/VI 100 | 0.499 (0.031, 6.756) |
| MF/IND 320 vs. FF/VI 100 | 3.198 (0.669, 16.385) |
| MF/GLY/IND 80 vs. FF/VI 100 | 3.032 (0.627, 15.679) |
| FF/UMEC/VI 100 vs. FF/VI 100 | 0.872 (0.487, 1.547) |
| MF/GLY/IND 160 vs. FF/VI 100 | 3.086 (0.639, 15.980) |
| FF/UMEC/VI 200 vs. FF/VI 100 | 0.787 (0.431, 1.413) |
| FP/SAL 500 +Tio vs. FF/VI 100 | 3.641 (0.684, 20.535) |
| MF/IND 160 vs. MF/FM 200 | 2.842 (0.758, 11.364) |
| FP/SAL 200 vs. MF/FM 200 | 4.000 (0.833, 21.872) |
| FP/SAL 500 vs. MF/FM 200 | 2.890 (0.816, 11.003) |
| FF/VI 200 vs. MF/FM 200 | 0.839 (0.127, 5.448) |
| MF/FM 400 vs. MF/FM 200 | 0.569 (0.065, 3.737) |
| MF/IND 320 vs. MF/FM 200 | 3.602 (0.966, 14.291) |
| MF/GLY/IND 80 vs. MF/FM 200 | 3.408 (0.907, 13.699) |
| FF/UMEC/VI 100 vs. MF/FM 200 | 0.982 (0.149, 6.399) |
| MF/GLY/IND 160 vs. MF/FM 200 | 3.471 (0.924, 13.957) |
| FF/UMEC/VI 200 vs. MF/FM 200 | 0.885 (0.133, 5.777) |
| FP/SAL 500 +Tio vs. MF/FM 200 | 4.097 (0.979, 18.243) |
| FP/SAL 200 vs. MD/IND 160 | 1.396 (0.451, 4.942) |
| FP/SAL 500 vs. MD/IND 160 | 1.018 (0.701, 1.479) |
| FF/VI 200 vs. MD/IND 160 | 0.294 (0.052, 1.566) |
| MF/FM 400 vs. MD/IND 160 | 0.197 (0.016, 2.001) |
| MF/IND 320 vs. MD/IND 160 | 1.267 (0.888, 1.814) |
| MF/GLY/IND 80 vs. MD/IND 160 | 1.199 (0.807, 1.787) |
| FF/UMEC/VI 100 vs. MD/IND 160 | 0.344 (0.061, 1.836) |
| MF/GLY/IND 160 vs. MD/IND 160 | 1.221 (0.822, 1.819) |
| FF/UMEC/VI 200 vs. MD/IND 160 | 0.310 (0.055, 1.663) |
| FP/SAL 500 +Tio vs. MD/IND 160 | 1.442 (0.720, 2.838) |
| FP/SAL 500 vs. FP/SAL 200 | 0.731 (0.218, 2.117) |
| FF/VI 200 vs. FP/SAL 200 | 0.209 (0.029, 1.365) |
| MF/FM 400 vs. FP/SAL 200 | 0.140 (0.009, 1.649) |
| MF/IND 320 vs. FP/SAL 200 | 0.909 (0.258, 2.794) |
| MF/GLY/IND 80 vs. FP/SAL 200 | 0.860 (0.241, 2.685) |
| FF/UMEC/VI 100 vs. FP/SAL 200 | 0.244 (0.033, 1.601) |
| MF/GLY/IND 160 vs. FP/SAL 200 | 0.875 (0.245, 2.734) |
| FF/UMEC/VI 200 vs. FP/SAL 200 | 0.220 (0.030, 1.450) |
| FP/SAL 500 +Tio vs. FP/SAL 200 | 1.028 (0.258, 3.683 |
| FF/VI 200 vs. FP/SAL 500 | 0.289 (0.053, 1.473) |
| MF/FM 400 vs. FP/SAL 500 | 0.194 (0.016, 1.894) |
| MF/IND 320 vs. FP/SAL 500 | 1.244 (0.874, 1.776) |
| MF/GLY/IND 80 vs. FP/SAL 500 | 1.177 (0.795, 1.750) |
| FF/UMEC/VI 100 vs. FP/SAL 500 | 0.338 (0.062, 1.723) |
| MF/GLY/IND 160 vs. FP/SAL 500 | 1.199 (0.810, 1.781) |
| FF/UMEC/VI 200 vs. FP/SAL 500 | 0.305 (0.056, 1.568) |
| FP/SAL 500 +Tio vs. FP/SAL 500 | 1.415 (0.710, 2.783) |
| MF/FM 400 vs. FF/VI 200 | 0.668 (0.040, 9.683) |
| MF/IND 320 vs. FF/VI 200 | 4.305 (0.813, 24.379) |
| MF/GLY/IND 80 vs. FF/VI 200 | 4.077 (0.765, 23.295) |
| FF/UMEC/VI 100 vs. FF/VI 200 | 1.171 (0.633, 2.166) |
| MF/GLY/IND 160 vs. FF/VI 200 | 4.147 (0.778, 23.671) |
| FF/UMEC/VI 200 vs. FF/VI 200 | 1.056 (0.562, 1.976) |
| FP/SAL 500 +Tio vs. FF/VI 200 | 4.897 (0.838, 30.319) |
| MF/IND 320 vs. MF/FM 400 | 6.418 (0.637, 80.971)* |
| MF/GLY/IND 80 vs. MF/FM 400 | 6.085 (0.598, 77.060)* |
| FF/UMEC/VI 100 vs. MF/FM 400 | 1.750 (0.121, 29.613) |
| MF/GLY/IND 160 vs. MF/FM 400 | 6.190 (0.610, 78.360)* |
| FF/UMEC/VI 200 vs. MF/FM 400 | 1.578 (0.108, 26.831) |
| FP/SAL 500 +Tio vs. MF/FM 400 | 7.299 (0.674, 98.076)* |
| MF/GLY/IND 80 vs. MF/IND 320 | 0.947 (0.646, 1.384) |
| FF/UMEC/VI 100 vs. MF/IND 320 | 0.272 (0.048, 1.443) |
| MF/GLY/IND 160 vs. MF/IND 320 | 0.964 (0.660, 1.408) |
| FF/UMEC/VI 200 vs. MF/IND 320 | 0.245 (0.043, 1.306) |
| FP/SAL 500 +Tio vs. MF/IND 320 | 1.138 (0.574, 2.214) |
| FF/UMEC/VI 100 vs. MF/GLY/IND 80 | 0.287 (0.050, 1.534) |
| MF/GLY/IND 160 vs. MF/GLY/IND 80 | 1.018 (0.710, 1.461) |
| FF/UMEC/VI 200 vs. MF/GLY/IND 80 | 0.259 (0.045, 1.391) |
| FP/SAL 500 +Tio vs. MF/GLY/IND 80 | 1.203 (0.644, 2.194) |
| MF/GLY/IND 160 vs. FF/UMEC/VI 100 | 3.544 (0.663, 20.285) |
| FF/UMEC/VI 200 vs. FF/UMEC/VI 100 | 0.902 (0.487, 1.662) |
| FP/SAL 500 +Tio vs. FF/UMEC/VI 100 | 4.186 (0.714, 25.990) |
| FF/UMEC/VI 200 vs. MF/GLY/IND 160 | 0.254 (0.044, 1.368) |
| FP/SAL 500 +Tio vs. MF/GLY/IND 160 | 1.182 (0.633, 2.154) |
| FP/SAL 500 +Tio vs. FF/UMEC/VI 200 | 0.215 (0.035, 1.268) |
The second named treatment is the baseline intervention. Odds ratio less than one favours the treatment named first in the comparisons. Treatment comparisons in bold are do not include the “null” effect. *Hazard ratios are extremely uncertain due to network sparsity and should be treated with caution. Crl=credible interval, FF=fluticasone furoate, FM=formoterol, FP=fluticasone propionate, GLY= glycopyrronium, IND=indacaterol, MF=mometasone furoate, SAL=salmeterol, Tio=tiotropium, UMEC= umeclidinium, VI=vilanterol.
FP/SAL 500/50 µg (HD‐ICS/LABA), MF/IND 320/150 µg (HD‐ICS/LABA), MF/GLY/IND 80/50/150 µg (LD Triple), MF/GLY/IND 160/50/150 µg (MD Triple), and FP/SAL 500/50 µg + Tio 5 µg (HD Triple) increase the odds of all‐cause SAEs compared to FP/SAL 250/50 µg (MD‐ICS/LABA). There is a lot of uncertainty in the estimates of odds ratios, and many of the comparisons have wide credible intervals.
The rank plots for individual treatments are presented in Figure 65, and the mean and median ranks are presented in Table 60. Although MF/FM 400/10 µg (HD‐ICS/LABA) has the highest probability of being the best treatment, the probability that it is the best treatment is only a little over 50%. Overall, treatment ranks are very uncertain, and all the other treatments have under 50% probability for any of the 14 other possible ranks.
65.
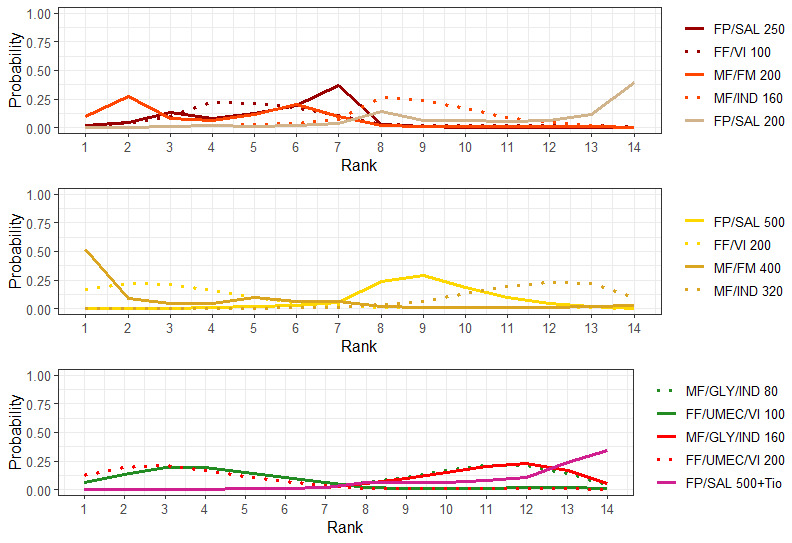
Rank plots for individual treatments for all‐cause SAEs (fixed effect model).
Line colors denote the treatment group. FF:fluticasone furoate, FM:formoterol, FP:fluticasone propionate, GLY: glycopyrronium, IND:indacaterol, MF:mometasone furoate, SAL:salmeterol, Tio:tiotropium, UMEC: umeclidinium, VI:vilanterol.
42. Mean and median ranking for individual treatments for all‐cause SAEs sorted by mean rank (fixed‐effect model).
| Treatments | Mean Rank | Median Rank | 95% CrI |
| MF/FM 400 | 3.32 | 1 | (1.00, 14.00) |
| FF/VI 200 | 3.54 | 3 | (1.00, 11.00) |
| FF/UMEC/VI 200 | 3.91 | 3 | (1.00, 12.00) |
| MF/FM 200 | 4.33 | 4 | (1.00, 11.00) |
| FF/UMEC/VI 100 | 4.63 | 4 | (1.00, 13.00) |
| FP/SAL 250 | 5.53 | 6 | (2.00, 8.00) |
| FF/VI 100 | 5.54 | 5 | (2.00, 13.00) |
| MF/IND 160 | 8.77 | 9 | (4.00, 12.00) |
| FP/SAL 500 | 8.99 | 9 | (5.00, 12.00) |
| MF/GLY/IND 80 | 10.77 | 11 | (6.00, 14.00) |
| MF/GLY/IND 160 | 10.97 | 11 | (6.00, 14.00) |
| FP/SAL 200 | 11.26 | 13 | (4.00, 14.00) |
| MF/IND 320 | 11.45 | 12 | (7.00, 14.00) |
| FP/SAL 500 + Tio | 11.99 | 13 | (6.00, 14.00) |
Crl=credible interval, FF=fluticasone furoate, FM=formoterol, FP=fluticasone propionate, GLY= glycopyrronium, IND=indacaterol, MF=mometasone furoate, SAL=salmeterol, Tio=tiotropium, UMEC= umeclidinium, VI=vilanterol.
3.2.2 Asthma‐related SAEs
3.2.2.1 Grouped treatments
For this outcome, 11 trials (13,209 participants) comparing 4 treatment groups were included in the NMA (Figure 11). A summary of the studies included in the analysis is presented in Appendix 18.
3.2.2.1.1 Model selection and inconsistency checking
The Turner prior for adverse event outcomes comparing pharmacological interventions, i.e. a Log‐Normal (‐2.10, 1.582) prior distribution, was used for the between‐study heterogeneity (Turner 2015).
Model fit parameters for the fixed‐effect and random‐effects models are reported in Appendix 3. Both fixed‐effect and random‐effects models fit the data well. The between‐study heterogeneity was low. As the difference in DICs between the fixed‐effect and random‐effects models was less than 3, the simpler fixed‐effect model was chosen. Results for the fixed‐effect model are presented in Section 3.2.1.1.2.
A node‐splitting model was fit to assess inconsistency. The results of node‐splitting are presented in Table 61. There was no evidence to suggest inconsistency in the network.
43. Node‐splitting results for asthma‐related SAEs for grouped treatments.
| Model | p |
LOR (95% CrI) |
| HD‐ICS/LABA vs. MD‐ICS/LABA | ||
| Direct | 0.825 | 0.296 (‐0.280, 0.894) |
| Indirect | 0.109 (‐1.596, 1.815) |
|
| Network | 0.259 (‐0.252, 0.822) |
|
| MD Triple vs. MD‐ICS/LABA | ||
| Direct | 0.442 | 0.410 (‐0.266, 1.093) |
| Indirect | 1.161 (‐0.741, 3.063) |
|
| Network | 0.542 (‐0.029, 1.132) |
|
| HD Triple vs. MD‐ICS/LABA | ||
| Direct | 0.410 | ‐0.185 (‐1.060, 0.660) |
| Indirect | 0.328 (‐0.628, 1.251) |
|
| Network | 0.053 (‐0.531, 0.641) |
|
| MD Triple vs. HD‐ICS/LABA | ||
| Direct | 0.876 | 0.279 (‐0.471, 1.017) |
| Indirect | 0.386 (‐0.794, 1.545) |
|
| Network | 0.284 (‐0.275, 0.840) |
|
| HD Triple vs. HD‐ICS/LABA | ||
| Direct | 0.530 | ‐0.161 (‐0.652, 0.296) |
| Indirect | ‐0.804 (‐2.726, 1.179) |
|
| Network | ‐0.212 (‐0.655, 0.216) |
|
| HD Triple vs. MD Triple | ||
| Direct | 0.827 | ‐0.580 (‐1.374, 0.104) |
| Indirect | ‐0.391 (‐2.089, 1.219) |
|
| Network | ‐0.493 (‐1.092, 0.081) |
|
Negative LOR favours the second named treatment. CrI: credible interval; HD: high dose; ICS: inhaled corticosteroids; LABA: long‐acting beta‐2 agonist; LOR log odds ratio; MD: medium dose.
3.2.2.1.2 NMA results
The odds ratios of asthma‐related SAEs are presented in Figure 66. The odds ratios of asthma‐related SAEs comparing all treatment groups against each other are reported in Table 62.
66.
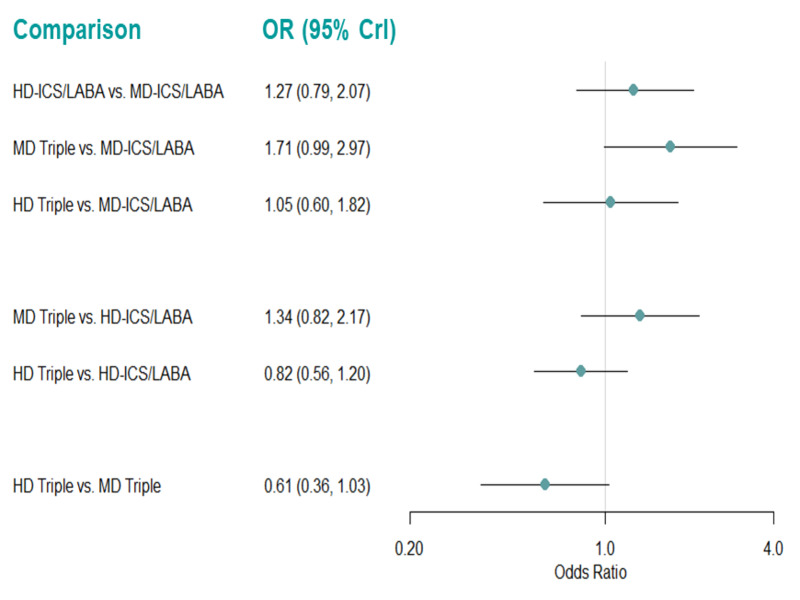
Forest plots of odds ratios relative for asthma‐related SAEs for grouped treatments (fixed effect model).
Odds ratio (OR) less than one favors the first named treatment. Crl: credible interval, HD: high dose; ICS: inhaled corticosteroids; LABA: long‐acting beta‐2 agonist; MD: medium dose.
44. Odds ratio for asthma‐related SAEs for grouped treatments (fixed‐effect model).
| Comparison | Odds Ratio (95% CrI) |
| HD‐ICS/LABA vs MD‐ICS/LABA | 1.275 (0.794, 2.073) |
| MD Triple vs. MD‐ICS/LABA | 1.711 (0.991, 2.969) |
| HD Triple vs MD‐ICS/LABA | 1.047 (0.604, 1.824) |
| MD Triple vs. HD‐ICS/LABA | 1.342 (0.819, 2.172) |
| HD Triple vs HD‐ICS/LABA | 0.821 (0.556, 1.203) |
| HD Triple vs MD Triple | 0.612 (0.363, 1.034) |
The second named treatment is the baseline intervention. Odds ratio less than one favours the treatment named first in the comparisons. CrI: credible interval; HD: high dose; ICS: inhaled corticosteroids; LABA: long‐acting beta‐2 agonist; MD: medium dose.
There is insufficient evidence to suggest a difference in odds of asthma‐related SAEs for any treatment comparisons. An NMA summary of findings is presented in Table 16.
The rank plots for grouped treatments are presented in Figure 67, and the mean and median ranks are presented in Table 63. MD‐ICS/LABA ranks higher than the other grouped treatments (median rank 1 [95% CrI 1 to 3] and MD Triple has a high probability of being the worst group for this outcome (median rank 4 [95% CrI 2 to 4]).
67.
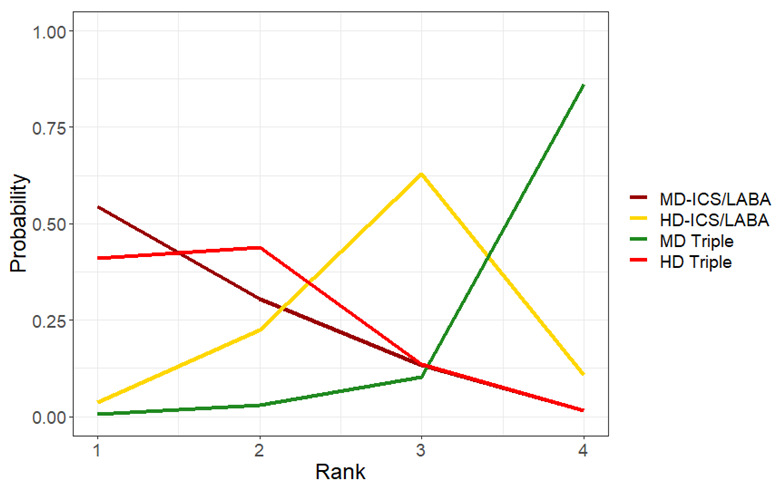
Rank plots for grouped treatments for asthma‐related SAEs (fixed effect model)
HD: high dose; ICS: inhaled corticosteroids; LABA: long‐acting beta‐2 agonist; MD: medium dose.
45. Mean and median ranking for grouped treatments for asthma‐related SAEs sorted by mean rank (fixed‐effect model).
| Treatments | Mean Rank | Median | 95% CrI |
| MD‐ICS/LABA | 1.62 | 1 | (1.00, 3.00) |
| HD Triple | 1.75 | 2 | (1.00, 3.00) |
| HD‐ICS/LABA | 2.81 | 3 | (1.00, 4.00) |
| MD Triple | 3.82 | 4 | (2.00, 4.00) |
CrI: credible interval; HD: high dose; ICS: inhaled corticosteroids; LABA: long‐acting beta‐2 agonist; MD: medium dose.
3.2.2.1.3 Pairwise meta‐analysis
The evidence suggests there is no or little difference in asthma‐related SAEs for any of the treatment comparisons [moderate to high certainty] (Analysis 5.2, Table 15). There was no difference in the results between fixed‐effect and random‐effects models.
5.2. Analysis.
Comparison 5: Serious adverse events, adverse events, and dropouts due to adverse event, Outcome 2: Asthma‐related SAEs
3.2.2.2 Individual treatments
For this outcome, 9 trials (11,246 participants) comparing 14 distinct treatments were included in the NMA (Figure 68). A summary of the studies included is presented in Appendix 19. Four studies (Kerstjens 2012a, Kerstjens 2012b, Virchow 2019a, and Virchow 2019b) that were identified were excluded from this analysis as they were disconnected from the main network shown in Figure 68.
68.
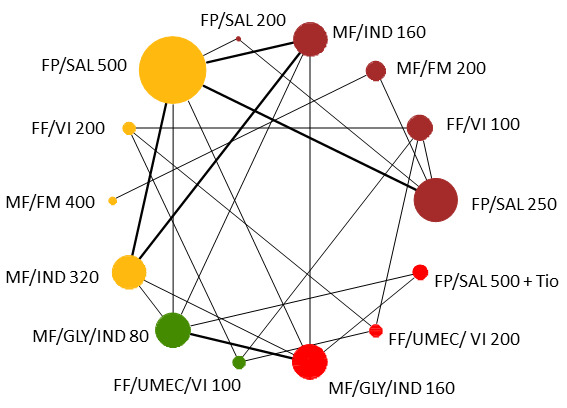
Network diagram for asthma‐related SAEs for individual interventions.
Node colors denote the treatment group. The size of the nodes and the thickness of edges depend on the number of people randomised and the number of trials conducted. FF:fluticasone furoate, FM:formoterol, FP:fluticasone propionate, GLY: glycopyrronium, IND:indacaterol, MF:mometasone furoate, SAL:salmeterol, Tio:tiotropium, UMEC: umeclidinium, VI:vilanterol.
As the data are sparse, with few studies per comparison which have very few events in each treatment arm, the results for this analysis are very uncertain.
One of the arms (for the treatment MF/FM 200) in Weinstein 2010 reported no events. The second arm (for the treatment MF/FM 400) for this study reported only one event. The zero cell caused problems with model convergence, attributable to the fact that this is the only study that contributes MF/FM 400 to the network. We added a continuity correction of 0.5 to the zero count events to help improve model convergence due to the sparsity of the evidence in this study. When fitting this model in OpenBUGS (version 3.2.3), a less‐vague prior of Normal (0, 0.01) was also used for the relative treatment effects to make the model more stable.
3.2.2.2.1 Model selection and inconsistency checking
The Turner prior for adverse event outcomes comparing pharmacological interventions, i.e. a Log‐Normal (‐2.10, 1.582) prior distribution, was used for the between‐study heterogeneity (Turner 2015).
Model fit parameters for the fixed‐effect and random‐effects models are reported in Appendix 3. Both fixed‐effect and random‐effects models fit the data well. The between‐study heterogeneity was low, with a wide credible interval. As the difference in DICs between the fixed‐effect and random‐effects models was less than 3, the simpler fixed‐effect model was chosen. Results for the fixed‐effect model are presented in Section 3.2.2.2.2.
There is no potential for inconsistency in this network as there is no independent, indirect evidence for any of the comparisons.
3.2.2.2.2 NMA results
The odds ratios of asthma‐related SAEs, compared to MF/IND160/150 µg (MD‐ICS/LABA), are presented in Figure 69. The odds ratios of asthma‐related SAEs comparing all treatment groups against each other are reported in Table 64. There is evidence to suggest that MF/IND 320/150 µg (HD‐ICS/LABA) and MF/GLY/IND 80/50/150 µg (LD Triple) increase the odds of asthma‐related SAEs compared to FP/SAL 250/50 µg (MD‐ICS/LABA) (OR 4.1 [95% CrI 1.003 to 21.4] and 5.0 [1.2 to 26.3] respectively).
69.
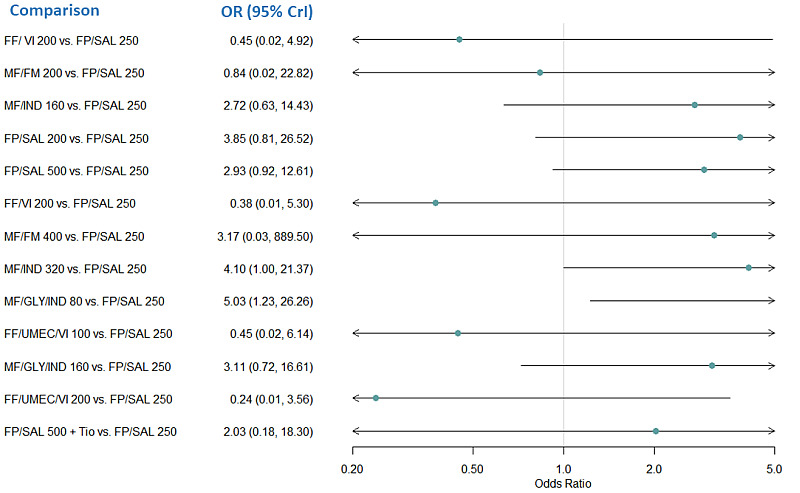
Forest plot of odds ratios for asthma‐related SAEs relative to FP/SAL 250 for individual treatments.
Odds ratio less than one favors the comparator treatment over FP/SAL 250. FF:fluticasone furoate, FM:formoterol, FP:fluticasone propionate, GLY: glycopyrronium, IND:indacaterol, MF:mometasone furoate, SAL:salmeterol, Tio:tiotropium, UMEC: umeclidinium, VI:vilanterol.
46. Odds ratio for asthma‐related SAEs for individual treatments (fixed‐effect model).
| Comparison | Odds Ratio (95% CrI) |
| FF/ VI 200 vs. FP/SAL 250 | 0.451 (0.019, 4.920) |
| MF/FM 200 vs. FP/SAL 250 | 0.836 (0.024, 22.820) |
| MF/IND 160 vs. FP/SAL 250 | 2.724 (0.634, 14.430) |
| FP/SAL 200 vs. FP/SAL 250 | 3.846 (0.808, 26.520) |
| FP/SAL 500 vs. FP/SAL 250 | 2.926 (0.924, 12.610) |
| FF/VI 200 vs. FP/SAL 250 | 0.376 (0.014, 5.295) |
| MF/FM 400 vs. FP/SAL 250 | 3.166 (0.028, 889.500) |
| MF/IND 320 vs. FP/SAL 250 | 4.102 (1.003, 21.370) |
| MF/GLY/IND 80 vs. FP/SAL 250 | 5.028 (1.228, 26.260) |
| FF/UMEC/VI 100 vs. FP/SAL 250 | 0.446 (0.017, 6.139) |
| MF/GLY/IND 160 vs. FP/SAL 250 | 3.105 (0.722, 16.610) |
| FF/UMEC/VI 200 vs. FP/SAL 250 | 0.239 (0.008, 3.558) |
| FP/SAL 500 + Tio vs. FP/SAL 250 | 2.025 (0.182, 18.300) |
| MF/FM 200 vs. FF/VI 100 | 1.932 (0.029, 169.300)* |
| MF/IND 160 vs. FF/VI 100 | 6.296 (0.358, 218.700)* |
| FP/SAL 200 vs. FF/VI 100 | 8.997 (0.478, 337.100)* |
| FP/SAL 500 vs. FF/VI 100 | 6.779 (0.440, 210.900)* |
| FF/VI 200 vs. FF/VI 100 | 0.852 (0.265, 2.621) |
| MF/FM 400 vs. FF/VI 100 | 7.663 (0.036, 4,274.000)* |
| MF/IND 320 vs. FF/VI 100 | 9.489 (0.544, 319.600)* |
| MF/GLY/IND 80 vs. FF/VI 100 | 11.630 (0.668, 391.800)* |
| FF/UMEC/VI 100 vs. FF/VI 100 | 1.005 (0.336, 2.986) |
| MF/GLY/IND 160 vs. FF/VI 100 | 7.182 (0.405, 247.500)* |
| FF/UMEC/VI 200 vs. FF/VI 100 | 0.548 (0.137, 1.868) |
| FP/SAL 500 + Tio vs. FF/VI 100 | 4.602 (0.150, 211.300)* |
| MF/IND 160 vs. MF/FM 200 | 3.361 (0.089, 152.900)* |
| FP/SAL 200 vs. MF/FM 200 | 4.809 (0.120, 246.900)* |
| FP/SAL 500 vs. MF/FM 200 | 3.637 (0.106, 153.300)* |
| FF/VI 200 vs. MF/FM 200 | 0.438 (0.004, 33.710) |
| MF/FM 400 vs. MF/FM 200 | 3.487 (0.141, 500.800)* |
| MF/IND 320 vs. MF/FM 200 | 5.069 (0.136, 227.900)* |
| MF/GLY/IND 80 vs. MF/FM 200 | 6.216 (0.168, 280.300)* |
| FF/UMEC/VI 100 vs. MF/FM 200 | 0.520 (0.005, 39.290) |
| MF/GLY/IND 160 vs. MF/FM 200 | 3.813 (0.101, 174.100)* |
| FF/UMEC/VI 200 vs. MF/FM 200 | 0.278 (0.003, 22.100) |
| FP/SAL 500 + Tio vs. MF/FM 200 | 2.418 (0.042, 145.300)* |
| FP/SAL 200 vs. MF/IND 160 | 1.404 (0.278, 8.683) |
| FP/SAL 500 vs. MF/IND 160 | 1.086 (0.452, 2.624) |
| FF/VI 200 vs. MF/IND 160 | 0.134 (0.003, 2.880) |
| MF/FM 400 vs. MF/IND 160 | 1.141 (0.008, 395.800)* |
| MF/IND 320 vs. MF/IND 160 | 1.502 (0.673, 3.506) |
| MF/GLY/IND 80 vs. MF/IND 160 | 1.837 (0.825, 4.300) |
| FF/UMEC/VI 100 vs. MF/IND 160 | 0.158 (0.004, 3.366) |
| MF/GLY/IND 160 vs. MF/IND 160 | 1.135 (0.466, 2.821) |
| FF/UMEC/VI 200 vs. MF/IND 160 | 0.085 (0.002, 1.946) |
| FP/SAL 500 + Tio vs. MF/IND 160 | 0.745 (0.089, 4.096) |
| FP/SAL 500 vs. FP/SAL 200 | 0.782 (0.154, 3.019) |
| FF/VI 200 vs. FP/SAL 200 | 0.093 (0.002, 2.142) |
| MF/FM 400 vs. FP/SAL 200 | 0.797 (0.005, 285.000)* |
| MF/IND 320 vs. FP/SAL 200 | 1.076 (0.181, 5.240) |
| MF/GLY/IND 80 vs. FP/SAL 200 | 1.313 (0.222, 6.467) |
| FF/UMEC/VI 100 vs. FP/SAL 200 | 0.111 (0.003, 2.519) |
| MF/GLY/IND 160 vs. FP/SAL 200 | 0.811 (0.132, 4.132) |
| FF/UMEC/VI 200 vs. FP/SAL 200 | 0.059 (0.001, 1.446) |
| FP/SAL 500 + Tio vs. FP/SAL 200 | 0.515 (0.038, 4.730) |
| FF/VI 200 vs. FP/SAL 500 | 0.123 (0.003, 2.364) |
| MF/FM 400 vs. FP/SAL 500 | 1.046 (0.007, 339.600)* |
| MF/IND 320 vs. FP/SAL 500 | 1.384 (0.633, 3.121) |
| MF/GLY/IND 80 vs. FP/SAL 500 | 1.690 (0.773, 3.868) |
| FF/UMEC/VI 100 vs. FP/SAL 500 | 0.146 (0.004, 2.754) |
| MF/GLY/IND 160 vs. FP/SAL 500 | 1.046 (0.437, 2.538) |
| FF/UMEC/VI 200 vs. FP/SAL 500 | 0.079 (0.002, 1.591) |
| FP/SAL 500 + Tio vs. FP/SAL 500 | 0.688 (0.081, 3.717) |
| MF/FM 400 vs. FF/VI 200 | 9.133 (0.039, 5,439.000)* |
| MF/IND 320 vs. FF/VI 200 | 11.330 (0.526, 441.100)* |
| MF/GLY/IND 80 vs. FF/VI 200 | 13.890 (0.642, 542.400)* |
| FF/UMEC/VI 100 vs. FF/VI 200 | 1.181 (0.381, 3.783) |
| MF/GLY/IND 160 vs. FF/VI 200 | 8.546 (0.392, 338.100)* |
| FF/UMEC/VI 200 vs. FF/VI 200 | 0.645 (0.158, 2.346) |
| FP/SAL 500 + Tio vs. FF/VI 200 | 5.441 (0.148, 286.500)* |
| MF/IND 320 vs. MF/FM 400 | 1.324 (0.004, 199.100)* |
| MF/GLY/IND 80 vs. MF/FM 400 | 1.622 (0.005, 241.900)* |
| FF/UMEC/VI 100 vs. MF/FM 400 | 0.130 (0.0002, 29.950) |
| MF/GLY/IND 160 vs. MF/FM 400 | 1.002 (0.003, 152.000)* |
| FF/UMEC/VI 200 vs. MF/FM 400 | 0.069 (0.0001, 16.970) |
| FP/SAL 500 + Tio vs. MF/FM 400 | 0.617 (0.001, 121.300)* |
| MF/GLY/IND 80 vs. MF/IND 320 | 1.223 (0.587, 2.576) |
| FF/UMEC/VI 100 vs. MF/IND 320 | 0.105 (0.003, 2.221) |
| MF/GLY/IND 160 vs. MF/IND 320 | 0.756 (0.328, 1.701) |
| FF/UMEC/VI 200 vs. MF/IND 320 | 0.056 (0.001, 1.273) |
| FP/SAL 500 + Tio vs. MF/IND 320 | 0.495 (0.060, 2.606) |
| FF/UMEC/VI 100 vs. MF/GLY/IND 80 | 0.085 (0.002, 1.815) |
| MF/GLY/IND 160 vs. MF/GLY/IND 80 | 0.620 (0.289, 1.274) |
| FF/UMEC/VI 200 vs. MF/GLY/IND 80 | 0.046 (0.001, 1.040) |
| FP/SAL 500 + Tio vs. MF/GLY/IND 80 | 0.409 (0.053, 1.874) |
| MF/GLY/IND 160 vs. FF/UMEC/VI 100 | 7.224 (0.334, 279.900)* |
| FF/UMEC/VI 200 vs. FF/UMEC/VI 100 | 0.546 (0.138, 1.869) |
| FP/SAL 500 + Tio vs. FF/UMEC/VI 100 | 4.605 (0.127, 240.700)* |
| FF/UMEC/VI 200 vs. MF/GLY/IND 160 | 0.075 (0.002, 1.725) |
| FP/SAL 500 + Tio vs. MF/GLY/IND 160 | 0.660 (0.084, 3.172) |
| FP/SAL 500 + Tio vs. FF/UMEC/VI 200 | 8.563 (0.221, 485.500)* |
The second named treatment is the baseline intervention. Odds ratio less than one favours the treatment named first in the comparisons. Treatment comparisons in bold do not include the “null” effect.*HRs are extremely uncertain due to network sparsity and should be interpreted with caution. Crl: credible interval, FF: fluticasone furoate, FM: formoterol, FP: fluticasone propionate, GLY: glycopyrronium, IND: indacaterol, MF: mometasone furoate, SAL: salmeterol, Tio: tiotropium, UMEC: umeclidinium, VI: vilanterol.
The impact of the zero‐cell in Weinstein 2010 identified in Section 3.2.2.2 can be observed in Figure 69, where the credible interval estimated for MF/FM 400/10 µg is wide enough that the OR could be considered not estimable. The upper credible limit for most of the other comparisons was also quite large.
The rank plots for individual treatments are presented in Figure 70, and the mean and median ranks are presented in Table 65. It is very unclear which intervention is the best, as treatment ranks are very uncertain, none of the treatments have over 50% probability for any of the 14 possible ranks. The uncertainty in ranks is further highlighted by the large overlap in their credible intervals.
70.
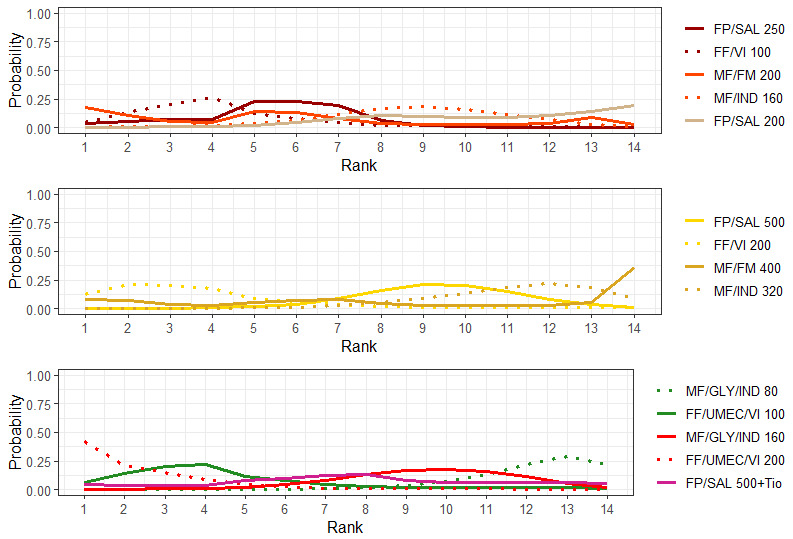
Rank plots for individual treatments for asthma‐related SAEs (fixed effect model)
Line colors denote the treatment group. FF:fluticasone furoate, FM:formoterol, FP:fluticasone propionate, GLY: glycopyrronium, IND:indacaterol, MF:mometasone furoate, SAL:salmeterol, Tio:tiotropium, UMEC: umeclidinium, VI:vilanterol.
47. Mean and median ranking for individual treatments for asthma‐related SAEs sorted by mean rank (fixed‐effect model).
| Treatments | Mean Rank | Median Rank | 95% CrI |
| FF /UMEC/VI 200 | 2.59 | 2.0 | (1.0, 10.0) |
| FF/VI 200 | 3.95 | 3.0 | (1.0, 12.0) |
| FF/VI 100 | 4.45 | 4.0 | (1.0, 12.0) |
| FF/UMEC/VI 100 | 4.58 | 4.0 | (1.0, 13.0) |
| FP/SAL 250 | 5.48 | 6.0 | (1.0, 9.0) |
| MF/FM 200 | 5.83 | 5.0 | (1.0, 14.0) |
| FP/SAL 500 + Tio | 7.80 | 8.0 | (1.0, 14.0) |
| MF/IND 160 | 8.77 | 9.0 | (3.0, 13.0) |
| MF/FM 400 | 9.06 | 10.0 | (1.0, 14.0) |
| FP/SAL 500 | 9.28 | 9.0 | (5.0, 13.0) |
| MF/GLY/IND 160 | 9.47 | 10.0 | (4.0, 13.0) |
| FP/SAL 200 | 10.46 | 11.0 | (4.0, 14.0) |
| MF/IND 320 | 11.11 | 11.0 | (6.0, 14.0) |
| MF/GLY/IND 80 | 12.17 | 13.0 | (8.0, 14.0) |
Crl: credible interval, FF: fluticasone furoate, FM: formoterol, FP: fluticasone propionate, GLY: glycopyrronium, IND: indacaterol, MF: mometasone furoate, SAL: salmeterol, Tio: tiotropium, UMEC: umeclidinium, VI: vilanterol.
3.3 Adverse events (AEs)
3.3.1 All‐cause AEs
3.3.1.1 Grouped treatments
For this outcome, 12 trials (12,915 participants) comparing 4 treatment groups were included in the NMA (Figure 12). A summary of the studies included in the analysis is presented in Appendix 20.
3.3.1.1.1 Model selection and inconsistency checking
The Turner prior for adverse event outcomes comparing pharmacological interventions, i.e. a Log‐Normal (‐2.10, 1.582) prior distribution, was used for the between‐study heterogeneity (Turner 2015).
Model fit parameters for the fixed‐effect and random‐effects models are reported in Appendix 3. Both fixed‐effect and random‐effects models fit the data well. The between‐study heterogeneity was low. As the difference in DICs between the fixed‐effect and random‐effects models was less than 3, the simpler fixed‐effect model was chosen. Results for the fixed‐effect model are presented in Section 3.3.1.1.2.
A node‐splitting model was fit to assess inconsistency. The results of node‐splitting are presented in Table 66. There is no evidence to suggest inconsistency in the network.
48. Node‐splitting results for all‐cause AEs for grouped treatments.
| Model | p |
LOR (95% CrI) |
| HD‐ICS/LABA vs. MD‐ICS/LABA | ||
| Direct | 0.976 | ‐0.007 (‐0.146, 0.148) |
| Indirect | 0.002 (‐0.413, 0.434) |
|
| Network | 0.010 (‐0.126, 0.147) |
|
| MD Triple vs. MD‐ICS/LABA | ||
| Direct | 0.851 | ‐0.114 (‐0.317, 0.096) |
| Indirect | ‐0.157 (‐0.579, 0.278) |
|
| Network | ‐0.111 (‐0.274, 0.045) |
|
| HD Triple vs. MD‐ICS/LABA | ||
| Direct | 0.513 | ‐0.192 (‐0.433, 0.057) |
| Indirect | ‐0.303 (‐0.564, ‐0.029) |
|
| Network | ‐0.233 (‐0.403, ‐0.083) |
|
| MD Triple vs. HD‐ICS/LABA | ||
| Direct | 0.080 | ‐0.0001 (‐0.209, 0.226) |
| Indirect | ‐0.298 (‐0.573, ‐0.037) |
|
| Network | ‐0.120 (‐0.280, 0.030) |
|
| HD Triple vs. HD‐ICS/LABA | ||
| Direct | 0.844 | ‐0.254 (‐0.428, ‐0.093) |
| Indirect | ‐0.212 (‐0.662, 0.225) |
|
| Network | ‐0.243 (‐0.388, ‐0.117) |
|
| HD Triple vs. MD Triple | ||
| Direct | 0.945 | ‐0.107 (‐0.286, 0.065) |
| Indirect | ‐0.123 (‐0.550, 0.304) |
|
| Network | ‐0.122 (‐0.283, 0.024) |
|
Negative LOR favours the second named treatment. CrI: credible interval; HD: high dose; ICS: inhaled corticosteroids; LABA: long‐acting beta‐2 agonist; LOR log odds ratio; MD: medium dose.
3.3.1.1.2 NMA results
The odds ratios of all‐cause AEs are presented in Figure 71. The odds ratios of all‐cause AEs comparing all treatment groups against each other are reported in Table 67.
71.
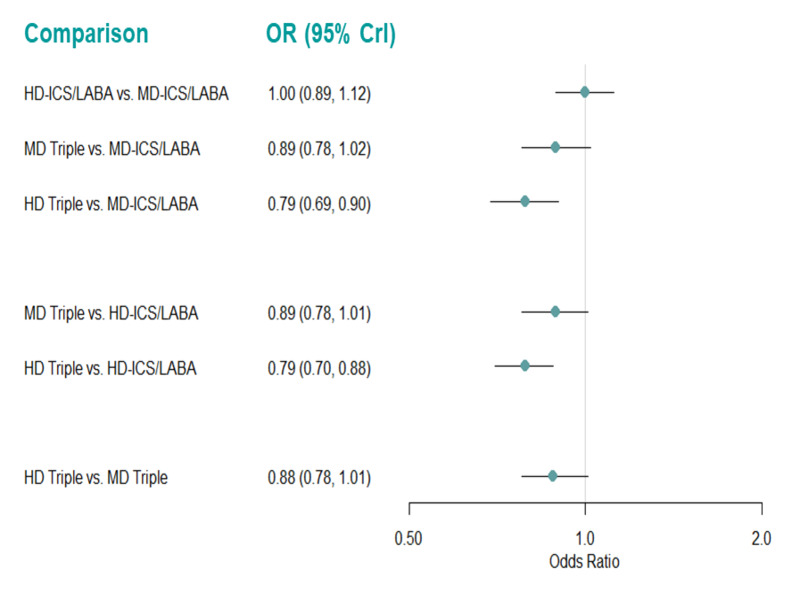
Forest plots of odds ratios for all‐cause AEs for grouped treatments (fixed effect model).
Odds ratio less than one favors the first named treatment. Crl: credible interval, HD: high dose; ICS: inhaled corticosteroids; LABA: long‐acting beta‐2 agonist; MD: medium dose.
49. Odds ratio for all‐cause AEs for grouped treatments (fixed‐effect model).
| Comparison | Odds Ratio (95% CrI) |
| HD‐ICS/LABA vs MD‐ICS/LABA | 1.000 (0.892, 1.122) |
| MD Triple vs. MD‐ICS/LABA | 0.890 (0.776, 1.019) |
| HD Triple vs MD‐ICS/LABA | 0.787 (0.687, 0.902) |
| MD Triple vs. HD‐ICS/LABA | 0.889 (0.780, 1.013) |
| HD Triple vs HD‐ICS/LABA | 0.786 (0.702, 0.881) |
| HD Triple vs MD Triple | 0.885 (0.777, 1.007) |
The second named treatment is the baseline intervention. Odds ratio less than one favours the treatment named first in the comparisons. Treatment comparisons in bold do not include the “null” effect. CrI: credible interval; HD: high dose; ICS: inhaled corticosteroids; LABA: long‐acting beta‐2 agonist; MD: medium dose.
There is evidence to suggest that treatment with HD Triple reduces the odds of all‐cause AEs compared to MD‐ICS/LABA and HD‐ICS/LABA (OR 0.79 [95% CrI 0.69 to 0.90] and 0.79 [0.70 to 0.88], respectively). An NMA summary of findings is presented in Table 17.
The rank plots for grouped treatments are presented in Figure 72, and the mean and median ranks are presented in Table 68. HD Triple has the highest probability of being better than the other grouped treatments (median rank 1 [95% CrI 1 to 2]).
72.
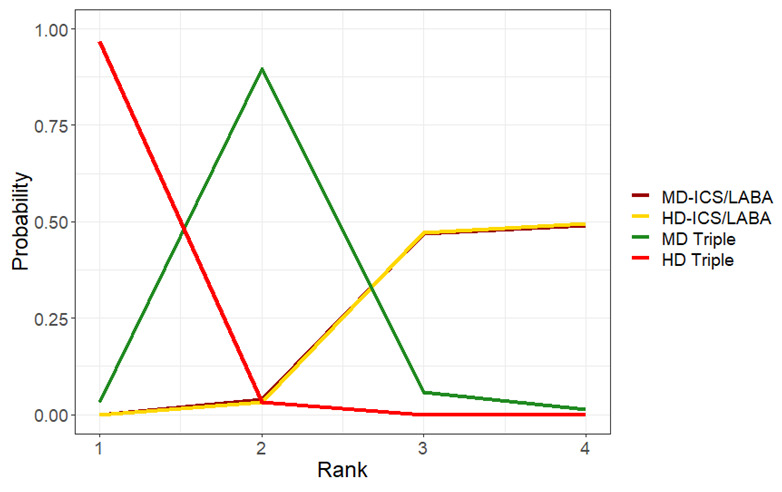
Rank plots for grouped treatments for all‐cause AEs (fixed effect model)
HD: high dose; ICS: inhaled corticosteroids; LABA: long‐acting beta‐2 agonist; MD: medium dose.
50. Mean and median ranking for grouped treatments for all‐cause AEs sorted by mean rank (fixed‐effect model).
| Treatments | Mean Rank | Median Rank | 95% CrI |
| HD Triple | 1.03 | 1.0 | (1.00, 2.00) |
| MD Triple | 2.05 | 2.0 | (1.00, 3.00) |
| MD‐ICS/LABA | 3.45 | 3.0 | (2.00, 4.00) |
| HD‐ICS/LABA | 3.46 | 3.0 | (2.00, 4.00) |
CrI: credible interval; HD: high dose; ICS: inhaled corticosteroids; LABA: long‐acting beta‐2 agonist; MD: medium dose.
3.3.1.1.3 Pairwise meta‐analysis
The evidence suggests HD and MD Triple result in a reduction in all‐cause AEs compared to MD‐ICS/LABA (RR 0.96 [95% CI 0.91 to 1.00]; ARR 42 fewer per 1000 patients; [moderate certainty] and RR 0.92 [95% CI 0.85 to 1.00]; ARR 25 fewer per 1000 patients; [moderate certainty], respectively). Triple therapy (ICS/LABA/LAMA) results in a reduction in all‐cause AEs compared to dual therapy (ICS/LABA) (RR 0.93 [95% CI 0.90 to 0.96]; ARR 44 fewer per 1000 patients; [high certainty]) and HD Triple likely results in a slight reduction in all‐cause AEs compared to MD Triple (RR 0.95 [95% CI 0.90 to 1.02]; ARR 26 fewer per 1000 patients; [moderate certainty]) (Analysis 5.3, Table 15). There was no difference in the results between fixed‐effect and random‐effects models.
5.3. Analysis.
Comparison 5: Serious adverse events, adverse events, and dropouts due to adverse event, Outcome 3: All cause AEs
3.3.1.2 Individual treatments
For this outcome, 12 trials (12,009 participants) comparing 17 distinct treatments were included in the NMA (Figure 73). A summary of the studies included is presented in Appendix 21. Four studies (Kerstjens 2012a; Kerstjens 2012b; Virchow 2019a; Virchow 2019b) that were identified were excluded from this analysis as they were disconnected from the main network shown in Figure 73.
73.
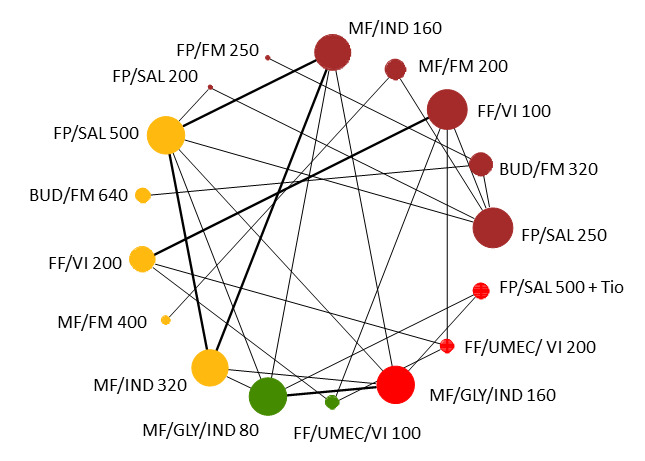
Network diagram for all‐cause AEs for individual interventions.
Node colors denote the treatment group. BUD: budesonide, FF: fluticasone furoate, FM: formoterol, FP: fluticasone propionate, GLY: glycopyrronium, IND: indacaterol, MF: mometasone furoate, SAL: salmeterol, Tio: tiotropium, UMEC: umeclidinium, VI: vilanterol.
3.3.1.2.1 Model selection and inconsistency checking
The Turner prior for adverse event outcomes comparing pharmacological interventions, i.e. a Log‐Normal (‐2.10, 1.582) prior distribution, was used for the between‐study heterogeneity (Turner 2015).
Model fit parameters for the fixed‐effect and random‐effects models are reported in Appendix 3. Both fixed‐effect and random‐effects models fit the data well. The between‐study heterogeneity was low. As the difference in DICs between the fixed‐effect and random‐effects models was less than 3, the simpler fixed‐effect model was chosen. Results for the fixed‐effect model are presented in Section 3.3.1.2.2. There is no potential for inconsistency in this network as there is no independent, indirect evidence for any of the comparisons.
3.3.1.2.2 NMA results
The odds ratios of all‐cause AEs, compared to FP/SAL 250/50 µg (MD‐ICS/LABA), are presented in Figure 74. The odds ratios of all‐cause AEs comparing all treatment groups against each other are reported in Table 69. Treatment with budesonide/formoterol (BUD/FM) 320/10 µg (MD‐ICS/LABA) and BUD/FM 640/10 µg (HD‐ICS/LABA) increase the odds of all‐cause AEs compared to FP/SAL 250/50 µg (MD‐ICS/LABA) (OR 1.9 [1.05 to 3.6] and 2.9 [1.3 to 6.7] respectively). Other comparisons which do not include the “null” treatment effect are highlighted in bold font in Table 69.
74.
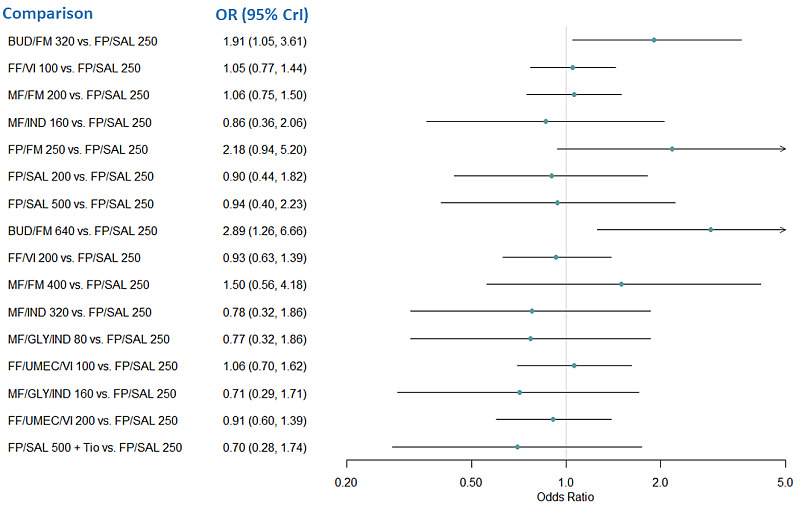
Forest plot of odds ratios relative to FP/SAL 250 for all‐cause AEs for individual treatments.
Odds ratio less than one favors the comparator treatment. BUD: budesonide, Crl: credible interval, FF: fluticasone furoate, FM: formoterol, FP: fluticasone propionate, GLY: glycopyrronium, IND: indacaterol, MF: mometasone furoate, OR: odds ratio, SAL: salmeterol, Tio: tiotropium, UMEC: umeclidinium, VI: vilanterol.
51. Odds ratio for all‐cause AEs for individual treatments (fixed‐effect model).
| Comparison | Odds Ratio (95% CrI) |
| BUD/FM 320 vs. FP/SAL 250 | 1.912 (1.048, 3.607) |
| FF/VI 100 vs. FP/SAL 250 | 1.051 (0.770, 1.436) |
| MF/FM 200 vs. FP/SAL 250 | 1.058 (0.746, 1.503) |
| MF/IND 160 vs. FP/SAL 250 | 0.861 (0.357, 2.065) |
| FP/FM 250 vs. FP/SAL 250 | 2.177 (0.935, 5.196) |
| FP/SAL 200 vs. FP/SAL 250 | 0.899 (0.442, 1.819) |
| FP/SAL 500 vs. FP/SAL 250 | 0.944 (0.398, 2.227) |
| BUD/FM 640 vs. FP/SAL 250 | 2.885 (1.256, 6.663) |
| FF/VI 200 vs. FP/SAL 250 | 0.935 (0.631, 1.385) |
| MF/FM 400 vs. FP/SAL 250 | 1.498 (0.565, 4.177) |
| MF/IND 320 vs. FP/SAL 250 | 0.775 (0.321, 1.859) |
| MF/GLY/IND 80 vs. FP/SAL 250 | 0.773 (0.318, 1.864) |
| FF/UMEC/VI 100 vs. FP/SAL 250 | 1.063 (0.701, 1.618) |
| MF/GLY/IND 160 vs. FP/SAL 250 | 0.707 (0.291, 1.706) |
| FF/UMEC/VI 200 vs. FP/SAL 250 | 0.910 (0.597, 1.391) |
| FP/SAL 500 + Tio vs. FP/SAL 250 | 0.703 (0.283, 1.737) |
| FF/VI 100 vs. BUD/FM 320 | 0.550 (0.271, 1.083) |
| MF/FM 200 vs. BUD/FM 320 | 0.553 (0.269, 1.109) |
| MF/IND 160 vs. BUD/FM 320 | 0.449 (0.153, 1.306) |
| FP/FM 250 vs. BUD/FM 320 | 1.136 (0.629, 2.065) |
| FP/SAL 200 vs. BUD/FM 320 | 0.469 (0.183, 1.189) |
| FP/SAL 500 vs. BUD/FM 320 | 0.492 (0.170, 1.413) |
| BUD/FM 640 vs. BUD/FM 320 | 1.509 (0.851, 2.600) |
| FF/VI 200 vs. BUD/FM 320 | 0.488 (0.232, 1.002) |
| MF/FM 400 vs. BUD/FM 320 | 0.783 (0.245, 2.575) |
| MF/IND 320 vs. BUD/FM 320 | 0.404 (0.137, 1.177) |
| MF/GLY/IND 80 vs. BUD/FM 320 | 0.403 (0.136, 1.177) |
| FF/UMEC/VI 100 vs. BUD/FM 320 | 0.556 (0.261, 1.157) |
| MF/GLY/IND 160 vs. BUD/FM 320 | 0.369 (0.125, 1.078) |
| FF/UMEC/VI 200 vs. BUD/FM 320 | 0.476 (0.222, 0.994) |
| FP/SAL 500 +Tio vs. BUD/FM 320 | 0.366 (0.122, 1.090) |
| MF/FM 200 vs. FF/VI 100 | 1.006 (0.629, 1.609) |
| MF/IND 160 vs. FF/VI 100 | 0.818 (0.321, 2.073) |
| FP/FM 250 vs. FF/VI 100 | 2.071 (0.842, 5.219) |
| FP/SAL 200 vs. FF/VI 100 | 0.855 (0.393, 1.843) |
| FP/SAL 500 vs. FF/VI 100 | 0.897 (0.359, 2.230) |
| BUD/FM 640 vs. FF/VI 100 | 2.742 (1.129, 6.708) |
| FF/VI 200 vs. FF/VI 100 | 0.889 (0.698, 1.132) |
| MF/FM 400 vs. FF/VI 100 | 1.425 (0.509, 4.163) |
| MF/IND 320 vs. FF/VI 100 | 0.737 (0.289, 1.861) |
| MF/GLY/IND 80 vs. FF/VI 100 | 0.735 (0.287, 1.864) |
| FF/UMEC/VI 100 vs. FF/VI 100 | 1.012 (0.764, 1.338) |
| MF/GLY/IND 160 vs. FF/VI 100 | 0.672 (0.263, 1.705) |
| FF/UMEC/VI 200 vs. FF/VI 100 | 0.866 (0.651, 1.150) |
| FP/SAL 500 +Tio vs. FF/VI 100 | 0.668 (0.255, 1.733) |
| MF/IND 160 vs. MF/FM 200 | 0.814 (0.316, 2.085) |
| FP/FM 250 vs. MF/FM 200 | 2.057 (0.825, 5.235) |
| FP/SAL 200 vs. MF/FM 200 | 0.850 (0.385, 1.860) |
| FP/SAL 500 vs. MF/FM 200 | 0.892 (0.352, 2.248) |
| BUD/FM 640 vs. MF/FM 200 | 2.726 (1.105, 6.755) |
| FF/VI 200 vs. MF/FM 200 | 0.883 (0.522, 1.497) |
| MF/FM 400 vs. MF/FM 200 | 1.415 (0.570, 3.713) |
| MF/IND 320 vs. MF/FM 200 | 0.733 (0.284, 1.878) |
| MF/GLY/IND 80 vs. MF/FM 200 | 0.731 (0.282, 1.880) |
| FF/UMEC/VI 100 vs. MF/FM 200 | 1.005 (0.582, 1.737) |
| MF/GLY/IND 160 vs. MF/FM 200 | 0.668 (0.258, 1.723) |
| FF/UMEC/VI 200 vs. MF/FM 200 | 0.861 (0.497, 1.491) |
| FP/SAL 500 +Tio vs. MF/FM 200 | 0.665 (0.250, 1.751) |
| FP/FM 250 vs. MF/IND 160 | 2.534 (0.747, 8.695) |
| FP/SAL 200 vs. MF/IND 160 | 1.046 (0.512, 2.130) |
| FP/SAL 500 vs. MF/IND 160 | 1.097 (0.918, 1.310) |
| BUD/FM 640 vs. MF/IND 160 | 3.356 (1.002, 11.224) |
| FF/VI 200 vs. MF/IND 160 | 1.086 (0.417, 2.847) |
| MF/FM 400 vs. MF/IND 160 | 1.748 (0.470, 6.710) |
| MF/IND 320 vs. MF/IND 160 | 0.900 (0.756, 1.073) |
| MF/GLY/IND 80 vs. MF/IND 160 | 0.897 (0.735, 1.097) |
| FF/UMEC/VI 100 vs. MF/IND 160 | 1.237 (0.469, 3.277) |
| MF/GLY/IND 160 vs. MF/IND 160 | 0.822 (0.673, 1.003) |
| FF/UMEC/VI 200 vs. MF/IND 160 | 1.058 (0.401, 2.810) |
| FP/SAL 500 +Tio vs. MF/IND 160 | 0.817 (0.614, 1.086) |
| FP/SAL 200 vs. FP/FM 250 | 0.413 (0.135, 1.241) |
| FP/SAL 500 vs. FP/FM 250 | 0.433 (0.128, 1.447) |
| BUD/FM 640 vs. FP/FM 250 | 1.326 (0.583, 2.967) |
| FF/VI 200 vs. FP/FM 250 | 0.429 (0.165, 1.089) |
| MF/FM 400 vs. FP/FM 250 | 0.690 (0.186, 2.603) |
| MF/IND 320 vs. FP/FM 250 | 0.355 (0.104, 1.205) |
| MF/GLY/IND 80 vs. FP/FM 250 | 0.354 (0.103, 1.204) |
| FF/UMEC/VI 100 vs. FP/FM 250 | 0.489 (0.186, 1.251) |
| MF/GLY/IND 160 vs. FP/FM 250 | 0.324 (0.094, 1.102) |
| FF/UMEC/VI 200 vs. FP/FM 250 | 0.418 (0.159, 1.076) |
| FP/SAL 500 +Tio vs. FP/FM 250 | 0.322 (0.092, 1.113) |
| FP/SAL 500 vs. FP/SAL 200 | 1.049 (0.526, 2.096) |
| BUD/FM 640 vs. FP/SAL 200 | 3.212 (1.079, 9.581) |
| FF/VI 200 vs. FP/SAL 200 | 1.039 (0.465, 2.338) |
| MF/FM 400 vs. FP/SAL 200 | 1.671 (0.501, 5.785) |
| MF/IND 320 vs. FP/SAL 200 | 0.861 (0.423, 1.758) |
| MF/GLY/IND 80 vs. FP/SAL 200 | 0.858 (0.419, 1.768) |
| FF/UMEC/VI 100 vs. FP/SAL 200 | 1.184 (0.522, 2.701) |
| MF/GLY/IND 160 vs. FP/SAL 200 | 2.701 (0.383, 1.617) |
| FF/UMEC/VI 200 vs. FP/SAL 200 | 1.013 (0.446, 2.315) |
| FP/SAL 500 +Tio vs. FP/SAL 200 | 0.781 (0.370, 1.652) |
| BUD/FM 640 vs. FP/SAL 500 | 3.062 (0.927, 10.102) |
| FF/VI 200 vs. FP/SAL 500 | 0.991 (0.387, 2.554) |
| MF/FM 400 vs. FP/SAL 500 | 1.594 (0.434, 6.051) |
| MF/IND 320 vs. FP/SAL 500 | 0.821 (0.688, 0.980) |
| MF/GLY/IND 80 vs. FP/SAL 500 | 0.818 (0.669, 1.000) |
| FF/UMEC/VI 100 vs. FP/SAL 500 | 1.128 (0.435, 2.936) |
| MF/GLY/IND 160 vs. FP/SAL 500 | 0.750 (0.612, 0.916) |
| FF/UMEC/VI 200 vs. FP/SAL 500 | 0.965 (0.372, 2.522) |
| FP/SAL 500 +Tio vs. FP/SAL 500 | 0.745 (0.560, 0.991) |
| FF/VI 200 vs. BUD/FM 640 | 0.324 (0.129, 0.814) |
| MF/FM 400 vs. BUD/FM 640 | 0.521 (0.143, 1.947) |
| MF/IND 320 vs. BUD/FM 640 | 0.268 (0.080, 0.898) |
| MF/GLY/IND 80 vs. BUD/FM 640 | 0.267 (0.080, 0.900) |
| FF/UMEC/VI 100 vs. BUD/FM 640 | 0.368 (0.145, 0.937) |
| MF/GLY/IND 160 vs. BUD/FM 640 | 0.245 (0.073, 0.823) |
| FF/UMEC/VI 200 vs. BUD/FM 640 | 0.315 (0.124, 0.803) |
| FP/SAL 500 +Tio vs. BUD/FM 640 | 0.243 (0.071, 0.832) |
| MF/FM 400 vs. FF/VI 200 | 1.604 (0.558, 4.812) |
| MF/IND 320 vs. FF/VI 200 | 0.829 (0.316, 2.159) |
| MF/GLY/IND 80 vs. FF/VI 200 | 0.826 (0.314, 2.156) |
| FF/UMEC/VI 100 vs. FF/VI 200 | 1.138 (0.858, 1.511) |
| MF/GLY/IND 160 vs. FF/VI 200 | 0.756 (0.287, 1.975) |
| FF/UMEC/VI 200 vs. FF/VI 200 | 0.974 (0.731, 1.296) |
| FP/SAL 500 +Tio vs. FF/VI 200 | 0.752 (0.279, 2.004) |
| MF/IND 320 vs. MF/FM 400 | 0.515 (0.134, 1.916) |
| MF/GLY/IND 80 vs. MF/FM 400 | 0.514 (0.133, 1.922) |
| FF/UMEC/VI 100 vs. MF/FM 400 | 0.710 (0.234, 2.058) |
| MF/GLY/IND 160 vs. MF/FM 400 | 0.470 (0.122, 1.761) |
| FF/UMEC/VI 200 vs. MF/FM 400 | 0.607 (0.200, 1.767) |
| FP/SAL 500 +Tio vs. MF/FM 400 | 0.467 (0.120, 1.778) |
| MF/GLY/IND 80 vs. MF/IND 320 | 0.997 (0.817, 1.217) |
| FF/UMEC/VI 100 vs. MF/IND 320 | 1.373 (0.522, 3.644) |
| MF/GLY/IND 160 vs. MF/IND 320 | 0.912 (0.748, 1.113) |
| FF/UMEC/VI 200 vs. MF/IND 320 | 1.175 (0.446, 3.122) |
| FP/SAL 500 +Tio vs. MF/IND 320 | 0.907 (0.682, 1.205) |
| FF/UMEC/VI 100 vs. MF/GLY/IND 80 | 1.378 (0.521, 3.665) |
| MF/GLY/IND 160 vs. MF/GLY/IND 80 | 0.915 (0.771, 1.086) |
| FF/UMEC/VI 200 vs. MF/GLY/IND 80 | 1.179 (0.445, 3.146) |
| FP/SAL 500 +Tio vs. MF/GLY/IND 80 | 0.910 (0.718, 1.152) |
| MF/GLY/IND 160 vs. FF/UMEC/VI 100 | 0.664 (0.249, 1.758) |
| FF/UMEC/VI 200 vs. FF/UMEC/VI 100 | 0.856 (0.636, 1.150) |
| FP/SAL 500 +Tio vs. FF/UMEC/VI 100 | 0.660 (0.242, 1.784) |
| FF/UMEC/VI 200 vs. MF/GLY/IND 160 | 1.288 (0.486, 3.437) |
| FP/SAL 500 +Tio vs. MF/GLY/IND 160 | 0.994 (0.784, 1.258) |
| FP/SAL 500 +Tio vs. FF/UMEC/VI 200 | 0.772 (0.282, 2.088) |
The second named treatment is the baseline intervention. Odds ratio less than one favours the first named treatment. Treatment comparisons in bold do not include the “null” effect. BUD: budesonide, Crl: credible interval, FF: fluticasone furoate, FM: formoterol, FP: fluticasone propionate, GLY: glycopyrronium, IND: indacaterol, MF: mometasone furoate, SAL: salmeterol, Tio: tiotropium, UMEC: umeclidinium, VI: vilanterol.
The rank plots for individual treatments are presented in Figure 75, and the mean ranks are presented in Table 70. It is very unclear which intervention is the best, as the treatment ranks are very uncertain. Except BUD/FM 640/10 µg (HD‐ICS/LABA) which has a probability of approximately 60% of being the lowest ranked treatment (median rank 17 [95% CrI 12 to 17]), none of the other treatments have even 50% probability for any of the possible ranks.
75.
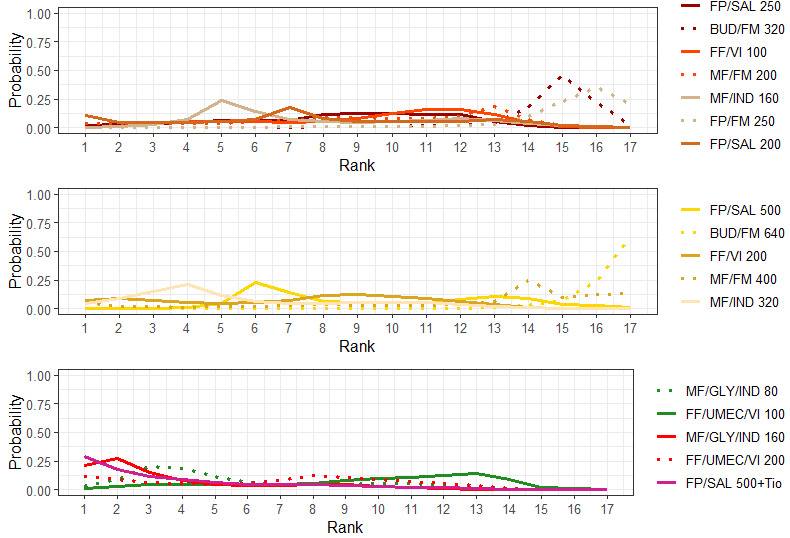
Rank plots for individual treatments for all‐cause AEs (fixed‐effect model).
Line colors denote the treatment group. BUD: budesonide, FF: fluticasone furoate, FM: formoterol, FP: fluticasone propionate, GLY: glycopyrronium, IND: indacaterol, MF: mometasone furoate, SAL: salmeterol, Tio: tiotropium, UMEC: umeclidinium, VI: vilanterol.
52. Mean and median ranking for individual treatments for all‐cause AEs sorted by mean rank (fixed‐effect model).
| Treatments | Mean Rank | Median Rank | 95% CrI |
| MF/GLY/IND 160 | 3.78 | 3 | (1.00, 11.00) |
| FP/SAL 500 +Tio | 3.96 | 3 | (1.00, 12.00) |
| MF/IND 320 | 5.62 | 4 | (1.00, 13.00) |
| MF/GLY/IND 80 | 5.68 | 4 | (1.00, 13.00) |
| FF/UMEC/VI 200 | 6.79 | 7 | (1.00, 13.00) |
| FF/VI 200 | 7.20 | 8 | (1.00, 13.00) |
| FP/SAL 200 | 7.51 | 7 | (1.00, 15.00) |
| MF/IND 160 | 7.86 | 7 | (3.00, 15.00) |
| FP/SAL 250 | 8.49 | 9 | (2.00, 13.00) |
| MF/FM 200 | 9.35 | 10 | (1.00, 14.00) |
| FP/SAL 500 | 9.49 | 9 | (5.00, 16.00) |
| FF/VI 100 | 9.60 | 10 | (3.00, 14.00) |
| FF/UMEC/VI 100 | 9.71 | 11 | (2.00, 15.00) |
| MF/FM 400 | 12.23 | 14 | (1.00, 17.00) |
| BUD/FM 320 | 14.47 | 15 | (8.00, 16.00) |
| FP/FM 250 | 14.95 | 16 | (7.00, 17.00) |
| BUD/FM 640 | 16.31 | 17 | (12.00, 17.00) |
BUD: budesonide, Crl: credible interval, FF: fluticasone furoate, FM: formoterol, FP: fluticasone propionate, GLY: glycopyrronium, IND: indacaterol, MF: mometasone furoate, SAL: salmeterol, Tio: tiotropium, UMEC: umeclidinium, VI: vilanterol.
3.3.2 Dropouts due to AEs
3.3.2.1 Grouped treatments
For this outcome, 12 trials (12,951 participants) comparing 4 treatment groups were included in the NMA (Figure 13). A summary of the studies included in the analysis is presented in Appendix 22.
3.3.2.1.1 Model selection and inconsistency checking
The Turner prior for adverse event outcomes comparing pharmacological interventions, i.e. a Log‐Normal (‐2.10, 1.582) prior distribution, was used for the between‐study heterogeneity (Turner 2015).
Model fit parameters for the fixed‐effect and random‐effects models are reported in Appendix 3. Both fixed‐effect and random‐effects models fit the data well. The between‐study heterogeneity was low. As the difference in DICs between the fixed‐effect and random‐effects models was less than 3, the simpler fixed‐effect model was chosen. Results for the fixed‐effect model are presented in Section 3.3.2.1.2.
A node‐splitting model was fit to assess inconsistency. The results of node‐splitting are presented in Table 71. There was evidence of inconsistency for the comparisons of HD‐ICS/LABA with MD‐ICS/LABA and HD Triple with MD Triple, which are directly linked to multiple loops in the network. Therefore, results for dropouts due to AEs for this comparison should be interpreted with caution.
53. Node‐splitting results for dropouts due to AEs for grouped treatments.
| Model | p |
LOR (95% CrI) |
| HD‐ICS/LABA vs. MD‐ICS/LABA | ||
| Direct | 0.003 | ‐0.027 (‐0.646, 0.557) |
| Indirect | ‐22.573 (‐71.914, ‐2.303) |
|
| Network | ‐0.141 (‐0.797, 0.475) |
|
| MD Triple vs. MD‐ICS/LABA | ||
| Direct | 0.405 | ‐0.652 (‐2.291, 0.280) |
| Indirect | 0.301 (‐2.064, 2.681) |
|
| Network | ‐0.350 (‐1.441, 0.355) |
|
| HD Triple vs. MD‐ICS/LABA | ||
| Direct | 0.840 | ‐0.822 (‐2.143, 0.263) |
| Indirect | ‐0.683 (‐2.060, 0.526) |
|
| Network | ‐0.798 (‐1.688, ‐0.065) |
|
| MD Triple vs. HD‐ICS/LABA | ||
| Direct | 0.117 | 0.210 (‐0.907, 1.247) |
| Indirect | ‐1.158 (‐2.969, 0.269) |
|
| Network | ‐0.204 (‐1.274, 0.487) |
|
| HD Triple vs. HD‐ICS/LABA | ||
| Direct | 0.402 | ‐0.554 (‐1.457, 0.322) |
| Indirect | ‐1.509 (‐4.439, 0.756) |
|
| Network | ‐0.660 (‐1.410, ‐0.021) |
|
| HD Triple vs. MD Triple | ||
| Direct | 0.002 | ‐0.588 (‐1.396, 0.300) |
| Indirect | 23.163 (1.997, 74.056) |
|
| Network | ‐0.446 (‐1.195, 0.521) |
|
Negative LOR favours the second named treatment. Comparison in bold exhibits evidence of inconsistency. CrI: credible interval; HD: high dose; ICS: inhaled corticosteroids; LABA: long‐acting beta‐2 agonist; LOR log odds ratio; MD: medium dose.
3.3.2.1.2 NMA results
As discussed in 3.3.2.1.1, all results in this section should be regarded with caution due to the inconsistency in the model.
The odds ratios of dropouts due to AEs are presented in Figure 76. The odds ratios of dropouts due to AEs comparing all treatment groups against each other are reported in Table 72.
76.
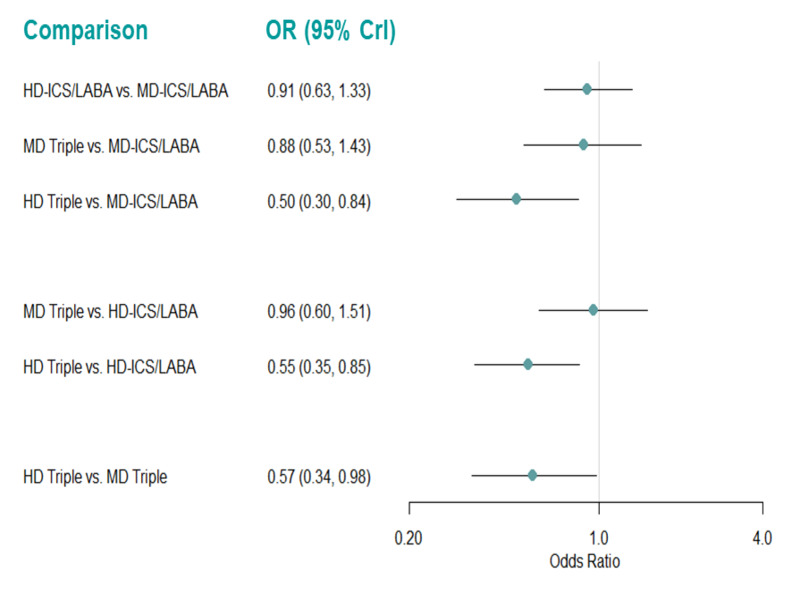
Forest plots of odds ratios for drop‐outs due to AEs for grouped treatments (fixed‐effect model).
Odds ratio less than one favors the first named treatment. Crl: credible interval, HD: high dose; ICS: inhaled corticosteroids; LABA: long‐acting beta‐2 agonist; MD: medium dose.
54. Odds ratio for drop‐outs due to AEs for grouped treatments (fixed‐effect model).
| Comparison | Odds Ratio (95% CrI) |
| HD‐ICS/LABA vs MD‐ICS/LABA | 0.911 (0.630, 1.330) |
| MD Triple vs. MD‐ICS/LABA | 0.878 (0.531, 1.434) |
| HD Triple vs MD‐ICS/LABA | 0.503 (0.298, 0.837) |
| MD Triple vs. HD‐ICS/LABA | 0.964 (0.602, 1.513) |
| HD Triple vs HD‐ICS/LABA | 0.552 (0.351, 0.849) |
| HD Triple vs MD Triple | 0.572 (0.336, 0.976) |
The second named treatment is the baseline intervention. Odds ratio less than one favours the treatment named first in the comparisons. Treatment comparisons in bold do not include the “null” effect. CrI: credible interval; HD: high dose; ICS: inhaled corticosteroids; LABA: long‐acting beta‐2 agonist; MD: medium dose.
There is evidence to suggest that treatment with HD Triple reduces the odds of dropouts due to AE compared to MD ICS/LABA, HD ICS/LABA, and MD Triple (OR 0.50 [95% CrI 0.30 to 0.84], 0.55 [0.35 to 0.85], and 0.57 [0.34 to 0.98], respectively).
An NMA summary of findings is presented in Table 18. Certainty of evidence and the interpretation of findings for HD‐ICS/LABA vs. MD‐ICS/LABA is based on the direct evidence which is rated as high certainty and contributes greater than indirect evidence in the NMA (Schünemann 2020).
The rank plots for grouped treatments are presented in Figure 77, and the mean and median ranks are presented in Table 73. HD Triple ranks higher than the other treatments (median rank 1 [95% CrI 1 to 2]).
77.
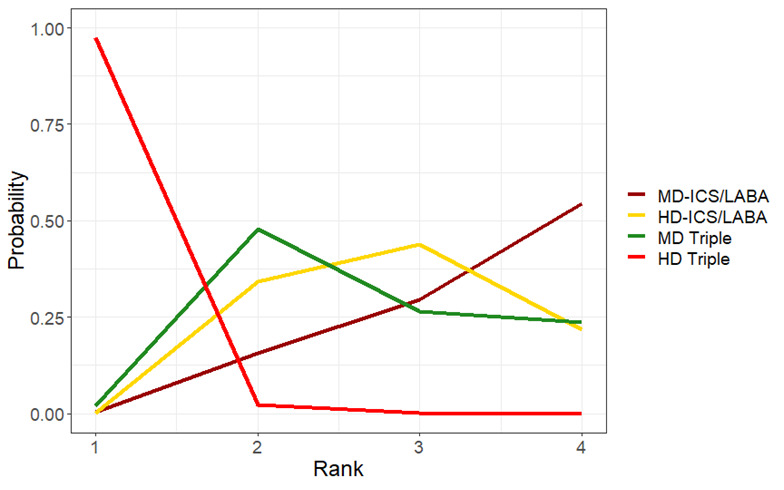
Rank plots for grouped treatments for dropouts due to AEs (fixed‐effect model)
HD: high dose; ICS: inhaled corticosteroids; LABA: long‐acting beta‐2 agonist; MD: medium dose.
55. Mean and median ranking for grouped treatments for drop‐outs due to AEs sorted by mean rank (fixed‐effect model).
| Treatments | Mean Rank | Median Rank | 95% CrI |
| HD Triple | 1.03 | 1.0 | (1.00, 2.00) |
| MD Triple | 2.72 | 3.0 | (2.00, 4.00) |
| HD‐ICS/LABA | 2.87 | 3.0 | (2.00, 4.00) |
| MD‐ICS/LABA | 3.38 | 4.0 | (2.00, 4.00) |
CrI: credible interval; HD: high dose; ICS: inhaled corticosteroids; LABA: long‐acting beta‐2 agonist; MD: medium dose.
3.3.2.1.3 Pairwise meta‐analysis
The evidence suggests HD triple results in a slight reduction in dropouts due to AE compared to HD‐ICS/LABA and MD‐ICS/LABA (RR 0.60 [95% CI 0.38 to 0.95]; ARR 9 fewer 1000 patients; [high certainty]) and RR 0.47 [95% CI 0.19 to 1.18]; ARR 15 fewer per 1000 patients; [high certainty], respectively) while MD triple does not. Triple therapy likely results in a slight reduction in dropouts due to AE compared to dual therapy (RR 0.59 [95% CI 0.33 to 1.03]; ARR 9 fewer per 1000 patients [moderate certainty]; Analysis 5.4, Table 15). While triple vs. dual therapy and HD Triple vs. MD‐ICS/LABA do not include the “null” effect for the fixed‐effect model (RR 0.71 [95% CI 0.51 to 0.98]; I2= 43% and RR 0.52 [95% CI 0.29 to 0.94]; I2=35%, respectively), they do for the random‐effects model.
5.4. Analysis.
Comparison 5: Serious adverse events, adverse events, and dropouts due to adverse event, Outcome 4: Dropouts due to adverse event
3.3.2.2 Individual treatments
For this outcome, 13 trials (12,230 participants) comparing 17 distinct treatments were included in the NMA (Figure 78). A summary of the studies included is presented in Appendix 23. Four studies (Kerstjens 2012a, Kerstjens 2012b, Virchow 2019a, and Virchow 2019b) that were identified were excluded from this analysis as they were disconnected from the main network shown in Figure 78.
78.
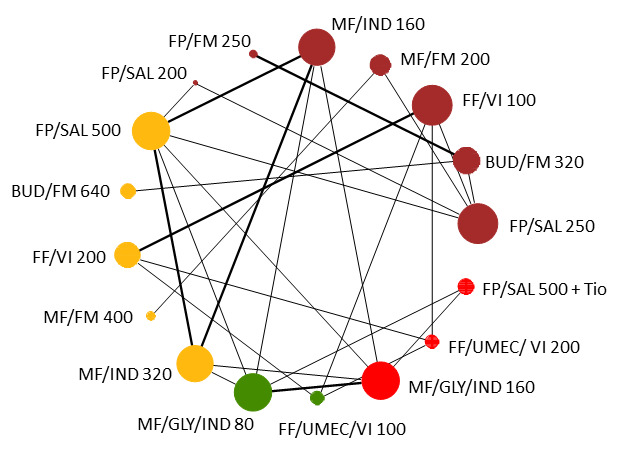
Network diagram for dropouts due to AEs for individual interventions.
Node colors denote the treatment group. BUD: budesonide, FF: fluticasone furoate, FM: formoterol, FP: fluticasone propionate, GLY: glycopyrronium, IND: indacaterol, MF: mometasone furoate, SAL: salmeterol, Tio: tiotropium, UMEC: umeclidinium, VI: vilanterol.
As the data are sparse, with few studies per comparison which have very few events in each treatment arm, the results for this analysis are very uncertain.
Two three‐arm studies, Mansfield 2017 and van Zyl‐Smit 2020 reported no events. In Mansfield 2017, one arm (i.e., FP/SAL 200) reported zero events, and two arms (MF/IND 160 and MF/IND 320) reported zero events in van Zyl‐Smit 2020. The zero cells caused problem with model convergence, so we added a continuity correction of 0.5 to the two studies. When fitting this model in OpenBUGS (version 3.2.3), a less‐vague prior distribution (Normal (0, 0.01)) was used for the relative treatment effects, to make the model more stable.
3.3.2.2.1 Model selection and inconsistency checking
The Turner prior for adverse event outcomes comparing pharmacological interventions, i.e. a Log‐Normal (‐2.10, 1.582) prior distribution, was used for the between‐study heterogeneity (Turner 2015).
Model fit parameters for the fixed‐effect and random‐effects models are reported in Appendix 3. Both fixed‐effect and random‐effects models fit the data well. The between‐study heterogeneity was low, with a wider credible interval. As the difference in DICs between the fixed‐effect and random‐effects models was less than 3, the simpler fixed‐effect model was chosen. Results for the fixed‐effect model are presented in Section 3.3.2.2.2.
There is no potential for inconsistency in this network as there is no independent, indirect evidence for any of the comparisons.
3.3.2.2.2 NMA results
The odds ratios of dropouts due to AEs, compared to FP/SAL 250/50 µg (MD‐ICS/LABA), are presented in Figure 79. The odds ratios of dropouts due to AEs comparing all treatment groups against each other are reported in Table 74. There is no evidence to suggest that there is a change in odds for dropouts due to AEs for any of the individual treatments compared to FP/SAL 250/50 µg. Other comparisons which do not include the “null” treatment effect are highlighted in bold font in Table 74.
79.
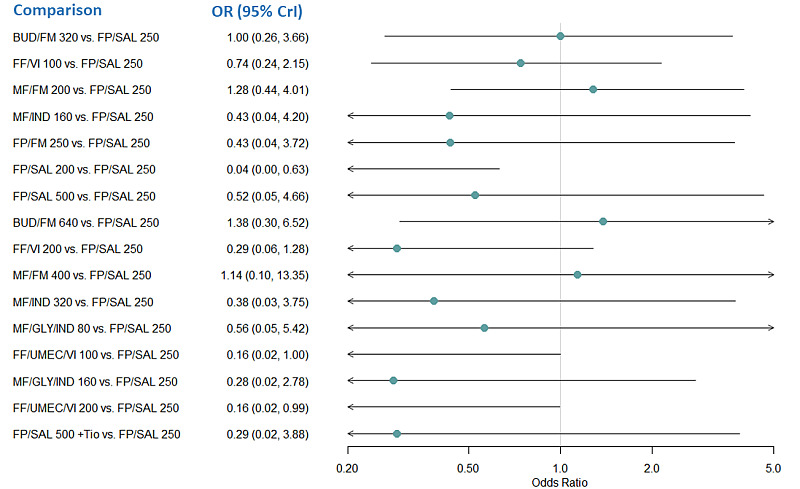
Forest plot of odds ratios for dropouts due to AEs relative to FP/SAL 250 for dropouts due to AEs for individual treatments.
Odds ratio less than one favors the comparator treatment. BUD: budesonide, Crl: credible interval, FF: fluticasone furoate, FM: formoterol, FP: fluticasone propionate, GLY: glycopyrronium, IND: indacaterol, MF: mometasone furoate,OR: odds ratio, SAL: salmeterol, Tio: tiotropium, UMEC: umeclidinium, VI: vilanterol.
56. Odds ratio for dropouts due to AEs for individual treatments (fixed‐effect model).
| Comparison | Odds Ratio (95% CrI) |
| BUD/FM 320 vs. FP/SAL 250 | 0.998 (0.264, 3.664) |
| FF/VI 100 vs. FP/SAL 250 | 0.740 (0.239, 2.146) |
| MF/FM 200 vs. FP/SAL 250 | 1.277 (0.435, 4.007) |
| MF/IND 160 vs. FP/SAL 250 | 0.432 (0.038, 4.198) |
| FP/FM 250 vs. FP/SAL 250 | 0.433 (0.037, 3.724) |
| FP/SAL 200 vs. FP/SAL 250 | 0.036 (0.0002, 0.628) |
| FP/SAL 500 vs. FP/SAL 250 | 0.524 (0.050, 4.655) |
| BUD/FM 640 vs. FP/SAL 250 | 1.377 (0.296, 6.523) |
| FF/VI 200 vs. FP/SAL 250 | 0.290 (0.059, 1.280) |
| MF/FM 400 vs. FP/SAL 250 | 1.136 (0.095, 13.350) |
| MF/IND 320 vs. FP/SAL 250 | 0.384 (0.034, 3.745) |
| MF/GLY/IND 80 vs. FP/SAL 250 | 0.563 (0.050, 5.421) |
| FF/UMEC/VI 100 vs. FP/SAL 250 | 0.162 (0.017, 0.996) |
| MF/GLY/IND 160 vs. FP/SAL 250 | 0.281 (0.025, 2.775) |
| FF/UMEC/VI 200 vs. FP/SAL 250 | 0.160 (0.017, 0.992) |
| FP/SAL 500 +Tio vs. FP/SAL 250 | 0.289 (0.017, 3.881) |
| FF/VI 100 vs. BUD/FM 320 | 0.741 (0.133, 4.062) |
| MF/FM 200 vs. BUD/FM 320 | 1.284 (0.237, 7.314) |
| MF/IND 160 vs. BUD/FM 320 | 0.431 (0.027, 5.990) |
| FP/FM 250 vs. BUD/FM 320 | 0.445 (0.053, 2.405) |
| FP/SAL 200 vs. BUD/FM 320 | 0.035 (0.0001, 0.857) |
| FP/SAL 500 vs. BUD/FM 320 | 0.522 (0.035, 6.650) |
| BUD/FM 640 vs. BUD/FM 320 | 1.367 (0.643, 3.291) |
| FF/VI 200 vs. BUD/FM 320 | 0.289 (0.037, 2.102) |
| MF/FM 400 vs. BUD/FM 320 | 1.139 (0.070, 18.780) |
| MF/IND 320 vs. BUD/FM 320 | 0.382 (0.024,5.286) |
| MF/GLY/IND 80 vs. BUD/FM 320 | 0.560 (0.036, 7.725) |
| FF/UMEC/VI 100 vs. BUD/FM 320 | 0.159 (0.012, 1.547) |
| MF/GLY/IND 160 vs. BUD/FM 320 | 0.281 (0.018, 3.944) |
| FF/UMEC/VI 200 vs. BUD/FM 320 | 0.159 (0.012, 1.540) |
| FP/SAL 500 +Tio vs. BUD/FM 320 | 0.287 (0.013, 5.302) |
| MF/FM 200 vs. FF/VI 100 | 1.733 (0.380, 8.567) |
| MF/IND 160 vs. FF/VI 100 | 0.584 (0.041, 7.346) |
| FP/FM 250 vs. FF/VI 100 | 0.585 (0.040, 6.765) |
| FP/SAL 200 vs. FF/VI 100 | 0.048 (0.0002, 1.082) |
| FP/SAL 500 vs. FF/VI 100 | 0.709 (0.053, 8.184) |
| BUD/FM 640 vs. FF/VI 100 | 1.871 (0.288, 12.670) |
| FF/VI 200 vs. FF/VI 100 | 0.396 (0.123, 1.090) |
| MF/FM 400 vs. FF/VI 100 | 1.542 (0.105, 23.090) |
| MF/IND 320 vs. FF/VI 100 | 0.519 (0.036, 6.544) |
| MF/GLY/IND 80 vs. FF/VI 100 | 0.761 (0.054, 9.456) |
| FF/UMEC/VI 100 vs. FF/VI 100 | 0.224 (0.031, 0.927) |
| MF/GLY/IND 160 vs. FF/VI 100 | 0.381 (0.026, 4.827) |
| FF/UMEC/VI 200 vs. FF/VI 100 | 0.223 (0.031, 0.924) |
| FP/SAL 500 +Tio vs. FF/VI 100 | 0.391 (0.019, 6.641) |
| MF/IND 160 vs. MF/FM 200 | 0.335 (0.023, 4.179) |
| FP/FM 250 vs. MF/FM 200 | 0.337 (0.023, 3.791) |
| FP/SAL 200 vs. MF/FM 200 | 0.027 (0.0001, 0.608) |
| FP/SAL 500 vs. MF/FM 200 | 0.406 (0.030, 4.673) |
| BUD/FM 640 vs. MF/FM 200 | 1.072 (0.158, 7.145) |
| FF/VI 200 vs. MF/FM 200 | 0.224 (0.032, 1.427) |
| MF/FM 400 vs. MF/FM 200 | 0.884 (0.093, 8.140) |
| MF/IND 320 vs. MF/FM 200 | 0.297 (0.020, 3.727) |
| MF/GLY/IND 80 vs. MF/FM 200 | 0.435 (0.030, 5.363) |
| FF/UMEC/VI 100 vs. MF/FM 200 | 0.125 (0.010, 1.049) |
| MF/GLY/IND 160 vs. MF/FM 200 | 0.218 (0.015, 2.755) |
| FF/UMEC/VI 200 vs. MF/FM 200 | 0.124 (0.011, 1.048) |
| FP/SAL 500 +Tio vs. MF/FM 200 | 0.224 (0.011, 3.779) |
| FP/FM 250 vs. MF/IND 160 | 1.001 (0.037, 26.680) |
| FP/SAL 200 vs. MF/IND 160 | 0.082 (0.0003, 2.170) |
| FP/SAL 500 vs. MF/IND 160 | 1.206 (0.654, 2.247) |
| BUD/FM 640 vs. MF/IND 160 | 3.217 (0.208, 56.650)* |
| FF/VI 200 vs. MF/IND 160 | 0.667 (0.042, 11.580) |
| MF/FM 400 vs. MF/IND 160 | 2.659 (0.091, 84.700)* |
| MF/IND 320 vs. MF/IND 160 | 0.888 (0.455, 1.712) |
| MF/GLY/IND 80 vs. MF/IND 160 | 1.299 (0.712, 2.405) |
| FF/UMEC/VI 100 vs. MF/IND 160 | 0.366 (0.016, 7.836) |
| MF/GLY/IND 160 vs. MF/IND 160 | 0.653 (0.319, 1.311) |
| FF/UMEC/VI 200 vs. MF/IND 160 | 0.365 (0.016, 7.867) |
| FP/SAL 500 +Tio vs. MF/IND 160 | 0.684 (0.131, 2.794) |
| FP/SAL 200 vs. FP/FM 250 | 0.079 (0.0003, 3.709) |
| FP/SAL 500 vs. FP/FM 250 | 1.207 (0.048, 30.870) |
| BUD/FM 640 vs. FP/FM 250 | 3.139 (0.482, 30.040) |
| FF/VI 200 vs. FP/FM 250 | 0.668 (0.045, 11.700) |
| MF/FM 400 vs. FP/FM 250 | 2.653 (0.099, 84.660)* |
| MF/IND 320 vs. FP/FM 250 | 0.888 (0.033, 23.970) |
| MF/GLY/IND 80 vs. FP/FM 250 | 1.305 (0.049, 35.030) |
| FF/UMEC/VI 100 vs. FP/FM 250 | 0.367 (0.017, 7.834) |
| MF/GLY/IND 160 vs. FP/FM 250 | 0.654 (0.024, 17.880) |
| FF/UMEC/VI 200 vs. FP/FM 250 | 0.365 (0.017, 7.886) |
| FP/SAL 500 +Tio vs. FP/FM 250 | 0.672 (0.019, 22.980) |
| FP/SAL 500 vs. FP/SAL 200 | 14.560 (0.595, 3358)* |
| BUD/FM 640 vs. FP/SAL 200 | 39.890 (1.448, 9944)* |
| FF/VI 200 vs. FP/SAL 200 | 8.274 (0.295, 2017)* |
| MF/FM 400 vs. FP/SAL 200 | 34.560 (0.684, 11170)* |
| MF/IND 320 vs. FP/SAL 200 | 10.740 (0.410, 2534)* |
| MF/GLY/IND 80 vs. FP/SAL 200 | 15.800 (0.606, 3707)* |
| FF/UMEC/VI 100 vs. FP/SAL 200 | 4.603 (0.116, 1234)* |
| MF/GLY/IND 160 vs. FP/SAL 200 | 7.914 (0.297, 1863)* |
| FF/UMEC/VI 200 vs. FP/SAL 200 | 4.583 (0.115, 1239)* |
| FP/SAL 500 +Tio vs. FP/SAL 200 | 8.346 (0.227, 2184)* |
| BUD/FM 640 vs. FP/SAL 500 | 2.655 (0.186, 44.82) |
| FF/VI 200 vs. FP/SAL 500 | 0.550 (0.038, 9.071) |
| MF/FM 400 vs. FP/SAL 500 | 2.201 (0.080, 66.500)* |
| MF/IND 320 vs. FP/SAL 500 | 0.737 (0.386, 1.380) |
| MF/GLY/IND 80 vs. FP/SAL 500 | 1.076 (0.604, 1.933) |
| FF/UMEC/VI 100 vs. FP/SAL 500 | 0.302 (0.014, 6.159) |
| MF/GLY/IND 160 vs. FP/SAL 500 | 0.542 (0.270, 1.059) |
| FF/UMEC/VI 200 vs. FP/SAL 500 | 0.303 (0.014, 6.152) |
| FP/SAL 500 +Tio vs. FP/SAL 500 | 0.567 (0.110, 2.288) |
| FF/VI 200 vs. BUD/FM 640 | 0.208 (0.023, 1.777) |
| MF/FM 400 vs. BUD/FM 640 | 0.820 (0.045, 15.230) |
| MF/IND 320 vs. BUD/FM 640 | 0.275 (0.015, 4.245) |
| MF/GLY/IND 80 vs. BUD/FM 640 | 0.404 (0.023, 6.212) |
| FF/UMEC/VI 100 vs. BUD/FM 640 | 0.115 (0.008, 1.276) |
| MF/GLY/IND 160 vs. BUD/FM 640 | 0.202 (0.011, 3.165) |
| FF/UMEC/VI 200 vs. BUD/FM 640 | 0.114 (0.008, 1.270) |
| FP/SAL 500 +Tio vs. BUD/FM 640 | 0.208 (0.008, 4.223) |
| MF/FM 400 vs. FF/VI 200 | 3.941 (0.222, 73.760)* |
| MF/IND 320 vs. FF/VI 200 | 1.333 (0.076, 21.060) |
| MF/GLY/IND 80 vs. FF/VI 200 | 1.950 (0.112, 30.490) |
| FF/UMEC/VI 100 vs. FF/VI 200 | 0.565 (0.071, 2.938) |
| MF/GLY/IND 160 vs. FF/VI 200 | 0.978 (0.055, 15.580) |
| FF/UMEC/VI 200 vs. FF/VI 200 | 0.565 (0.071, 2.935) |
| FP/SAL 500 +Tio vs. FF/VI 200 | 1.002 (0.040, 21.050) |
| MF/IND 320 vs. MF/FM 400 | 0.333 (0.011, 9.713) |
| MF/GLY/IND 80 vs. MF/FM 400 | 0.488 (0.016, 14.170) |
| FF/UMEC/VI 100 vs. MF/FM 400 | 0.139 (0.005, 3.022) |
| MF/GLY/IND 160 vs. MF/FM 400 | 0.244 (0.008, 7.258) |
| FF/UMEC/VI 200 vs. MF/FM 400 | 0.138 (0.005, 3.057) |
| FP/SAL 500 +Tio vs. MF/FM 400 | 0.251 (0.006, 9.248) |
| MF/GLY/IND 80 vs. MF/IND 320 | 1.463 (0.788, 2.773) |
| FF/UMEC/VI 100 vs. MF/IND 320 | 0.412 (0.018, 8.829) |
| MF/GLY/IND 160 vs. MF/IND 320 | 0.736 (0.354, 1.502) |
| FF/UMEC/VI 200 vs. MF/IND 320 | 0.412 (0.018, 8.908) |
| FP/SAL 500 +Tio vs. MF/IND 320 | 0.771 (0.147, 3.188) |
| FF/UMEC/VI 100 vs. MF/GLY/IND 80 | 0.281 (0.012, 6.043) |
| MF/GLY/IND 160 vs. MF/GLY/IND 80 | 0.504 (0.260, 0.937) |
| FF/UMEC/VI 200 vs. MF/GLY/IND 80 | 0.281 (0.012, 6.009) |
| FP/SAL 500 +Tio 5 vs. MF/GLY/IND 80 | 0.529 (0.109, 1.941) |
| MF/GLY/IND 160 vs. FF/UMEC/VI 100 | 1.787 (0.081, 41.780) |
| FF/UMEC/VI 200 vs. FF/UMEC/VI 100 | 1.000 (0.107, 9.359) |
| FP/SAL 500 +Tio vs. FF/UMEC/VI 100 | 1.831 (0.062, 54.540)* |
| FF/UMEC/VI 200 vs. MF/GLY/IND 160 | 0.560 (0.024, 12.210) |
| FP/SAL 500 +Tio vs. MF/GLY/IND 160 | 1.052 (0.210, 4.076) |
| FP/SAL 500 +Tio vs. FF/UMEC/VI 200 | 1.837 (0.062, 54.250)* |
The second named treatment is the baseline intervention. Odds ratio less than one favours the treatment named first in the comparisons. Treatment comparisons in bold do not include the “null” effect. *ORs are extremely uncertain due to network sparsity and should be interpreted with caution. BUD: budesonide,Crl: credible interval, FF: fluticasone furoate, FM: formoterol, FP: fluticasone propionate, GLY: glycopyrronium, IND: indacaterol, MF: mometasone furoate, OR: odds ratio, SAL: salmeterol, Tio: tiotropium, UMEC: umeclidinium, VI: vilanterol.
While the ORs and their corresponding 95% CrIs comparing all treatments to FP/SAL 250/50 µg were reasonable, the ORs for some comparisons (shown in Table 74) had very wide credible intervals that effectively meant that the ORs were extremely uncertain due to the scarcity of data to make the comparisons.
The rank plots for individual treatments are presented in Figure 80, and the mean ranks are presented in Table 75. It was very unclear which treatment was best, as treatment ranks are very uncertain. Except FP/SAL 200/12.5 µg (MD‐ICS/LABA), all the treatments had probabilities much lower than 50% for each of the possible treatment ranks. While FP/SAL 200/12.5 µg has the highest probability (over 50%) of being the best treatment (median rank 1 [95% CrI 1 to 10]), all evidence for this treatment is obtained from a single study (Mansfield 2017), where no events were observed in the FP/SAL 200/12.5 µg treatment arm and the 95% CrI is very wide. The ranking results therefore should be interpreted with caution.
80.
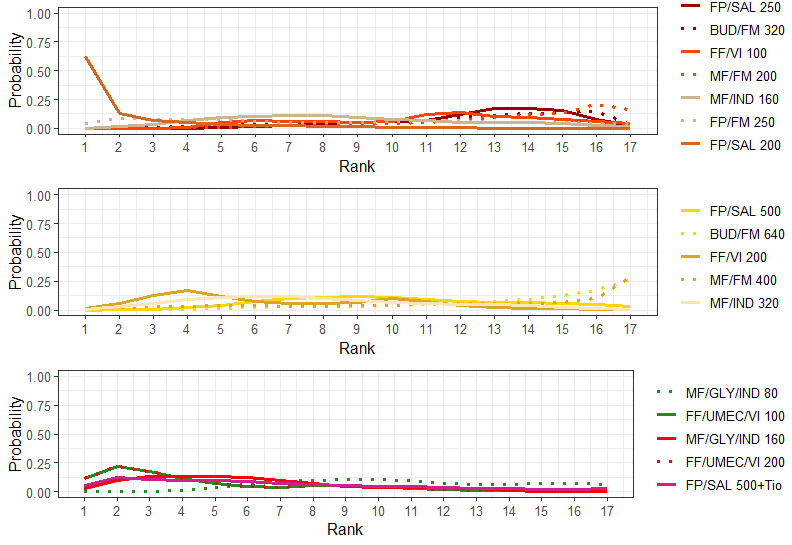
Rank plots for individual treatments for dropouts due to AEs (fixed‐effect model).
Line colors denote the treatment group. BUD: budesonide, FF: fluticasone furoate, FM: formoterol, FP: fluticasone propionate, GLY: glycopyrronium, IND: indacaterol, MF: mometasone furoate, SAL: salmeterol, Tio: tiotropium, UMEC: umeclidinium, VI: vilanterol.
57. Mean and median ranking for individual treatments for dropouts due to AEs sorted by mean rank (fixed‐effect model).
| Treatments | Mean Rank | Median Rank | 95% Credible Interval |
| FP/SAL 200 | 2.27 | 1.0 | (1.0, 10.0) |
| FF/UMEC/VI 200 | 4.73 | 3.0 | (1.0, 13.0) |
| FF/UMEC/VI 100 | 4.74 | 3.0 | (1.0, 13.0) |
| MF/GLY/IND 160 | 5.88 | 5.0 | (1.0, 13.0) |
| FF/VI 200 | 6.72 | 6.0 | (2.0, 14.0) |
| FP/SAL 500 +Tio | 6.81 | 6.0 | (1.0, 17.0) |
| MF/IND 320 | 7.82 | 7.0 | (2.0, 15.0) |
| FP/FM 250 | 8.45 | 8.0 | (1.0, 17.0) |
| MF/IND 160 | 8.71 | 8.0 | (3.0, 16.0) |
| FP/SAL 500 | 10.18 | 10.0 | (4.0, 17.0) |
| MF/GLY/IND 80 | 10.77 | 10.0 | (5.0, 17.0) |
| FF/VI 100 | 11.16 | 12.0 | (5.0, 17.0) |
| MF/FM 400 | 12.29 | 14.0 | (2.0, 17.0) |
| BUD/FM 320 | 12.30 | 13.0 | (5.0, 17.0) |
| FP/SAL 250 | 12.69 | 13.0 | (7.0, 17.0) |
| MF/FM 200 | 13.63 | 14.0 | (6.0, 17.0) |
| BUD/FM 640 | 13.85 | 15.0 | (6.0, 17.0) |
BUD: budesonide, FF: fluticasone furoate, FM: formoterol, FP: fluticasone propionate, GLY: glycopyrronium, IND: indacaterol, MF: mometasone furoate, SAL: salmeterol, Tio: tiotropium, UMEC: umeclidinium, VI: vilanterol.
Discussion
Summary of main results
We included 17,161 adolescents and adults with uncontrolled asthma who were eligible or had been treated with medium‐dose inhaled corticosteroids long‐acting beta2‐agonist (MD‐ICS/LABA) from 17 studies (median duration 26 weeks; mean age 49.1 years; male 40%; white 81%; mean forced expiratory volume in 1 second (FEV1) 1.9 litres and 61% predicted). The quality of included studies was generally good except for some outcomes in a few studies due to high attrition rates (Figure 15).
Medium‐dose (MD) and high‐dose (HD) triple therapies reduce steroid‐requiring (moderate to severe) asthma exacerbations (Hazard ratio (HR) 0.84 [95% Credible interval (CrI)0.71 to 0.99] and 0.69 [0.58 to 0.82], respectively [high certainty]), but not asthma‐related hospitalisations, compared to MD‐ICS/LABA. High‐dose triple therapy likely reduces steroid‐requiring asthma exacerbations compared to MD triple therapy (HR 0.83 [95% CrI 0.69 to 0.996], [moderate certainty]). Subgroup analyses suggest the reduction in steroid‐requiring exacerbations associated with triple therapies may be only for those with a history of asthma exacerbations in the previous year, but not for those without.
High‐dose triple therapy, but not MD‐triple, results in a reduction in all‐cause adverse events (AEs) and likely reduces dropouts due to AEs compared to MD‐ICS/LABA (OR 0.79 [95% CrI 0.69 to 0.90], [high certainty] and 0.50 [95% CrI 0.30 to 0.84], [moderate certainty], respectively). Triple therapy results in little to no difference in all‐cause or asthma‐related serious adverse events(SAEs) compared to dual therapy [high certainty].
The impact of triple therapy compared to dual therapy is less clear on symptom and quality of life scores. The network meta‐analyses (NMA) evidence suggests HD triple increases the odds of Asthma Control Questionnaire (ACQ) responder at six and 12 months (odds ratio (OR) 1.25, 95% CrI 1.07 to 1.45), [ow certainty and 1.08 (95%CrI 1.02 to 1.14), moderate certainty, respectively compared to MD‐ICS/LABA and MD Triple also does at six months (OR 1.25 [95%CrI 1.09 to 1.44], low certainty), but not at 12 months (OR 0.99 [95% CrI 0.94 to 1.05], [moderate certainty]). However, theNMAs suggest no clinically important difference in symptoms or quality of life comparing HD or MD Triple to MD‐ICS/LABA considering the minimal clinically important differences (MCIDs) [very low to moderate certainty].
The evidence suggests HD‐ICS/LABA is unlikely to result in any significant benefit or harm compared to MD‐ICS/LABA.
The evidence that any specific formulation would be better than the others within the same group in any outcomes is uncertain due to the scarcity of data and resulting imprecision of estimates.
Overall completeness and applicability of evidence
The evidence suggests little or no difference in the safety outcomes comparing HD‐ICS/LABA to MD‐ICS/LABA. However, long‐term side effects of higher ICS doses need to be addressed in phase 4 or observational studies as the maximum study duration of the included studies was 12 months, and available evidence suggests medium‐ and high‐ ICS doses are associated with increased risk of clinically important systemic side effects compared to low‐ICS doses. (Beasley 2019).
Our results may not be applicable to active smokers as they were excluded in the included studies and cigarette smoking is known to impair the efficacy of ICS treatment (Shimoda 2016).
Clinical trials for triple combination therapies included in this review did not include adolescents. The efficacy and safety of LAMAs for adolescents have not been established except for tiotropium soft mist inhaler. Although the efficacy and safety of tiotropium soft mist inhaler as add‐on to ICS, with or without another maintenance therapy, such as LABA, in the adolescent is similar to those in the adult (Hamelmann 2017), the results regarding triple combination therapies in this review may or may not be applicable to the adolescent.
A post hoc analysis in Lee 2020 showed HD‐ICS containing groups had greater improvements in both FEV1 and annualised rates of moderate to severe exacerbations in participants with higher blood eosinophils and fractional exhaled nitric oxide at baseline than did MD‐ICS containing groups. A previous meta‐analysis showed that treatment tailored using type 2 biomarkers resulted in fewer asthma exacerbations compared with traditional management but did not impact final daily ICS doses (Petsky 2018). Although, this review suggests HD‐ICS containing combinations provide no additional benefits compared with MD‐ICS combinations in the population studied, the optimal approach to ICS dosing in participants with the biomarker‐high phenotype remains to be established with further studies.
Quality of the evidence
The quality of included studies was generally good except for some outcomes in a few studies due to high attrition rates (i.e., change from baseline (CFB) in ACQ scores at 12 months in Lee 2020 and ACQ responders at 6 and 12 months in van Zyl‐Smit 2020, Figure 15). The certainty of evidence varied from very low to high which is presented in the interpretation of findings and summary of findings tables.
Potential biases in the review process
The proportions of participants who had a history of asthma exacerbation in the previous year were 33% and 60% in MD‐ and HD‐ICS/LABA groups, respectively and those in the triple therapy groups were much higher and 85% and 90% in MD and HD Triple (Table 20). This clinical heterogeneity would raise a concern for intransitivity especially for exacerbation outcomes. As the matter of fact, subgroup analyses suggest that MD and HD triples reduce moderate to severe exacerbations only for those with a history of asthma exacerbation in the previous year but not for those without. The results of pairwise analyses are qualitatively similar to those of the network meta‐analysis (NMA) and suggest that triple therapy reduces moderate to severe (steroid‐requiring) exacerbations compared to dual therapy for those with a history of exacerbation but not for those without (risk ratio (RR) 0.84 [95% CI 0.77 to 0.92] and 0.96 [0.72 to 1.20], respectively Analysis 7.7).
Agreements and disagreements with other studies or reviews
The results in this study differ in several aspects from other studies. One study included children but did not include Gessner 2020 (Kim 2021) and another study included only five studies (Rogliani 2021) while this study included 17 studies excluding children. We did not include children because the response to different ICS strengths may differ in children and indirectness could cause a significant bias if adults and children are combined and analysed together in a meta‐analysis.
This study included both pairwise and network meta‐analyses to assure the robustness whereas the others conducted either a pairwise meta‐analysis (Kim 2021) or an NMA only (Rogliani 2021). We analysed the impact of medium versus a high dose of ICS in combination therapies because of a concern for increased side effects with higher dose ICS, whereas one of the previous studies did not consider the impact of different ICS strengths in combination therapies (Kim 2021).
The definitions of asthma exacerbation varied from study to study. We classified asthma exacerbations requiring systemic corticosteroids as moderate and requiring a hospitalisation as severe.
The results on steroid‐requiring (moderate exacerbations in this study, which was defined as severe exacerbation in the others, are qualitatively similar to those in the others (Kim 2021; Rogliani 2021) except for MD triple versus. MD‐ICS/LABA. This study suggested that both MD and HD triple were likely superior to MD‐ICS/LABA in reducing steroid‐requiring asthma exacerbations, both in the pairwise meta‐analysis and NMA (moderate certainty), whereas the superiority of MD triple over MD‐ICS/LABA was not confirmed in another study (Rogliani 2021). The difference could be due to data sources. We obtained the data through Clinical Study Report reported by the manufacturer forLee 2020 and personal communications with the manufacturer for Virchow 2019a.
A moderate exacerbation was generally defined in each trial as a progressive increase in one or more asthma symptoms or a decline in lung function for two or more consecutive days that did not meet the definition of severe asthma exacerbation and one study reported a reduced risk of moderate to severe exacerbations (RR 0.79 [95% CrI 0.65 to 0.94]) comparing HD‐ICS/LABA to MD‐ICS/LABA using the above definition (Rogliani 2021) while this study did not include such outcome because it was felt that other types of exacerbation were clinically more relevant. This study suggests HD‐ICS/LABA is unlikely to provide any additional benefit compared to MD‐ICS/LABA otherwise.
None of the previous studies reported asthma‐related hospitalisations, while this study did include them to better inform various stakeholders and found triple therapy was unlikely to reduce them compared to dual therapy.
We took MCIDs into consideration for the interpretations of continuous outcomes and found no clinically important difference between triple and dual therapies while others concluded that triple therapy was “effective in uncontrolled asthma” and “associated with modest improvement in asthma control” compared with dual therapy based on statistical differences (Kim 2021; Rogliani 2021), which may not be of clinical importance. In this study, HD triple results in a reduction in all‐cause AEs and likely reduces dropouts due to AEs compared to MD‐ICS/LABA, whereas the previous study reported “triple therapy was significantly associated with increased dry mouth and dysphonia compared to dual therapy” (Kim 2021). The results on SAEs were qualitatively similar between ours and the others’ concluding that triple therapy resulted in little to no difference compared to dual therapy.
Authors' conclusions
Implications for practice.
Medium‐dose (MD) and high‐dose (HD)triple therapies reduce steroid‐requiring (moderate to severe) asthma exacerbations, but not asthma‐related hospitalisations, compared to medium‐dose inhaled corticosteroids long‐acting beta2‐agonist (MD‐ICS/LABA)MD‐ICS/LABA) especially in those with a history of asthma exacerbations. High‐dose triple therapy is likely superior to MD triple therapy in reducing steroid‐requiring asthma exacerbations.
Triple therapy is unlikely to result in clinically meaningful improvement in symptoms or quality of life compared to dual therapy considering the minimal clinically important differences (MCIDs).
HD triple therapy, but not MD triple, results in a reduction in all‐cause adverse events (AEs) and likely reduces dropouts due to AEs compared to MD‐ICS/LABA. Triple therapy results in little to no difference in all‐cause or asthma‐related SAEs compared to dual therapy.
HD‐ICS/LABA is unlikely to result in any significant benefit or harm compared to MD‐ICS/LABA.
Above findings would help to guide the choice of treatment when asthma is not controlled with MD‐ICS/LABA.
Implications for research.
Long‐term side effects of high‐dose dual and triple combination therapies need to be addressed in phase 4 or observational studies as the maximum duration of included studies was 12 months. Studies including active smokers are also needed.
History
Protocol first published: Issue 11, 2020
Risk of bias
Risk of bias for analysis 7.1 HD‐ICS/LABA vs MD‐ICS/LABA.
| Study | Bias | |||||||||||
| Randomisation process | Deviations from intended interventions | Missing outcome data | Measurement of the outcome | Selection of the reported results | Overall | |||||||
| Authors' judgement | Support for judgement | Authors' judgement | Support for judgement | Authors' judgement | Support for judgement | Authors' judgement | Support for judgement | Authors' judgement | Support for judgement | Authors' judgement | Support for judgement | |
| Subgroup 7.1.1 High Risk | ||||||||||||
| Kerstjens 2020 | Low risk of bias | No significant issues | Low risk of bias | No significant issues | Low risk of bias | No significant issues | Low risk of bias | No significant issues | Low risk of bias | No significant issues | Low risk of bias | No significant issues |
| Subgroup 7.1.2 Low Risk | ||||||||||||
| Bernstein 2015 | Low risk of bias | No significant issues | Low risk of bias | No significant issues | Low risk of bias | No significant issues | Low risk of bias | No significant issues | Low risk of bias | No significant issues | Low risk of bias | No significant issues |
| Lee 2020 | Low risk of bias | No significant issues | Low risk of bias | No significant issues | Low risk of bias | No significant issues | Low risk of bias | No significant issues | Low risk of bias | No significant issues | Low risk of bias | No significant issues |
| Mansfield 2017 | Low risk of bias | No significant issues | Some concerns | Open label study | Low risk of bias | No significant issues | Low risk of bias | No significant issues | Low risk of bias | No significant issues | Some concerns | Open label study |
| Peters 2008 | Low risk of bias | No significant issues | Low risk of bias | No significant issues | Low risk of bias | No significant issues | Low risk of bias | No significant issues | Low risk of bias | No significant issues | Low risk of bias | No significant issues |
| van Zyl‐Smit 2020 | Low risk of bias | No significant issues | Low risk of bias | No significant issues | Low risk of bias | No significant issues | Low risk of bias | No significant issues | Low risk of bias | No significant issues | Low risk of bias | No significant issues |
Acknowledgements
We thank Elizabeth Stovold for assisting with the search strategy.
The Background and Methods sections of this review are based on a standard template used by Cochrane Airways.
The authors and Cochrane Airways’ Editorial Team are grateful to the following peer and consumer reviewers for their time and comments:
Richard N van Zyl‐Smit, University of Cape Town Lung Institute (South Africa); Ian Pavord, University of Oxford (UK); Alexis Aningalan (USA); and Jefferson Antonio Buendia Rodriguez, Universidad de Antioquia (Columbia).
This project was supported by the National Institute for Health and Care Research, via Cochrane Infrastructure funding to Cochrane Airways. The views and opinions expressed therein are those of the authors and do not necessarily reflect those of the Systematic Reviews Programme, NIHR, NHS or the Department of Health and Social Care.
Appendices
Appendix 1. Database search strategies
| Database/search platform/date of last search | Search strategy | Results |
| Airways Register (via Cochrane Register of Studies) Date of most recent search: 1 December 2020 | #1 MESH DESCRIPTOR Asthma EXPLODE ALL AND INSEGMENT #2 asthma*:ti,ab AND INSEGMENT #3 #1 OR #2 #4 MESH DESCRIPTOR Formoterol Fumarate AND INSEGMENT #5 MESH DESCRIPTOR Salmeterol Xinafoate AND INSEGMENT #6 formoterol:ti,ab AND INSEGMENT #7 salmeterol:ti,ab AND INSEGMENT #8 indacaterol:ti,ab AND INSEGMENT #9 vilanterol:ti,ab AND INSEGMENT #10 #4 OR #5 OR #6 OR #7 OR #8 OR #9 #11 MESH DESCRIPTOR Budesonide AND INSEGMENT #12 MESH DESCRIPTOR Fluticasone AND INSEGMENT #13 MESH DESCRIPTOR Beclomethasone AND INSEGMENT #14 budesonide:ti,ab AND INSEGMENT #15 fluticasone:ti,ab AND INSEGMENT #16 mometasone:ti,ab AND INSEGMENT #17 beclomethasone:ti,ab AND INSEGMENT #18 ciclesonide:ti,ab AND INSEGMENT #19 (inhal* NEAR3 (steroid* or corticosteroid* or glucocorticoid*)):ti,ab AND INSEGMENT #20 #11 OR #12 OR #13 OR #14 OR #15 OR #16 OR #17 OR #18 OR #19 #21 MESH DESCRIPTOR Budesonide, Formoterol Fumarate Drug Combination AND INSEGMENT #22 MESH DESCRIPTOR Mometasone Furoate, Formoterol Fumarate Drug Combination AND INSEGMENT #23 MESH DESCRIPTOR Fluticasone‐Salmeterol Drug Combination AND INSEGMENT #24 #21 OR #22 OR #23 #25 #3 AND #10 AND #20 #26 #3 AND #24 #27 #25 OR #26 #28 (2008 or 2009 or 2010 or 2011 or 2012 or 2013 or 2014 or 2015 or 2016 or 2017 or 2018 or 2019 or 2020):yr AND INSEGMENT #29 #27 AND #28 #30 INREGISTER #31 #29 AND #30 | Dec 2020=915 |
| CENTRAL (via Cochrane Register of Studies) Date of most recent search: 1 December 2020 | #1 MESH DESCRIPTOR Asthma EXPLODE ALL AND CENTRAL:TARGET #2 asthma*:ti,ab AND CENTRAL:TARGET #3 #1 OR #2 AND CENTRAL:TARGET #4 MESH DESCRIPTOR Formoterol Fumarate AND CENTRAL:TARGET #5 MESH DESCRIPTOR Salmeterol Xinafoate AND CENTRAL:TARGET #6 formoterol:ti,ab AND CENTRAL:TARGET #7 salmeterol:ti,ab AND CENTRAL:TARGET #8 indacaterol:ti,ab AND CENTRAL:TARGET #9 vilanterol:ti,ab AND CENTRAL:TARGET #10 #4 OR #5 OR #6 OR #7 OR #8 OR #9 AND CENTRAL:TARGET #11 MESH DESCRIPTOR Budesonide AND CENTRAL:TARGET #12 MESH DESCRIPTOR Fluticasone AND CENTRAL:TARGET #13 MESH DESCRIPTOR Beclomethasone AND CENTRAL:TARGET #14 budesonide:ti,ab AND CENTRAL:TARGET #15 fluticasone:ti,ab AND CENTRAL:TARGET #16 mometasone:ti,ab AND CENTRAL:TARGET #17 beclomethasone:ti,ab AND CENTRAL:TARGET #18 ciclesonide:ti,ab AND CENTRAL:TARGET #19 (inhal* NEAR3 (steroid* or corticosteroid* or glucocorticoid*)):ti,ab AND CENTRAL:TARGET #20 #11 OR #12 OR #13 OR #14 OR #15 OR #16 OR #17 OR #18 OR #19 AND CENTRAL:TARGET #21 MESH DESCRIPTOR Budesonide, Formoterol Fumarate Drug Combination AND CENTRAL:TARGET #22 MESH DESCRIPTOR Mometasone Furoate, Formoterol Fumarate Drug Combination AND CENTRAL:TARGET #23 MESH DESCRIPTOR Fluticasone‐Salmeterol Drug Combination AND CENTRAL:TARGET #24 #21 OR #22 OR #23 AND CENTRAL:TARGET #25 #3 AND #10 AND #20 AND CENTRAL:TARGET #26 #3 AND #24 AND CENTRAL:TARGET #27 #25 OR #26 AND CENTRAL:TARGET #28 (2008 or 2009 or 2010 or 2011 or 2012 or 2013 or 2014 or 2015 or 2016 or 2017 or 2018 or 2019 or 2020):yr AND CENTRAL:TARGET #29 #27 AND #28 AND CENTRAL:TARGET | Dec 2020=1665 |
| MEDLINE (Ovid) ALL Date of most recent search: 1 December 2020 | 1 exp Asthma/ 2 asthma$.tw. 3 1 or 2 4 Formoterol Fumarate/ 5 Salmeterol Xinafoate/ 6 formoterol.tw. 7 salmeterol.tw. 8 indacaterol.mp. 9 vilanterol.mp. 10 or/4‐9 11 Budesonide/ 12 Fluticasone/ 13 Mometasone Furoate/ 14 Beclomethasone/ 15 budesonide.tw. 16 fluticasone.tw. 17 mometasone.tw. 18 beclomethasone.tw. 19 ciclesonide.mp. 20 (inhal$ adj3 (steroid$ or corticosteroid$ or glucocorticoid$)).tw. 21 or/11‐20 22 Budesonide, Formoterol Fumarate Drug Combination/ 23 Mometasone Furoate, Formoterol Fumarate Drug Combination/ 24 Fluticasone‐Salmeterol Drug Combination/ 25 or/22‐24 26 3 and 10 and 21 27 3 and 25 28 26 or 27 29 (controlled clinical trial or randomized controlled trial).pt. 30 (randomized or randomised).ab,ti. 31 placebo.ab,ti. 32 dt.fs. 33 randomly.ab,ti. 34 trial.ab,ti. 35 groups.ab,ti. 36 or/29‐35 37 Animals/ 38 Humans/ 39 37 not (37 and 38) 40 36 not 39 41 28 and 40 42 limit 41 to yr="2008 ‐Current" | Dec 2020=993 |
| Embase (Ovid) Date of most recent search: 1 December 2020 | 1 exp asthma/ 2 asthma$.tw. 3 1 or 2 4 formoterol fumarate/ 5 salmeterol xinafoate/ 6 formoterol.tw. 7 salmeterol.tw. 8 indacaterol.mp. 9 vilanterol.mp. 10 or/4‐9 11 budesonide/ 12 fluticasone/ 13 mometasone furoate/ 14 beclometasone/ 15 budesonide.tw. 16 fluticasone.tw. 17 mometasone.tw. 18 beclomethasone.tw. 19 ciclesonide.mp. 20 (inhal$ adj3 (steroid$ or corticosteroid$ or glucocorticoid$)).tw. 21 or/11‐20 22 budesonide plus formoterol/ 23 formoterol fumarate plus mometasone furoate/ 24 exp fluticasone propionate plus salmeterol/ 25 or/22‐24 26 3 and 10 and 21 27 3 and 25 28 26 or 27 29 Randomized Controlled Trial/ 30 randomization/ 31 controlled clinical trial/ 32 Double Blind Procedure/ 33 Single Blind Procedure/ 34 Crossover Procedure/ 35 (clinica$ adj3 trial$).tw. 36 ((singl$ or doubl$ or trebl$ or tripl$) adj3 (mask$ or blind$ or method$)).tw. 37 exp Placebo/ 38 placebo$.ti,ab. 39 random$.ti,ab. 40 ((control$ or prospectiv$) adj3 (trial$ or method$ or stud$)).tw. 41 (crossover$ or cross‐over$).ti,ab. 42 or/29‐41 43 exp animals/ or exp invertebrate/ or animal experiment/ or animal model/ or animal tissue/ or animal cell/ or nonhuman/ 44 human/ or normal human/ or human cell/ 45 43 and 44 46 43 not 45 47 42 not 46 48 28 and 47 49 limit 48 to yr="2008 ‐Current" | Dec 2020=1758 |
| Global Health (Ovid) Date of most recent search: 1 December 2020 | 1 exp asthma/ 2 asthma$.tw. 3 1 or 2 4 formoterol.tw. 5 salmeterol.tw. 6 indacaterol.mp. 7 vilanterol.mp. 8 4 or 5 or 6 or 7 9 exp corticoids/ 10 budesonide.tw. 11 fluticasone.tw. 12 mometasone.tw. 13 beclomethasone.tw. 14 ciclesonide.mp. 15 (inhal$ adj3 (steroid$ or corticosteroid$ or glucocorticoid$)).tw. 16 or/9‐15 17 3 and 8 and 16 18 randomized controlled trials/ 19 (randomized or randomised).ab,ti. 20 placebo.ab,ti. 21 randomly.ab,ti. 22 trial.ab,ti. 23 or/18‐22 24 17 and 23 25 limit 24 to yr="2008 ‐Current" | Dec 2020=32 |
| ClinicalTrials.gov Date of most recent search: 1 December 2020 | Study type: Interventional
Condition: asthma Intervention: (formoterol OR salmeterol OR indacaterol OR vilanterol) AND (budesonide OR fluticasone OR mometasone OR beclomethasone OR ciclesonide) |
Dec 2020=270 |
Appendix 2. Data table for studies included for severe exacerbations
| Dichotomous Data | |||
| Study | Treatment | N | n of participants with the event |
|
Bernstein 2015* (low risk group) |
MD‐ICS/LABA | 346 | 0 |
| HD‐ICS/LABA | 346 | 0 | |
|
Kerstjens 2012 (high risk group) |
HD‐ICS/LABA | 456 | 20 |
| HD Triple | 457 | 16 | |
|
Lee 2020 (low risk group) |
MD‐ICS/LABA | 407 | 7 |
| HD‐ICS/LABA | 406 | 5 | |
| MD Triple | 406 | 7 | |
| HD Triple | 408 | 4 | |
|
Mansfield 2017 (low risk group) |
MD‐ICS/LABA | 174 | 2 |
| HD‐ICS/LABA | 44 | 0 | |
|
Peters 2008 (low risk group) |
MD‐ICS/LABA | 132 | 2 |
| HD‐ICS/LABA | 443 | 2 | |
|
Stempel 2016 (high risk group) |
MD‐ICS/LABA | 580 | 1 |
| HD‐ICS/LABA | 982 | 14 | |
|
van Zyl‐Smit 2020 (high risk group) |
MD‐ICS/LABA | 437 | 1 |
| HD‐ICS/LABA | 887 | 5 | |
| Log‐Hazards Data | |||
| Study | Treatment | lnHR | lnSE |
|
Kerstjens 2020† (high risk group) |
MD‐ICS/LABA | 0.637 | 0.439 |
| MD Triple | |||
|
Kerstjens 2020† (high risk group) |
HD‐ICS/LABA | 0 | 0.503 |
| HD Triple | |||
* Study was excluded from the NMA, as it contributed no evidence to the network. † Both entries from Kerstjens 2020 are from a single study but are included in the NMA as independent studies because it was not possible to calculate a covariance matrix for the reported correlated the data. HD: high dose; ICS: inhaled corticosteroids; lnHR: log hazard ratio; lnSE: log standard error; LABA: long‐acting beta‐2 agonist; MD: medium dose.
Appendix 3. Model fit parameters
| Fixed‐Effect Model | Random‐Effects Model | |
| Severe exacerbations‐ group (18 DPs) | ||
| DIC | 72.92 | 74.38 |
| Total Residual Deviance, Mean | 19.95 | 18.27 |
| Between‐study SD, Median (95% CrI) | ‐‐ | 0.30 (0.02, 0.94) |
| Severe exacerbations‐ high risk subgroup (6 DPs) | ||
| DIC | 26.54 | 28.77 |
| Total Residual Deviance, Mean† | 5.26 | 4.03 |
| Between‐study SD, Median (95% CrI) | ‐‐ | 0.263 (0.011, 0.977) |
| Severe exacerbations‐ low risk subgroup (12 DPs) | ||
| DIC | 39.86 | 46.19 |
| Total Residual Deviance, Mean† | 11.06 | 10.01 |
| Between‐study SD, Median (95% CrI) | ‐‐ | 0.314 (0.016, 1.05) |
| Severe exacerbations‐ individual treatment (36 DPs) | ||
| DIC | 95.97 | 97.45 |
| Total Residual Deviance, Mean | 33.86 | 33.92 |
| Between‐study SD, Median (95% CrI) | ‐‐ | 0.13 (0.01, 0.77) |
| Moderate to severe exacerbations‐ group (24 DPs) | ||
| DIC | 32.56 | 34.19 |
| Total Residual Deviance, Mean | 19.49 | 19.39 |
| Between‐study SD, Median (95% CrI) | ‐‐ | 0.063 (0.003, 0.243) |
| Moderate to severe exacerbations‐ high risk subgroup (12 DPs) | ||
| DIC | 17.55 | 19.26 |
| Total Residual Deviance, Mean† | 9.55 | 10.13 |
| Between‐study SD, Median (95% CrI) | ‐‐ | 0.080 (0.003, 0.411) |
| Moderate to severe exacerbations‐ low risk subgroup (12 DPs) | ||
| DIC | 18.33 | 19.24 |
| Total Residual Deviance, Mean† | 10.35 | 10.08 |
| Between‐study SD, Median (95% CrI) | ‐‐ | 0.18 (0.01, 0.67) |
| Moderate to severe exacerbations‐ individual treatment (36 DPs) | ||
| DIC | 224.90 | 231.30 |
| Total Residual Deviance, Mean | 33.86 | 33.92 |
| Between‐study SD, Median (95% CrI) | ‐‐ | 0.13 (0.01, 0.77) |
| Change from baseline in ACQ scores at 3 months‐group (10 DPs) | ||
| DIC | 15.23 | 16.62 |
| Total Residual Deviance, Mean | 8.24 | 8.59 |
| Between‐study SD, Median (95% CrI) | ‐‐ | 0.032 (0.001, 0.108) |
| Change from baseline in ACQ scores at 6 months‐group (16 DPs) | ||
| DIC | 26.68 | 27.48 |
| Total Residual Deviance, Mean | 17.78 | 15.51 |
| Between‐study SD, Median (95% CrI) | ‐‐ | 0.040 (0.002, 0.128) |
| Change from baseline in ACQ scores at 12 months‐group (14 DPs) | ||
| DIC | 24.90 | 24.11 |
| Total Residual Deviance, Mean | 16.91 | 13.36 |
| Between‐study SD, Median (95% CrI) | ‐‐ | 0.061 (0.006, 0.130) |
| Change from baseline in AQLQ scores at 6 months‐group (8 DPs) | ||
| DIC | 15.69 | 15.64 |
| Total Residual Deviance, Mean | 8.69 | 8.07 |
| Between‐study SD, Median (95% CrI) | ‐‐ | 0.132 (0.006, 0.270) |
| Change from baseline in AQLQ scores at 12 months ‐ group (10 DPs) | ||
| DIC | 17.85 | 18.32 |
| Total Residual Deviance, Mean | 10.86 | 9.71 |
| Between‐study SD, Median (95% CrI) | ‐‐ | 0.073 (0.004, 0.219) |
| ACQ responders at 6 months – group (18 DPs) | ||
| DIC | 31.45 | 31.65 |
| Total Residual Deviance, Mean | 21.43 | 19.94 |
| Between‐study SD, Median (95% CrI) | ‐‐ | 0.038 (0.002, 0.190) |
| ACQ responders at 6 months ‐ individual treatment (11 DPs) | ||
| DIC | 18.75 | 19.09 |
| Total Residual Deviance, Mean | 10.75 | 10.54 |
| Between‐study SD, Median (95% CrI) | ‐‐ | 0.035 (0.002, 0.258) |
| ACQ responders at 12 months ‐ group (12 DPs) | ||
| DIC | 26.70 | 25.06 |
| Total Residual Deviance, Mean | 18.69 | 14.70 |
| Between‐study SD, Median (95% CrI) | ‐‐ | 0.092 (0.003, 0.371) |
| ACQ responders at 12 months ‐ individual treatment (8 DPs) | ||
| DIC | 17.51 | 16.92 |
| Total Residual Deviance, Mean | 11.51 | 9.83 |
| Between‐study SD, Median (95% CrI) | ‐‐ | 0.071 (0.003, 0.513) |
| All‐cause SAEs ‐ group (30 DPs) | ||
| DIC | 46.04 | 46.59 |
| Total Residual Deviance, Mean | 30.04 | 29.73 |
| Between‐study SD, Median (95% CrI) | ‐‐ | 0.033 (0.002, 0.228) |
| All‐cause SAEs ‐ individual treatment (28 DPs) | ||
| DIC | 49.67 | 49.67 |
| Total Residual Deviance, Mean | 26.27 | 26.14 |
| Between‐study SD, Median (95% CrI) | ‐‐ | 0.038 (0.002, 0.300) |
| Asthma‐related SAEs ‐ group (26 DPs) | ||
| DIC | 33.38 | 33.59 |
| Total Residual Deviance, Mean | 19.20 | 19.22 |
| Between‐study SD, Median (95% CrI) | ‐‐ | 0.034 (0.002, 0.252) |
| Asthma‐related SAEs‐ individual treatment (26 DPs) | ||
| DIC | 123.60 | 123.80 |
| Total Residual Deviance, Mean | 22.80 | 22.86 |
| Between‐study SD, Median (95% CrI) | ‐‐ | 0.08 (0.004, 0.634) |
| All‐cause AEs ‐ group (28 DPs) | ||
| DIC | 40.88 | 41.66 |
| Total Residual Deviance, Mean | 25.87 | 25.67 |
| Between‐study SD, Median (95% CrI) | ‐‐ | 0.024 (0.002, 0.123) |
| All‐cause AEs ‐ individual treatment (32 DPs) | ||
| DIC | 57.73 | 58.34 |
| Total Residual Deviance, Mean | 29.65 | 28.54 |
| Between‐study SD, Median (95% CrI) | ‐‐ | 0.027 (0.002, 0.170) |
| Dropouts due to AEs ‐ group (28 DPs) | ||
| DIC | 49.64 | 49.66 |
| Total Residual Deviance, Mean | 34.31 | 33.22 |
| Between‐study SD, Median (95% CrI) | ‐‐ | 0.058 (0.003, 0.603) |
| Dropouts due to AEs ‐ individual treatment (34 DPs) | ||
| DIC | 170.10 | 170.50 |
| Total Residual Deviance, Mean | 33.79 | 33.82 |
| Between‐study SD, Median (95% CrI) | ‐‐ | 0.091 (0.005, 0.812) |
ACQ: Asthma Control Questionnaire, AE: adverse event, AQLQ: Asthma Quality of Life Questionnaire, CrI: credible interval; DIC: deviance information criterion; DP: data point, SAE: serious adverse event, SD: standard deviation.
Appendix 4. Data table for studies included for severe exacerbations for individual treatments
| Dichotomous Data | |||
| Study | Treatment (dose in micrograms) | N | n of participants with the event |
| Bernstein 2015* | FF/VI 100/25 qd | 346 | 0 |
| FF/VI 200/25 qd | 346 | 0 | |
| Bodzenta‐Lukaszyk 2012 | BUD/FM 320/12 bid | 139 | 1 |
| FP/FM 250/10 bid | 140 | 0 | |
| Busse 2008 | FP/SAL 250/50 bid | 404 | 2 |
| BUD/FM 320/12 bid | 422 | 1 | |
| Lee 2020 | FF/VI 100/25 qd | 407 | 7 |
| FF/VI 200/25 qd | 406 | 5 | |
| FF/UMEC/VI 100/62.5/25 qd | 406 | 7 | |
| FF/UMEC/VI 200/62.5/25 qd | 408 | 4 | |
| Mansfield 2017 | FP/SAL 250/50 bid | 41 | 0 |
| FP/SAL 200/12.5 bid | 133 | 2 | |
| FP/SAL 500/50 bid | 44 | 0 | |
| Peters 2008 | BUD/FM 320/12 bid | 132 | 2 |
| BUD/FM 640/18 bid | 443 | 2 | |
| Stempel 2016 | FP/SAL 250/50 bid | 580 | 1 |
| FP/SAL 500/50 bid | 982 | 14 | |
| van Zyl‐Smit 2020 | MF/IND 160/150 qd | 437 | 1 |
| FP/SAL 500/50 bid | 444 | 2 | |
| MF/IND 320/150 qd | 443 | 3 | |
| Woodcock 2013 | FP/SAL 250/50 bid | 403 | 2 |
| FF/VI 100/25 qd | 403 | 1 | |
| Log‐Hazards Data | |||
| Study | Treatment | lnHR | lnSE |
| Kerstjens 2020† | MF/IND 160/150 qd | 0.637 | 0.439 |
| MF/GLY/IND 80/50/150 qd | |||
| Kerstjens 2020† | FP/SAL 500/50 bid | 0 | 0.503 |
| MF/GLY/IND 160/50/150 qd | |||
* Study was excluded from the NMA, as it contributed no evidence to the network. † Both entries from Kerstjens 2020 are from a single study but are included in the NMA as independent studies because it was not possible to calculate a covariance matrix for the reported correlated the data. bid= twice daily, BUD=budesonide, FF=fluticasone furoate, FM=formoterol, FP=fluticasone propionate, GLY= glycopyrronium, IND=indacaterol, lnHR= log hazard ratio, lnSE= log standard error, MF=mometasone furoate, qd= once daily, SAL=salmeterol, Tio=tiotropium, UMEC= umeclidinium, VI=vilanterol.
Appendix 5. Data table for studies included for moderate to severe exacerbations
| Dichotomous Data | |||
| Study | Treatment | N | n of participants with the event |
|
Bernstein 2015 (low risk group) |
MD‐ICS/LABA | 346 | 3 |
| HD‐ICS/LABA | 346 | 4 | |
|
Gessner 2020 (high risk group) |
MD Triple | 474 | 4 |
| HD Triple | 951 | 4 | |
|
Kerstjens 2012 (high risk group) |
HD‐ICS/LABA | 454 | 149 |
| HD Triple | 454 | 122 | |
|
Kerstjens 2020 (high risk group) |
MD‐ICS/LABA | 607 | 166 |
| HD‐ICS/LABA | 1223 | 324 | |
| MD Triple | 616 | 151 | |
| HD Triple | 615 | 134 | |
|
Lee 2020 (low risk group) |
MD‐ICS/LABA | 407 | 77 |
| HD‐ICS/LABA | 406 | 57 | |
| MD Triple | 406 | 72 | |
| HD Triple | 408 | 57 | |
|
Mansfield 2017 (low risk group) |
MD‐ICS/LABA | 174 | 8 |
| HD‐ICS/LABA | 44 | 2 | |
|
Peters 2008 (low risk group) |
MD‐ICS/LABA | 132 | 19 |
| HD‐ICS/LABA | 443 | 54 | |
| van Zyl‐Smit 2020 | MD‐ICS/LABA | 437 | 43 |
| HD‐ICS/LABA | 887 | 89 | |
|
Virchow 2019a (high risk group) |
MD‐ICS/LABA | 575 | 119 |
| MD Triple | 573 | 90 | |
|
Virchow 2019b (high risk group) |
HD‐ICS/LABA | 570 | 138 |
| HD Triple | 859 | 166 | |
HD: high dose; ICS: inhaled corticosteroids; LABA: long‐acting beta‐2 agonist; MD: medium dose.
Appendix 6. Data table for studies included for moderate to severe exacerbations for individual treatments
| Dichotomous Data | |||
| Study | Treatment (dose in micrograms) | N | n of participants with the event |
| Bernstein 2011 | FP/SAL 250/50 bid | 351 | 20 |
| MF/FM 200/10 bid | 371 | 21 | |
| Bernstein 2015 | FF/VI 100/25 qd | 346 | 3 |
| FF/VI 200/25 qd | 346 | 4 | |
| Bodzenta‐Lukaszyk 2012 | BUD/FM 320/12 bid | 139 | 2 |
| FP/FM 250/10 bid | 140 | 1 | |
| Busse 2008 | FP/SAL 250/50 bid | 404 | 50 |
| BUD/FM 320/12 bid | 422 | 49 | |
| Cukier 2013 | BUD/FM 320/12 bid | 99 | 6 |
| FP/FM 250/10 bid | 97 | 6 | |
| Gessner 2020 | MF/GLY/IND 80/50/150 qd | 474 | 4 |
| MF/GLY/IND 160/50/150 qd | 476 | 2 | |
| FP/SAL 500/50 bid + Tio 5 qd | 475 | 2 | |
| Kerstjens 2020 | MF/IND 160/150 qd | 607 | 166 |
| FP/SAL 500/50 bid | 612 | 182 | |
| MF/IND 320/150 qd | 611 | 142 | |
| MF/GLY/IND 80/50/150 qd | 616 | 151 | |
| MF/GLY/IND 160/50/150 qd | 615 | 134 | |
| Lee 2020 | FF/VI 100/25 qd | 407 | 77 |
| FF/VI 200/25 qd | 406 | 57 | |
| FF/UMEC/VI 100/62.5/25 qd | 406 | 72 | |
| FF/UMEC/VI 200/62.5/25 qd | 408 | 57 | |
| Mansfield 2017 | FP/SAL 250/50 bid | 41 | 0 |
| FP/SAL 200/12.5 bid | 133 | 8 | |
| FP/SAL 500/50 bid | 44 | 2 | |
| Papi 2007 | FP/SAL 250/50 bid | 113 | 6 |
| BDP/FM 200/12 bid | 115 | 2 | |
| Peters 2008 | BUD/FM 320/12 bid | 132 | 19 |
| BUD/FM 640/18 bid | 443 | 54 | |
| van Zyl‐Smit 2020 | MF/IND 160/150 qd | 437 | 43 |
| FP/SAL 500/50 bid | 444 | 53 | |
| MF/IND 320/150 qd | 443 | 36 | |
| Virchow 2019a | BDP/FM 200/12 bid | 575 | 119 |
| BDP/FM/G 200/12/20 bid | 573 | 90 | |
| Woodcock 2013 | FP/SAL 250/50 bid | 403 | 12 |
| FF/VI 100/25 qd | 403 | 10 | |
bid= twice daily, BUD=budesonide, FF=fluticasone furoate, FM=formoterol, FP=fluticasone propionate, GLY= glycopyrronium, IND=indacaterol, MF=mometasone furoate, qd= once daily, SAL=salmeterol, Tio=tiotropium, UMEC= umeclidinium, VI=vilanterol.
Appendix 7. Data table for studies included for the change from baseline in ACQ scores at 3 months
| Study | Treatment | N | Mean CFB | SD |
| Gessner 2020 | MD Triple | 436 | ‐1.043 | 0.940 |
| HD Triple | 869 | ‐1.060 | 0.938 | |
| Lee 2020 | MD‐ICS/LABA | 379 | ‐0.579 | 0.701 |
| HD‐ICS/LABA | 382 | ‐0.607 | 0.723 | |
| MD Triple | 389 | ‐0.643 | 0.71 | |
| HD Triple | 385 | ‐0.699 | 0.667 | |
| van Zyl‐Smit 2020 | MD‐ICS/LABA | 414 | ‐0.923 | 0.834 |
| HD‐ICS/LABA | 848 | ‐0.880 | 0.844 | |
| Weinstein 2010 | MD‐ICS/LABA | 205 | ‐0.590 | 0.630 |
| HD‐ICS/LABA | 222 | ‐0.580 | 0.626 |
ACQ: Asthma Control Questionnaire; CFB: change from baseline; HD: high dose; ICS: inhaled corticosteroids; LABA: long‐acting beta‐2 agonist; MD: medium dose; SD: standard deviation.
Appendix 8. Data table for studies included for change from baseline in ACQ scores at 6 months
| Study | Treatment | N | Mean CFB | SD |
| Gessner 2020 | MD Triple | 437 | ‐1.080 | 0.962 |
| HD Triple | 888 | ‐1.111 | 0.960 | |
| Kerstjens 2012a | HD‐ICS/LABA | 222 | ‐0.580 | 1.058 |
| HD Triple | 237 | ‐0.705 | 1.047 | |
| Kerstjens 2012b | HD‐ICS/LABA | 232 | ‐0.390 | 1.036 |
| HD Triple | 216 | ‐0.589 | 1.029 | |
| Kerstjens 2020 | MD‐ICS/LABA | 598 | ‐0.886 | 0.954 |
| HD‐ICS/LABA | 1195 | ‐0.972 | 0.968 | |
| MD Triple | 595 | ‐0.957 | 0.976 | |
| HD Triple | 607 | ‐0.958 | 1.010 | |
| Lee 2020 | MD‐ICS/LABA | 371 | ‐0.637 | 0.732 |
| HD‐ICS/LABA | 374 | ‐0.720 | 0.696 | |
| MD Triple | 385 | ‐0.749 | 0.746 | |
| HD Triple | 376 | ‐0.775 | 0.640 | |
| van Zyl‐Smit 2020 | MD‐ICS/LABA | 407 | ‐1.035 | 0.706 |
| HD‐ICS/LABA | 817 | ‐1.003 | 0.715 |
ACQ: Asthma Control Questionnaire; CFB: change from baseline; HD: high dose; ICS: inhaled corticosteroids; LABA: long‐acting beta‐2 agonist; LD: low dose; MD: medium dose; SD: standard deviation.
Appendix 9. Data table for studies included for change from baseline in ACQ scores at 12 months
| Study | Treatment | N | Mean CFB | SD |
| Kerstjens 2012a | HD‐ICS/LABA | 222 | ‐0.593 | 1.073 |
| HD Triple | 237 | ‐0.714 | 1.062 | |
| Kerstjens 2012b | HD‐ICS/LABA | 232 | ‐0.441 | 1.036 |
| HD Triple | 216 | ‐0.573 | 1.043 | |
| Kerstjens 2020 | MD‐ICS/LABA | 598 | ‐0.955 | 0.978 |
| HD‐ICS/LABA | 1195 | ‐1.054 | 0.981 | |
| MD Triple | 595 | ‐0.965 | 0.976 | |
| HD Triple | 607 | ‐1.094 | 1.010 | |
| Lee 2020 | MD‐ICS/LABA | 84 | ‐0.781 | 0.660 |
| HD‐ICS/LABA | 88 | ‐0.687 | 0.653 | |
| MD Triple | 89 | ‐0.809 | 0.782 | |
| HD Triple | 90 | ‐0.771 | 0.617 | |
| van Zyl‐Smit 2020 | MD‐ICS/LABA | 397 | ‐1.114 | 0.709 |
| HD‐ICS/LABA | 790 | ‐1.066 | 0.707 |
ACQ: Asthma Control Questionnaire; CFB: change from baseline; HD: high dose; ICS: inhaled corticosteroids; LABA: long‐acting beta‐2 agonist; MD: medium dose; SD: standard deviation.
Appendix 10. Data table for studies included for change from baseline in AQLQ scores at 6 months
| Study | Treatment | N | Mean CFB | SD |
| Gessner 2020 | MD Triple | 474 | 0.710 | 1.524 |
| HD Triple | 952 | 0.790 | 1.505 | |
| Kerstjens 2012a | HD‐ICS/LABA | 222 | 0.484 | 1.415 |
| HD Triple | 237 | 0.525 | 1.401 | |
| Kerstjens 2012b | HD‐ICS/LABA | 232 | 0.169 | 1.325 |
| HD Triple | 216 | 0.447 | 1.337 | |
| van Zyl‐Smit 2020 | MD‐ICS/LABA | 407 | 0.767 | 0.660 |
| HD‐ICS/LABA | 816 | 0.712 | 0.749 |
AQLQ: Asthma Quality of Life Questionnaire; CFB: change from baseline; HD: high dose; ICS: inhaled corticosteroids; LABA: long‐acting beta‐2 agonist; MD: medium dose; SD: standard deviation.
Appendix 11. Data table for studies included for change from baseline in AQLQ scores at 12 months
| Study | Treatment | N | Mean CFB | SD |
| Kerstjens 2012a | HD‐ICS/LABA | 222 | 0.509 | 1.415 |
| HD Triple | 237 | 0.547 | 1.416 | |
| Kerstjens 2012b | HD‐ICS/LABA | 232 | 0.245 | 1.356 |
| HD Triple | 216 | 0.485 | 1.352 | |
| Kerstjens 2020 | MD‐ICS/LABA | 536 | 0.810 | 0.833 |
| HD‐ICS/LABA | 1093 | 0.830 | 0.841 | |
| MD Triple | 535 | 0.760 | 0.833 | |
| HD Triple | 552 | 0.870 | 0.822 | |
| van Zyl‐Smit 2020 | MD‐ICS/LABA | 397 | 0.861 | 0.773 |
| HD‐ICS/LABA | 789 | 0.792 | 0.769 |
AQLQ: Asthma Quality of Life Questionnaire; CFB: change from baseline; HD: high dose; ICS: inhaled corticosteroids; LABA: long‐acting beta‐2 agonist; MD: medium dose; SD: standard deviation.
Appendix 12. Data table for studies included for ACQ responders at 6 months
| Study | Treatment | N | Responders |
| Gessner 2020 | MD Triple | 447 | 393 |
| HD Triple | 901 | 762 | |
| Kerstjens 2012 | HD‐ICS/LABA | 454 | 213 |
| HD Triple | 453 | 244 | |
| Kerstjens 2020 | MD‐ICS/LABA | 559 | 395 |
| HD‐ICS/LABA | 1124 | 796 | |
| MD Triple | 559 | 401 | |
| HD Triple | 566 | 403 | |
| Lee 2020 | MD‐ICS/LABA | 396 | 205 |
| HD‐ICS/LABA | 397 | 231 | |
| MD Triple | 400 | 247 | |
| HD Triple | 395 | 251 | |
| van Zyl‐Smit 2020 | MD‐ICS/LABA | 407 | 310 |
| HD‐ICS/LABA | 817 | 622 | |
| Virchow 2019a | MD‐ICS/LABA | 574 | 291 |
| MD Triple | 575 | 317 | |
| Virchow 2019b | HD‐ICS/LABA | 571 | 319 |
| HD Triple | 858 | 530 |
ACQ: Asthma Control Questionnaire; HD: high dose; ICS: inhaled corticosteroids; LABA: long‐acting beta‐2 agonist; MD: medium dose; SD: standard deviation.
Appendix 13. Data table for studies included for ACQ responders at 6 months for individual interventions
| Study | Treatment (dose in micrograms) | N | Responders |
| Gessner 2020 | MF/GLY/IND 80/50/150 qd | 447 | 393 |
| MF/GLY/IND 160/50/150 qd | 454 | 387 | |
| SAL/FP 50/500 bid +Tio 5 qd | 447 | 375 | |
| Kerstjens 2020 | MF/IND 160/150 qd | 559 | 395 |
| FP/SAL 500/50 bid | 562 | 379 | |
| MF/IND 320/150 qd | 562 | 417 | |
| MF/GLY/IND 80/50/150 qd | 559 | 401 | |
| MF/GLY/IND 160/50/150 qd | 566 | 403 | |
| van Zyl‐Smit 2020 | MF/IND 160/150 qd | 407 | 310 |
| FP/SAL 500/50 bid | 410 | 311 | |
| MF/IND 320/150 qd | 407 | 311 | |
| Kerstjens 2012* | HD‐ICS/LABA | 454 | 213 |
| HD‐ICS/LABA+Tio5 | 453 | 244 | |
| Lee 2020* | FF/VI 100/25 qd | 396 | 205 |
| FF/VI 200/25 qd | 397 | 231 | |
| FF/UMEC/VI 100/62.5/25 qd | 400 | 247 | |
| FF/UMEC/VI 200/62.5/25 qd | 395 | 251 | |
| Virchow 2019a* | BDP/FM 200/12 bid | 574 | 291 |
| BDP/FM/GLY 200/12/20 bid | 575 | 317 |
* These studies were disconnected from the main network and not included in the analysis for this outcome. ACQ= Asthma Control Questionnaire, BDP= beclomethasone dipropionate, bid= twice daily, BUD=budesonide, FF=fluticasone furoate, FM=formoterol, FP=fluticasone propionate, GLY= glycopyrronium, HDICSLABA= high‐dose inhaled corticosteroids/long‐acting beta2 agonist, IND=indacaterol, MF=mometasone furoate, qd= once daily, SAL=salmeterol, Tio=tiotropium, UMEC= umeclidinium, VI=vilanterol.
Appendix 14. Data table for studies included for ACQ responders at 12 months for grouped interventions
| Study | Treatment | N | Responders |
| Kerstjens 2012 | HD‐ICS/LABA | 454 | 205 |
| HD Triple | 453 | 263 | |
| Kerstjens 2020 | MD‐ICS/LABA | 536 | 392 |
| HD‐ICS/LABA | 1094 | 824 | |
| MD Triple | 537 | 391 | |
| HD Triple | 552 | 435 | |
| van Zyl‐Smit 2020 | MD‐ICS/LABA | 397 | 326 |
| HD‐ICS/LABA | 790 | 612 | |
| Virchow 2019a | MD‐ICS/LABA | 574 | 340 |
| MD Triple | 575 | 350 | |
| Virchow 2019b | HD‐ICS/LABA | 571 | 332 |
| HD Triple | 858 | 524 |
ACQ: Asthma Control Questionnaire; HD: high dose; ICS: inhaled corticosteroids; LABA: long‐acting beta‐2 agonist; MD: medium dose.
Appendix 15. Data table for studies included for ACQ responders at 12 months for individual interventions
| Study | Treatment (dose in micrograms) | N | Responders |
| Kerstjens 2020 | MF/IND 160/150 qd | 536 | 392 |
| FP/SAL 500/50 bid | 547 | 398 | |
| MF/IND 320/150 qd | 547 | 426 | |
| MF/GLY/IND 80/50/150 qd | 537 | 391 | |
| MF/GLY/IND 160/50/150 qd | 552 | 435 | |
| van Zyl‐Smit 2020 | MF/IND 160/150 qd | 397 | 326 |
| FP/SAL 500/50 bid | 405 | 313 | |
| MF/IND 320/150 qd | 385 | 299 | |
| Kerstjens 2012* | HD‐ICS/LABA | 454 | 205 |
| HDICSLABA+Tio5 | 453 | 263 | |
| Virchow 2019* | BDP/FM 200/12 bid | 574 | 340 |
| BDP/FM 400/12 bid | 571 | 332 | |
| BDP/FM /GLY 200/12/20 bid | 575 | 350 | |
| BDP/FM 400/12 bid +Tio 5 qd | 287 | 168 | |
| BDP/FM /GLY 400/12/20 bid | 571 | 356 |
* These studies were disconnected from the main network and not included in the analysis for this outcome. ACQ= Asthma Control Questionnaire, BDP= beclomethasone dipropionate, bid= twice daily, BUD=budesonide, FF=fluticasone furoate, FM=formoterol, FP=fluticasone propionate, GLY= glycopyrronium, HD‐ICS/LABA= high‐dose inhaled corticosteroids/long‐acting beta2 agonist, IND=indacaterol, MF=mometasone furoate, qd=once daily, SAL=salmeterol, Tio=tiotropium, UMEC= umeclidinium, VI=vilanterol.
Appendix 16. Data table for studies included for all‐cause SAEs for grouped interventions
| Study | Treatment | N | n of participants with the event |
| Bernstein 2015 | MD‐ICS/LABA | 346 | 4 |
| HD‐ICS/LABA | 346 | 1 | |
| Gessner 2020 | MD Triple | 474 | 14 |
| HD Triple | 951 | 37 | |
| Kerstjens 2012a | HD‐ICS/LABA | 222 | 15 |
| HD Triple | 237 | 18 | |
| Kerstjens 2012b | HD‐ICS/LABA | 234 | 25 |
| HD Triple | 219 | 19 | |
| Kerstjens 2020 | MD‐ICS/LABA | 608 | 38 |
| HD‐ICS/LABA | 1231 | 91 | |
| MD Triple | 617 | 49 | |
| HD Triple | 616 | 46 | |
| Lee 2020 | MD‐ICS/LABA | 407 | 25 |
| HD‐ICS/LABA | 406 | 21 | |
| MD Triple | 406 | 23 | |
| HD Triple | 408 | 21 | |
| Mansfield 2017 | MD‐ICS/LABA | 174 | 15 |
| HD‐ICS/LABA | 44 | 3 | |
| Peters 2008 | MD‐ICS/LABA | 132 | 12 |
| HD‐ICS/LABA | 443 | 21 | |
| Stempel 2016 | MD‐ICS/LABA | 580 | 10 |
| HD‐ICS/LABA | 982 | 34 | |
| van Zyl‐Smit 2020 | MD‐ICS/LABA | 437 | 20 |
| HD‐ICS/LABA | 887 | 42 | |
| Virchow 2019a | MD‐ICS/LABA | 574 | 22 |
| MD Triple | 576 | 28 | |
| Virchow 2019b | HD‐ICS/LABA | 573 | 33 |
| HD Triple | 858 | 43 | |
| Weinstein 2010 | MD‐ICS/LABA | 233 | 3 |
| HD‐ICS/LABA | 255 | 2 |
HD: high dose; ICS: inhaled corticosteroids; LABA: long‐acting beta‐2 agonist; MD: medium dose; SAE: serious adverse event.
Appendix 17. Data table for studies included for all‐cause SAEs for individual interventions
| Study | Treatment (dose in micrograms) | N | n of participants with the event |
| Bernstein 2011 | FP/SAL 250/50 bid | 351 | 8 |
| MF/FM 200/10 bid | 371 | 6 | |
| Bernstein 2015 | FF/VI 100/25 qd | 346 | 4 |
| FF/VI 200/25 qd | 346 | 1 | |
| Gessner 2020 | MF/GLY/IND 80/50/150 qd | 474 | 14 |
| MF/GLY/IND 160/50/150 qd | 476 | 18 | |
| SAL/FP 50/500 μg bid HD +Tio 5 qd | 475 | 19 | |
| Kerstjens 2020 | MF/IND 160/150 qd | 608 | 38 |
| FP/SAL 500/50 bid | 618 | 39 | |
| MF/IND 320/150 qd | 613 | 52 | |
| MF/GLY/IND 80/50/150 qd | 617 | 49 | |
| MF/GLY/IND 160/50/150 qd | 616 | 46 | |
| Lee 2020 | FF/VI 100/25 qd | 407 | 25 |
| FF/VI 200/25 qd | 406 | 21 | |
| FF/UMEC/VI 100/62.5/25 qd | 406 | 23 | |
| FF/UMEC/VI 200/62.5/25 qd | 408 | 21 | |
| Mansfield 2017 | FP/SAL 250/50 bid | 41 | 2 |
| FP/SAL 200/12.5 bid | 133 | 13 | |
| FP/SAL 500/50 bid | 44 | 3 | |
| Stempel 2016 | FP/SAL 250/50 bid | 580 | 10 |
| FP/SAL 500/50 bid | 982 | 34 | |
| van Zyl‐Smit 2020 | MF/IND 160/150 qd | 437 | 20 |
| FP/SAL 500/50 bid | 444 | 21 | |
| MF/IND 320/150 qd | 443 | 21 | |
| Weinstein 2010 | MF/FM 200/10 bid | 233 | 3 |
| MF/FM 400/10 bid | 255 | 2 | |
| Woodcock 2013 | FP/SAL 250/50 bid | 403 | 5 |
| FF/VI 100/25 qd | 403 | 4 | |
| Bodzenta‐Lukaszyk 2012* | BUD/FM 400/12 bid | 139 | 2 |
| FP/FM 250/10 bid | 140 | 1 | |
| Cukier 2013* | BUD/FM 400/12 bid | 99 | 3 |
| FP/FM 250/12 bid | 97 | 2 | |
| Kerstjens 2012a* | HD‐ICS/LABA | 222 | 15 |
| HD‐ICS/LABA+Tio5 | 237 | 18 | |
| Kerstjens 2012a* | HD‐ICS/LABA | 234 | 25 |
| HD‐ICS/LABA+Tio5 | 219 | 19 | |
| Peters 2008* | BUD/FM 320/9 bid | 132 | 12 |
| BUD/FM 640/18 bid | 443 | 21 | |
| Virchow 2019a* | BDP/FM/GLY 200/12/20 bid | 576 | 28 |
| BDP/FM 200/12 bid | 574 | 22 | |
| Virchow 2019b* | BDP/FM/GLY 400/12/20 bid | 571 | 28 |
| BDP/FM 400/12 bid | 573 | 33 | |
| BDP/FM 400/12 bid +Tio 5 qd | 287 | 15 |
* These studies were disconnected from the main network and not included in the analysis for this outcome. BDP= beclomethasone dipropionate, bid= twice daily, BUD=budesonide, FF=fluticasone furoate, FM=formoterol, FP=fluticasone propionate, GLY= glycopyrronium, IND=indacaterol, MF=mometasone furoate, qd=once daily, SAE= serious adverse event, SAL=salmeterol, Tio=tiotropium, UMEC= umeclidinium, VI=vilanterol.
Appendix 18. Data table for studies included for asthma‐related SAEs for grouped interventions
| Study | Treatment | N | n of participants with the event |
| Gessner 2020 | MD Triple | 474 | 4 |
| HD Triple | 951 | 4 | |
| Kerstjens 2012a | HD‐ICS/LABA | 222 | 10 |
| HD Triple | 237 | 9 | |
| Kerstjens 2012b | HD‐ICS/LABA | 234 | 11 |
| HD Triple | 219 | 8 | |
| Kerstjens 2020 | MD‐ICS/LABA | 608 | 8 |
| HD‐ICS/LABA | 1231 | 21 | |
| MD Triple | 617 | 15 | |
| HD Triple | 616 | 9 | |
| Lee 2020 | MD‐ICS/LABA | 407 | 7 |
| HD‐ICS/LABA | 406 | 6 | |
| MD Triple | 406 | 7 | |
| HD Triple | 408 | 4 | |
| Mansfield 2017 | MD‐ICS/LABA | 174 | 9 |
| HD‐ICS/LABA | 44 | 2 | |
| Stempel 2016 | MD‐ICS/LABA | 580 | 2 |
| HD‐ICS/LABA | 982 | 11 | |
| van Zyl‐Smit 2020 | MD‐ICS/LABA | 437 | 2 |
| HD‐ICS/LABA | 887 | 5 | |
| Virchow 2019a | MD‐ICS/LABA | 574 | 4 |
| MD Triple | 576 | 7 | |
| Virchow 2019b | HD‐ICS/LABA | 573 | 11 |
| HD Triple | 858 | 17 | |
| Weinstein 2010 | MD‐ICS/LABA | 233 | 0 |
| HD‐ICS/LABA | 255 | 1 |
HD: high dose; ICS: inhaled corticosteroids; LABA: long‐acting beta‐2 agonist; MD: medium dose; SAE: serious adverse event.
Appendix 19. Data table for studies included for asthma‐related SAEs for individual interventions
| Study | Treatment (dose in micrograms) | N | n of participants with the event |
| Bernstein 2011 | FP/SAL 250/50 bid | 351 | 1 |
| MF/FM 200/10 bid | 371 | 1 | |
| Gessner 2020 | MF/GLY/IND 80/50/150 qd | 474 | 4 |
| MF/GLY/IND 160/50/150 qd | 476 | 3 | |
| SAL/FP 50/500 μg bid HD +Tio 5 qd | 475 | 2 | |
| Kerstjens 2020 | MF/IND 160/150 qd | 608 | 8 |
| FP/SAL 500/50 bid | 618 | 9 | |
| MF/IND 320/150 qd | 613 | 12 | |
| MF/GLY/IND 80/50/150 qd | 617 | 15 | |
| MF/GLY/IND 160/50/150 qd | 616 | 9 | |
| Lee 2020 | FF/VI 100/25 qd | 407 | 7 |
| FF/VI 200/25 qd | 406 | 6 | |
| FF/UMEC/VI 100/62.5/25 qd | 406 | 7 | |
| FF/UMEC/VI 200/62.5/25 qd | 408 | 4 | |
| Mansfield 2017 | FP/SAL 250/50 bid | 41 | 1 |
| FP/SAL 200/12.5 bid | 133 | 8 | |
| FP/SAL 500/50 bid | 44 | 2 | |
| Stempel 2016 | FP/SAL 250/50 bid | 580 | 2 |
| FP/SAL 500/50 bid | 982 | 11 | |
| van Zyl‐Smit 2020 | MF/IND 160/150 qd | 437 | 2 |
| FP/SAL 500/50 bid | 444 | 2 | |
| MF/IND 320/150 qd | 443 | 3 | |
| Weinstein 2010 | MF/FM 200/10 bid | 234 | 0 |
| MF/FM 400/10 bid | 256 | 1 | |
| Woodcock 2013 | FP/SAL 250/50 bid | 403 | 2 |
| FF/VI 100/25 qd | 403 | 1 | |
| Kerstjens 2012a* | HD‐ICS/LABA | 222 | 10 |
| HD‐ICS/LABA +Tio5 | 237 | 9 | |
| Kerstjens 2012b* | HD‐ICS/LABA | 234 | 11 |
| HD‐ICS/LABA +Tio5 | 219 | 8 | |
| Virchow 2019a* | BDP/FM/GLY 200/12/20 bid | 576 | 7 |
| BDP/FM 200/12 bid | 574 | 4 | |
| Virchow 2019b* | BDP/FM /GLY 400/12/20 bid | 571 | 11 |
| BDP/FM 400/12 bid | 573 | 11 | |
| BDP/FM 400/12 bid + Tio 5 qd | 287 | 6 |
* These studies were disconnected from the main network and not included in the analysis for this outcome. BDP: beclomethasone dipropionate, bid: twice daily, BUD: budesonide, FF: fluticasone furoate, FM: formoterol, FP: fluticasone propionate, GLY: glycopyrronium, IND: indacaterol, MF: mometasone furoate, qd: once daily, SAE: serious adverse event; SAL: salmeterol, Tio: tiotropium, UMEC: umeclidinium, VI: vilanterol.
Appendix 20. Data table for studies included for all‐cause AEs for grouped interventions
| Study | Treatment | N | n of participants with the event |
| Bernstein 2015 | MD‐ICS/LABA | 346 | 54 |
| HD‐ICS/LABA | 346 | 52 | |
| Gessner 2020 | MD Triple | 474 | 252 |
| HD Triple | 952 | 494 | |
| Kerstjens 2012a | HD‐ICS/LABA | 222 | 148 |
| HD Triple | 237 | 136 | |
| Kerstjens 2012b | HD‐ICS/LABA | 234 | 171 |
| HD Triple | 219 | 134 | |
| Kerstjens 2020 | MD‐ICS/LABA | 608 | 392 |
| HD‐ICS/LABA | 1231 | 796 | |
| MD Triple | 617 | 387 | |
| HD Triple | 616 | 367 | |
| Lee 2020 | MD‐ICS/LABA | 407 | 136 |
| HD‐ICS/LABA | 406 | 122 | |
| MD Triple | 406 | 135 | |
| HD Triple | 408 | 122 | |
| Mansfield 2017 | MD‐ICS/LABA | 174 | 90 |
| HD‐ICS/LABA | 44 | 23 | |
| Peters 2008 | MD‐ICS/LABA | 132 | 111 |
| HD‐ICS/LABA | 443 | 394 | |
| van Zyl‐Smit 2020 | MD‐ICS/LABA | 437 | 233 |
| HD‐ICS/LABA | 887 | 467 | |
| Virchow 2019a | MD‐ICS/LABA | 574 | 455 |
| MD Triple | 576 | 431 | |
| Virchow 2019b | HD‐ICS/LABA | 573 | 443 |
| HD Triple | 858 | 620 | |
| Weinstein 2010 | MD‐ICS/LABA | 233 | 8 |
| HD‐ICS/LABA | 255 | 12 |
AE: adverse event; HD: high dose; ICS: inhaled corticosteroids; LABA: long‐acting beta‐2 agonist; MD: medium dose.
Appendix 21. Data table for studies included for all‐cause AEs for individual interventions
| Study | Treatment (dose in micrograms) | N | n of participants with the event |
| Bernstein 2011 | FP/SAL 250/50 bid | 351 | 77 |
| MF/FM 200/10 bid | 371 | 85 | |
| Bernstein 2015 | FF/VI 100/25 qd | 346 | 54 |
| FF/VI 200/25 qd | 346 | 52 | |
| Bodzenta‐Lukaszyk 2012 | BUD/FM 320/9 bid | 139 | 26 |
| FP/FM 250/12 bid | 140 | 29 | |
| Busse 2018 | FP/SAL 250/50 bid | 391 | 17 |
| BUD/FM 320/9 bid | 389 | 31 | |
| Gessner 2020 | MF/GLY/IND 80/50/150 qd | 474 | 252 |
| MF/GLY/IND 160/50/150 qd | 476 | 249 | |
| SAL/FP 50/500 μg bid HD +Tio 5 qd | 476 | 245 | |
| Kerstjens 2020 | MF/IND 160/150 qd | 608 | 392 |
| FP/SAL 500/50 bid | 618 | 419 | |
| MF/IND 320/150 qd | 613 | 377 | |
| MF/GLY/IND 80/50/150 qd | 617 | 387 | |
| MF/GLY/IND 160/50/150 qd | 616 | 367 | |
| Lee 2020 | FF/VI 100/25 qd | 407 | 136 |
| FF/VI 200/25 qd | 406 | 122 | |
| FF/UMEC/VI 100/62.5/25 qd | 406 | 135 | |
| FF/UMEC/VI 200/62.5/25 qd | 408 | 122 | |
| Mansfield 2017 | FP/SAL 250/50 bid | 41 | 22 |
| FP/SAL 200/12.5 bid | 133 | 68 | |
| FP/SAL 500/50 bid | 44 | 23 | |
| Peters 2008 | BUD/FM 320/9 bid | 132 | 111 |
| BUD/FM 640/18 bid | 443 | 394 | |
| van Zyl‐Smit 2020 | MF/IND 160/150 qd | 437 | 233 |
| FP/SAL 500/50 bid | 444 | 239 | |
| MF/IND 320/150 qd | 443 | 228 | |
| Weinstein 2010 | MF/FM 200/10 bid | 233 | 8 |
| MF/FM 400/10 bid | 255 | 12 | |
| Woodcock 2013 | FP/SAL 250/50 bid | 403 | 106 |
| FF/VI 100/25 qd | 403 | 110 | |
| Kerstjens 2012a* | HD‐ICS/LABA | 222 | 148 |
| HD‐ICS/LABA + Tio 5 | 237 | 136 | |
| Kerstjens 2012b* | HD‐ICS/LABA | 234 | 171 |
| HD‐ICS/LABA + Tio 5 | 219 | 134 | |
| Virchow 2019a* | BDP/FM/GLY 200/12/20 bid | 576 | 431 |
| BDP/ FM 200/12 bid | 574 | 455 | |
| Virchow 2019b* | BDP/FM/GLY 400/12/20 bid | 571 | 410 |
| BDP/ FM 400/12 bid | 573 | 443 | |
| BDP/ FM 400/12 bid +Tio 5 qd | 287 | 210 |
* These studies were disconnected from the main network and not included in the analysis for this outcome. AE: adverse event, bid: twice daily, BUD: budesonide, FF: fluticasone furoate, FM: formoterol, FP: fluticasone propionate, GLY: glycopyrronium, IND: indacaterol, MF: mometasone furoate, qd: once daily, SAL: salmeterol, Tio: tiotropium, UMEC: umeclidinium, VI: vilanterol.
Appendix 22. Data table for studies for dropouts due to AEs for grouped interventions
| Study | Treatment | N | n of participants with the event |
| Bernstein 2015 | MD‐ICS/LABA | 346 | 3 |
| HD‐ICS/LABA | 346 | 3 | |
| Gessner 2020 | MD Triple | 474 | 5 |
| HD Triple | 951 | 6 | |
| Kerstjens 2012a | HD‐ICS/LABA | 222 | 6 |
| HD Triple | 237 | 6 | |
| Kerstjens 2012b | HD‐ICS/LABA | 234 | 8 |
| HD Triple | 219 | 2 | |
| Kerstjens 2020 | MD‐ICS/LABA | 617 | 19 |
| HD‐ICS/LABA | 1236 | 38 | |
| MD Triple | 620 | 24 | |
| HD Triple | 619 | 12 | |
| Lee 2020 | MD‐ICS/LABA | 407 | 9 |
| HD‐ICS/LABA | 406 | 2 | |
| MD Triple | 406 | 2 | |
| HD Triple | 408 | 2 | |
| Mansfield 2017 | MD‐ICS/LABA | 174 | 2 |
| HD‐ICS/LABA | 44 | 1 | |
| Peters 2008 | MD‐ICS/LABA | 132 | 8 |
| HD‐ICS/LABA | 443 | 35 | |
| van Zyl‐Smit 2020 | MD‐ICS/LABA | 439 | 0 |
| HD‐ICS/LABA | 891 | 2 | |
| Virchow 2019a | MD‐ICS/LABA | 576 | 5 |
| MD Triple | 579 | 0 | |
| Virchow 2019b | HD‐ICS/LABA | 576 | 7 |
| HD Triple | 861 | 5 | |
| Weinstein 2010 | MD‐ICS/LABA | 233 | 2 |
| HD‐ICS/LABA | 255 | 2 |
AE: adverse event; HD: high dose; ICS: inhaled corticosteroids; LABA: long‐acting beta‐2 agonist; MD: medium dose.
Appendix 23. Data table for studies included for dropouts due to AEs for individual interventions
| Study | Treatment (dose in micrograms) | N | n of participants with the event |
| Bernstein 2011 | FP/SAL 250/50 bid | 351 | 6 |
| MF/FM 200/10 bid | 371 | 8 | |
| Bernstein 2015 | BUD/FM 320/9 bid | 346 | 3 |
| FF/VI 200/25 qd | 346 | 3 | |
| Bodzenta‐Lukaszyk 2012 | BUD/FM 320/9 bid | 139 | 3 |
| FP/FM 250/12 bid | 140 | 1 | |
| Busse 2008 | FP/SAL 250/50 bid | 391 | 5 |
| BUD/FM 320/9 bid | 389 | 5 | |
| Cukier 2013 | BUD/FM 320/9 bid | 99 | 1 |
| FP/FM 250/ 12 bid | 97 | 1 | |
| Gessner 2020 | MF/GLY/IND 80/50/150 qd | 474 | 5 |
| MF/GLY/IND 160/50/150 qd | 476 | 3 | |
| SAL/FP 50/500 bid +Tio 5 qd | 475 | 3 | |
| Kerstjens 2020 | MF/IND 160/150 qd | 617 | 19 |
| FP/SAL 500/50 bid | 618 | 21 | |
| MF/IND 320/150 qd | 618 | 17 | |
| MF/GLY/IND 80/50/150 qd | 620 | 24 | |
| MF/GLY/IND 160/50/150 qd | 619 | 12 | |
| Lee 2020 | FF/VI 100/25 qd | 407 | 9 |
| FF/VI 200/25 qd | 406 | 2 | |
| FF/UMEC/VI 100/62.5/25 qd | 406 | 2 | |
| FF/UMEC/VI 200/62.5/25 qd | 408 | 2 | |
| Mansfield 2017 | FP/SAL 250/50 bid | 41 | 2 |
| FP/SAL 200/12.5 bid | 133 | 0 | |
| FP/SAL 500/50 bid | 44 | 1 | |
| Peters 2008 | BUD/FM 320/9 bid | 132 | 8 |
| BUD/FM 640/18 bid | 443 | 35 | |
| van Zyl‐Smit 2020 | MF/IND 160/150 qd | 439 | 0 |
| FP/SAL 500/50 bid | 446 | 2 | |
| MF/IND 320/150 qd | 445 | 0 | |
| Weinstein 2010 | MF/FM 200/10 bid | 233 | 2 |
| MF/FM 400/10 bid | 255 | 2 | |
| Woodcock 2013 | FP/SAL 250/50 bid | 403 | 8 |
| FF/VI 100/25 qd | 403 | 6 | |
| Kerstjens 2012a* | HD‐ICS/LABA | 222 | 6 |
| HD‐ICS/LABA +Tio 5 qd | 237 | 6 | |
| Kerstjens 2012a* | HD‐ICS/LABA | 234 | 8 |
| HD‐ICS/LABA +Tio 5 qd | 219 | 2 | |
| Virchow 2019a* | BDP/FM/GLY 200/12/20 bid | 579 | 0 |
| BDP/FM 200/12 bid | 576 | 5 | |
| Virchow 2019b* | BDP/FM/GLY 400/12/20 bid | 573 | 3 |
| BDP/FM 400/12 bid | 576 | 7 | |
| BDP/FM 400/12 bid +Tio 5 qd | 288 | 2 |
* These studies were disconnected from the main network and not included in the analysis for this outcome. AE: adverse event, BDP: beclomethasone dipropionate, bid: twice daily, BUD: budesonide, FF: fluticasone furoate, FM: formoterol, FP: fluticasone propionate, GLY: glycopyrronium, IND: indacaterol, MF: mometasone furoate, qd: once daily, SAL: salmeterol, Tio: tiotropium, UMEC: umeclidinium, VI: vilanterol.
Data and analyses
Comparison 1. Asthma exacerbations.
| Outcome or subgroup title | No. of studies | No. of participants | Statistical method | Effect size |
|---|---|---|---|---|
| 1.1 Severe exacerbations | 6 | Risk Ratio (M‐H, Fixed, 95% CI) | Subtotals only | |
| 1.1.1 HD‐ICA/LABA vs MD‐ICS LABA | 5 | 4492 | Risk Ratio (M‐H, Fixed, 95% CI) | 1.49 [0.74, 3.01] |
| 1.1.2 MD TRIPLE vs MD‐ICS/LABA | 1 | 813 | Risk Ratio (M‐H, Fixed, 95% CI) | 1.00 [0.35, 2.83] |
| 1.1.3 HD TRIPLE vs MD‐ICS/LABA | 1 | 815 | Risk Ratio (M‐H, Fixed, 95% CI) | 0.57 [0.17, 1.93] |
| 1.1.4 MD TRIPLE vs HD‐ICS/LABA | 1 | 812 | Risk Ratio (M‐H, Fixed, 95% CI) | 1.40 [0.45, 4.37] |
| 1.1.5 HD TRIPLE vs HD‐ICS/LABA | 2 | 1727 | Risk Ratio (M‐H, Fixed, 95% CI) | 0.80 [0.45, 1.42] |
| 1.1.6 HD TRIPLE vs MD TRIPLE | 1 | 814 | Risk Ratio (M‐H, Fixed, 95% CI) | 0.57 [0.17, 1.93] |
| 1.1.7 TRIPLE vs DUAL | 2 | 2540 | Risk Ratio (M‐H, Fixed, 95% CI) | 0.84 [0.51, 1.40] |
| 1.2 Moderate to severe exacerbations | 10 | Risk Ratio (M‐H, Random, 95% CI) | Subtotals only | |
| 1.2.1 HD‐ICS/LABA vs MD‐ICS/LABA | 6 | 5452 | Risk Ratio (M‐H, Random, 95% CI) | 0.93 [0.82, 1.05] |
| 1.2.2 MD TRIPLE vs MD‐ICS/LABA | 3 | 3184 | Risk Ratio (M‐H, Random, 95% CI) | 0.86 [0.75, 0.99] |
| 1.2.3 HD TRIPLE vs MD‐ICS/LABA | 2 | 2037 | Risk Ratio (M‐H, Random, 95% CI) | 0.78 [0.66, 0.92] |
| 1.2.4 MD TRIPLE vs HD‐ICS/LABA | 2 | 2651 | Risk Ratio (M‐H, Random, 95% CI) | 1.05 [0.78, 1.41] |
| 1.2.5 HD TRIPLE vs HD‐ICS/LABA | 4 | 4989 | Risk Ratio (M‐H, Random, 95% CI) | 0.83 [0.75, 0.92] |
| 1.2.6 HD TRIPLE vs MD TRIPLE | 3 | 3470 | Risk Ratio (M‐H, Random, 95% CI) | 0.85 [0.72, 1.01] |
| 1.2.7 TRIPLE vs DUAL | 5 | 8173 | Risk Ratio (M‐H, Random, 95% CI) | 0.85 [0.78, 0.92] |
Comparison 2. Asthma Control Questionnaire: change from baseline.
| Outcome or subgroup title | No. of studies | No. of participants | Statistical method | Effect size |
|---|---|---|---|---|
| 2.1 CFB in ACQ at 3 months | 4 | Mean Difference (IV, Random, 95% CI) | Subtotals only | |
| 2.1.1 HD‐ICS/LABA vs MD‐ICS/LABA | 3 | 2450 | Mean Difference (IV, Random, 95% CI) | 0.01 [‐0.05, 0.07] |
| 2.1.2 MD TRIPLE vs MD‐ICS/LABA | 1 | 768 | Mean Difference (IV, Random, 95% CI) | ‐0.06 [‐0.16, 0.04] |
| 2.1.3 HD TRIPLE vs MD‐ICS/LABA | 1 | 764 | Mean Difference (IV, Random, 95% CI) | ‐0.12 [‐0.22, ‐0.02] |
| 2.1.4 MD TRIPLE vs HD‐ICS/LABA | 1 | 771 | Mean Difference (IV, Random, 95% CI) | ‐0.04 [‐0.14, 0.06] |
| 2.1.5 HD TRIPLE vs HD‐ICS/LABA | 1 | 767 | Mean Difference (IV, Random, 95% CI) | ‐0.09 [‐0.19, 0.01] |
| 2.1.6 HD TRIPLE vs MD TRIPLE | 2 | 2079 | Mean Difference (IV, Random, 95% CI) | ‐0.04 [‐0.11, 0.03] |
| 2.1.7 TRIPLE vs DUAL | 1 | 1535 | Mean Difference (IV, Random, 95% CI) | ‐0.08 [‐0.15, ‐0.01] |
| 2.2 CFB in ACQ at 6 months | 7 | Mean Difference (IV, Random, 95% CI) | Subtotals only | |
| 2.2.1 HD‐ICS/LABA vs MD‐ICS/LABA | 3 | 3762 | Mean Difference (IV, Random, 95% CI) | ‐0.04 [‐0.12, 0.04] |
| 2.2.2 MD TRIPLE vs MD‐ICS/LABA | 2 | 1961 | Mean Difference (IV, Random, 95% CI) | ‐0.09 [‐0.17, ‐0.02] |
| 2.2.3 HD TRIPLE vs MD‐ICS/LABA | 2 | 1952 | Mean Difference (IV, Random, 95% CI) | ‐0.11 [‐0.18, ‐0.04] |
| 2.2.4 MD TRIPLE vs HD‐ICS/LABA | 2 | 2561 | Mean Difference (IV, Random, 95% CI) | ‐0.01 [‐0.08, 0.06] |
| 2.2.5 HD TRIPLE vs HD‐ICS/LABA | 3 | 3459 | Mean Difference (IV, Random, 95% CI) | ‐0.06 [‐0.15, 0.03] |
| 2.2.6 MD TRIPLE vs LD TRIPLE | 2 | 2091 | Mean Difference (IV, Random, 95% CI) | ‐0.04 [‐0.13, 0.05] |
| 2.2.7 HD TRIPLE vs LD TRIPLE | 1 | 873 | Mean Difference (IV, Random, 95% CI) | 0.03 [‐0.10, 0.16] |
| 2.2.8 HD TRIPLE vs MD TRIPLE | 3 | 3288 | Mean Difference (IV, Random, 95% CI) | ‐0.02 [‐0.08, 0.04] |
| 2.2.9 TRIPLE vs DUAL | 4 | 5408 | Mean Difference (IV, Random, 95% CI) | ‐0.07 [‐0.14, ‐0.01] |
| 2.3 CFB in ACQ at 12 months | 6 | Mean Difference (IV, Random, 95% CI) | Subtotals only | |
| 2.3.1 HD‐ICS/LABA vs MD‐ICS/LABA | 3 | 3152 | Mean Difference (IV, Random, 95% CI) | 0.00 [‐0.12, 0.12] |
| 2.3.2 MD TRIPLE vs MD‐ICS/LABA | 2 | 1366 | Mean Difference (IV, Random, 95% CI) | ‐0.01 [‐0.11, 0.08] |
| 2.3.3 HD TRIPLE vs MD‐ICS/LABA | 2 | 1379 | Mean Difference (IV, Random, 95% CI) | ‐0.09 [‐0.23, 0.06] |
| 2.3.4 MD TRIPLE vs HD‐ICS/LABA | 2 | 1967 | Mean Difference (IV, Random, 95% CI) | 0.01 [‐0.20, 0.21] |
| 2.3.5 HD TRIPLE vs HD‐ICS/LABA | 3 | 2887 | Mean Difference (IV, Random, 95% CI) | ‐0.07 [‐0.15, 0.00] |
| 2.3.6 HD TRIPLE vs MD TRIPLE | 2 | 1381 | Mean Difference (IV, Random, 95% CI) | ‐0.07 [‐0.23, 0.09] |
| 2.3.7 DUAL vs TRIPLE | 4 | 4253 | Mean Difference (IV, Random, 95% CI) | ‐0.04 [‐0.10, 0.02] |
Comparison 3. Asthma Quality of Life Questionnaire: change from baseline.
| Outcome or subgroup title | No. of studies | No. of participants | Statistical method | Effect size |
|---|---|---|---|---|
| 3.1 CFB in AQLQ at 6 months | 5 | Mean Difference (IV, Fixed, 95% CI) | Subtotals only | |
| 3.1.1 HD‐ICS/LABA vs MD‐ICS/LABA | 1 | 1223 | Mean Difference (IV, Fixed, 95% CI) | ‐0.06 [‐0.14, 0.03] |
| 3.1.2 HD TRIPLE vs HD‐ICS/LABA | 1 | 907 | Mean Difference (IV, Fixed, 95% CI) | 0.16 [‐0.01, 0.34] |
| 3.1.3 HD TRIPLE vs MD TRIPLE | 1 | 1426 | Mean Difference (IV, Fixed, 95% CI) | 0.08 [‐0.09, 0.25] |
| 3.1.4 TRIPLE vs DUAL | 2 | 907 | Mean Difference (IV, Fixed, 95% CI) | 0.16 [‐0.01, 0.34] |
| 3.2 CFB in AQLQ at 12 months | 4 | Mean Difference (IV, Fixed, 95% CI) | Subtotals only | |
| 3.2.1 HD‐ICS/LABA vs MD‐ICS/LABA | 2 | 2815 | Mean Difference (IV, Fixed, 95% CI) | ‐0.02 [‐0.08, 0.04] |
| 3.2.2 MD TRIPLE vs MD‐ICS/LABA | 1 | 1071 | Mean Difference (IV, Fixed, 95% CI) | ‐0.05 [‐0.15, 0.05] |
| 3.2.3 HD TRIPLE vs MD‐ICS/LABA | 1 | 1058 | Mean Difference (IV, Fixed, 95% CI) | 0.06 [‐0.04, 0.16] |
| 3.2.4 MD TRIPLE vs HD‐ICS/LABA | 1 | 1628 | Mean Difference (IV, Fixed, 95% CI) | ‐0.07 [‐0.16, 0.02] |
| 3.2.5 HD TRIPLE vs HD‐ICS/LABA | 3 | 2552 | Mean Difference (IV, Fixed, 95% CI) | 0.06 [‐0.02, 0.14] |
| 3.2.6 TRIPLE vs DUAL | 3 | 3623 | Mean Difference (IV, Fixed, 95% CI) | 0.01 [‐0.05, 0.07] |
Comparison 4. Asthma Control Questionnaire responders.
| Outcome or subgroup title | No. of studies | No. of participants | Statistical method | Effect size |
|---|---|---|---|---|
| 4.1 ACQ responders at 6 months | 7 | Risk Ratio (M‐H, Random, 95% CI) | Subtotals only | |
| 4.1.1 HD‐ICS/LABA vs MD‐ICS/LABA | 3 | 3700 | Risk Ratio (M‐H, Random, 95% CI) | 1.02 [0.96, 1.08] |
| 4.1.2 MD TRIPLE vs MD‐ICS/LABA | 3 | 3063 | Risk Ratio (M‐H, Random, 95% CI) | 1.09 [0.99, 1.19] |
| 4.1.3 HD TRIPLE vs MD‐ICS/LABA | 2 | 1916 | Risk Ratio (M‐H, Random, 95% CI) | 1.11 [0.91, 1.35] |
| 4.1.4 MD TRIPLE vs HD‐ICS/LABA | 2 | 2487 | Risk Ratio (M‐H, Random, 95% CI) | 1.02 [0.96, 1.08] |
| 4.1.5 HD TRIPLE vs HD‐ICS/LABA | 4 | 4818 | Risk Ratio (M‐H, Random, 95% CI) | 1.07 [1.01, 1.14] |
| 4.1.6 HD TRIPLE vs MD TRIPLE | 3 | 2821 | Risk Ratio (M‐H, Random, 95% CI) | 0.99 [0.95, 1.03] |
| 4.1.7 TRIPLE vs DUAL | 5 | 7881 | Risk Ratio (M‐H, Random, 95% CI) | 1.09 [1.02, 1.15] |
| 4.2 ACQ responders at 12 months | 5 | Risk Ratio (M‐H, Random, 95% CI) | Subtotals only | |
| 4.2.1 HD‐ICS/LABA vs MD‐ICS/LABA | 2 | 2817 | Risk Ratio (M‐H, Random, 95% CI) | 0.99 [0.90, 1.07] |
| 4.2.2 MD TRIPLE vs MD‐ICS/LABA | 2 | 2222 | Risk Ratio (M‐H, Random, 95% CI) | 1.01 [0.95, 1.07] |
| 4.2.3 MD TRIPLE vs HD‐ICS/LABA | 1 | 1088 | Risk Ratio (M‐H, Random, 95% CI) | 1.08 [1.01, 1.15] |
| 4.2.4 MD TRIPLE vs HD‐ICS/LABA | 1 | 1631 | Risk Ratio (M‐H, Random, 95% CI) | 0.97 [0.91, 1.03] |
| 4.2.5 HD TRIPLE vs HD‐ICS/LABA | 3 | 3982 | Risk Ratio (M‐H, Random, 95% CI) | 1.11 [0.99, 1.23] |
| 4.2.6 HD TRIPLE vs MD TRIPLE | 1 | 1089 | Risk Ratio (M‐H, Random, 95% CI) | 1.08 [1.01, 1.16] |
| 4.2.7 TRIPLE vs DUAL | 4 | 6204 | Risk Ratio (M‐H, Random, 95% CI) | 1.07 [0.99, 1.17] |
Comparison 5. Serious adverse events, adverse events, and dropouts due to adverse event.
| Outcome or subgroup title | No. of studies | No. of participants | Statistical method | Effect size |
|---|---|---|---|---|
| 5.1 All cause SAEs | 14 | Risk Ratio (M‐H, Fixed, 95% CI) | Subtotals only | |
| 5.1.1 HD‐ICS/LABA vs MD‐ICS LABA | 8 | 7511 | Risk Ratio (M‐H, Fixed, 95% CI) | 1.03 [0.83, 1.29] |
| 5.1.2 MD TRIPLE vs MD‐ICS/LABA | 3 | 3187 | Risk Ratio (M‐H, Fixed, 95% CI) | 1.13 [0.85, 1.50] |
| 5.1.3 HD TRIPLE vs MD‐ICS/LABA | 2 | 2039 | Risk Ratio (M‐H, Fixed, 95% CI) | 1.05 [0.76, 1.47] |
| 5.1.4 MD TRIPLE vs HD‐ICS/LABA | 2 | 2660 | Risk Ratio (M‐H, Fixed, 95% CI) | 1.08 [0.81, 1.44] |
| 5.1.5 HD TRIPLE vs HD‐ICS/LABA | 4 | 5004 | Risk Ratio (M‐H, Fixed, 95% CI) | 0.95 [0.77, 1.18] |
| 5.1.6 HD TRIPLE vs MD TRIPLE | 3 | 2998 | Risk Ratio (M‐H, Fixed, 95% CI) | 0.96 [0.72, 1.27] |
| 5.1.7 TRIPLE vs DUAL | 6 | 8192 | Risk Ratio (M‐H, Fixed, 95% CI) | 1.03 [0.87, 1.21] |
| 5.2 Asthma‐related SAEs | 12 | Risk Ratio (M‐H, Fixed, 95% CI) | Subtotals only | |
| 5.2.1 HD‐ICS/LABA vs MD‐ICS LABA | 6 | 6244 | Risk Ratio (M‐H, Fixed, 95% CI) | 1.33 [0.80, 2.21] |
| 5.2.2 MD TRIPLE vs MD‐ICS/LABA | 3 | 3188 | Risk Ratio (M‐H, Fixed, 95% CI) | 1.52 [0.85, 2.69] |
| 5.2.3 HD TRIPLE vs MD‐ICS/LABA | 2 | 2039 | Risk Ratio (M‐H, Fixed, 95% CI) | 0.86 [0.41, 1.80] |
| 5.2.4 MD TRIPLE vs HD‐ICS/LABA | 2 | 2660 | Risk Ratio (M‐H, Fixed, 95% CI) | 1.35 [0.77, 2.36] |
| 5.2.5 HD TRIPLE vs HD‐ICS/LABA | 4 | 5004 | Risk Ratio (M‐H, Fixed, 95% CI) | 0.86 [0.58, 1.27] |
| 5.2.6 HD TRIPLE vs MD TRIPLE | 3 | 3472 | Risk Ratio (M‐H, Fixed, 95% CI) | 0.57 [0.31, 1.05] |
| 5.2.7 TRIPLE vs DUAL | 6 | 8192 | Risk Ratio (M‐H, Fixed, 95% CI) | 1.04 [0.76, 1.42] |
| 5.3 All cause AEs | 13 | Risk Ratio (M‐H, Random, 95% CI) | Subtotals only | |
| 5.3.1 HD‐ICS/LABA vs MD‐ICS LABA | 7 | 5949 | Risk Ratio (M‐H, Random, 95% CI) | 1.01 [0.97, 1.06] |
| 5.3.2 MD TRIPLE vs MD‐ICS/LABA | 3 | 3188 | Risk Ratio (M‐H, Random, 95% CI) | 0.96 [0.91, 1.00] |
| 5.3.3 HD TRIPLE vs MD‐ICS/LABA | 2 | 2039 | Risk Ratio (M‐H, Random, 95% CI) | 0.92 [0.85, 1.00] |
| 5.3.4 MD TRIPLE vs HD‐ICS/LABA | 2 | 2659 | Risk Ratio (M‐H, Random, 95% CI) | 0.99 [0.83, 1.18] |
| 5.3.5 HD TRIPLE vs HD‐ICS/LABA | 4 | 5004 | Risk Ratio (M‐H, Random, 95% CI) | 0.91 [0.87, 0.96] |
| 5.3.6 HD TRIPLE vs MD TRIPLE | 3 | 2998 | Risk Ratio (M‐H, Random, 95% CI) | 0.95 [0.89, 1.02] |
| 5.3.7 TRIPLE vs DUAL | 6 | 8192 | Risk Ratio (M‐H, Random, 95% CI) | 0.93 [0.90, 0.96] |
| 5.4 Dropouts due to adverse event | 14 | Risk Ratio (M‐H, Random, 95% CI) | Subtotals only | |
| 5.4.1 HD‐ICS/LABA vs MD‐ICS LABA | 7 | 5969 | Risk Ratio (M‐H, Random, 95% CI) | 1.00 [0.68, 1.48] |
| 5.4.2 MD TRIPLE vs MD‐ICS/LABA | 3 | 3205 | Risk Ratio (M‐H, Random, 95% CI) | 0.42 [0.08, 2.14] |
| 5.4.3 HD TRIPLE vs MD‐ICS/LABA | 2 | 2670 | Risk Ratio (M‐H, Random, 95% CI) | 0.47 [0.19, 1.18] |
| 5.4.4 MD TRIPLE vs HD‐ICS/LABA | 2 | 2668 | Risk Ratio (M‐H, Random, 95% CI) | 1.24 [0.76, 2.02] |
| 5.4.5 HD TRIPLE vs HD‐ICS/LABA | 4 | 5018 | Risk Ratio (M‐H, Random, 95% CI) | 0.60 [0.38, 0.95] |
| 5.4.6 HD TRIPLE vs MD TRIPLE | 2 | 1765 | Risk Ratio (M‐H, Random, 95% CI) | 1.00 [0.29, 3.44] |
| 5.4.7 TRIPLE vs DUAL | 5 | 8223 | Risk Ratio (M‐H, Random, 95% CI) | 0.59 [0.33, 1.03] |
Comparison 6. Severe exacerbations (high and low risk subgroups).
| Outcome or subgroup title | No. of studies | No. of participants | Statistical method | Effect size |
|---|---|---|---|---|
| 6.1 HD‐ICS/LABA vs MD‐ICS/LABA | 5 | 4492 | Risk Ratio (M‐H, Fixed, 95% CI) | 1.49 [0.74, 3.01] |
| 6.1.1 High Risk | 1 | 1562 | Risk Ratio (M‐H, Fixed, 95% CI) | 8.27 [1.09, 62.72] |
| 6.1.2 Low Risk | 4 | 2930 | Risk Ratio (M‐H, Fixed, 95% CI) | 0.81 [0.35, 1.83] |
| 6.2 MD TRIPLE vs MD‐ICS/LABA | 1 | 813 | Odds Ratio (M‐H, Fixed, 95% CI) | 1.00 [0.35, 2.88] |
| 6.2.1 Low Risk | 1 | 813 | Odds Ratio (M‐H, Fixed, 95% CI) | 1.00 [0.35, 2.88] |
| 6.3 HD TRIPLE vs MD‐ICS/LABA | 1 | 815 | Odds Ratio (M‐H, Fixed, 95% CI) | 0.57 [0.16, 1.95] |
| 6.3.1 Low Risk | 1 | 815 | Odds Ratio (M‐H, Fixed, 95% CI) | 0.57 [0.16, 1.95] |
| 6.4 MD TRIPLE vs HD‐ICS/LABA | 1 | 812 | Odds Ratio (M‐H, Fixed, 95% CI) | 1.41 [0.44, 4.47] |
| 6.4.1 Low Risk | 1 | 812 | Odds Ratio (M‐H, Fixed, 95% CI) | 1.41 [0.44, 4.47] |
| 6.5 HD TRIPLE vs HD‐ICS/LABA | 2 | 1727 | Odds Ratio (M‐H, Fixed, 95% CI) | 0.79 [0.44, 1.44] |
| 6.5.1 High Risk | 1 | 913 | Odds Ratio (M‐H, Fixed, 95% CI) | 0.79 [0.40, 1.55] |
| 6.5.2 Low Risk | 1 | 814 | Odds Ratio (M‐H, Fixed, 95% CI) | 0.79 [0.21, 2.98] |
| 6.6 HD TRIPLE vs MD TRIPLE | 1 | 814 | Odds Ratio (M‐H, Fixed, 95% CI) | 0.56 [0.16, 1.94] |
| 6.6.1 Low Risk | 1 | 814 | Odds Ratio (M‐H, Fixed, 95% CI) | 0.56 [0.16, 1.94] |
| 6.7 TRIPLE vs DUAL | 2 | 2540 | Odds Ratio (M‐H, Fixed, 95% CI) | 0.84 [0.50, 1.41] |
| 6.7.1 High Risk | 1 | 913 | Odds Ratio (M‐H, Fixed, 95% CI) | 0.79 [0.40, 1.55] |
| 6.7.2 Low Risk | 1 | 1627 | Odds Ratio (M‐H, Fixed, 95% CI) | 0.91 [0.40, 2.08] |
Comparison 7. Moderate to severe exacerbations (high and low risk subgroups).
| Outcome or subgroup title | No. of studies | No. of participants | Statistical method | Effect size |
|---|---|---|---|---|
| 7.1 HD‐ICS/LABA vs MD‐ICS/LABA | 6 | 5452 | Risk Ratio (M‐H, Fixed, 95% CI) | 0.93 [0.82, 1.05] |
| 7.1.1 High Risk | 1 | 1830 | Risk Ratio (M‐H, Fixed, 95% CI) | 0.97 [0.83, 1.14] |
| 7.1.2 Low Risk | 5 | 3622 | Risk Ratio (M‐H, Fixed, 95% CI) | 0.87 [0.71, 1.07] |
| 7.2 MD TRIPLE vs MD‐ICS/LABA | 3 | 3184 | Risk Ratio (M‐H, Fixed, 95% CI) | 0.86 [0.75, 0.98] |
| 7.2.1 High Risk | 2 | 2371 | Risk Ratio (M‐H, Fixed, 95% CI) | 0.84 [0.72, 0.98] |
| 7.2.2 Low Risk | 1 | 813 | Risk Ratio (M‐H, Fixed, 95% CI) | 0.94 [0.70, 1.25] |
| 7.3 HD TRIPLE vs MD‐ICS/LABA | 1 | 815 | Risk Ratio (M‐H, Fixed, 95% CI) | 0.74 [0.54, 1.01] |
| 7.3.1 Low Risk | 1 | 815 | Risk Ratio (M‐H, Fixed, 95% CI) | 0.74 [0.54, 1.01] |
| 7.4 MD TRIPLE vs HD‐ICS/LABA | 2 | 2651 | Risk Ratio (M‐H, Fixed, 95% CI) | 1.00 [0.86, 1.15] |
| 7.4.1 High Risk | 1 | 1839 | Risk Ratio (M‐H, Fixed, 95% CI) | 0.93 [0.78, 1.09] |
| 7.4.2 Low Risk | 1 | 812 | Risk Ratio (M‐H, Fixed, 95% CI) | 1.26 [0.92, 1.74] |
| 7.5 HD TRIPLE vs HD‐ICS/LABA | 4 | 4989 | Risk Ratio (M‐H, Fixed, 95% CI) | 0.83 [0.75, 0.92] |
| 7.5.1 High Risk | 3 | 4175 | Risk Ratio (M‐H, Fixed, 95% CI) | 0.81 [0.73, 0.91] |
| 7.5.2 Low Risk | 1 | 814 | Risk Ratio (M‐H, Fixed, 95% CI) | 1.00 [0.71, 1.40] |
| 7.6 HD TRIPLE vs MD TRIPLE | 3 | 2996 | Risk Ratio (M‐H, Fixed, 95% CI) | 0.86 [0.72, 1.02] |
| 7.6.1 High Risk | 2 | 2182 | Risk Ratio (M‐H, Fixed, 95% CI) | 0.89 [0.73, 1.09] |
| 7.6.2 Low Risk | 1 | 814 | Risk Ratio (M‐H, Fixed, 95% CI) | 0.79 [0.57, 1.08] |
| 7.7 TRIPLE vs DUAL | 4 | 7887 | Risk Ratio (M‐H, Fixed, 95% CI) | 0.86 [0.79, 0.93] |
| 7.7.1 High Risk | 3 | 6260 | Risk Ratio (M‐H, Fixed, 95% CI) | 0.84 [0.77, 0.92] |
| 7.7.2 Low Risk | 1 | 1627 | Risk Ratio (M‐H, Fixed, 95% CI) | 0.96 [0.77, 1.20] |
7.1. Analysis.
Comparison 7: Moderate to severe exacerbations (high and low risk subgroups), Outcome 1: HD‐ICS/LABA vs MD‐ICS/LABA
7.2. Analysis.
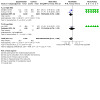
Comparison 7: Moderate to severe exacerbations (high and low risk subgroups), Outcome 2: MD TRIPLE vs MD‐ICS/LABA
7.3. Analysis.
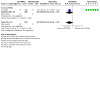
Comparison 7: Moderate to severe exacerbations (high and low risk subgroups), Outcome 3: HD TRIPLE vs MD‐ICS/LABA
7.4. Analysis.
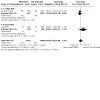
Comparison 7: Moderate to severe exacerbations (high and low risk subgroups), Outcome 4: MD TRIPLE vs HD‐ICS/LABA
7.5. Analysis.
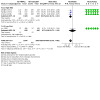
Comparison 7: Moderate to severe exacerbations (high and low risk subgroups), Outcome 5: HD TRIPLE vs HD‐ICS/LABA
Characteristics of studies
Characteristics of included studies [ordered by study ID]
Bernstein 2011.
| Study characteristics | ||
| Methods |
DESIGN: randomised controlled trial GROUP: parallel group DURATION OF THE STUDY: 12 weeks SPONSORSHIP SOURCE: Merck Sharp & Dohme COUNTRY: Canada, Colombia, Costa Rica, Czech Republic, Ecuador, Estonia, Finland, Former Serbia and Montenegro, Germany, Latvia, Lithuania, the Netherlands, Puerto Rico, Romania, Russian Federation, Serbia, Slovenia, Ukraine, United |
|
| Participants |
BASELINE CHARACTERISTICS: No. of patients included in this review: 722 Mean age: 44.9 Male %: 86 White %: 86 Current and Ex smoker excluded: yes. > 10 PYs for ex‐smokers Baseline FEV1 (L) pre‐bronchodilator: 2.33 Baseline FEV1 % predicted: 74.1 Hx of asthma exacerbation: not required INCLUSION CRITERIA: participants must have a diagnosis of asthma for at least 12 months' duration. A participant must have been using a medium daily dose of inhaled glucocorticosteroids (alone or in combination with LABA) for at least 12 weeks and must have been on a stable regimen for at least 2 weeks prior to Screening. If there is no inherent harm in changing the participant's current asthma therapy, the participant must be willing to discontinue his/her prescribed ICS or ICS/LABA prior to initiating MF MDI run‐in medication. The diagnosis of asthma must be documented by either demonstrating an increase in absolute fFEV1 of at least 12% and a volume increase of at least 200 mL within approximately 15 to 20 minutes after administration of 4 inhalations of albuterol/salbutamol or of nebulised SABA or PEF variability of more than 20% or a diurnal variation PEF of more than 20% based on the difference between pre‐bronchodilator (before taking albuterol/salbutamol) morning value and the post‐bronchodilator value (after taking albuterol/salbutamol) from the evening before, expressed as a percentage of the mean daily PEF value on any day during the open‐label Run‐in Period. A participant must have a history of >: 2 asthma‐related unscheduled visits to a physician or to an emergency room within the past year AND >: 3 asthma‐related unscheduled visits within the past 2 years. Prior to randomisation participants must have used a total of 12 or more inhalations of SABA rescue medication during the last 10 days of run‐in. Clinical laboratory tests (complete blood counts (CBC), blood chemistries, including serum pregnancy for females of child‐bearing potential, and urinalysis) conducted at the Screening Visit must be within normal limits or clinically acceptable to the investigator/sponsor before the participant is instructed to start using open‐label MF MDI run‐in medication. An ECG performed at the Screening Visit, using a centralised trans‐telephonic technology, must be clinically acceptable to the investigator. A chest x‐ray performed at the Screening Visit, or within 12 months prior to the Screening Visit, must be clinically acceptable to the investigator. A non‐pregnant female participant of childbearing potential must be using a medically acceptable, adequate form of birth control. A female participant of childbearing potential must have a negative serum pregnancy test at Screening in order to be considered eligible for enrolment. EXCLUSION CRITERIA: a participant who demonstrates a change in absolute FEV1 of > 20% at any time between the Screening and Baseline Visits on any 2 consecutive days between the Screening and Baseline visits. A participant who requires the use of greater than 8 inhalations per day of SABA MDI or 2 or more nebulised treatments per day of 2.5 mg SABA on any 2 consecutive days between the Screening and Baseline Visits. A participant who experiences a decrease in AM or PM PEF below the Run‐in Period stability limit on any 2 consecutive days prior to randomisation. The average AM and average PM PEF respective values from the preceding 7 days are added, divided by the number of non‐missing values, and multiplied by 0.70 to determine the stability limit. A participant who experiences a clinical asthma exacerbation: defined as a clinical deterioration of asthma as judged by the clinical investigator between the Screening and Baseline Visits, that results in emergency treatment, hospitalisation due to asthma, or treatment with additional, excluded asthma medication (including oral or other systemic corticosteroids, but allowing SABA). |
|
| Interventions | FP/SAL 250/50 µg twice daily MF/FM 200/10 µg twice daily |
|
| Outcomes | Moderate to severe exacerbations All‐cause serious adverse events All‐cause adverse events Asthma‐related serious adverse events Dropouts due to adverse event |
|
| Notes | Intragroup comparison of MD‐ICS/LABAs. NMA only. NCT00424008 | |
Bernstein 2015.
| Study characteristics | ||
| Methods |
DESIGN: randomised controlled trial
GROUP: Parallel group
DURATION OF THE STUDY: 12 weeks SPONSORSHIP SOURCE: GlaxoSmithKline COUNTRY: Argentina, Chile, Germany, Mexico, Netherlands, Poland, Romania, Russian Federation, Sweden, Ukraine, USA |
|
| Participants |
BASELINE CHARACTERISTICS: No. of patients included in this review: 692 Mean age: 45.3 Male %: 38 White %: 88 Current and Ex smoker excluded: Yes. > 10 PYs for ex‐smokers Baseline FEV1 (L) pre‐bronchodilator: 1.97 Baseline FEV1 % predicted: 62.4 Hx of asthma exacerbation: Not required (71% did not have a hx of exacerbations) INCLUSION CRITERIA: participants must give their signed and dated (written) informed consent to participate. Written informed consent must be obtained if a participant's current medication is changed as a result of study participation Outpatient >12 years of age at Visit 1 who have had a diagnosis of asthma, as defined by the National Institutes of Health. Countries with local restrictions prohibiting enrolment of adolescents will only enrol subjects >18 years of age Male or an eligible female. Eligible female is defined as having non‐childbearing potential or having childbearing potential and using an acceptable method of birth control consistently and correctly. Best pre‐bronchodilator FEV1 of 40% to 80% of their predicted normal value. Demonstrate ≥ 12% and ≥ 200 mL reversibility of FEV1 within 10 to 40 minutes following 4 inhalations of albuterol/salbutamol inhalation aerosol (or an equivalent nebulised treatment with albuterol/salbutamol solution) or have documented reversibility testing within the 6 months prior to Visit 1 meeting this measure of reversibility. A spacer device may be used for testing, if required. If participants have received ICS for at least 12 weeks prior to Visit 1 and their treatment during the 4 weeks immediately prior to Visit 1 consisted of either of the two regimens (a or b).a.) A stable mid‐dose or high‐dose of ICS alone (e.g., ≥ FP 250 µg twice daily) or b.) A stable dose of a mid‐dose ICS/LABA combination (e.g., FP/Salm 250/50 µg twice daily) or an equivalent combination via separate inhalers. Use of ICS/LABA are not permitted with LABA on the day of Visit 1. Must be able to replace current SABA treatment with albuterol/salbutamol aerosol inhaler at Visit 1 for use as needed, during the study. Participants must be able to withhold albuterol/salbutamol for at least 6 hours prior to study visits. EXCLUSION CRITERIA: history of life‐threatening asthma, defined as an asthma episode that required intubation and/or was associated with hypercapnia, respiratory arrest or hypoxic seizures within the last 5 years. Upper or lower respiratory tract, sinus, or middle ear that is: not resolved within 4 weeks of Visit 1 and led to a change in asthma management or, in the opinion of the investigator, expected to affect the participant's asthma status or the participant's ability to participate in the study. Any asthma exacerbation that required oral corticosteroids within the 12 weeks prior to Visit 1 or, resulted in an overnight hospitalisation requiring additional treatment for asthma within 6 months prior to Visit 1. A subject must not have current evidence of atelectasis (segmental or larger), bronchopulmonary dysplasia, COPD, or any evidence of concurrent respiratory disease other than asthma A subject must not have any clinically significant, uncontrolled condition or disease state that, in the opinion of the investigator, would put the safety of the subject at risk through study participation or would confound the interpretation of the efficacy results if the condition/disease exacerbated during the study Chronic stable hepatitis B or C are acceptable provided their screening ALT is < 2x uULN and the y otherwise meet the entry criteria. Chronic co‐infection with both hepatitis B and hepatitis C are not eligible Clinical visual evidence of candidiasis at Visit 1 Use of any investigational drug within 30 days prior to Visit 1 or within five half‐lives (t½), whichever is longer of the two. Allergies to drug or milk protein: any adverse reaction, to any beta2‐agonist, sympathomimetic drug, or any intranasal, inhaled, or systemic corticosteroid therapy or known or suspected sensitivity to the constituents of the NDPI, or history of severe milk protein allergy Administration of medication that would significantly affect the course of asthma, or interact with study drug Use of immunosuppressive medications during the study. Use of potent CYP3A4 inhibitor within 4 weeks of Visit 1. A subject or his/her parent or legal guardian has any infirmity, disability, disease, or resides in a geographical location which seems likely, in the opinion of the Investigator, to impair compliance with any aspect of this study protocol, including visit schedule, and completion of the daily diaries. Current smoker or has a smoking history of 10 pack‐years (20 cigarettes/day for 10 years). A subject may not have used inhaled tobacco products within the past 3 months (i.e., cigarettes, cigars, or pipe tobacco). If participant is an immediate family member of the participating investigator, sub‐investigator, study coordinator, or employee of the participating investigator. Participant previously randomised to treatment with FF/VI or FF in another Phase III study. Participants working on night shift a week prior to Visit 1 or during the study period. Adolescents who are wards of the state or government SYMPTOM CRITERIA: asthma symptoms (a score of 3 on the combined day‐ and nighttime asthma symptom scale) and/or daily salbutamol use on 4 of the last 7 days of the run‐in period. |
|
| Interventions | MD‐ICS/LABA HD‐ICS/LABA |
|
| Outcomes | Moderate to severe exacerbations Severe exacerbations All‐cause serious adverse events All‐cause adverse events Dropouts due to adverse event | |
| Notes |
NCT01686633 Clinical Study Report available at https://www.gsk‐studyregister.com/en/trial‐details/?id=116863 |
|
Bodzenta‐Lukaszyk 2012.
| Study characteristics | ||
| Methods |
DESIGN: randomised controlled trial
GROUP: parallel group
DURATION OF THE STUDY: 12 weeks SPONSORSHIP SOURCE: Mundipharma Research Ltd COUNTRY: Bulgaria, Hungary, India, Poland, Romania |
|
| Participants |
BASELINE CHARACTERISTICS: No. of patients included in this review: 279 Mean age: 49 Male %: 32 White %: 96 Current and Ex smoker excluded: yes. > 10 PYs for ex‐smokers Baseline FEV1 (L) pre‐bronchodilator: not reported Baseline FEV1 % predicted: 64.4 Hx of asthma exacerbation: Not required. Inclusion Criteria:
Exclusion criteria:
|
|
| Interventions | FP/FM 250/10 µg twice daily BUD/FM 400/12 µg twice daily | |
| Outcomes | Moderate to severe exacerbations Severe exacerbations All‐cause adverse events Asthma‐related serious adverse events Dropouts due to adverse event | |
| Notes | Intragroup comparison of MD‐ICS/LABAs. NMA only. NCT01099722 | |
Busse 2008.
| Study characteristics | ||
| Methods |
DESIGN: randomised controlled trial
GROUP: parallel group
DURATION OF THE STUDY: 24 weeks SPONSORSHIP SOURCE: AstraZeneca COUNTRY: USA |
|
| Participants |
BASELINE CHARACTERISTICS: No. of patients included in this review: 833 Mean age: 39.1 Male %: 38 White %: 83 Current and Ex smoker excluded: Yes. > 20 PYs for ex‐smokers Baseline FEV1 (L) pre‐bronchodilator: 2.55 Baseline FEV1 % predicted: 78.6 Hx of asthma exacerbation: Not required. Inclusion Criteria:
Exclusion Criteria:
|
|
| Interventions | FP/SAL 250/50 µg twice daily BUD/FM 320/9 µg twice daily |
|
| Outcomes | Moderate to severe exacerbations Severe exacerbations Dropouts due to adverse event | |
| Notes | Intragroup comparison of MD‐ICS/LABAs. NMA only. NCT00646594 Clinical Study Report available at https://www.gsk‐studyregister.com/en/trial‐details/?id=106839 |
|
Cukier 2013.
| Study characteristics | ||
| Methods |
DESIGN: randomised controlled trial
GROUP: Parallel group
DURATION OF THE STUDY: 12 weeks SPONSORSHIP SOURCE: Libbs Pharmaceutical Ltd COUNTRY: 11 research centres in Brazil |
|
| Participants |
BASELINE CHARACTERISTICS: No. of patients included in this review: 196 Mean age: 35.1 Male %:26 White %: 69 Current and Ex smoker excluded: Yes. > 10 PYs for ex‐smokers Baseline FEV1 (L) pre‐bronchodilator: 2.5 Baseline FEV1 % predicted: 85.3 Hx of asthma exacerbation: Not required. Inclusion criteria 1. Male or female from 18 to 65 years old with known history of asthma according toGINA update 2008 criteria for at least three months. 2. Patients with partially controlled or non‐controlled asthma using therapeutic doses of ICS combined with LABA (daily doses equal or more than 400 mcg of budesonide or similar drugs) for at least four weeks 3. FEV1 > 60 % of predicted normal value 4. Willing and able to keep diary and attend all visits 5. Written informed consent obtained Exclusion criteria 1. Pregnant or nursing women 2. Females of childbearing potential without an effective method of birth control 3. Use of systemic corticosteroid within 30 days before randomisation 4. Three or more treatments with oral corticosteroid or history of asthma hospitalisation in the previous six months 5. Use of the following drugs within two weeks before randomisation: 5.1. meltixantines 5.2. monoaminurias 5.3. beta‐blockers 5.4. acetylcysteine 5.5. carbocisteine 5.6. tricyclic antidepressive 5.7. sodium channel blockers 5.8. leukotriene 5.9. anticholinergic 5.10. phenothiazines 5.11. immunotherapy 5.12. levodopa 5.13. ritonavir 5.14. oral ketoconazole 6. Current evidence of history of hypersensitivity to the study drug 7. Evidence of non‐adhesion to the treatment during run‐in phase 8. A smoking history equivalent to "10 pack years" (i.e., at least 1 pack of 20 cigarettes/day for 10 years or 10 packs/day for 1 year, etc) 9. Clinically significant laboratory test results during the screening phase 10. Morning serum level of cortisol < 5 mcg/dL 11. Inability to perform the lung function test 12. Current evidence of other pulmonary disease 13. Patients with asthma exacerbation during the run‐in period 14. Evidence of clinically significant oral candidiasis |
|
| Interventions | FP/FM 250/12 µg twice daily BUD/FM 400/12 µg twice daily | |
| Outcomes | Moderate to severe exacerbations All‐cause serious adverse events All‐cause adverse events Dropouts due to adverse event | |
| Notes | Intragroup comparison of MD‐ICS/LABAs. NMA only. ISRCTN60408425 | |
Gessner 2020.
| Study characteristics | ||
| Methods |
DESIGN: randomised controlled trial
GROUP: parallel group
DURATION OF THE STUDY: 24 weeks SPONSORSHIP SOURCE: Novartis COUNTRY: Argentina, Chile, Colombia, Czechia, Germany, Greece, Hungary, India, Israel, Mexico, Peru, Poland, Russian Federation, Serbia, Slovakia, South Africa, Spain, Taiwan, Turkey, Vietnam |
|
| Participants |
BASELINE CHARACTERISTICS: No. of patients included in this review: 1426 Mean age: 52.6 Male %: 37 White %: 83 Current and Ex smoker excluded: Yes. > 10 PYs for ex‐smokers Baseline FEV1 (L) pre‐bronchodilator: not reported. Baseline FEV1 % predicted: 63 Hx of asthma exacerbation: required a history of at least one asthma exacerbation that required medical care from a physician, emergency room visit or hospitalisation and systemic corticosteroid in the previous year. Inclusion Criteria:
Exclusion Criteria:
|
|
| Interventions | LD TRIPLE: MF/GLY/IND µg 80/50/150 daily MD TRIPLE: MF/GLY/IND µg 160/50/150 daily HD TRIPLE: FP/SAL 500/50 µg twice daily + Tio 5 µg daily |
|
| Outcomes | Moderate to severe exacerbations All‐cause serious adverse events All‐cause adverse events Asthma‐related serious adverse events Dropouts due to adverse event ACQ responder at 6 months CFB in ACQ at 3 months CFB in ACQ at 6 months CFB in AQLQ at 3 months CFB in AQLQ at 6 months |
|
| Notes | NCT03158311 | |
Kerstjens 2012.
| Study characteristics | ||
| Methods |
DESIGN: randomised controlled trial
GROUP: parallel group
DURATION OF THE STUDY: 48 weeks SPONSORSHIP SOURCE: Boehringer Ingelheim COUNTRY: Australia, Canada, Denmark, Germany, Italy, Japan, the,Russian Federation, Serbia, South Africa, Turkey, Ukraine,the UK, the USA |
|
| Participants |
BASELINE CHARACTERISTICS: No. of patients included in this review: 3092 Mean age: 52.2 Male %: 38 White %: 74 Current and Ex smoker excluded: Yes. > 10 PYs for ex‐smokers Baseline FEV1 (L) pre‐bronchodilator: 1.6 Baseline FEV1 % predicted: 54.8 Hx of asthma exacerbation: Required at least one asthma exacerbation that required medical care from a physician, emergency room visit, hospitalisation, and systemic corticosteroid treatment in the previus year. Inclusion criteria:
Exclusion criteria:
|
|
| Interventions | HD‐ICS/LABA (Not specified) HD TRIPLE (Not specified) |
|
| Outcomes | Moderate to severe exacerbations Severe exacerbations All‐cause serious adverse events All‐cause adverse events Asthma‐related serious adverse events Dropouts due to adverse event ACQ responder at 6 months ACQ responder at 12 months CFB in ACQ at 6 months CFB in ACQ at 12 months CFB in AQLQ at 6 months CFB in AQLQ at 12 months | |
| Notes | NCT00772538, NCT00776984 | |
Kerstjens 2012a.
| Study characteristics | ||
| Methods | See Kerstjens 2012 | |
| Participants | ||
| Interventions | ||
| Outcomes | ||
| Notes | NCT00772538 | |
Kerstjens 2012b.
| Study characteristics | ||
| Methods | See Kerstjens 2012 | |
| Participants | ||
| Interventions | ||
| Outcomes | ||
| Notes | NCT00776984 | |
Kerstjens 2020.
| Study characteristics | ||
| Methods |
DESIGN: randomised controlled trial
GROUP: parallel group
DURATION OF THE STUDY: 26‐52 weeks SPONSORSHIP SOURCE: Novartis COUNTRY: Argentina, Austria, Belgium, Bulgaria, Canada, Chile, China, Colombia, Croatia, Denmark, Estonia, Finland, France, Germany, Greece, Hungary, India, Ireland, Israel, Italy, Japan, Jordan, Latvia, Lebanon, Lithuania, Mexico, the Netherlands, Peru, Philippines, Poland, Portugal, Romania, Russian Federation, Slovakia, South Africa, Spain, Sweden, Switzerland, Thailand, the UK, Vietnam |
|
| Participants |
BASELINE CHARACTERISTICS: No. of patients included in this review: 3092 Mean age: 52.2 Male %: 38 White %: 74 Current and Ex smoker excluded: Yes. > 10 PYs for ex‐smokers Baseline FEV1 (L) pre‐bronchodilator: 1.6 Baseline FEV1 % predicted: 54.8 Hx of asthma exacerbation: required at least one asthma exacerbation that required medical care from a physician, emergency room visit, hospitalisation, and systemic corticosteroid treatment in the previus year. Inclusion Criteria:
Exclusion Criteria:
|
|
| Interventions | MD‐ICS/LABA: MF/IND 160/150 µg daily HD‐ICS/LABA: MF/IND 320/150 µg daily, FP/SAL 500/50 µg twice daily LD TRIPLE: MF/GLY/IND 80/50/150 µg daily MD TRIPLE: MF/GLY/IND 160/50/150 µg daily |
|
| Outcomes | Moderate to severe exacerbations Severe exacerbations All‐cause serious adverse events All‐cause adverse events Asthma‐related serious adverse events Dropouts due to adverse event ACQ responder at 6 months ACQ responder at 12 months CFB in ACQ at 6 months CFB in ACQ at 12 months CFB in AQLQ at 12 months |
|
| Notes | NCT02571777 | |
Lee 2020.
| Study characteristics | ||
| Methods |
DESIGN: randomised controlled trial
GROUP: parallel group
DURATION OF THE STUDY: 24‐52 weeks SPONSORSHIP SOURCE: GlaxoSmithKline COUNTRY: Argentina, Australia, Canada, Germany, Italy, Japan, Korea, Republic of,the Netherlands, Poland, Romania, Russian Federation, South Africa, Spain, UK, USA |
|
| Participants |
BASELINE CHARACTERISTICS: No. of patients included in this review: 1627 Mean age: 53.5 Male %: 38 White %: 80 Current and Ex smoker excluded: Yes. > 10 PYs for ex‐smokers Baseline FEV1 (L) pre‐bronchodilator: 1.73 Baseline FEV1 % predicted:58.7 Hx of asthma exacerbation: Not required (37% did not have a hx of exacerbation) Inclusion Criteria
Exclusion Criteria
|
|
| Interventions | MD‐ICS/LABA: FF/VI 100/25 µg daily HD‐ICS/LABA: FF/VI 200/25 µg daily MD TRIPLE: FF/UMEC/VI 100/62.5/25 µg daily HD TRIPLE: FF/UMEC/VI 200/62.5/25 µg daily |
|
| Outcomes | Moderate to severe exacerbations Severe exacerbations All‐cause serious adverse events All‐cause adverse events Asthma‐related serious adverse events Dropouts due to adverse event ACQ responder at 6 months CFB in ACQ at 3 months CFB in ACQ at 6 months CFB in ACQ at 12 months |
|
| Notes |
NCT02924688 Clinical Study Report available at https://www.gsk‐studyregister.com/en/trial‐details/?id=205715 |
|
Mansfield 2017.
| Study characteristics | ||
| Methods |
DESIGN: multicentre randomised controlled trial
GROUP: parallel group
DURATION OF THE STUDY: 26 weeks SPONSORSHIP SOURCE: Teva Branded Pharmaceutical COUNTRY:USA |
|
| Participants |
BASELINE CHARACTERISTICS: No. of patients included in this review: 218 Mean age: 46.0 Male %: 47 White %: 72 Current and Ex smoker excluded: yes. > 10 PYs for ex‐smokers Baseline FEV1 (L) pre‐bronchodilator: 2.37 Baseline FEV1 % predicted: not reported. Hx of asthma exacerbation: not required. Inclusion Criteria:
Exclusion Criteria:
|
|
| Interventions | MD‐ICS/LABA: FP/SAL 250/50 µg twice daily, FP/SAL 200/12.5 µg twice daily HD‐ICS/LABA: FP/SAL 500/50 µg twice daily |
|
| Outcomes | Moderate to severe exacerbations Severe exacerbations All‐cause serious adverse events All‐cause adverse events Asthma‐related serious adverse events Dropouts due to adverse event |
|
| Notes | NCT02175771 | |
Papi 2007.
| Study characteristics | ||
| Methods |
DESIGN: randomised controlled trial
GROUP: Parallel group
DURATION OF THE STUDY: 12 weeks SPONSORSHIP SOURCE: Chiesi Farmaceutici COUNTRY: Poland, Ukraine |
|
| Participants |
BASELINE CHARACTERISTICS: No. of patients included in this review: 228 Mean age: 48.5 Male %: 44 White %: not reported Current and Ex smoker excluded: yes. > 10 PYs for ex‐smokers Baseline FEV1 (L) pre‐bronchodilator: 2.03 Baseline FEV1 % predicted: 67.3 Hx of asthma exacerbation: not required. Inclusion Criteria:
Exclusion Criteria:
|
|
| Interventions | FP/SAL 250/50 µg twice daily BDP/FM 200/12 µg twice daily |
|
| Outcomes | Moderate to severe exacerbations | |
| Notes | Intragroup comparison of MD‐ICS/LABAs. NMA only. NCT00394368 | |
Peters 2008.
| Study characteristics | ||
| Methods |
DESIGN: multicentre randomised controlled trial
GROUP: parallel group
DURATION OF THE STUDY: 52 weeks SPONSORSHIP SOURCE: AstraZeneca COUNTRY: USA |
|
| Participants |
BASELINE CHARACTERISTICS: No. of patients included in this review: 575 Mean age: 40.4 Male %: 38 White %: 87 Current and Ex smoker excluded: yes. > 10 PYs for ex‐smokers Baseline FEV1 (L) pre‐bronchodilator: 2.4 Baseline FEV1 % predicted: 74.2 Hx of asthma exacerbation: not required Inclusion Criteria:
Exclusion Criteria:
|
|
| Interventions | MD‐ICS/LABA: BUD/FM 320/9 µg twice daily HD‐ICS/LABA: BUD/FM 640/18 µg twice daily |
|
| Outcomes | Moderate to severe exacerbations Severe exacerbations All‐cause serious adverse events Al‐ cause adverse events Dropouts due to adverse event |
|
| Notes |
NCT00651768 Clinical Study Report available at https://astrazenecagrouptrials.pharmacm.com/ST/Submission/View?id=964 |
|
Stempel 2016.
| Study characteristics | ||
| Methods |
DESIGN: randomised controlled trial
GROUP: parallel group
DURATION OF THE STUDY: 26 weeks SPONSORSHIP SOURCE: GlaxoSmithKline COUNTRY: Argentina, Australia, Austria, Belgium, Bulgaria, Canada, Chile, Colombia, Croatia, Czechia, Denmark, Germany, Hungary, Indonesia, Italy, Korea, Republic of, Latvia, Lithuania, Malaysia, Mexico, Peru, Philippines, Poland, Romania, Russian Federation, Serbia, Slovakia, South Africa, Spain, Taiwan, Ukraine, UK, USA |
|
| Participants |
BASELINE CHARACTERISTICS: No. of patients included in this review: 1562 Mean age: 43.4 Male %: 34 White %: 75 Current and Ex smoker excluded: yes. > 10 PYs for ex‐smokers Baseline FEV1 (L) pre‐bronchodilator: not reported Baseline FEV1 % predicted: not reported (Baseline PEF to be >:50% to be enroled) Hx of asthma exacerbation: Required at least one asthma exacerbation that required medical care from a physician, hospitalisation, and systemic corticosteroid treatment in the previous year Inclusion Criteria:
Exclusion Criteria:
|
|
| Interventions | MD‐ICS/LABA: FP/SAL 250/50 µg twice daily HD‐ICS/LABA: FP/SAL 500/50 µg twice daily |
|
| Outcomes | Severe exacerbations All cause serious adverse events Asthma‐related serious adverse events |
|
| Notes | NCT01475721 | |
van Zyl‐Smit 2020.
| Study characteristics | ||
| Methods |
DESIGN: randomised controlled trial
GROUP: parallel group
DURATION OF THE STUDY: 26‐52 weeks SPONSORSHIP SOURCE: Novartis COUNTRY: Bulgaria, China, Croatia, Czechia, Egypt, Estonia, Germany, Guatemala, Hungary, India, Ireland, Japan, Korea, Republic of, Latvia, Lithuania, Mexico, Poland, Romania, Russian Federation, Serbia, Slovakia, South Africa, UK, USA |
|
| Participants |
BASELINE CHARACTERISTICS: No. of patients included in this review: 1330 Mean age: 47.8 Male %: 42 White %: 70 Current and Ex smoker excluded: yes. > 10 PYs for ex‐smokers Baseline FEV1 (L) pre‐bronchodilator: 2.10 Baseline FEV1 % predicted:67.1 Hx of asthma exacerbation: not required (69 % of patients had no hx of exacerbations) Inclusion Criteria:
Spacer devices are permitted for reversibility testing only. ‐Participants who demonstrate an increase in FEV1 of 12% and 200 mL within 30 minutes after administration of 400 µg salbutamol/360 µg albuterol (or equivalent dose) at Visit 101 All participants must perform a reversibility test at Visit 101 If reversibility is not demonstrated at Visit 101:
Exclusion Criteria:
|
|
| Interventions | MD‐ICS/LABA: MF/IND 160/150 µg daily HD‐ICS/LABA: MF/IND 320/150 µg qd, FP/SAL 500/50 µg twice daily |
|
| Outcomes | Moderate to severe exacerbations Severe exacerbations All cause serious adverse events All cause adverse events Asthma‐related serious adverse events Dropouts due to adverse event ACQ responder at 6 months ACQ responder at 12 months CFB in ACQ at 3 months CFB in ACQ at 6 months CFB in ACQ at 12 months CFB in AQLQ at 6 months CFB in AQLQ at 12 months |
|
| Notes | NCT02554786 | |
Virchow 2019.
| Study characteristics | ||
| Methods | See Virchow 2019a and 2019b | |
| Participants | ||
| Interventions | ||
| Outcomes | ||
| Notes | NCT02676076; NCT02676089 | |
Virchow 2019a.
| Study characteristics | ||
| Methods |
DESIGN: multicentre randomised controlled trial
GROUP: parallel group
DURATION OF THE STUDY: 26‐52 weeks SPONSORSHIP SOURCE: Chiesi COUNTRY: Germany |
|
| Participants |
BASELINE CHARACTERISTICS: No. of patients included in this review: 1150 Mean age: 53.2 Male %: 39 White %: 100 Current and Ex smoker excluded: yes. > 10 PYs for ex‐smokers Baseline FEV1 (L) pre‐bronchodilator: 1.7 Baseline FEV1 % predicted: 55.4 Hx of asthma exacerbation: at least 1 documented asthma exacerbation in the previous year. Inclusion Criteria:
Exclusion Criteria:
|
|
| Interventions | MD‐ICS/LABA: BDP/FM 200/12 µg twice daily MD TRIPLE: BDP/FM/G 200/12/20 µg twice daily |
|
| Outcomes | All‐cause serious adverse events All‐cause adverse events Asthma‐related serious adverse events Dropouts due to adverse event ACQ responder at 6 months ACQ responder at 12 months |
|
| Notes | NCT02676076 | |
Virchow 2019b.
| Study characteristics | ||
| Methods |
DESIGN: randomised controlled trial
GROUP: parallel group
DURATION OF THE STUDY: 26‐52 weeks SPONSORSHIP SOURCE: Chiesi COUNTRY: Argentina, Belarus, Bulgaria, Czechia, Germany, Hungary, Italy, Lithuania, Poland, Portugal, Romania, Russian Federation, Slovakia, Spain, Turkey, Ukraine, UK |
|
| Participants |
BASELINE CHARACTERISTICS: No. of patients included in this review: 1431 Mean age: 53.2 Male %: 39 White %: 100 Current and Ex smoker excluded: yes. > 10 PYs for ex‐smokers Baseline FEV1 (L) pre‐bronchodilator: 1.6 Baseline FEV1 % predicted: 51.9 Hx of asthma exacerbation: at least 1 documented asthma exacerbation in the previous year. Inclusion Criteria:
Exclusion Criteria:
|
|
| Interventions | HD‐ICS/LABA: BDP/FM 400/12 µg twice daily HD TRIPLE: BDP/FM/GLY 400/12/20 µg twice daily, BDP/FM 400/12 µg twice daily +Tio 5 µg daily |
|
| Outcomes | All‐cause serious adverse events All‐cause adverse events Asthma‐related serious adverse events Dropouts due to adverse event ACQ responder at 6 months ACQ responder at 12 months |
|
| Notes | NCT02676089 | |
Weinstein 2010.
| Study characteristics | ||
| Methods |
DESIGN: randomised controlled trial
GROUP: parallel group
DURATION OF THE STUDY: 12 weeks SPONSORSHIP SOURCE: Merck Sharp & Dohme COUNTRY: North America, Latin America, Russia, Ukraine, and Europe |
|
| Participants |
BASELINE CHARACTERISTICS: No. of patients included in this review: 488 Mean age: 48 Male %: 44 White %: 89 Current and Ex smoker excluded: yes. > 10 PYs for ex‐smokers Baseline FEV1 (L) pre‐bronchodilator: 2.05 Baseline FEV1 % predicted: 66.2 Hx of asthma exacerbation: at least one severe exacerbation requiring a course of oral glucocorticosteroid 2 to 12 months prior to Screening. Inclusion Criteria:
Note: Dose delivery by method or modality other than those noted above must be equivalent.
Exclusion Criteria:
|
|
| Interventions | MD‐ICS/LABA: MF/FM 200/10 µg twice daily HD‐ICS/LABA: MF/FM 400/10 µg twice daily |
|
| Outcomes | All‐cause serious adverse events A‐l cause adverse events Asthma‐related serious adverse events Dropouts due to adverse event CFB in ACQ at 3 months | |
| Notes | NCT00381485 | |
Woodcock 2013.
| Study characteristics | ||
| Methods |
DESIGN: randomised controlled trial
GROUP: parallel group
DURATION OF THE STUDY: 24 weeks SPONSORSHIP SOURCE: GlaxoSmithKline COUNTRY: Argentina, Chile, Korea, Republic of, Netherlands, Philippines, USA. |
|
| Participants |
BASELINE CHARACTERISTICS: No. of patients included in this review: 806 Mean age: 42.9 Male %: 39 White %: 59 Current and Ex smoker excluded: yes. > 10 PYs for ex‐smokers Baseline FEV1 (L) pre‐bronchodilator: 2.0 Baseline FEV1 % predicted: 68.4 Hx of asthma exacerbation: not required Inclusion Criteria:
Exclusion Criteria:
|
|
| Interventions | FP/SAL 250/50 µg twice daily FF/VI 100/25 µg daily |
|
| Outcomes | Moderate to severe exacerbations Severe exacerbations All‐cause serious adverse events All‐cause adverse events Asthma‐related serious adverse events Dropouts due to adverse event CFB in ACQ at 6 months CFB in AQLQ at 6 months |
|
| Notes | Intragroup comparison of MD‐ICS/LABAs. NMA only. NCT01147848 Clinical Study Report available at https://www.gsk‐studyregister.com/en/trial‐details/?id=113091 |
|
ACQ: asthma control questionnaire; AIDS: acquired immune deficiency syndrome; ALT: alanine transaminase; ATS: American Thoracic Society; BDP: : beclomethasone dipropionate ;CFC: budesonide propionate ‐ chlorofluorocarbon;BPH: benign prostatic hyperplasia; BUD: budesonide; CABG: coronary artery by‐pass graft;CBC: CFB: ; CFC: chlorofluorocarbon; COPD: chronic obstructive pulmonary disease; CYP: Cytochromes;DPI: dry powder inhaler; ECG: electrocardiogram;EDTA: ethylenediamine tetra‐acetic acid; ERS: European Respiratory Society; FEV1; forced expiratory volume in one second;FF: fluticasone furoate;FM: ; FP: fluticasone propionate;GINA: Global Initiative for Asthma; HD: high dose;HFA: hydrofluoroalkane; HIV: Human Immunodeficiency Virus; ICF: informed consent form; ICH‐GCP: ;International Conference for Harmonisation Clinical Practice guidelines; ICS: inhaled corticosteroid; IUD: intra‐uterine device; LABA: long‐acting beat2‐agonist; LAMA: long‐acting muscarinic antagonist; LD: low dose; MD: medium dose; MDF: ; MF: ;NIH: National Institute of Health; NHLBI: National Heart Lung and Blood Institute; NMA: network meta‐analysis; NYHA: New York Heart Association;S: OCS: oral corticosteroid; PEF: peak expiratory flow; PEFR: peak expiratory flow rate; pMDI: pressurised metered dose inhaler; PTCA: Percutaneous transluminal coronary angioplasty;PY: Pack year;QT: s a measurement made on an electrocardiogram;SABA: short‐acting beta2‐agonist;SALM: salmeterol; Tio: tiotropium; TNF: Tumour necrosis factor; ULN: upper limit of normal; UMEC: umeclidinium; VI: vilanterol; WHO: World Health Organization.
Characteristics of excluded studies [ordered by study ID]
| Study | Reason for exclusion |
|---|---|
| Akpinarli 1999 | Six‐week paediatric trial |
| Allbers 2010 | Not pre‐registered. |
| Antilla 2014 | Clinically stable for at least 1 month with ACQ‐7 score ≤ 3 |
| Aubier 1999 | Not pre‐registered. |
| Bailey 2008 | No qualifying comparisons |
| Balki 2018 | No qualifying comparisons |
| Barnes 2013 | Stable asymptomatic patients |
| Bateman 2011 | No breakdown on ICS dose. B16‐Arg/Arg patients |
| Bateman 2014 | No qualifying comparisons |
| Beasley 2015 | No qualifying comparisons |
| Bernstein 2018 | Patients had to be symptom free |
| Blais 2016 | 168 hour trial |
| Blais 2017 | Cross‐over design |
| Bleecker 2012 | No qualifying comparisons |
| Bodzenta‐Lukaszyk 2011 | No qualifying comparisons |
| Boyd 1995 | No qualifying comparisons |
| Buhl 2003 | No qualifying comparisons |
| Busse 2013 | Safety trial. Not clear if patients were symptomatic before study entry. Seventy per cent of patients did not have a history of exacerbation within 12 months prior to study entry. |
| Dahl 2006 | Not pre‐registered. |
| Devillier 2018 | No qualifying treatment comparisons. |
| D’Urzo 2001 | No qualifying treatment comparisons. |
| EUCTR2008‐004833‐70 | BUDESONIDE‐SALMETEROL DPI is not approved nor commercially available |
| Fitzgerald 1999 | Inclusion criteria for age was not described |
| Gardiner 1994 | Eight‐week trial |
| Godard 2008 | No qualifying treatment comparisons. |
| Green 2006 | Six‐week trial |
| Hamelmann 2016 | No qualifying treatment comparisons. |
| Hamelmann 2017 | Significant proportion of patients received low‐dose ICS |
| Hoshino 2016 | Not pre‐registered. |
| Houghton 2007 | Four‐week trial |
| Hultquist 2000 | Four‐week trial |
| Ind 2003 | Not pre‐registered. |
| Ishiura 2018 | No qualifying comparisons. eight‐week trial |
| Katial 2011 | No qualifying comparisons |
| Kerstjens 2015 | ICS/LAMA study. No qualifying treatment comparisons. |
| Kerwin 2009 | No qualifying comparisons |
| Kerwin 2011 | No qualifying comparisons |
| Kerwin 2021 | ICS dose was not described. Glycopyrronium has not been approved or commercially available. |
| Koenig 2008 | Low dose ICS included and no breakdown. |
| Kuna 2007 | Not pre‐registered. |
| Kupczyk 2021 | Not clear if the new formulation HFA qualifies as medium‐ or high‐dose ICS/LABA. |
| Langton Hewer 1995 | Eight‐week trial |
| Lee 2015 | Fourteen‐day trial |
| Lenney 2013 | Low‐dose ICS |
| Li 2010 | Paediatric trial |
| Lin 2015 | No qualifying treatment comparisons. |
| Lotvall 2014 | No qualifying treatment comparisons. |
| Malone 2005 | Paediatric trial |
| Maspero 2010 | Wrong study design. Baseline characteristics were different between MD and HD‐ICS combos. |
| Maspero 2014 | Wrong patient population |
| Meijer 1995 | Paediatric trial |
| Morice 2008 | Paediatric trial |
| Muraki 2013 | Not randomised |
| NCT00118690 | Four‐week trial |
| NCT00118716 | Four‐week trial |
| NCT01192178 | Paediatric trial |
| NCT01570478 | ACT 20‐25. Not symptomatic at entry |
| NCT02127697 | Withdrawn |
| NCT02296411 | Cross‐over design |
| NCT02433834 | Cross‐over design |
| NCT02892344 | No qualifying treatment comparisons. LD‐ICS vs LD‐ICS/LABA |
| NCT03063086 | Three‐week trial |
| NCT03184987 | Non‐randomised controlled study |
| NCT03376932 | Trial withdrawn |
| Norhaya 1999 | Four‐week trial |
| O'Byrne 2014 | No qualifying treatment comparisons. |
| O'Byrne 2016 | Non‐randomised controlled study |
| Ohta 2015 | Only 54% to 61% of patients received LABA. No breakdown on with and without LABA. |
| Paggiaro 2016 | ICS/LAMA study. No qualifying treatment comparisons. |
| Peters 2010 | No qualifying treatment comparisons. |
| Peters 2016 | No qualifying treatment comparisons |
| Ploszczuk 2018 | Paediatric trial |
| Pohunek 2006 | Paediatric trial |
| Price 2002 | Cost‐effectiveness analysis |
| Rajanandh 2014 | No qualifying data |
| Raphael 2017 | No qualifying treatment comparisons. Low dose‐ICS/LABA vs medium dose‐ICS/LABA |
| Reddel 2007 | Eight‐week trial |
| Renzi 2010 | No qualifying treatment comparisons. Low dose‐ICS/LABA vs medium dose‐ICS/LABA. Not pre‐registered. |
| Russell 1995 | Paediatric trial |
| Sher 2017 | No qualifying comparisons |
| Simons 1997 | Four‐week trial |
| Stelmach 2008 | Eight‐week trial |
| Stempel 2016x | Paediatric trial |
| Svedsater 2018 | No qualifying comparisons |
| Tal 2002 | Paediatric trial |
| Teper 2005 | Paediatric trial |
| Verberne 1998 | Paediatric trial |
| Watz 2019 | Three‐week study |
| Wechsler 2016 | No qualifying treatment comparisons. Eighty‐seven per cent of the population received low‐dose ICS. |
| Weiler 2005 | Four‐week trial |
| Weinstein 2019 | Patients had to be stable enough to be able to stepdown to mometasone monotherapy. |
| Yang 2015 | Fourteen‐day trial |
| Zhang 2018 | Not pre‐registered. Eight‐week study |
| Zimmerman 2004 | Paediatric trial |
ACT 20‐25; HD: ICS: inhaled corticostroids; LABA: ; : long‐acting bronchodilator inhaler; LAMA: long‐acting muscarinic antagonists; LD: ; MD;
Characteristics of ongoing studies [ordered by study ID]
NCT03387241.
| Study name | Efficacy of FLUTIFORM ® vs Seretide® in moderate to severe persistent asthma in subjects aged ≥12 years |
| Methods | A double‐blind, double‐dummy, randomised, multicentre, two‐arm parallel group study to assess the efficacy and safety of FLUTIFORM® pMDI (2 puffs twice daily) vs Seretide® pMDI (2 puffs twice daily) |
| Participants | in participants aged ≥12 years with moderate to severe persistent, reversible asthma |
| Interventions | FLUTIFORM® pMDI (Fluticasone/ Formoterol Low dose: 50/5 µg Mid dose: 125/5 µg High dose 250/10 µg 2 puffs twice daily) vs Seretide® pMDI (fluticasone/ salmeterol Low dose: 50/25 µg Mid dose: 125/25 µg High dose 250/25 µg 2 puffstwice aily) |
| Outcomes | Change from the pre‐doseFEV1 at baseline to 2 hours post‐dose FEV1 at Week 12 |
| Starting date | June 2, 2017 |
| Contact information | Ling Li 8610 65636891 ling.li@mundipharma.com.cn |
| Notes | Mundipharma (China) Pharmaceutical Co. Ltd |
NCT04191434.
| Study name | Efficacy andsSafety of flamboyant 125/12 association in the treatment of adults with moderate asthma |
| Methods | Multicentre, randomized, double‐blind, double‐dummy, National, Phase III Clinical Trial |
| Participants | Adults with masthma |
| Interventions | Flamboyant 125/12 2 puffs twice dailyvs Budesonide/formoterol 200/6 2 puffs twice daily |
| Outcomes | Change from baseline in Forced expiratory volume in 1 second (FEV1), obtained through espirometry. [ Time Frame: 12 weeks ] Incidence and severity of adverse events recorded during the study. [ Time Frame: 14 weeks ] |
| Starting date | September 2021 |
| Contact information | Monalisa FB Oliveira, MD +551938879851 pesquisa.clinica@ncfarma.com.br |
| Notes | EMS |
NCT04191447.
| Study name | Efficacy and safety of Flamboyant 200/12 association in the treatment of adults With severe asthma |
| Methods | Multicente, randomised, double‐blind, double‐dummy, National, Phase III Clinical Trial |
| Participants | Adults with severe asthma |
| Interventions | Flamboyant 200/12 2 puffs twice daily vs Budesonide / Formoterol 400/12 2 puffs twice daily |
| Outcomes | Change from baseline in Forced expiratory volume in 1 second (FEV1), obtained through espirometry. [ Time Frame: 12 weeks ] Incidence and severity of adverse events recorded during the study. [ Time Frame: 14 weeks ] |
| Starting date | September 2021 |
| Contact information | Monalisa FB Oliveira, MD +551938879851 pesquisa.clinica@ncfarma.com.br |
| Notes | EMS |
NCT04609878.
| Study name | Study to Assess PT010 in adult and adolescent participants with inadequately controlled asthma (KALOS) (KALOS) |
| Methods | A Randomised, double‐blind, double dummy, parallel group, multicenrer variable length study |
| Participants | Adult and adolescent participants With inadequately controlled asthma |
| Interventions | Budesonide, glycopyrronium, and formoterol fumarate metered dose inhaler (BGF MDI) 320/28.8/9.6 μg; BGF MDI 320/14.4/9.6 μg; Budesonide and formoterol fumarate metered dose inhaler (BFF MDI) 320/9.6 μg; BFF pMDI 320/9 μg |
| Outcomes | Change from baseline in forced expiratory volume in 1 second (FEV1) area under the curve 0 to 3 hours (AUC0‐3) at Week 24 [ Time Frame: 24 Weeks ] Primary end point(s) of Pooled Studies D5982C00007 and D5982C00008: Rate of severe asthma exacerbations |
| Starting date | December 15, 2020 |
| Contact information | AstraZeneca Clinical Study Information Center 1‐877‐240‐9479 information.center@astrazeneca.com |
| Notes | Estimated Study Completion Date:July 25, 2023 |
NCT04609904.
| Study name | Study to assess PT010 in adult and adolescent participants with inadequately controlled asthma (LOGOS) (LOGOS) |
| Methods | A randomised, double‐blind, double dummy, parallel group, multicenter 24 to 52 week variable length study to assess the efficacy and safety of budesonide, glycopyrronium, and formoterol fumarate metered dose inhaler (MDI) relative to budesonide and formoterol fumarate MDI and Symbicort® pressurised MDI |
| Participants | Adult and adolescent participants with inadequately controlled asthma. Approximately 2800 participants will be randomised globally. |
| Interventions | Budesonide, glycopyrronium, and formoterol fumarate metered dose inhaler (BGF MDI) 320/28.8/9.6 μg; BGF MDI 320/14.4/9.6 μg; Budesonide and formoterol fumarate metered dose inhaler (BFF MDI) 320/9.6 μg; BFF pMDI 320/9 μg |
| Outcomes | Change from baseline in forced expiratory volume in 1 second (FEV1) area under the curve 0 to 3 hours (AUC0‐3) at Week 24; Rate of severe asthma exacerbations. |
| Starting date | March 1, 2021 |
| Contact information | AstraZeneca Clinical Study Information Center 1‐877‐240‐9479 information.center@astrazeneca.com |
| Notes | Estimated Study Completion Date: September 22, 2023 |
NCT04937387.
| Study name | Efficacy and safety of Fluticasone Furoate/Umeclidinium/Vilanterol (FF/UMEC/VI) in Chinese participants with inadequately controlled asthma |
| Methods | A Phase III, 12‐week, randomised, double‐blind, 4‐arm parallel Ggroup bridgins Study |
| Participants | Chinese participants with inadequately controlled asthma |
| Interventions | FF/UMEC/VI vs. FF/VI |
| Outcomes | FEV1, Change from baseline in Asthma Control Questionnaire (7 items) (ACQ‐7) |
| Starting date | June 24, 2021 |
| Contact information | US GSK Clinical Trials Call Center 877‐379‐3718GSKClinicalSupportHD@gsk.com |
| Notes | Last Update Posted: November 16, 2021 |
NCT05018598.
| Study name | Step‐up to medium strength triple therapy vs High strength ICS/LABA in adult asthmatics uncontrolled on medium strength ICS/LABA (MiSTIC) |
| Methods | A 26‐week, randomised, double‐blind, multinational, multicentre, active controlled, 2‐arm parallel group trial |
| Participants | Participants with asthma uncontrolled on medium doses of Inhaled Corticosteroids in combination with long‐Acting β2‐Agonists |
| Interventions | CHF 5993 100/6/12.5 μg pMDI (Fixed Combination of Extrafine Formulation of Beclometasone Dipropionate Plus Formoterol Fumarate Plus Glycopyrronium Bromide) to CHF 1535 22/6 μg pMDI (Fixed Combination of Extrafine Formulation of Beclometasone Dipropionate Plus Formoterol Fumarate) |
| Outcomes | Proportion of participants exhibiting no Airflow Obstruction on average over 26 weeks of treatment in the study sub‐population with Airflow Obstruction status at screening Change from baseline in pre‐dose FEV1 at Week 26 |
| Starting date | August 24, 2021 |
| Contact information | Chiesi Farmaceutici S.p.A. Chiesi Clinical Trial Info +39 0521 2791 clinicaltrials_info@chiesi.com |
| Notes | Last Update Posted: August 24, 2021 |
FEV1:
pMID:
Differences between protocol and review
We conducted subgroup analyses for exacerbation outcomes separating studies requiring or not requiring a history of asthma exacerbation in the previous year to assess intransitivity in the NMAs.
We did not perform a subgroup analysis on publication status as it was homogenous across the included studies.
We used the GeMTC package in R as well as OpenBUGS for the NMAs
We used a normal prior (0,0.01) for relative treatment effects in some outcomes in the NMAs in order to make the models more stable.
We used informative, empirically derived prior distributions for the between‐study heterogeneity parameter for the adverse event outcomes NMAs (Turner 2015) and semi‐informative half‐normal prior distributions for the between‐study heterogeneity parameter in severe exacerbations NMAs (Röver 2021).
We used the node‐splitting model (van Valkenhoef 2016) to assess inconsistency between direct and indirect estimates instead of an inconsistency model (Dias 2013b; Dias 2013c) in the NMAs. This is a more sensitive method to detect inconsistency.
Contributions of authors
Y. Oba: extracted data, assessed studies for methodological quality, constructed figures and tables for pairwise meta‐analyses and otherwise constructed the review.
T Maduke: extracted data and assessed studies for methodological quality.
S Anwer: conducted the network meta‐analyses, constructed tables and figures, and drafted the network meta‐analysis results.
T Patel: extracted data and assessed studies for methodological quality.
S Dias: provided guidance and supervision of the network meta‐analyses and their presentation and interpretation and drafted the network meta‐analysis results.
All review authors contributed to the writing of the review and approved the final version of the document.
Contributions of editorial team
Sally Spencer (Coordinating Editor) edited the review; advised on methodology, interpretation and content; approved the review prior to publication.
Rebecca Fortescue (Coordinating Editor): Checked data entry prior to write‐up of full review.
Milo Puhan (Contact Editor): edited the review; advised on methodology, interpretation and content.
Emma Dennett (Deputy Coordinating Editor): advised on methodology, interpretation and content; edited the review.
Emma Jackson (Managing Editor): coordinated the editorial process; conducted peer review; edited the review.
Elizabeth Stovold (Information Specialist): designed the search strategy; ran the searches; edited the search methods section.
Sources of support
Internal sources
-
None, Other
The authors declare that no such funding was received for this systematic review
External sources
-
National Institute for Health and Care Research (NIHR), UK
provision of Cochrane infrastructure funding to Cochrane Airways
Declarations of interest
Y. Oba: has provided consultation and received honoraria from Genentech unrelated to the current review.
T Patel: none known.
S Anwer: none known.
T Maduke: none known.
S Dias: none known.
New
References
References to studies included in this review
Bernstein 2011 {published and unpublished data}
- Bernstein DI, Hébert J, Cheema A, Murphy KR, Chérrez-Ojeda I, Matiz-Bueno CE, et al. Efficacy and onset of action of mometasone furoate/formoterol and fluticasone propionate/salmeterol combination treatment in subjects with persistent asthma. Allergy Asthma and Clinical Immunology 2011;7(1):21. [DOI] [PMC free article] [PubMed] [Google Scholar]
Bernstein 2015 {published and unpublished data}
- Bernstein DI, Bateman ED, Woodcock A, Toler WT, Forth R, Jacques L, et al. Fluticasone furoate (FF)/vilanterol (100/25 mcg or 200/25 mcg) or FF (100 mcg) in persistent asthma. Journal of Asthma 2015;52(10):1073-83. [DOI] [PubMed] [Google Scholar]
Bodzenta‐Lukaszyk 2012 {published and unpublished data}
- Bodzenta-Lukaszyk A, Buhl R, Balint B, Lomax M, Spooner K, Dissanayake S. Fluticasone/formoterol combination therapy versus budesonide/formoterol for the treatment of asthma: a randomized, controlled, non-inferiority trial of efficacy and safety. Journal of Asthma 2012;49(10):1060-70. [DOI] [PubMed] [Google Scholar]
Busse 2008 {published data only}
- Busse WW, Shah SR, Somerville L, Parasuraman B, Martin P, Goldman M. Comparison of adjustable- and fixed-dose budesonide/formoterol pressurized metered-dose inhaler and fixed-dose fluticasone propionate/salmeterol dry powder inhaler in asthma patients. Journal of Allergy and Clinical Immunology 2008;121(6):1407-14. [DOI] [PubMed] [Google Scholar]
- O'Connor RD, Patrick DL, Parasuraman B, Martin P, Goldman M. Comparison of patient-reported outcomes during treatment with adjustable- and fixed-dose budesonide/formoterol pressurized metered-dose inhaler versus fixed-dose fluticasone propionate/salmeterol dry powder inhaler in patients with asthma. Journal of Asthma 2010;47(2):217-23. [DOI] [PubMed] [Google Scholar]
Cukier 2013 {published and unpublished data}
- Cukier A, Jacob CM, Rosario Filho NA, Fiterman J, Vianna EO, Hetzel JL, et al. Fluticasone/formoterol dry powder versus budesonide/formoterol in adults and adolescents with uncontrolled or partly controlled asthma. Respiratory Medicine 2013;107(9):1330-8. [DOI] [PubMed] [Google Scholar]
Gessner 2020 {published data only}
- Gessner C, Kornmann O, Maspero J, Zyl-Smit R, Krüll M, Salina A, et al. Fixed-dose combination of indacaterol/glycopyrronium/mometasone furoate once-daily versus salmeterol/fluticasone twice-daily plus tiotropium once-daily in patients with uncontrolled asthma: a randomised, phase IIIb, non-inferiority study (ARGON). Respiratory Medicine 2020;170:106021. [DOI] [PubMed] [Google Scholar]
Kerstjens 2012 {published data only}
- Kerstjens HA, Engel M, Dahl R, Paggiaro P, Beck E, Vandewalker M, et al. Tiotropium in asthma poorly controlled with standard combination therapy. New England Journal of Medicine 2012;367(13):1198-207. [DOI] [PubMed] [Google Scholar]
Kerstjens 2012a {published data only}
- Kerstjens HA, Engel M, Dahl R, Paggiaro P, Beck E, Vandewalker M, et al. Tiotropium in asthma poorly controlled with standard combination therapy. New England Journal of Medicine 2012;367(13):1198-207. [DOI] [PubMed] [Google Scholar]
Kerstjens 2012b {published data only}
- Kerstjens HA, Engel M, Dahl R, Paggiaro P, Beck E, Vandewalker M, et al. Tiotropium in asthma poorly controlled with standard combination therapy. New England Journal of Medicine 2012;367(13):1198-207. [DOI] [PubMed] [Google Scholar]
Kerstjens 2020 {published data only}
- Kerstjens HA, Maspero J, Chapman KR, Zyl-Smit RN, Hosoe M, Tanase AM, et al. Once-daily, single-inhaler mometasone-indacaterol-glycopyrronium versus mometasone-indacaterol or twice-daily fluticasone-salmeterol in patients with inadequately controlled asthma (IRIDIUM): a randomised, double-blind, controlled phase 3 study. Lancet Respiratory Medicine 2020;8(10):1000-12. [DOI] [PubMed] [Google Scholar]
Lee 2020 {published data only}
- Lee LA, Bailes Z, Barnes N, Boulet LP, Edwards D, Fowler A, et al. Efficacy and safety of once-daily single-inhaler triple therapy (FF/UMEC/VI) versus FF/VI in patients with inadequately controlled asthma (CAPTAIN): a double-blind, randomised, phase 3A trial. Lancet Respiratory Medicine 2021;9(1):69-84. [DOI] [PubMed] [Google Scholar]
Mansfield 2017 {published data only}
- Mansfield L, Yiu G, Sakov A, Liu S, Caracta C. A 6-month safety and efficacy study of fluticasone propionate and fluticasone propionate/salmeterol multidose dry powder inhalers in persistent asthma. Allergy and Asthma Proceedings 2017;38(4):264-76. [DOI] [PubMed] [Google Scholar]
- Miller DS, Yiu G, Hellriegel ET, Steinfeld J. Dose-ranging study of salmeterol using a novel fluticasone propionate/salmeterol multidose dry powder inhaler in patients with persistent asthma. Allergy and Asthma Proceedings 2016;37(4):291-301. [DOI] [PubMed] [Google Scholar]
Papi 2007 {published data only}
- Papi A, Paggiaro P, Nicolini G, Vignola AM, Fabbri LM. Beclomethasone/formoterol vs fluticasone/salmeterol inhaled combination in moderate to severe asthma. Allergy 2007;62(10):1182-8. [DOI] [PubMed] [Google Scholar]
Peters 2008 {published data only}
- Peters SP, Prenner BM, Mezzanotte WS, Martin P, O'Brien CD. Long-term safety and asthma control with budesonide/formoterol versus budesonide pressurized metered-dose inhaler in asthma patients. Allergy and Asthma Proceedings 2008;29(5):499-516. [DOI] [PubMed] [Google Scholar]
Stempel 2016 {published data only}
- Stempel DA, Raphiou IH, Kral KM, Yeakey AM, Emmett AH, Prazma CM, et al. Serious asthma events with fluticasone plus salmeterol versus fluticasone alone. New England Journal of Medicine 2016;374(19):1822-30. [DOI] [PubMed] [Google Scholar]
van Zyl‐Smit 2020 {published data only}
- Zyl-Smit RN, Krüll M, Gessner C, Gon Y, Noga O, Richard A. Once-daily mometasone plus indacaterol versus mometasone or twice-daily fluticasone plus salmeterol in patients with inadequately controlled asthma (PALLADIUM): a randomised, double-blind, triple-dummy, controlled phase 3 study. Lancet Respiratory Medicine 2020;8(10):987-99. [DOI] [PubMed] [Google Scholar]
Virchow 2019 {published data only}
- Virchow JC, Kuna P, Paggiaro P, Papi A, Singh D, Corre S, et al. Single inhaler extrafine triple therapy in uncontrolled asthma (TRIMARAN and TRIGGER): two double-blind, parallel-group, randomised, controlled phase 3 trials. Lancet 2019;394(10210):1737-49. [DOI] [PubMed] [Google Scholar]
Virchow 2019a {published data only}
- Virchow JC, Kuna P, Paggiaro P, Papi A, Singh D, Corre S, et al. Single inhaler extrafine triple therapy in uncontrolled asthma (TRIMARAN and TRIGGER): two double-blind, parallel-group, randomised, controlled phase 3 trials. Lancet 2019;394(10210):1737-49. [DOI] [PubMed] [Google Scholar]
Virchow 2019b {published data only}
- Virchow JC, Kuna P, Paggiaro P, Papi A, Singh D, Corre S, et al. Single inhaler extrafine triple therapy in uncontrolled asthma (TRIMARAN and TRIGGER): two double-blind, parallel-group, randomised, controlled phase 3 trials. Lancet 2019;394(10210):1737-49. [DOI] [PubMed] [Google Scholar]
Weinstein 2010 {published and unpublished data}
- Weinstein SF, Corren J, Murphy K, Nolte H, White M. Twelve-week efficacy and safety study of mometasone furoate/formoterol 200/10 microg and 400/10 microg combination treatments in patients with persistent asthma previously receiving high-dose inhaled corticosteroids. Allergy and Asthma Proceedings 2010;31(4):280-9. [DOI] [PubMed] [Google Scholar]
Woodcock 2013 {published data only}
- Woodcock A, Bleecker ER, Lötvall J, O'Byrne PM, Bateman ED, Medley H, et al. Efficacy and safety of fluticasone furoate/vilanterol compared with fluticasone propionate/salmeterol combination in adult and adolescent patients with persistent asthma: a randomized trial. Chest 2013;144(4):1222-9. [DOI] [PMC free article] [PubMed] [Google Scholar]
References to studies excluded from this review
Akpinarli 1999 {published data only}
- Akpinarli A, Tuncer A, Saraçlar Y, Sekerel BE, Kalayci O. Effect of formoterol on clinical parameters and lung functions in patients with bronchial asthma: a randomised controlled trial. Archives of Disease in Childhood 1999;81(1):45-8. [PMID: PMID: 10373134] [DOI] [PMC free article] [PubMed] [Google Scholar]
Allbers 2010 {published data only}
- Aalbers R, Backer V, Kava TT, Omenaas ER, Sandström T, Jorup C, et al. Adjustable maintenance dosing with budesonide/formoterol compared with fixed-dose salmeterol/fluticasone in moderate to severe asthma. Current Medical Research & Opinion 2004;20(2):225-40. [DOI] [PubMed] [Google Scholar]
- Aalbers R. Fixed or adjustable maintenance-dose budesonide/formoterol compared with fixed maintenance-dose salmeterol/fluticasone propionate in asthma patients aged >or=16 years: post hoc analysis of a randomized, double-blind/open-label extension, parallel-group study. Clinical Drug Investigation 2010;30(7):439-51. [DOI] [PubMed] [Google Scholar]
Antilla 2014 {published data only}
- Antilla M, Castro F, Cruz Á, Rubin A, Rosário N, Stelmach R. Efficacy and safety of the single-capsule combination of fluticasone/formoterol in patients with persistent asthma: a non-inferiority trial. Jornal Brasileiro de Pneumologia 2014;40(6):599-608. [DOI] [PMC free article] [PubMed] [Google Scholar]
Aubier 1999 {published data only}
- Aubier M, Pieters WR, Schlösser NJ, Steinmetz KO. Salmeterol/fluticasone propionate (50/500 microg) in combination in a Diskus inhaler (Seretide) is effective and safe in the treatment of steroid-dependent asthma. Respiratory Medicine 1999;93(12):876-84. [PMID: PMID: 10653049] [DOI] [PubMed] [Google Scholar]
Bailey 2008 {published data only}
- Bailey W, Castro M, Matz J, White M, Dransfield M, Yancey S, et al. Asthma exacerbations in African Americans treated for 1 year with combination fluticasone propionate and salmeterol or fluticasone propionate alone. Current Medical Research & Opinion 2008;24(6):1669-82. [PMID: PMID: 18462564] [DOI] [PubMed] [Google Scholar]
Balki 2018 {published data only}
- Balki A, Balamurugan S, Bardapurkar S, Dalal S, Singh A, Singh BP, et al. Comparison of fluticasone/formoterol with budesonide/formoterol pMDI in adults with moderate to severe persistent asthma: results from a 12-week randomized controlled trial. Pulmonary Pharmacology & Therapeutics 2018;48:28-36. [PMID: PMID: 28890299] [DOI] [PubMed] [Google Scholar]
Barnes 2013 {published data only}
- Barnes N, Noord JA, Brindicci C, Lindemann L, Varoli G, Perpiña M, et al. Stepping-across controlled asthmatic patients to extrafine beclometasone/formoterol combination. Pulmonary Pharmacology & Therapeutics 2013;26(5):555-61. [DOI] [PubMed] [Google Scholar]
Bateman 2011 {published data only}
- Bateman ED, Kornmann O, Schmidt P, Pivovarova A, Engel M, Fabbri LM. Tiotropium is noninferior to salmeterol in maintaining improved lung function in B16-Arg/Arg patients with asthma. Journal of Allergy & Clinical Immunology 2011;128(2):315-22. [DOI] [PubMed] [Google Scholar]
Bateman 2014 {published data only}
- Bateman ED, O'Byrne PM, Busse WW, Lötvall J, Bleecker ER, Andersen L, et al. Once-daily fluticasone furoate (FF)/vilanterol reduces risk of severe exacerbations in asthma versus FF alone. Thorax 2014;69(4):312-9. [PMID: PMID: 24253831] [DOI] [PMC free article] [PubMed] [Google Scholar]
Beasley 2015 {published data only}
- Beasley RW, Donohue JF, Mehta R, Nelson HS, Clay M, Moton A, et al. Effect of once-daily indacaterol maleate/mometasone furoate on exacerbation risk in adolescent and adult asthma: a double-blind randomised controlled trial. BMJ Open 2015;5(2):e006131. [PMID: PMID: 25649209] [DOI] [PMC free article] [PubMed] [Google Scholar]
Bernstein 2018 {published data only}
- Bernstein D, Andersen L, Forth R, Jacques L, Yates L. Once-daily fluticasone furoate/vilanterol versus twice-daily fluticasone propionate/salmeterol in patients with asthma well controlled on ICS/LABA. Journal of Asthma 2018;55(9):984-93. [DOI] [PubMed] [Google Scholar]
Blais 2016 {published data only}
- Blais CM, Davis BE, Cockcroft DW. Duration of bronchoprotection of the long-acting muscarinic antagonists tiotropium & glycopyrronium against methacholine-induced bronchoconstriction in mild asthmatics. Respiratory Medicine 2016;118:96-101. [PMID: PMID: 27578477] [DOI] [PubMed] [Google Scholar]
Blais 2017 {published data only}
- Blais CM, Davis BE, Cockcroft DW. The effect of glycopyrronium and indacaterol, as monotherapy and in combination, on the methacholine dose-response curve of mild asthmatics: a randomized three-way crossover study.. Respiratory Research 2017;18(1):146. [PMID: PMID: 28768531] [DOI] [PMC free article] [PubMed] [Google Scholar]
Bleecker 2012 {published data only}
- Bleecker ER, Bateman ED, Busse WW, Woodcock A, Frith L, House KW, et al. Once-daily fluticasone furoate is efficacious in patients with symptomatic asthma on low-dose inhaled corticosteroids. Annals of Allergy, Asthma & Immunology 2012;109(5):353-8. [PMID: PMID: 23062392] [DOI] [PubMed] [Google Scholar]
Bodzenta‐Lukaszyk 2011 {published data only}
- Bodzenta-Lukaszyk A, Dymek A, McAulay K, Mansikka H. Fluticasone/formoterol combination therapy is as effective as fluticasone/salmeterol in the treatment of asthma, but has a more rapid onset of action: an open-label, randomized study. BMC Pulmonary Medicine 2011;11:28. [PMID: PMID: 21605396] [DOI] [PMC free article] [PubMed] [Google Scholar]
Boyd 1995 {published data only}
- Boyd G. Salmeterol xinafoate in asthmatic patients under consideration for maintenance oral corticosteroid therapy. UK Study Group. European Respiratory Journal 1995;8(9):1494-8. [PMID: PMID: 8575574] [PubMed] [Google Scholar]
Buhl 2003 {published data only}
- Buhl R, Creemers JP, Vondra V, Martelli NA, Naya IP, Ekström T. Once-daily budesonide/formoterol in a single inhaler in adults with moderate persistent asthma. Respiratory Medicine 2003;97(4):323-30. [PMID: PMID: 12693793] [DOI] [PubMed] [Google Scholar]
Busse 2013 {published data only}
- Busse WW, O'Byrne PM, Bleecker ER, Lötvall J, Woodcock A, Andersen L, et al. Safety and tolerability of the novel inhaled corticosteroid fluticasone furoate in combination with the β2 agonist vilanterol administered once daily for 52 weeks in patients >=12 years old with asthma: a randomised trial. Thorax 2013;68(6):513-20. [DOI] [PMC free article] [PubMed] [Google Scholar]
Dahl 2006 {published data only}
- Dahl R, Engel M, Dusser D, Halpin D, Kerstjens HA, Zaremba-Pechmann L, et al. Safety and tolerability of once-daily tiotropium Respimat(®) as add-on to at least inhaled corticosteroids in adult patients with symptomatic asthma: A pooled safety analysis. Respiratory Medicine 2016;118:102-11. [PMID: PMID: 27578478] [DOI] [PubMed] [Google Scholar]
Devillier 2018 {published data only}
- Devillier P, Humbert M, Boye A, Zachgo W, Jacques L, Nunn C, et al. Efficacy and safety of once-daily fluticasone furoate/vilanterol (FF/VI) versus twice-daily inhaled corticosteroids/long-acting β 2-agonists (ICS/LABA) in patients with uncontrolled asthma: An open-label, randomized, controlled trial. Respiratory Medicine 2018;141:111-20. [PMID: PMID: 30053956] [DOI] [PubMed] [Google Scholar]
D’Urzo 2001 {published data only}
- D'Urzo AD, Chapman KR, Cartier A, Hargreave FE, Fitzgerald M, Tesarowski D. Effectiveness and safety of salmeterol in nonspecialist practice settings. Chest 2001;119(3):714-9. [PMID: PMID: 11243947] [DOI] [PubMed] [Google Scholar]
EUCTR2008‐004833‐70 {unpublished data only}
- EUCTR2008-004833-70. A phase iii, randomized, parallel group, open study to compare the therapeutic efficacy and safety of SMB budesonide-salmeterol DPI capsule 150/25 µg bid delivered by the Axahaler versus Symbicort Turbuhaler 200/12 µg bid over 12 weeks in moderate to severe persistent asthmatic patients. https://www.clinicaltrialsregister.eu/ctr-search/search?query=2008-004833-70 (first received 19 January 2009).
Fitzgerald 1999 {published data only}
- FitzGerald JM, Chapman KR, Della Cioppa G, Stubbing D, Fairbarn MS, Till MD, et al. Sustained bronchoprotection, bronchodilatation, and symptom control during regular formoterol use in asthma of moderate or greater severity. Journal of Allergy and Clinical Immunology 1999;103:427--35. [PMID: PMID: 10069876] [DOI] [PubMed] [Google Scholar]
Gardiner 1994 {published data only}
- Gardiner PV, Ward C, Booth H, Allison A, Hendrick DJ, Walters EH. Effect of eight weeks of treatment with salmeterol on bronchoalveolar lavage inflammatory indices in asthmatics. American Journal of Respiratory and Critical Care Medicine 1994;150(4):1006-11. [PMID: PMID: 7921429] [DOI] [PubMed] [Google Scholar]
Godard 2008 {published data only}
- Godard P, Greillier P, Pigearias B, Nachbaur G, Desfougeres JL, Attali V. Maintaining asthma control in persistent asthma: comparison of three strategies in a 6-month double-blind randomised study. Respiratory Medicine 2008;102(8):1124-31. [PMID: PMID: 18606533] [DOI] [PubMed] [Google Scholar]
Green 2006 {published data only}
- Green RH, Brightling CE, McKenna S, Hargadon B, Neale N, Parker D, et al. Comparison of asthma treatment given in addition to inhaled corticosteroids on airway inflammation and responsiveness. European Respiratory Journal 2006;27(6):1144-51. [PMID: PMID: 16455831] [DOI] [PubMed] [Google Scholar]
Hamelmann 2016 {published data only}
- Hamelmann E, Bateman ED, Vogelberg C, Szefler SJ, Vandewalker M, Moroni-Zentgraf P, et al. Tiotropium add-on therapy in adolescents with moderate asthma: A 1-year randomized controlled trial. Journal of Allergy and Clinical Immunology 2016;138(2):441-50. [DOI] [PubMed] [Google Scholar]
Hamelmann 2017 {published data only}
- Hamelmann E, Bernstein JA, Vandewalker M, Moroni-Zentgraf P, Verri D, Unseld A, et al. A randomised controlled trial of tiotropium in adolescents with severe symptomatic asthma. European Respiratory Journal 2017;49(1):1601100. [DOI] [PMC free article] [PubMed] [Google Scholar]
Hoshino 2016 {published data only}
- Hoshino M, Ohtawa J, Akitsu K. Effects of the addition of tiotropium on airway dimensions in symptomatic asthma. Allergy and Asthma Proceedings 2016;37(6):147-53. [PMID: PMID: 27931291] [DOI] [PubMed] [Google Scholar]
Houghton 2007 {published data only}
- Houghton CM, Lawson N, Borrill ZL, Wixon CL, Yoxall S, Langley SJ, et al. Comparison of the effects of salmeterol/fluticasone propionate with fluticasone propionate on airway physiology in adults with mild persistent asthma. Respiratory Research 2007;8(1):52. [PMID: PMID: 17629923] [DOI] [PMC free article] [PubMed] [Google Scholar]
Hultquist 2000 {published data only}
- Hultquist C, Domeij W, Kasak V, Laitinen L, O'Neil S. Oxis turbuhaler (formoterol), Accolate (zafirlukast) or placebo as add‐on treatment to Pulmicort turbuhaler (budesonide) in asthmatic patients on inhaled steroids. Astra Zeneca Report No: SD‐4004CR‐02162000 2000.
Ind 2003 {published data only}
- Ind PW, Dal Negro R, Colman NC, Fletcher CP, Browning D, James MH. Addition of salmeterol to fluticasone propionate treatment in moderate-to-severe asthma. Respiratory Medicine 2003;97(5):555-62. [PMID: PMID: 12735675] [DOI] [PubMed] [Google Scholar]
Ishiura 2018 {published data only}
- Ishiura Y, Fujimura M, Shiba Y, Ohkura N, Hara J, Abo M, et al. A comparison of the efficacy of once-daily fluticasone furoate/vilanterole with twice-daily fluticasone propionate/salmeterol in elderly asthmatics. Drug Research 2018;68(1):38-44. [PMID: ] [DOI] [PubMed] [Google Scholar]
Katial 2011 {published data only}
- Katial RK, Bernstein D, Prazma CM, Lincourt WR, Stempel DA. Long-term treatment with fluticasone propionate/salmeterol via Diskus improves asthma control versus fluticasone propionate alone. Allergy and Asthma Proceedings 2011;32(2):127-36. [PMID: PMID: 21189151] [DOI] [PubMed] [Google Scholar]
Kerstjens 2015 {published data only}
- Kerstjens HA, Casale TB, Bleecker ER, Meltzer EO, Pizzichini E, Schmidt O, et al. Tiotropium or salmeterol as add-on therapy to inhaled corticosteroids for patients with moderate symptomatic asthma: two replicate, double-blind, placebo-controlled, parallel-group, active-comparator, randomised trials. Lancet Respiratory Medicine 2015;3(5):367-76. [DOI] [PubMed] [Google Scholar]
Kerwin 2009 {published data only}
- Kerwin EM, Oppenheimer JJ, LaForce C, Parasuraman B, Miller CJ, O'Dowd L, et al. Efficacy and tolerability of once-daily budesonide/formoterol pressurized metered-dose inhaler in adults and adolescents with asthma previously stable with twice-daily budesonide/ formoterol dosing. Annals of Allergy, Asthma and Immunology 2009;103(1):62-72. [PMID: PMID: 19663129] [DOI] [PubMed] [Google Scholar]
Kerwin 2011 {published data only}
- Kerwin E, Prazma CM, Sutton L, Stempel DA. Safety and efficacy of long-term treatment with fluticasone propionate and salmeterol via DISKUS versus fluticasone propionate alone. Clinical Research and Regulatory Affairs 2011;28:14-21. [DOI: 10.3109/10601333.2010.544315] [DOI] [Google Scholar]
Kerwin 2021 {published data only}
- Kerwin E, Dorinsky P, Patel M, Rossman K, Reisner C, Maes A, et al. A randomized controlled trial of glycopyrrolate administered by metered dose inhaler in patients with uncontrolled asthma despite ICS/LABA treatment. Journal of Asthma 2021;Aug 1:1-13. [DOI: 10.1080/02770903.2021.1938603] [PMID: PMID: 34338132] [DOI] [PubMed] [Google Scholar]
- NCT03358147. Efficacy and safety of PT001 to placebo and open-label Spiriva® Respimat® in subjects with persistant asthma. clinicaltrials.gov/ct2/show/NCT03358147 (first received 30 November 2017).
Koenig 2008 {published data only}
- Koenig SM, Murray JJ, Wolfe J, Andersen L, Yancey S, Prillaman B, et al. Does measuring BHR add to guideline derived clinical measures in determining treatment for patients with persistent asthma? Respiratory Medicine 2008;102(5):665-73. [PMID: PMID: 18328683] [DOI] [PubMed] [Google Scholar]
Kuna 2007 {published data only}
- Kuna P, Peters MJ, Manjra AI, Jorup C, Naya IP, Martínez-Jimenez NE, et al. Effect of budesonide/formoterol maintenance and reliever therapy on asthma exacerbations. International Journal of Clinical Practice 2007;61(5):725-36. [PMID: PMID: 17362472] [DOI] [PMC free article] [PubMed] [Google Scholar]
Kupczyk 2021 {published data only}
- Kupczyk M, Majak P, Kuna P, Asankowicz-Bargiel B, Barańska E, Dobek R. A new formulation of fluticasone propionate/salmeterol in a metered-dose inhaler (MDI HFA) allows for the reduction of a daily dose of corticosteroid and provides optimal asthma control - A randomized, multi-center, non-inferiority, phase IV clinical study. Respiratory Medicine 2021 Jan;176:106274. [DOI: 10.1016/j.rmed.2020.106274] [PMID: ] [DOI] [PubMed] [Google Scholar]
Langton Hewer 1995 {published data only}
- Langton Hewer S, Hobbs J, French D, Lenney W. Pilgrim's progress: the effect of salmeterol in older children with chronic severe asthma. Respiratory Medicine 1995;89(6):435-40. [PMID: PMID: 7644775] [DOI] [PubMed] [Google Scholar]
Lee 2015 {published data only}
- Lee LA, Yang S, Kerwin E, Trivedi R, Edwards LD, Pascoe S, et al. The effect of fluticasone furoate/umeclidinium in adult patients with asthma: a randomized, dose-ranging study. Respiratory Medicine 2015;109(1):54-62. [PMID: PMID: 25452139] [DOI] [PubMed] [Google Scholar]
Lenney 2013 {published data only}
- Lenney W, McKay AJ, Tudur Smith C, Williamson PR, James M, Price D. Management of asthma in school age children on therapy (MASCOT): a randomised, double-blind, placebo-controlled, parallel study of efficacy and safety. Health Technology Assessment 2013;17(4):1-218. [PMID: PMID: 23380178] [DOI] [PMC free article] [PubMed] [Google Scholar]
Li 2010 {published data only}
- Li JS, Qaqundah PY, Weinstein SF, LaForce CF, Ellsworth AV, Ortega HG, et al. Fluticasone propionate/salmeterol combination in children with asthma: key cardiac and overall safety results. Clinical Research and Regulatory Affairs 2010;27(3):87-95. [Google Scholar]
Lin 2015 {published data only}
- Lin J, Kang J, Lee SH, Wang C, Zhou X, Crawford J, et al. Fluticasone furoate/vilanterol 200/25 mcg in Asian asthma patients: a randomized trial. Respiratory Medicine 2015;109(1):44-53. [PMID: PMID: 25524507] [DOI] [PubMed] [Google Scholar]
Lotvall 2014 {published data only}
- Lötvall J, Bateman ED, Busse WW, O'Byrne PM, Woodcock A, Toler WT, et al. Comparison of vilanterol, a novel long-acting beta2 agonist, with placebo and a salmeterol reference arm in asthma uncontrolled by inhaled corticosteroids. Journal of Negative Results in Biomedicine 2014;13(1):9. [PMID: PMID: 24928338] [DOI] [PMC free article] [PubMed] [Google Scholar]
Malone 2005 {published data only}
- Malone R, LaForce C, Nimmagadda S, Schoaf L, House K, Ellsworth A, et al. The safety of twice-daily treatment with fluticasone propionate and salmeterol in pediatric patients with persistent asthma. Annals of Allergy, Asthma and Immunology 2005;95(1):66-71. [PMID: PMID: 16095144] [DOI] [PubMed] [Google Scholar]
Maspero 2010 {published data only}
- Maspero JF, Nolte H, Chérrez-Ojeda I. Long-term safety of mometasone furoate/formoterol combination for treatment of patients with persistent asthma. Journal of Asthma 2010;47(10):1106-15. [DOI] [PMC free article] [PubMed] [Google Scholar]
Maspero 2014 {published data only}
- Maspero J, Cherrez I, Doherty DE, Tashkin DP, Kuna P, Kuo WL, et al. Appraisal of lens opacity with mometasone furoate/formoterol fumarate combination in patients with COPD or asthma. Respiratory Medicine 2014;108(9):1355-62. [PMID: PMID: 25044280] [DOI] [PubMed] [Google Scholar]
Meijer 1995 {published data only}
- Meijer GG, Postma DS, Mulder PG, Aalderen WM. Long-term circadian effects of salmeterol in asthmatic children treated with inhaled corticosteroids. American Journal of Respiratory and Critical Care Medicine 1995;152:1887-92. [PMID: PMID: 8520751] [DOI] [PubMed] [Google Scholar]
Morice 2008 {published data only}
- Morice AH, Peterson S, Beckman O, Kukova Z. Efficacy and safety of a new pressurised metered-dose inhaler formulation of budesonide/formoterol in children with asthma: a superiority and therapeutic equivalence study. Pulmonary Pharmacology and Therapeutics 2008;21(1):152-9. [PMID: PMID: 17376722] [DOI] [PubMed] [Google Scholar]
Muraki 2013 {published data only}
- Muraki M, Soutome T, Hashimoto K, Tohda Y. Long-term study of fluticasone furoate/vilanterol combination (FF/VI) and FF alone in Japanese adult patients with bronchial asthma. Allergologia et Immunopathologia 2013;20:110-25. [Google Scholar]
NCT00118690 {unpublished data only}
- NCT00118690. A study measuring asthma control in pediatric and adolescent subjects whose asthma is worsened by activity or exercise. clinicaltrials.gov/ct2/show/NCT00118690 (first received 12 July 2005).
NCT00118716 {unpublished data only}
- NCT00118716. A study measuring asthma control in pediatric and adolescent subjects whose asthma is worsened by activity or exercise. clinicaltrials.gov/ct2/show/NCT00118716 (first received 12 July 2005).
NCT01192178 {unpublished data only}
- NCT01192178. Fall epidemic viral pediatric study. clinicaltrials.gov/ct2/show/NCT01192178 (first received 31 August 2010).
NCT01570478 {unpublished data only}
- NCT01570478. A study in patients with asthma (NELSON). clinicaltrials.gov/ct2/show/NCT01570478 (first received 4 April 2012).
NCT02127697 {published data only}
- NCT02127697. Study of efficacy and safety of NVA237 in patients with poorly controlled asthma. clinicaltrials.gov/ct2/show/NCT02127697 (first received 1 May 2014).
NCT02296411 {published data only}
- NCT02296411. Efficacy of LAMA added to ICS in treatment of asthma (ELITRA). www.clinicaltrials.gov/ct2/show/NCT02296411 (first received 20 November 2014).
NCT02433834 {unpublished data only}
- NCT02433834. Chronic dosing cross-over study to assess the efficacy and safety of glycopyrronium (PT001) in adult subjects with intermittent asthma or mild to moderate persistent asthma. clinicaltrials.gov/ct2/show/NCT02433834 (first received 5 May 2015).
NCT02892344 {unpublished data only}
- NCT02892344. Study of QMF149 (150/80 µg) compared with MF Twisthaler® (200 µg) in patients with asthma. clinicaltrials.gov/ct2/show/NCT02892344 (first received 8 September 2016).
NCT03063086 {published data only}
- NCT03063086. Assess bronchodilator effect and safety of two doses of QVM149 compared to a fixed dose combination of salmeterol/fluticasone in patients with asthma. clinicaltrials.gov/ct2/show/NCT03063086 (first received 24 February 2017).
NCT03184987 {unpublished data only}
- NCT03184987. A long-term safety study of fixed dose combination therapy fluticasone furoate/umeclidinium bromide/vilanterol trifenatate in Japanese subjects with asthma. clinicaltrials.gov/ct2/show/NCT03184987 (first received 14 June 2017).
NCT03376932 {unpublished data only}
- NCT03376932. Effectiveness of fluticasone furoate/ umeclidinium/ vilanterol (FF/UMEC/VI) using the connected inhaler system (CIS) as compared with fluticasone proprionate/ salmeterol (FP/SAL) plus tiotropium (TIO) in inadequately controlled asthma. clinicaltrials.gov/ct2/show/NCT03376932 (first received 19 December 2017).
Norhaya 1999 {published data only}
- Norhaya MR, Yap TM, Zainudin BM. Addition of inhaled salmeterol to inhaled corticosteroids in patients with poorly controlled nocturnal asthma. Respirology 1999;4(1):77-81. [PMID: PMID: 10339734] [DOI] [PubMed] [Google Scholar]
O'Byrne 2014 {published data only}
- O'Byrne PM, Bleecker ER, Bateman ED, Busse WW, Woodcock A, Forth R, et al. Once-daily fluticasone furoate alone or combined with vilanterol in persistent asthma. European Respiratory Journal 2014;43(3):773-82. [PMID: PMID: 24136330] [DOI] [PMC free article] [PubMed] [Google Scholar]
O'Byrne 2016 {published data only}
- O'Byrne PM, Jacques L, Goldfrad C, Kwon N, Perrio M, Yates LJ, et al. Integrated safety and efficacy analysis of once-daily fluticasone furoate for the treatment of asthma. Respiratory Research 2016;17(1):157. [DOI] [PMC free article] [PubMed] [Google Scholar]
Ohta 2015 {published data only}
- Ohta K, Ichinose M, Tohda Y, Engel M, Moroni-Zentgraf P, Kunimitsu S, et al. Long-term once-daily tiotropium Respimat® is well tolerated and maintains efficacy over 52 weeks in patients with symptomatic asthma in Japan: a randomised, placebo-controlled study. PLOS One 2015;10(4):e0124109. [DOI] [PMC free article] [PubMed] [Google Scholar]
Paggiaro 2016 {published data only}
- Paggiaro P, Halpin DM, Buhl R, Engel M, Zubek VB, Blahova Z, et al. The effect of Tiotropium in symptomatic asthma despite low- to medium-dose inhaled corticosteroids: a randomized controlled trial. Journal of Allergy and Clinical Immunology. In Practice 2016 Jan-Feb;4(1):104-13. [DOI] [PubMed] [Google Scholar]
Peters 2010 {published data only}
- Peters SP, Bleecker ER, Kunselman SJ, Icitovic N, Moore WC, Pascual R, et al. Predictors of response to tiotropium versus salmeterol in asthmatic adults. Journal of Allergy and Clinical Immunology 2013;132(5):1068-74. [DOI] [PMC free article] [PubMed] [Google Scholar]
Peters 2016 {published data only}
- Peters SP, Bleecker ER, Canonica GW, Park YB, Ramirez R, Hollis S, et al. Serious asthma events with budesonide plus formoterol vs. budesonide alone. New England Journal of Medicine 2016;375(9):850-60. [PMID: PMID: 27579635] [DOI] [PubMed] [Google Scholar]
Ploszczuk 2018 {published data only}
- Płoszczuk A, Bosheva M, Spooner K, McIver T, Dissanayake S. Efficacy and safety of fluticasone propionate/formoterol fumarate in pediatric asthma patients: a randomized controlled trial. Therapeutic Advances in Respiratory Disease 2018;12:1753466618777924. [PMID: PMID: 29857783] [DOI] [PMC free article] [PubMed] [Google Scholar]
Pohunek 2006 {published data only}
- Pohunek P, Kuna P, Jorup C, De Boeck K. Budesonide/formoterol improves lung function compared with budesonide alone in children with asthma. Pediatric Allergy and Immunology 2006;17(6):458-65. [PMID: PMID: 16925692] [DOI] [PubMed] [Google Scholar]
Price 2002 {published data only}
- Price D, Haughney J, Duerden M, Nicholls C, Moseley C. The cost effectiveness of chlorofluorocarbon-free beclomethasone dipropionate in the treatment of chronic asthma: a cost model based on a 1-year pragmatic, randomised clinical study. Pharmacoeconomics 2002;20(10):653-64. [PMID: PMID: 12162754] [DOI] [PubMed] [Google Scholar]
Rajanandh 2014 {published data only}
- Rajanandh MG, Nageswari AD, Ilango K. Assessment of various second-line medications in addition to inhaled corticosteroid in asthma patients: a randomized controlled trial. Clinical and Experimental Pharmacology and Physiology 2014;41(7):509-13. [DOI] [PubMed] [Google Scholar]
- Rajanandh MG, Nageswari AD, Ilango K. Pulmonary function assessment in mild to moderate persistent asthma patients receiving montelukast, doxofylline, and tiotropium with budesonide: a randomized controlled study. Clinical Therapeutics 2014;36(4):526-33. [DOI] [PubMed] [Google Scholar]
Raphael 2017 {published data only}
- Raphael G, Yiu G, Sakov A, Liu S, Caracta C. Randomized, double-blind trial evaluating the efficacy and safety of fluticasone propionate and fluticasone propionate/salmeterol delivered via multidose dry powder inhalers in patients with persistent asthma aged 12 years and older. Journal of Asthma 2018;55(6):640-50. [DOI] [PubMed] [Google Scholar]
Reddel 2007 {published data only}
- Reddel HK, Peyters MJ, Wark PA, Sand IB, Jenkins CR. Comparison of the efficacy of seretide and flixotide when down‐titrating the inhaled corticosteroid dose. Respirology 2007;12(Suppl 1):A40. [Google Scholar]
Renzi 2010 {published data only}
- Renzi PM, Howard LA, Ortega HG, Ahmad FF, Chapman KR. Low-dose fluticasone propionate with and without salmeterol in steroid-naïve patients with mild, uncontrolled asthma. Respiratory Medicine 2010;104(4):510-7. [DOI] [PubMed] [Google Scholar]
Russell 1995 {published data only}
- Russell G, Williams DA, Weller P, Price JF. Salmeterol xinafoate in children on high dose inhaled steroids. Annals of Allergy, Asthma and Immunology 1995;75(5):423-8. [PMID: PMID: 7583864] [PubMed] [Google Scholar]
Sher 2017 {published data only}
- Sher LD, Yiu G, Sakov A, Liu S, Caracta CF. Fluticasone propionate and fluticasone propionate/salmeterol multidose dry powder inhalers compared with placebo for persistent asthma. Allergy and Asthma Proceedings 2017;38(5):343-53. [PMID: PMID: 28639542] [DOI] [PubMed] [Google Scholar]
Simons 1997 {published data only}
- Simons FE. A comparison of beclomethasone, salmeterol, and placebo in children with asthma. Canadian beclomethasone dipropionate-salmeterol xinafoate study group. New England Journal of Medicine 1997;337(23):1659-65. [PMID: PMID: 9385125] [DOI] [PubMed] [Google Scholar]
Stelmach 2008 {published data only}
- Stelmach I, Grzelewski T, Majak P, Jerzynska J, Stelmach W, Kuna P. Effect of different antiasthmatic treatments on exercise-induced bronchoconstriction in children with asthma. Journal of Allergy and Clinical Immunology 2008;121(2):383-9. [PMID: PMID: 17980416] [DOI] [PubMed] [Google Scholar]
Stempel 2016x {published data only}
- Stempel DA, Szefler SJ, Pedersen S, Zeiger RS, Yeakey AM, Lee LA, et al. Safety of adding salmeterol to fluticasone propionate in children with asthma. New England Journal Medicine 2016;375(9):840-9. [PMID: PMID: 27579634] [DOI] [PubMed] [Google Scholar]
Svedsater 2018 {published data only}
- Svedsater H, Jones R, Bosanquet N, Jacques L, Lay-Flurrie J, Leather DA, et al. Patient-reported outcomes with initiation of fluticasone furoate/vilanterol versus continuing usual care in the Asthma Salford Lung Study. Respiratory Medicine 2018;141:198-206. [PMID: ] [DOI] [PubMed] [Google Scholar]
Tal 2002 {published data only}
- Tal A, Simon G, Vermeulen JH, Petru V, Cobos N, Everard ML, et al. Budesonide/formoterol in a single inhaler versus inhaled corticosteroids alone in the treatment of asthma. Pediatric Pulmonology 2002;34(5):342-50. [PMID: PMID: 12357478] [DOI] [PubMed] [Google Scholar]
Teper 2005 {published data only}
- Teper AM, Kofman CD, Szulman GA, Vidaurreta SM, Maffey AF. Fluticasone improves pulmonary function in children under 2 years old with risk factors for asthma. American Journal of Respiratory and Critical Care Medicine 2005;171(6):587-90. [PMID: PMID: 15591466] [DOI] [PubMed] [Google Scholar]
Verberne 1998 {published data only}
- Verberne AA, Frost C, Duiverman EJ, Grol MH, Kerrebijn KF. Addition of salmeterol versus doubling the dose of beclomethasone in children with asthma. The Dutch asthma study group. American Journal of Respiratory and Critical Care Medicine 1998;158(1):213-9. [PMID: PMID: 9655732] [DOI] [PubMed] [Google Scholar]
Watz 2019 {published and unpublished data}
- Watz H, Hohlfeld, JM, Singh D, Beier J, Scholz V, Diamant Z, et al. The combination of indacaterol/glycopyrronium/mometasone furoate is superior to high-dose salmeterol/fluticasone propionate in improving lung function in patients with asthma. In: American Journal of Respiratory and Critical Care Medicine. Vol. 199. 2019:A7081.
Wechsler 2016 {published data only}
- Wechsler ME, Yawn BP, Fuhlbrigge AL, Pace WD, Pencina MJ, Doros G, et al. Anticholinergic vs long-acting β-agonist in combination with inhaled corticosteroids in black adults with asthma: the BELT randomized clinical trial. JAMA 2015;314(16):1720-30. [DOI] [PubMed] [Google Scholar]
Weiler 2005 {published data only}
- Weiler JM, Nathan RA, Rupp NT, Kalberg CJ, Emmett A, Dorinsky PM. Effect of fluticasone/salmeterol administered via a single device on exercise-induced bronchospasm in patients with persistent asthma. Annals of Allergy, Asthma and Immunology 2005;94(1):65-72. [PMID: PMID: 15702819] [DOI] [PubMed] [Google Scholar]
Weinstein 2019 {published data only}
- Weinstein CL, Ryan N, Shekar T, Gates D, Lane SJ, Agache I, et al. Serious asthma events with mometasone furoate plus formoterol compared with mometasone furoate. Journal of Allergy and Clinical Immunology 2019;134(4):1395-402. [DOI] [PubMed] [Google Scholar]
Yang 2015 {published data only}
- Yang S, Goyal N, Beerahee M, Trivedi R, Lee L, Pascoe S. Dose-response modelling of umeclidinium and fluticasone furoate/umeclidinium in asthma. European Journal of Clinical Pharmacology 2015;71(9):1051-8. [PMID: PMID: 26174114] [DOI] [PubMed] [Google Scholar]
Zhang 2018 {published data only}
- Zhang L, Huang G, Jin L, Han S. Therapeutic effects of a long-acting cholinergic receptor blocker, tiotropium bromide, on asthma. Medical Science Monitor 2018;24:944-50. [DOI] [PMC free article] [PubMed] [Google Scholar]
Zimmerman 2004 {published data only}
- Zimmerman B, D'Urzo A, Bérubé D. Efficacy and safety of formoterol Turbuhaler when added to inhaled corticosteroid treatment in children with asthma. Pediatric Pulmonology 2004;37(2):122-7. [PMID: PMID: 14730657] [DOI] [PubMed] [Google Scholar]
References to ongoing studies
NCT03387241 {published data only}
- NCT03387241. Efficacy of FLUTIFORM ® vs Seretide® in moderate to severe persistent asthma in subjects aged ≥12 years. clinicaltrials.gov/ct2/show/NCT03387241 (first received 2 January 2018).
NCT04191434 {published data only}
- NCT04191434. Efficacy and safety of flamboyant 125/12 association in the treatment of adults with moderate asthma. clinicaltrials.gov/ct2/show/NCT04191434 (first received 9 December 2019).
NCT04191447 {published data only}
- NCT04191447. Efficacy and safety of flamboyant 200/12 association in the treatment of adults with severe asthma. clinicaltrials.gov/ct2/show/NCT04191447 (first received 9 December 2019).
NCT04609878 {published data only}
- NCT04609878. Study to assess PT010 in adult and adolescent participants with inadequately controlled asthma (KALOS) (KALOS). clinicaltrials.gov/ct2/show/NCT04609878 (first received 30 October 2020).
NCT04609904 {published data only}
- NCT04609904. Study to assess PT010 in adult and adolescent participants with inadequately controlled asthma (LOGOS) (LOGOS). clinicaltrials.gov/ct2/show/NCT04609904 (first received 30 October 2020).
NCT04937387 {unpublished data only}
- NCT04937387. Efficacy and safety of fluticasone furoate/umeclidinium/vilanterol (ff/umec/vi) in chinese participants with inadequately controlled asthma. clinicaltrials.gov/ct2/show/NCT04937387 (first received 24 June 2021).
NCT05018598 {unpublished data only}
- NCT05018598. Step-up to medium strength triple therapy vs high strength ICS/LABA in adult asthmatics uncontrolled on medium strength ICS/LABA (MiSTIC). clinicaltrials.gov/ct2/show/NCT05018598 (first received 24 August 2021).
Additional references
Aalbers 2017
- Aalbers R, Park HS. Positioning of long-acting muscarinic antagonists in the management of asthma. Allergy, Asthma and Immunology Research 2017;9(5):386-93. [DOI: 10.4168/aair.2017.9.5.386] [PMID: ] [DOI] [PMC free article] [PubMed] [Google Scholar]
Anderson 2015
- Anderson DE, Kew KM, Boyter AC. Long-acting muscarinic antagonists (LAMA) added to inhaled corticosteroids (ICS) versus the same dose of ICS alone for adults with asthma. Cochrane Database of Systematic Reviews 2015, Issue 8. Art. No: CD011397. [DOI: 10.1002/14651858.CD011397.pub2] [PMID: ] [DOI] [PMC free article] [PubMed] [Google Scholar]
Barnes 2010
- Barnes PJ. Inhaled corticosteroids. Pharmaceuticals 2010;3(3):514-40. [DOI: 10.3390/ph3030514] [PMC4033967/] [PMID: ] [DOI] [PMC free article] [PubMed] [Google Scholar]
Beasley 2019
- Beasley R, Harper J, Bird G, Maijers I, Weatherall M, Pavord ID. Inhaled corticosteroid therapy in adult asthma. Time for a new therapeutic dose terminology. American Journal of Respiratory and Critical Care Medicine 2019;199(12):1471-7. [DOI: 10.1164/rccm.201810-1868CI] [PMID: ] [DOI] [PubMed] [Google Scholar]
Befekadu 2014
- Befekadu E, Onofrei C, Colice GL. Tiotropium in asthma: a systematic review. Journal of Asthma and Allergy 2014;7:11-21. [DOI: 10.2147/JAA.S38841] [PMID: ] [DOI] [PMC free article] [PubMed] [Google Scholar]
BTS/SIGN 2019
- BTS/SIGN British Guideline on the Management of Asthma 2019. www.brit-thoracic.org.uk/quality-improvement/guidelines/asthma/ 2019.
Buhl 2021
- Buhl R, Nikolaev I, Tillmann HC, Vaidya S, Bartels C, Jain M, et al. Dose bridging data for mometasone furoate in once-daily fixed-dose inhaled combinations of mometasone furoate/indacaterol and mometasone furoate/ indacaterol/glycopyrronium in patients with asthma. Pulmonary Pharmacology & Therapeutics 2021 Oct;70:102068. [DOI: 10.1016/j.pupt.2021.102068] [PMID: ] [DOI] [PubMed] [Google Scholar]
Cochrane Airways 2019
- Cochrane Airways Trials Register. airways.cochrane.org/trials-register (accessed 7 May 2019).
Covidence [Computer program]
- Covidence systematic review software. Melbourne, Australia: Veritas Health Innovation, June 29, 2021. Available at www.covidence.org.
Dechartres 2013
- Dechartres A, Trinquart L, Boutron I, Ravaud P. Influence of trial sample size on treatment effect estimates: meta-epidemiological study. BMJ 2013;346:f2304. [PMID: ] [DOI] [PMC free article] [PubMed] [Google Scholar]
Deeks 2020
- Deeks JJ, Higgins JP, Altman DG, editor(s). Chapter 10: Analysing data and undertaking meta-analyses. In: Higgins JP, Thomas J, Chandler J, Cumpston M, Li T, Page MJ, Welch VA, editor(s). Cochrane Handbook for Systematic Reviews of Interventions version 6.1 (updated September 2020). The Cochrane Collaboration, 2020. Available from training.cochrane.org/handbook.
Derom 1992
- Derom EY, Pauwels RA. Time course of bronchodilating effect of inhaled formoterol, a potent and long acting sympathomimetic. Thorax 1992;47(1):30-3. [DOI: 10.1136/thx.47.1.30] [PMID: ] [DOI] [PMC free article] [PubMed] [Google Scholar]
Dias 2013a
- Dias S, Sutton AJ, Welton NJ, Ades AE. Evidence synthesis for decision making 3: heterogeneity--subgroups, meta-regression, bias, and bias-adjustment. Medical Decision Making 2013;33(5):618-40. [DOI] [PMC free article] [PubMed] [Google Scholar]
Dias 2013b
- Dias S, Sutton AJ, Ades AE, Welton NJ. Evidence synthesis for decision making 2: a generalized linear modeling framework for pairwise and network meta-analysis of randomized controlled trials. Medical Decision Making 2013;33(5):607-17. [DOI: 10.1177/0272989X12458724] [PMID: ] [DOI] [PMC free article] [PubMed] [Google Scholar]
Dias 2013c
- Dias S, Welton NJ, Sutton AJ, Caldwell DM, Lu G, Ades AE. Evidence synthesis for decision making 4: inconsistency in networks of evidence based on randomized controlled trials. Medical Decision Making 2013;33(5):641-56. [DOI: 10.1177/0272989X12455847] [PMID: ] [DOI] [PMC free article] [PubMed] [Google Scholar]
Ducharme 2010
- Ducharme FM, Ni Choinin M, Greenstone I, Lasserson TJ. Addition of long-acting beta 2-agonists to inhaled steroids versus higher dose inhaled steroids in adults and children with persistent asthma. Cochrane Database of Systematic Reviews 2010, Issue 4. Art. No: CD005533. [DOI: 10.1002/14651858.CD005533.pub2] [PMC4169792] [PMID: ] [DOI] [PMC free article] [PubMed] [Google Scholar]
FDA 2016
- US Food and Drug Administration. What is a serious adverse event? www.fda.gov/safety/reporting-serious-problems-fda/what-serious-adverse-event (accessed 26 October 2021).
GeMTC package [Computer program]
- gemtc. Valkenhoef G and Kuiper J, Version 1.0-1. Groningen, Netherlands: Gert van Valkenhoef, May 14, 2021. https://CRAN.R-project.org/package=gemtc.
GINA 2021
- Global Initiative for Asthma. 2021 GINA Report, Global Strategy for Asthma Management and Prevention. ginasthma.org/gina-reports/ (accessed 6 April 2022).
Global Asthma Report 2018
- Global Asthma Network. The Global Asthma Report 2018. globalasthmareport.org/Global%20Asthma%20Report%202018.pdf (accessed prior to 26 October 2020).
Gosens 2018
- Gosens R, Gross N. The mode of action of anticholinergics in asthma. European Respiratory Journal 2018;52(4):pii: 1701247. [DOI: 10.1183/13993003.01247-2017] [PMID: ] [DOI] [PMC free article] [PubMed] [Google Scholar]
GRADEpro GDT [Computer program]
- GRADEpro GDT. Version accessed 22 January 2020. Hamilton (ON): McMaster University (developed by Evidence Prime), 2015. Available at gradepro.org.
Guyatt 2011a
- Guyatt GH, Oxman AD, Kunz R, Woodcock J, Brozek J, Helfand M, et al. GRADE Working Group. GRADE guidelines: 7. Rating the quality of evidence--inconsistency. Journal of Clinical Epidemiology 2011 Dec;64(12):1294-302. [PMID: ] [DOI] [PubMed] [Google Scholar]
Guyatt 2011b
- Guyatt G, Oxman AD, Akl EA, Kunz R, Vist G, Brozek J, et al. GRADE guidelines: 1. Introduction - GRADE evidence profiles and summary of findings tables. Journal of Clinical Epidemiology 2011;64(4):383-94. [DOI: 10.1016/j.jclinepi.2010.04.026] [PMID: ] [DOI] [PubMed] [Google Scholar]
Guyatt 2017
- Guyatt GH, Ebrahim S, Alonso-Coello P, Johnston BC, Mathioudakis AG, Briel M, et al. GRADE guidelines 17: assessing the risk of bias associated with missing participant outcome data in a body of evidence. Journal of Clinical Epidemiology 2017;87:14-22. [PMID: ] [DOI] [PubMed] [Google Scholar]
Haahtela 1991
- Haahtela T, Järvinen M, Kava T, Kiviranta K, Koskinen S, Lehtonen K, et al. Comparison of a beta 2-agonist, terbutaline, with an inhaled corticosteroid, budesonide, in newly detected asthma. New England Journal of Medicine 1991;325(6):388-92. [DOI: 10.1056/NEJM199108083250603] [PMID: ] [DOI] [PubMed] [Google Scholar]
Higgins 2019
- Higgins JP, Savović J, Page MJ, Elbers RG, Sterne JA, editor(s). Chapter 8: Assessing risk of bias in a randomized trial. In: Higgins JP, Thomas J, Chandler J, Cumpston M, Li T, Page MJ, Welch VA, editor(s), Cochrane Handbook for Systematic Reviews of Interventions version 6.0 (updated July 2019). The Cochrane Collaboration, 2019. Available from training.cochrane.org/handbook.
Juniper 1994
- Juniper EF, Guyatt GH, Willan A, Griffith LE. Determining a minimal important change in a disease-specific Quality of Life Questionnaire. Journal of Clinical Epidemiology 1994;47(1):81-7. [DOI: 10.1016/0895-4356(94)90036-1] [PMID: ] [DOI] [PubMed] [Google Scholar]
Juniper 2005
- Juniper EF, Svensson K, Mörk AC, Ståhl E. Measurement properties and interpretation of three shortened versions of the asthma control questionnaire. Respiratory Medicine 2005;99(5):553-8. [PMID: ] [DOI] [PubMed] [Google Scholar]
Juniper 2006
- Juniper EF, Bousquet J, Abetz L, Bateman ED, GOAL Committee. Identifying 'well-controlled' and 'not well-controlled' asthma using the Asthma Control Questionnaire. Respiratory Medicine 2006;100(4):616-21. [DOI: 10.1016/j.rmed.2005.08.012] [PMID: ] [DOI] [PubMed] [Google Scholar]
Kew 2016
- Kew KM, Quinn M, Quon BS, Ducharme FM. Increased versus stable doses of inhaled corticosteroids for exacerbations of chronic asthma in adults and children. Cochrane Database of Systematic Reviews 2016, Issue 6. Art. No: CD007524. [DOI: 10.1002/14651858.CD007524.pub4] [PMID: ] [DOI] [PMC free article] [PubMed] [Google Scholar]
Kim 2021
- Kim LHY, Saleh C, Whalen-Browne A, O'Byrne PM, Chu DK. Triple vs dual inhaler therapy and asthma outcomes in moderate to severe asthma: a systematic review and meta-analysis. JAMA 2021;325(24):2466-79. [DOI: 10.1001/jama.2021.7872] [PMC8135065] [PMID: ] [DOI] [PMC free article] [PubMed] [Google Scholar]
Kips 2001
- Kips JC, Pauwels RA. Long-acting inhaled beta 2-agonist therapy in asthma. American Journal of Respiratory and Critical Care Medicine 2001;164(6):923-32. [DOI: 10.1164/ajrccm.164.6.2010107] [PMID: ] [DOI] [PubMed] [Google Scholar]
Marshall 2018
- Marshall IJ, Noel-Storr AH, Kuiper J, Thomas J, Wallace BC. Machine learning for identifying randomized controlled trials: an evaluation and practitioner’s guide. Research Synthesis Methods 2018;9(4):602-14. [DOI] [PMC free article] [PubMed] [Google Scholar]
McDonald 2017
- McDonald S, Noel-Storr AH, Thomas J. Harnessing the efficiencies of machine learning and Cochrane Crowd to identify randomised trials for individual Cochrane reviews. In: Global Evidence Summit; 2017 September 13-16; Cape Town, South Africa. 2017.
McIvor 2014
- McIvor RA. Respiratory disorders: chronic obstructive pulmonary disease. In: Gray J, editors(s). Therapeutic Choices. 7th edition. Ottawa (ON): Canadian Pharmaceutical Association, 2014. [Google Scholar]
Moher 2009
- Moher D, Liberati A, Tetzlaff J, Altman D. Preferred reporting items for systematic reviews and meta-analyses: the PRISMA statement. PLOS Medicine 2009;6(7):e1000097. [DOI: 10.1371/journal.pmed.1000097] [DOI] [PMC free article] [PubMed] [Google Scholar]
NICE 2018
- National Institute for Health and Care Excellence. Inhaled corticosteroid doses for NICE’s asthma guideline. www.nice.org.uk/guidance/ng80/resources/inhaled-corticosteroid-doses-pdf-4731528781 (accessed prior to 27 October 2020).
Noel‐Storr 2018
- Noel-Storr AH, Project Transform team. Cochrane Crowd: new ways of working together to produce health evidence. In: Evidence Live; 2018 June 18-20; Oxford, UK. 2018.
Nüesch 2010
- Nüesch E, Trelle S, Reichenbach S, Rutjes AW, Tschannen B, Altman DG, et al. Small study effects in meta-analyses of osteoarthritis trials: meta-epidemiological study. BMJ 2010;341:c3515. [PMID: ] [DOI] [PMC free article] [PubMed] [Google Scholar]
O'Byrne 2019
- O'Byrne P, Fabbri LM, Pavord ID, Papi A, Petruzzelli S, Lange P. Asthma progression and mortality: the role of inhaled corticosteroids. European Respiratory Journal 2019;54(1):pii: 1900491. [DOI: 10.1183/13993003.00491-2019] [PMID: ] [DOI] [PMC free article] [PubMed] [Google Scholar]
OpenBUGS [Computer program]
- OpenBUGS. Thomas A, Version 3.2.3. Helsinki: Andrew Thomas, 2010. www.openbugs.net/w/FrontPage.
Pandya 2014
- Pandya D, Puttanna A, Balagopal V. Systemic effects of inhaled corticosteroids: an overview. Open Respiratory Medical Jouranl 2014;8:59-65. [DOI: 10.2174/1874306401408010059] [PMID: ] [DOI] [PMC free article] [PubMed] [Google Scholar]
Petsky 2018
- Petsky HL, Cates CJ, Kew KM, Chang AB. Tailoring asthma treatment on eosinophilic markers (exhaled nitric oxide or sputum eosinophils): a systematic review and meta-analysis. Thorax 2018 Dec;73(12):1110-19. [DOI: 10.1136/thoraxjnl-2018-211540] [PMID: ] [DOI] [PubMed] [Google Scholar]
Phillippo 2018
- Phillippo DM, Dias S, Ades AE, Didelez V, Welton NJ. Sensitivity of treatment recommendations to bias in network meta-analysis. Journal of the Royal Statistical Society Series A (Statistics in Society) 2018;181(3):843-67. [DOI: 10.1111/rssa.12341] [PMC6221150] [PMID: ] [DOI] [PMC free article] [PubMed] [Google Scholar]
Phillippo 2019
- Phillippo DM, Dias S, Welton NJ, Caldwell DM, Taske N, Ades AE. Threshold analysis as an alternative to GRADE for assessing confidence in guideline recommendations based on network meta-analyses. Annals of Internal Medicine 2019;170(8):538-46. [DOI: 10.7326/M18-3542] [PMC6739230] [PMID: ] [DOI] [PMC free article] [PubMed] [Google Scholar]
R [Computer program]
- R: A Language and Environment for Statistical Computing. R Core Team, Version 4.1.1. Vienna, Austria: R Foundation for Statistical Computing, 2021-08-10. https://www.R-project.org.
Review Manager 2020 [Computer program]
- Review Manager 5 (RevMan 5). Version 5.4. Copenhagen: The Cochrane Collaboration, 2020.
RoB 2 Excel tool [Computer program]
- Risk of Bias 2 tool. London, England: Cochrane, 22 August 2019. Available at https://sites.google.com/site/riskofbiastool/welcome/rob-2-0-tool/current-version-of-rob-2.
Rogliani 2021
- Rogliani P, Ritondo BL, Calzetta L. Triple therapy in uncontrolled asthma: a network meta-analysis of phase III studies. European Respiratory Journal 2021;58(3):2004233. [DOI: 10.1183/13993003.04233-2020] [PMID: ] [DOI] [PubMed] [Google Scholar]
Röver 2021
- Röver C, Bender R, Dias S, Schmid CH, Schmidli H, Sturtz S, et al. On weakly informative prior distributions for the heterogeneity parameter in Bayesian random‐effects meta‐analysis. Research Synthesis Methods 2021;12(4):448-74. [DOI] [PubMed] [Google Scholar]
Schatz 2006
- Schatz M, Sorkness CA, Li JT, Marcus P, Murray JJ, Nathan RA, et al. Asthma Control Test: reliability, validity, and responsiveness in patients not previously followed by asthma specialists. Journal of Allergy and Clinical Immunology 2006;117(3):549-56. [DOI: 10.1016/j.jaci.2006.01.011] [PMID: ] [DOI] [PubMed] [Google Scholar]
Schünemann 2020
- Schünemann HJ, Higgins JP, Vist GE, Glasziou P, Akl EA, Skoetz N, et al. Chapter 14: Completing ‘Summary of findings’ tables and grading the certainty of the evidence. In: Higgins JP, Thomas J, Chandler J, Cumpston M, Li T, Page MJ, Welch VA, editor(s). Cochrane Handbook for Systematic Reviews of Interventions version 6.1 (updated September 2020). The Cochrane Collaboration, 2020. Available from training.cochrane.org/handbook.
Sears 2014
- Sears MR. Trends in the prevalence of asthma. Chest 2014;145(2):219-25. [DOI: 10.1378/chest.13-2059] [PMID: ] [DOI] [PubMed] [Google Scholar]
Shimoda 2016
- Shimoda T, Obase Y, Kishikawa R, Iwanaga T. Influence of cigarette smoking on airway inflammation and inhaled corticosteroid treatment in patients with asthma. Allergy and Asthma Proceedings 2016;37(4):50-8. [DOI: 10.2500/aap.2016.37.3944] [PMID: ] [DOI] [PubMed] [Google Scholar]
Sobieraj 2018a
- Sobieraj DM, Baker WL, Nguyen E, Weeda ER, Coleman CI, White CM, et al. Association of inhaled corticosteroids and long-acting muscarinic antagonists with asthma control in patients with uncontrolled, persistent asthma: a systematic review and meta-analysis. JAMA 2018;319(14):1473-84. [DOI: 10.1001/jama.2018.2757] [PMID: ] [DOI] [PMC free article] [PubMed] [Google Scholar]
Sobieraj 2018b
- Sobieraj DM, Weeda ER, Nguyen E, Coleman CI, White CM, Lazarus SC, et al. Association of inhaled corticosteroids and long-acting beta 2-agonists as controller and quick relief therapy with exacerbations and symptom control in persistent asthma: a systematic review and meta-analysis. JAMA 2018;319(14):1485-96. [DOI: 10.1001/jama.2018.2769] [PMID: ] [DOI] [PMC free article] [PubMed] [Google Scholar]
Soriano 2017
- GBD 2015 Chronic Respiratory Disease Collaborators. Global, regional, and national deaths, prevalence, disability-adjusted life years, and years lived with disability for chronic obstructive pulmonary disease and asthma, 1990–2015: a systematic analysis for the Global Burden of Disease Study 2015. Lancet Respiratory Medicine 2017;5(9):691-706. [DOI: 10.1016/S2213-2600(17)30293-X. Epub 2017 Aug 16] [PMID: ] [DOI] [PMC free article] [PubMed] [Google Scholar]
Spiegelhalter 2002
- Spiegelhalter DJ, Best NG, Carlin BP, Van der Linde A. Bayesian measures of model complexity and fit. Journal of the Royal Statistical Society Series B (Statistical Methodology) 2002;64(4):583-616. [Google Scholar]
Sterne 2019
- Sterne JA, Savović J, Page MJ, Elbers RG, Blencowe NS, Boutron I, et al. RoB 2: a revised tool for assessing risk of bias in randomised trials. BMJ 2019;366:l4898. [DOI: 10.1136/bmj.l4898] [PMID: ] [DOI] [PubMed] [Google Scholar]
Thomas 2017
- Thomas J, Noel-Storr AH, Marshall I, Wallace B, McDonald S, Mavergames C, et al. Living systematic review network. Living systematic reviews: 2. Combining human and machine effort. Journal of Clinical Epidemiology 2017;91:31-7. [DOI] [PubMed] [Google Scholar]
Turner 2015
- Turner RM, Jackson D, Wei Y, Thompson SG, Higgins JP. Predictive distributions for between-study heterogeneity and simple methods for their application in Bayesian meta-analysis. Statistics in Medicine 2015;34(6):984-98. [PMC4383649] [PMID: ] [DOI] [PMC free article] [PubMed] [Google Scholar]
Vaidya 2016
- Vaidya SS, Khindri S, Calder N, Machineni S, Hara H, Majumdar T, et al. Pharmacokinetics of indacaterol and mometasone furoate delivered alone or in a free or fixed dose combination in healthy subjects. Pulmonary Pharmacology and Therapeutics 2016;37:30-6. [DOI: 10.1016/j.pupt.2016.01.004] [PMID: ] [DOI] [PubMed] [Google Scholar]
van Valkenhoef 2016
- Valkenhoef G, Dias S, Ades AE, Welton NJ. Automated generation of node-splitting models for assessment of inconsistency in network meta-analysis. Research Synthesis Methods 2016;7(1):80-93. [DOI: 10.1002/jrsm.1167] [PMC5057346] [PMID: PMID: 26461181] [DOI] [PMC free article] [PubMed] [Google Scholar]
Yepes‐Nuñez 2019
- Yepes-Nuñez JJ, Li SA, Guyatt G, Jack SM, Brozek JL, Beyene J, et al. Development of the summary of findings table for network meta-analysis. Journal of Clinical Epidemiology 2019;115:1-13. [DOI: 10.1016/j.jclinepi.2019.04.018] [PMID: ] [DOI] [PubMed] [Google Scholar]
Zhang 2019
- Zhang Y, He J, Yuan Y, Faramand A, Fang F, Ji H. Increased versus stable dose of inhaled corticosteroids for asthma exacerbations: a systematic review and meta-analysis. Clinical and Experimental Allergy 2019;49(10):1283-90. [DOI: 10.1111/cea.13450] [PMID: ] [DOI] [PubMed] [Google Scholar]
References to other published versions of this review
Oba 2020
- Oba Y, Maduke T, Anwer S, Patel T, Dias S. Effectiveness and tolerability of dual and triple combination inhaler therapies compared with each other and varying doses of inhaled corticosteroids in adolescents and adults with asthma: a systematic review and network meta-analysis. Cochrane Database of Systematic Reviews November 24, 2020, Issue 11. Art. No: CD013799. [DOI: 10.1002/14651858.CD013799] [DOI] [PMC free article] [PubMed] [Google Scholar]