

Abstract
Lithium is listed in the fifth Unregulated Contaminant Monitoring Rule (UCMR 5) because insufficient exposure data exists for lithium (Li) in drinking water. To help fill this data gap, Lithium occurrence in source waters across the United States was assessed in 21 drinking water utilities, and a publicly available national water quality portal (WQP) database with over 40,000 other measurements in surface water and groundwater that could potentially to be used as drinking water sources. From the 369 source water samples collected from drinking water treatment plants (DWTPs), Lithium ranged from 0.9 to 161 μg/L (median = 14 μg/L) in groundwater, and Lithium ranged from < 0.5 to 130 μg/L (median = 3.9 μg/L) in surface water. Lithium in 56% of the groundwater and 13% of the surface water samples were above the non-regulatory Health-Based Screening Level (HBSL) of 10 μg/L, with a few sites having Lithium more than 10 times higher than the HBSL. Sodium (Na) and Lithium concentrations were strongly correlated: Kendall’s rank correlation coefficient τ > 0.6 (p < 0.001). Since Na is monitored and reported regularly by DWTPs, this result shows that Na can serve as an indicator to identify water sources at higher risk for elevated lithium. Lithium concentrations in the paired samples collected in source water and treated drinking water were almost identical showing Lithium was not removed by conventional drinking water treatment processes. Thus, source water lithium concentration occurrence appears to be a reasonable estimate for human exposures in drinking water. Additional sampling in wastewater effluents detected Lithium at 0.8 to 98.2 μg/L (median = 9.9 μg/L), which suggests more research on impacts of Lithium in direct and indirect potable reuse may be warranted, as the median was close to the HBSL. For comparison with the study samples collected from DWTPs, Lithium concentrations from the WQP database, that were selected based upon chloride level to be suitable for drinking water (Cl− < 250 mg/L), had comparable median Lithium concentrations:18 and 20 μg/L for surface water and groundwater, respectively. Overall, this study provides a comprehensive occurrence potential for lithium in US drinking water sources and can inform the data collection effort in UCMR 5.
Keywords: Pollution, exposure, inorganic, rivers, groundwater
Graphical Abstract
1. Introduction
The United States Environmental Protection Agency (USEPA) lists lithium (Li) in the fifth Unregulated Contaminant Monitoring Rule (UCMR 5) (USEPA, 2021a) and the 2021 Draft Fifth Contaminant Candidate List (CCL5) (USEPA, 2021b), signifying that Lithium occurrence is a data gap for potential future drinking water rule or regulation development. Lithium is the 30th most abundant element with concentrations of 0.002–0.006 wt% in the Earth’s crust primarily in rocks and mineral sediments (Aral and Vecchio-Sadus, 2011; Bradley et al., 2017b). Due to its low specific gravity, heat resistance, and electrochemical properties, commercial/industrial interest exists for Lithium as a commodity, with a primary end use in batteries (71% of global market) followed by ceramics and glass industry (14%) (USGS, 2021). The growth of renewable energy technologies has increased Lithium production. Global Lithium demand is projected to increase more than 10-fold from 0.056 million tons (Mt) in 2020 to 0.6–1.5 Mt in 2050 (Greim et al., 2020; USGS, 2021; Xu et al., 2020). This dramatic Lithium market growth raises concerns of human exposure to Li. For example, a recent study by Choi et al. noted a 6-fold Lithium increase in a drinking water source in Seoul that received wastewater effluents from municipal, hospitals, and industrial sources (Choi et al., 2019).
Lithium is used as a human therapeutic. For example, it is prescribed to treat bipolar disorder (Cipriani et al., 2013). Studies have shown inverse relationships between consumption of trace Lithium in drinking water with suicide (Barjasteh-Askari et al., 2020; Ishii and Terao, 2018), depression, violent crime rates, or incidence of dementia and Alzheimer disease (Kessing et al., 2017). However, human health concerns also exist. Long-term Lithium exposure via drinking water was reported to potentially disrupt thyroid function in a study conducted in Puna region in Argentina where local Lithium in drinking water ranged from 8 to 1,005 μg/L (Broberg et al., 2011). Lithium in drinking water is not regulated in the United States (US), but the United States Geological Survey (USGS) in collaboration with USEPA provides a non-regulatory Health-Based Screening Level (HBSL) of 10 μg/L, which sets a human health context for Lithium in drinking water sources (Norman et al., 2018).
Lithium occurrence data analysis has largely been limited to groundwater. Using data collected in the US from 1984 to 1986, Lithium was detected in ~55% of the surveyed public water systems (PWSs), with Lithium concentrations ranging from 5 to 7,929 μg/L (USEPA, 2009). A recent USGS publication found Lithium in groundwater used for drinking water supplies ranged from <1 to 396 μg/L in public supply wells and <1 to 1700 μg/L in domestic supply wells (i.e., private wells) for data collected from 1991 to 2018 (Lindsey et al., 2021). In contrast to groundwater sources, there is limited information about Lithium in surface water. The limited occurrence data that is available reported typical background Lithium ranges from 0.07 to 40 μg/L in freshwater (Aral and Vecchio-Sadus, 2008).
This paper reports new measurements and statistical analysis of publicly available databases for Lithium occurrence in drinking water sources (both surface water and groundwater) in the US. This study aims to complement and inform the Lithium data collection effort in UCMR 5 planned for 2023–2025 at PWSs. Field samples from this study were collected from 21 drinking water utilities across the country and analyzed for Lithium along with 33 other elements. In addition, because drinking water sources may be impacted by de-facto reuse from upstream wastewater effluents, Lithium in tertiary wastewater effluents from 6 municipal wastewater utilities were explored. Finally, Lithium data in publicly available databases of surface water (n = 74,567) and groundwater (n = 57,186) were interpreted for the relevance to drinking water. The paper addresses the following research questions: (i) what is the Lithium concentration and geographical distribution in drinking water sources in the US? (ii) do correlations exist between Lithium and frequently measured water quality parameters in drinking water sources? and (iii) is Lithium removed by drinking water treatment processes?
2. Materials and methods
2.1. Source water sampling and analysis
A US-based survey was conducted at 21 public drinking water utilities across 9 states. The utilities were selected based on their geographic location (to cover different regions in the US), types of source water (river, lake, groundwater wells) and their willingness to participate in this program. Detailed information about the utility locations and types of source water, selection criteria, and potential risk factors are summarized in Table S1 in the Supplementary Information (SI). Most of these utilities owned more than one drinking water treatment plants (DWTPs) located at different sites, and consequently, multiple source waters were used for drinking water supplies. For these utilities, all the source waters were sampled. In total, 369 water samples were collected from 40 surface water and 42 groundwater sources. These samples are referred to as study samples from DWTPs in the following sections. Because limited data is available for Lithium in wastewater treatment plants (WWTP) effluents, 33 tertiary wastewater effluent samples were collected from 8 WWTP effluents in 6 municipal WWTP utilities. All the participating utilities agreed upon signing a non-disclosure agreement to prevent disclosing their source water information. Therefore, the study samples data are represented in USEPA regions to maintain anonymity.
Currently, the literature lacks data on seasonal or other temporal trends in Lithium concentrations in drinking water sources. Therefore, this study aimed to obtain the first dataset on possible annual variation in Lithium concentrations in drinking water sources by sampling across multiple months for one year. Surface water sources were sampled at least 5 times between August 2018 and March 2020 to capture potential seasonal variations. The seasonal variations included capture of flow variations across different precipitation seasons such as summer (low flow conditions) and winter or rain (high precipitation conditions) specifically in river-based sources. Although, different watersheds may have dry, average, or wet years, this flow trend analysis and granularity was not part of this study. Groundwater sources were sampled at least twice within one year over a period between August 2018 and December 2019. Wastewater effluents were sampled four times within a month (2 weekdays + 2 weekend days) between September 2019 and January 2020. It is to be noted that continuous monitoring of source waters to understand long-term seasonal variation was not the scope of this work, and future studies can expand our understanding of Lithium occurrence in various seasons, and precipitation years (wet year, dry year and/or average year) in specific watersheds. Finally, three paired samples of source and treated water at three DWTPs were sampled (once in August 2021) to investigate whether Lithium was removed during water treatment processes. These samples were from UD-4 (1 surface water source) and UD-5 (1 surface water + 1 groundwater), where Lithium in the source waters was detected above the HBSL.
All the 369 samples were collected by the utility personnel and shipped in ice-packed coolers and received within 48 hours of sample collection. Samples were filtered through 0.45 μm nylon syringe filters in the lab. Dissolved Lithium and co-existing elements and anions were then analyzed using inductively coupled plasma mass spectrometry (ICP-MS) and ion chromatography (IC), respectively. Detailed analytical methods are summarized in the SI. The method detection limit (MDL) of ICP-MS for Lithium was 0.5 μg/L. The concentration of Lithium and other constituents that were not detected was set to half the detection limit before doing statistical analysis.
2.2. Data collection from publicly available databases
The field sampling campaign described above provides data on current Lithium concentrations in drinking water sources at specific utilities. To expand the scope of this study and present Lithium occurrence dataset from potential drinking water sources in the United States, Lithium concentrations dating from 1905 to 2021 were obtained from the publicly available databases provided in the National Water Quality Monitoring Council’s (NWQMC) Water Quality Portal. The Water Quality Portal (WQP) is a collection of water quality data collected by the USGS, USEPA, and the NWQMC combined from over 400 state, federal, tribal, and local agencies. In total, 134,446 Lithium samples were available from the WQP, including 74,567 surface water and 57,186 groundwater samples across 44,166 locations (8,626 surface water + 35,540 groundwater). The data in these databases had been collected for various reasons and do not necessarily represent drinking water sources. Using a similar approach applied previously in a nationwide assessment of iodide and bromide (Sharma et al., 2019), a cutoff of 250 mg/L of chloride (Cl−), the secondary MCL set by USEPA, was used to identify as subset of water bodies that may potentially act as drinking water sources. WQP database used a wide variety of analytical techniques for measuring Lithium concentrations in water samples. Since 1980, ICP-MS and Inductively Coupled Plasma Atomic Emission Spectroscopy (ICP-AES) based analytical methods have become the preferred analytical approach for Lithium analysis (Houk et al., 1980). Therefore, only data acquired after 1980 were used to achieve recent and higher accuracy data. Paired Cl− and Lithium collected after 1980 was available for 49,918 data points, and the subset database (with Cl− < 250 mg/L) contained 36,158 data points (7,629 surface water + 28,529 groundwater) across 18,766 monitoring locations (937 surface water + 17,829 groundwater). These samples are referred to as samples from WQP database. Details about WQP data handling are presented in the SI.
2.3. Statistical analysis
Statistical analyses were conducted using Statistical Package for the Social Sciences (SPSS) version 27. Non-parametric Kendall’s tau (τ) rank correlation was used to evaluate the associations between Lithium and coexisting elements, anions, and conductivity. Kendall’s τ measures the strength and direction of association (or monotonic relationship) that exists. Because p-values calculated for large samples tend to be near zero, a certain p-value was not set for the correlation test; meanwhile, 95% confidence intervals were reported. Ten of the 33 elements (i.e., Be, Ge, As, Se, Ag, Cd, Ce, Gd, Tl, and Pb) were measured below MDL in more than 50% of the surveyed samples, therefore, these elements were excluded in the bivariate correlation test.
3. Results and discussion
3.1. Lithium in 21 public drinking water utilities
3.1.1. Lithium occurrence and distribution
Fig. 1a shows Lithium in DWTP source waters and WWTP effluents. Table S2 summarizes occurrence statistics, and Fig. S1 plots the cumulative Lithium concentration distribution. Lithium in 23 samples was below the detection limit (0.5 μg/L), and all of them were surface water samples. These samples account for 9% of the surface water samples and 6.2% of all samples collected from drinking water sources. In groundwater, Lithium ranged from 0.9 to 161.1 μg/L (median = 13.9 μg/L), and 56% of the samples exceeded the HBSL of 10 μg/L. In surface water samples, Lithium ranged from < 0.5 to 129.9 μg/L (median = 3.9 μg/L), and 13% were above the HBSL. Overall, detectable levels of Lithium occurred in 80 of the 82 source waters. Figure 1b shows cumulative frequency distribution plots for surface and ground water data. The median Lithium concentration in 55% of the groundwater sources (23 of 42 source waters) were above the HBSL, with three source waters had median Lithium more than 10 times higher than the HBSL. Only 10% of the surface water sources (4 of 40 source waters) had median Lithium concentration above the HBSL. The results show that groundwater sources generally had higher Lithium than surface water sources. This is likely due to the elevated concentrations of total dissolved solids in groundwater comparing to those in surface water, and groundwater is one primary source of Lithium in surface water. The dilution in streams warrants this discussion.
Figure 1.
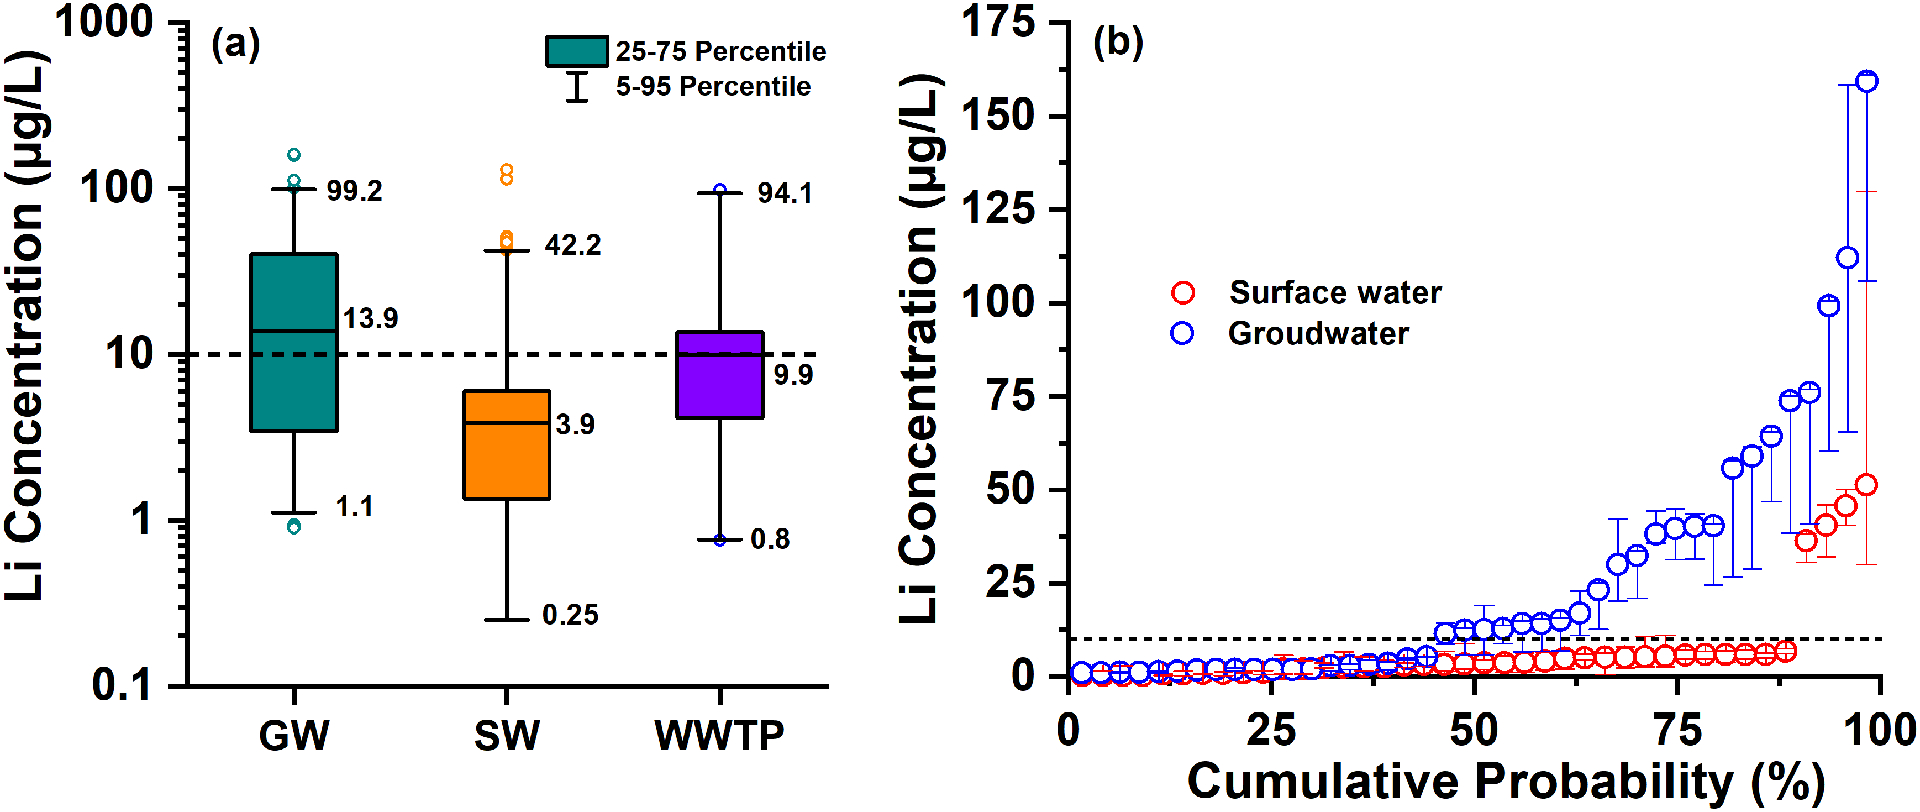
Lithium distribution in 369 study samples collected from drinking water treatment plant (DWTP) source waters and 33 samples collected from tertiary wastewater effluent. (a) box and whisker plots of Lithium occurrence in groundwater (GW) and surface water (SW) used as drinking water source, and in municipal wastewater treatment plant (WWTP) effluents; (b) Lithium distribution in the source waters. Since each site was sampled multiple times, the symbols show the median Lithium concentration, and the bars denote the range of Lithium concentration. Dashed line indicates 10 μg/L non-regulatory Health-Based Screening Level.
Fig. 2 shows the spatial distribution of Lithium in the source waters. Water samples collected in the eastern US along the Ohio River, Cape Fear River, and Alafia Rivers contained <5 μg/L in both surface water and groundwater. The highest Lithium concentration (i.e., outliners in Fig. 1a) were observed in the southwest US (Arizona, Nevada, and Texas). Elevated Lithium has been attributed to geological deposits of granitic, lithium-cesium-tantalum (LCT) pegmatites (primary mineral source of Li) and lithium brine deposits, which are prominent in southwest US (Bradley et al., 2017a). In addition, all these sites were in the regions with arid and semi-arid climates. Prior work showed a positive correlation between aridity and Lithium in groundwater used for drinking water supply in the US (Lindsey et al., 2021). The authors explain that Lithium in groundwater originates through mineral dissolution, cation exchange, and evaporation of rainwater. Soluble Lithium containing minerals are more likely to have been depleted by the larger amount of water flow in humid region, while these minerals may persist arid climates. Furthermore, Li+ adsorbed on minerals and clays is readily displaced by other cations, as a result, cation exchange generally liberates Lithium from solids (Appelo, 1994; Decarreau et al., 2012). Details about cation exchange processes are discussed in the next section. Finally, low precipitation and high evaporation rates concentrate Lithium in arid regions through evaporative enrichment (Araoka et al., 2013).
Figure 2.
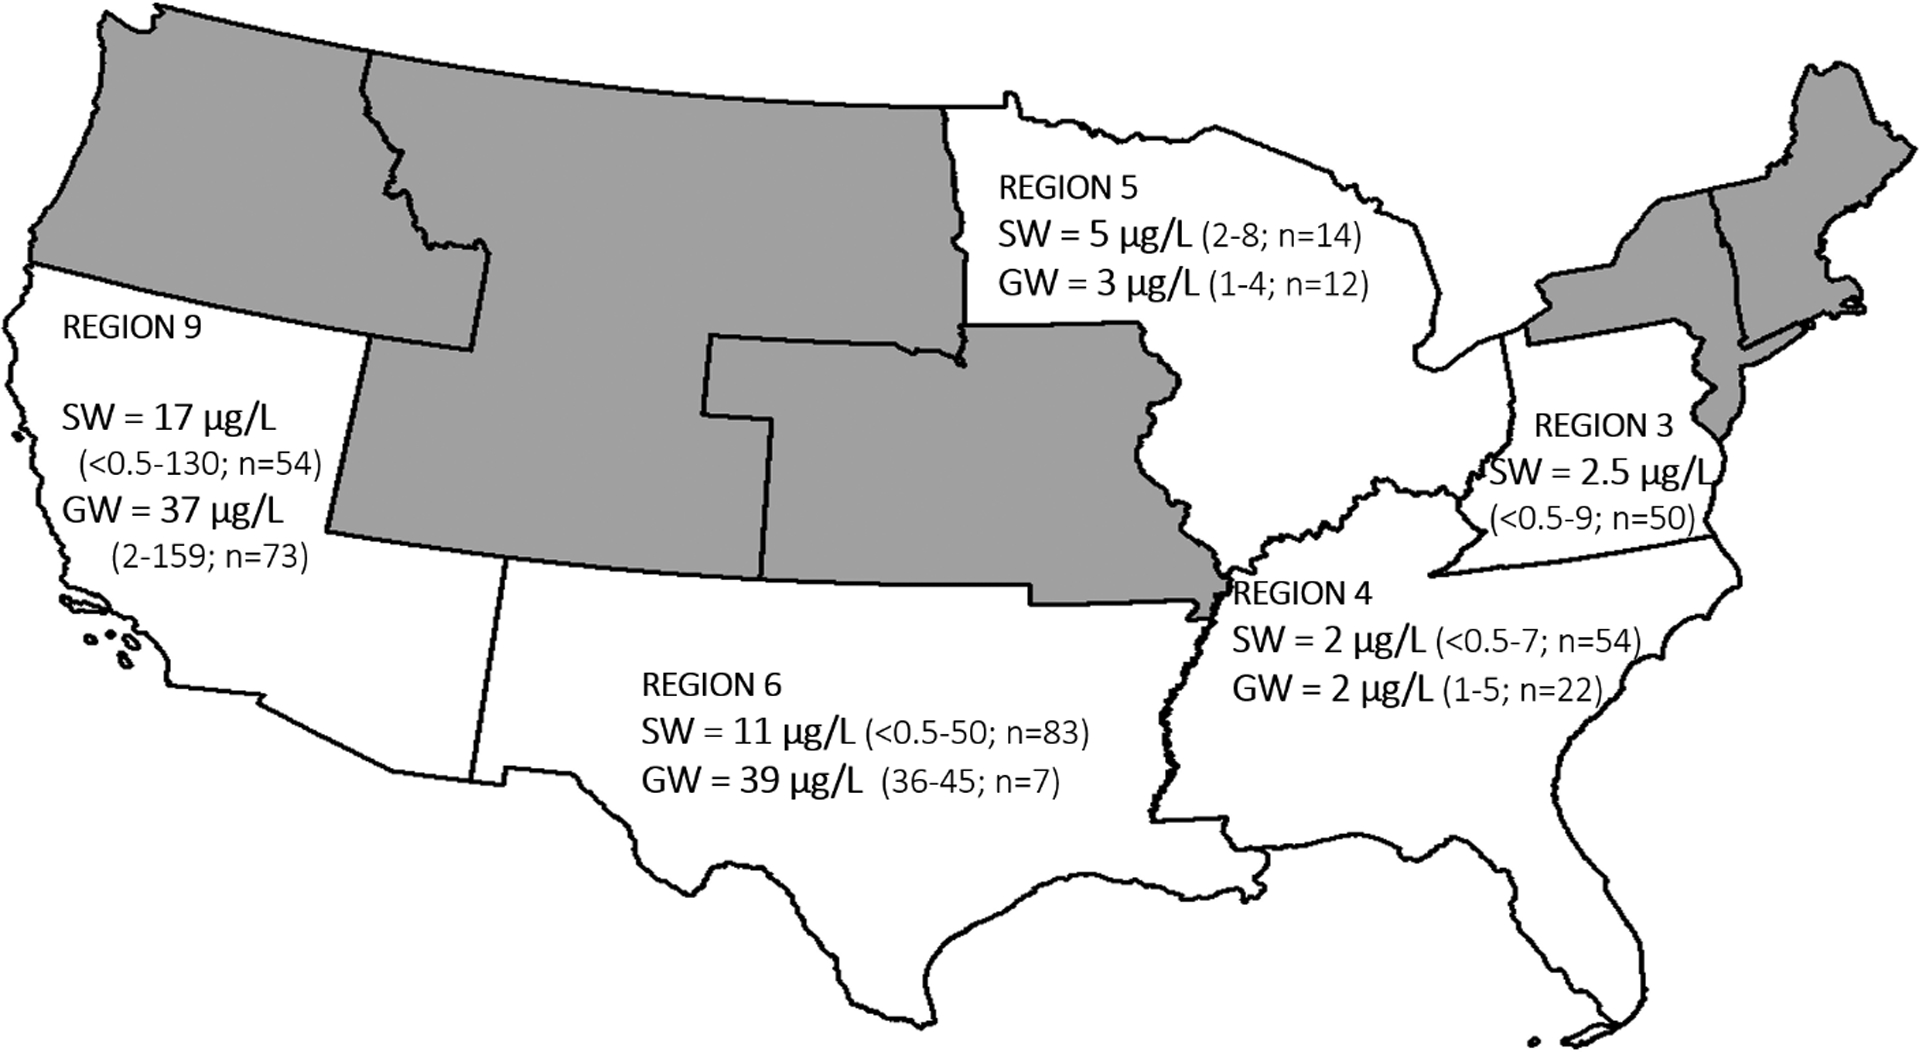
Lithium distribution in the study samples collected from surface water (SW) and groundwater (GW) that used as drinking water sources in DWTPs. Data were shown based upon USEPA region. The numbers denote median Lithium in the region along with concentration range (in μg/L) and number of samples collected (n).
Treated wastewater effluents upstream of drinking water treatment plants can contribute up to 13% (during average flow conditions) to over 80% (during lower streamflow conditions) of treatment plant intake (Nguyen et al., 2018). Limited data is available for Lithium occurrence in wastewater. A prior detailed study on Ankeny WWTP, Iowa noted Lithium concentrations ranging between 10–20 μg/L (Barber et al., 2011; Keefe et al., 2019). Therefore, Lithium in 33 samples collected from WWTP effluents were measured to inform its potential impact on drinking water sources. The results show Lithium ranged from 0.8 to 98.2 μg/L (median = 9.9 μg/L). No significant difference was found in Lithium concentration between weekdays and weekends during the one-month sampling events, indicating consistent Lithium composition in wastewater discharges. Overall, Lithium in WWTP effluents was comparable with that observed in the study samples collected from groundwater (p = 0.07 of z-test); on the other hand, Lithium in WWTP effluents was higher than that in surface water samples collected from DWTPs (p = 0.02 of z-test). The results show that WWTP effluents may contribute some additional Lithium to surface water sources.
3.1.2. Correlations between Lithium and other chemical parameters
Kendall’s rank correlation was used to test correlations between Lithium and common drinking water components (i.e., conductivity, concentrations of co-existing anions and elements). The test results are shown in Fig. 3. Detailed information about correlation coefficients (τ), 95% confidence intervals, and p-values are summarized in Table S3. Strong positive correlations (τ > 0.5) exist between Lithium and conductivity, Cl−, fluoride (F−), sodium (Na), calcium (Ca), magnesium (Mg), boron (B), barium (Ba), strontium (Sr), and molybdenum (Mo) in surface water. In groundwater, strong positive correlations exist between Lithium and Na, potassium (K), and bromide (Br−), which is consistent with the results from PCA analysis reported in a prior work studying Lithium in groundwater in the US (Lindsey et al., 2021). These associations are summarized in Figs. S3 and S4.
Figure 3.
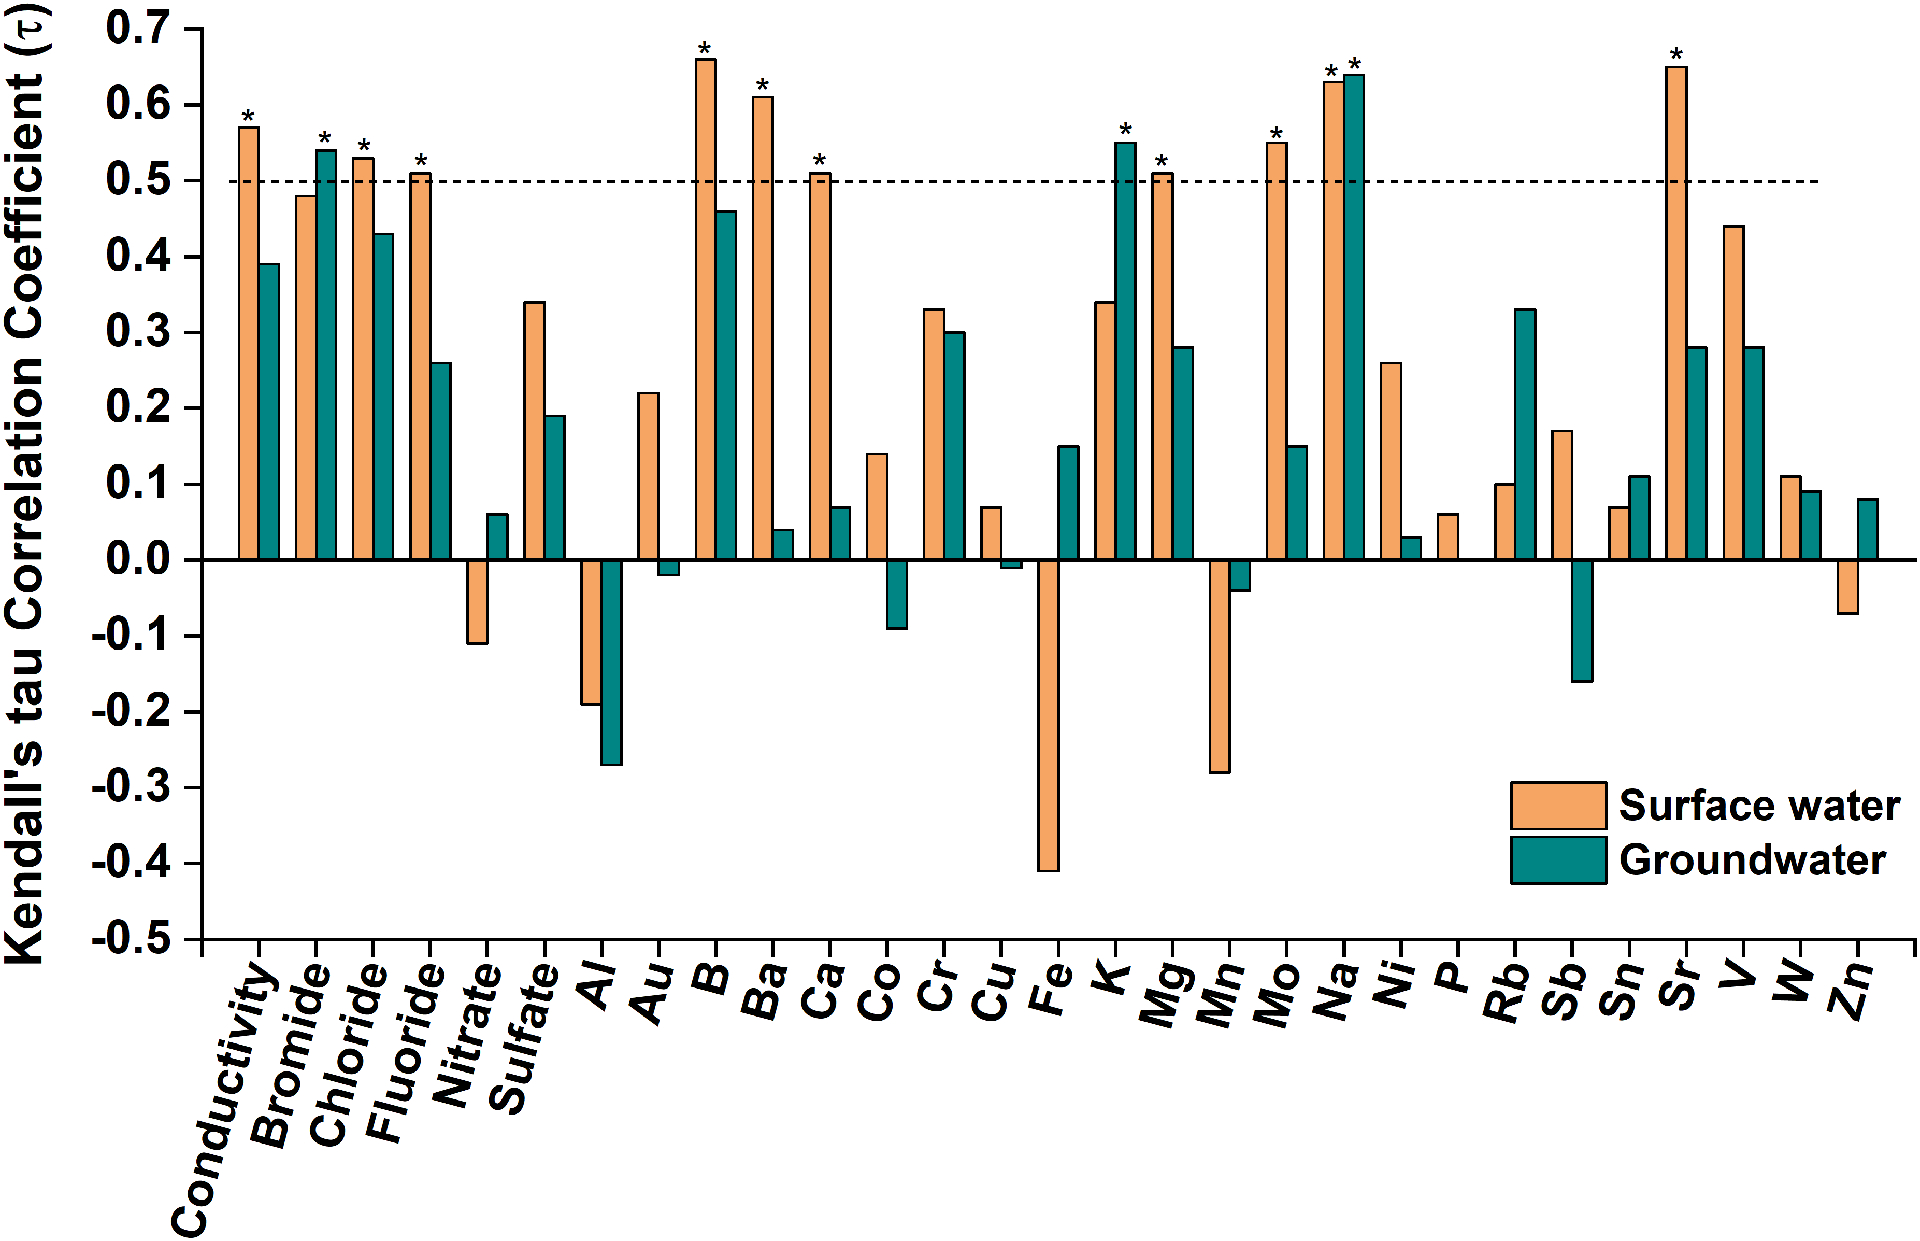
Kendall’s tau rank correlation between Lithium and co-existing elements and anions in the study samples from DWTPs. In this work, |τ | > 0.5 is interpreted as strong correlation as denoted by the symbol “*”. Only the elements with detection frequency > 50% in the water samples were considered.
Na showed strong positive correlations with Lithium in both surface water (τ = 0.63) and groundwater (τ = 0.64). Na commonly coexists with Lithium in major Lithium sources in the nature (Grew, 2020). For example, Lithium brines contain large quantities of NaCl (Bowell et al., 2020; Huang et al., 2021); Na is also a major component in Lithium minerals (e.g., elbaite and Neptunite) (Grew, 2020). More importantly, Na and Lithium behave similarly in natural water. Both alkalithium metals are extremely soluble in water, they tend to stay in solution during weathering of rocks. One study on the leaching of Lithium from lacustrine sediment and evaporite deposit reported that both Lithium and Na were leached from the samples in neutral pH water, in contrast, other elements such as Mg and Fe remained in the solid phase (Araoka et al., 2013). Also, these two elements have similar behavior in cation exchange. Although both Li+ and Na+ are monovalent alkalithium cations, Li+ generally does not substitute for Na+ in minerals because of ionic size differences (Starkey, 1982). Instead, Li+ commonly substitutes for Mg2+ in the structure of various silicates, leading to a negative charge imbalance (e.g., hectorite) (Decarreau et al., 2012). Li+, Na+, and other cations are attracted to the surfaces of such minerals (exchangeable cations) and offset the negative charge. Compared to structural cations, the exchangeable cations are readily displaced to solution, with Li+ and Na+ being the weakest bound. Therefore, cation exchange processes generally remove Ca2+ and Mg2+ from solution, while liberating Na+, K+, and Li+ from solids (Appelo, 1994; Decarreau et al., 2012). The strong correlation between Na and Lithium in the dataset presented herein is consistent with cation exchange as a primary source of those elements (Lindsey et al., 2021).
Lithium in natural water is strongly correlated with Na. Since Na is monitored and reported regularly by public water utilities, we propose that Na can be used as an indicator to predict Lithium in source waters. Regression models were built to correlate Lithium and Na concentrations in the study samples collected from DWTPs. As shown in Fig. 4, Log (Li, μg/L) = 0.74Log (Na, mg/L) + 0.84, R2 = 0.7 in surface water; Log (Li, μg/L) = 0.64Log(Na, mg/L) + 0.87, R2 = 0.7 in groundwater. In addition, mass concentration ratios of Lithium to Na (Li/Na) were calculated and are summarized in Fig. S5. This ratio could be a useful parameter for screening whether there is additional source contribute to elevated Lithium in source waters. Li/Na ratios ranged from 2.3×10⁻⁵ to 8.5×10⁻⁴ with a median of 2.3×10⁻⁴ in surface water; and 5.2×10⁻⁵ to 1.3×10⁻³ with a median of 3.2×10⁻⁴ in groundwater. The median Li/Na ratios in the surveyed source waters were higher than seawater (about 1.4×10⁻⁴) but lower than those reported in processed water from oil & gas production (4.9×10⁻⁴) and geothermal water (5.4×10⁻³) (Blondes et al., 2018). Due to its similar mobility with Na, Lithium is expected to be carried to the sea by rivers and enriched in the oceans the same way as with Na (Bolan et al., 2021; Bradley et al., 2017b; Pogge von Strandmann et al., 2016). However, it is reported that Lithium is removed from seawater by update into clay minerals and accumulated in sea-floor oozes (Bradley et al., 2017b; von Strandmann et al., 2020), leading to its depletion relative to Na in seawater compared to continental waters.
Figure 4.
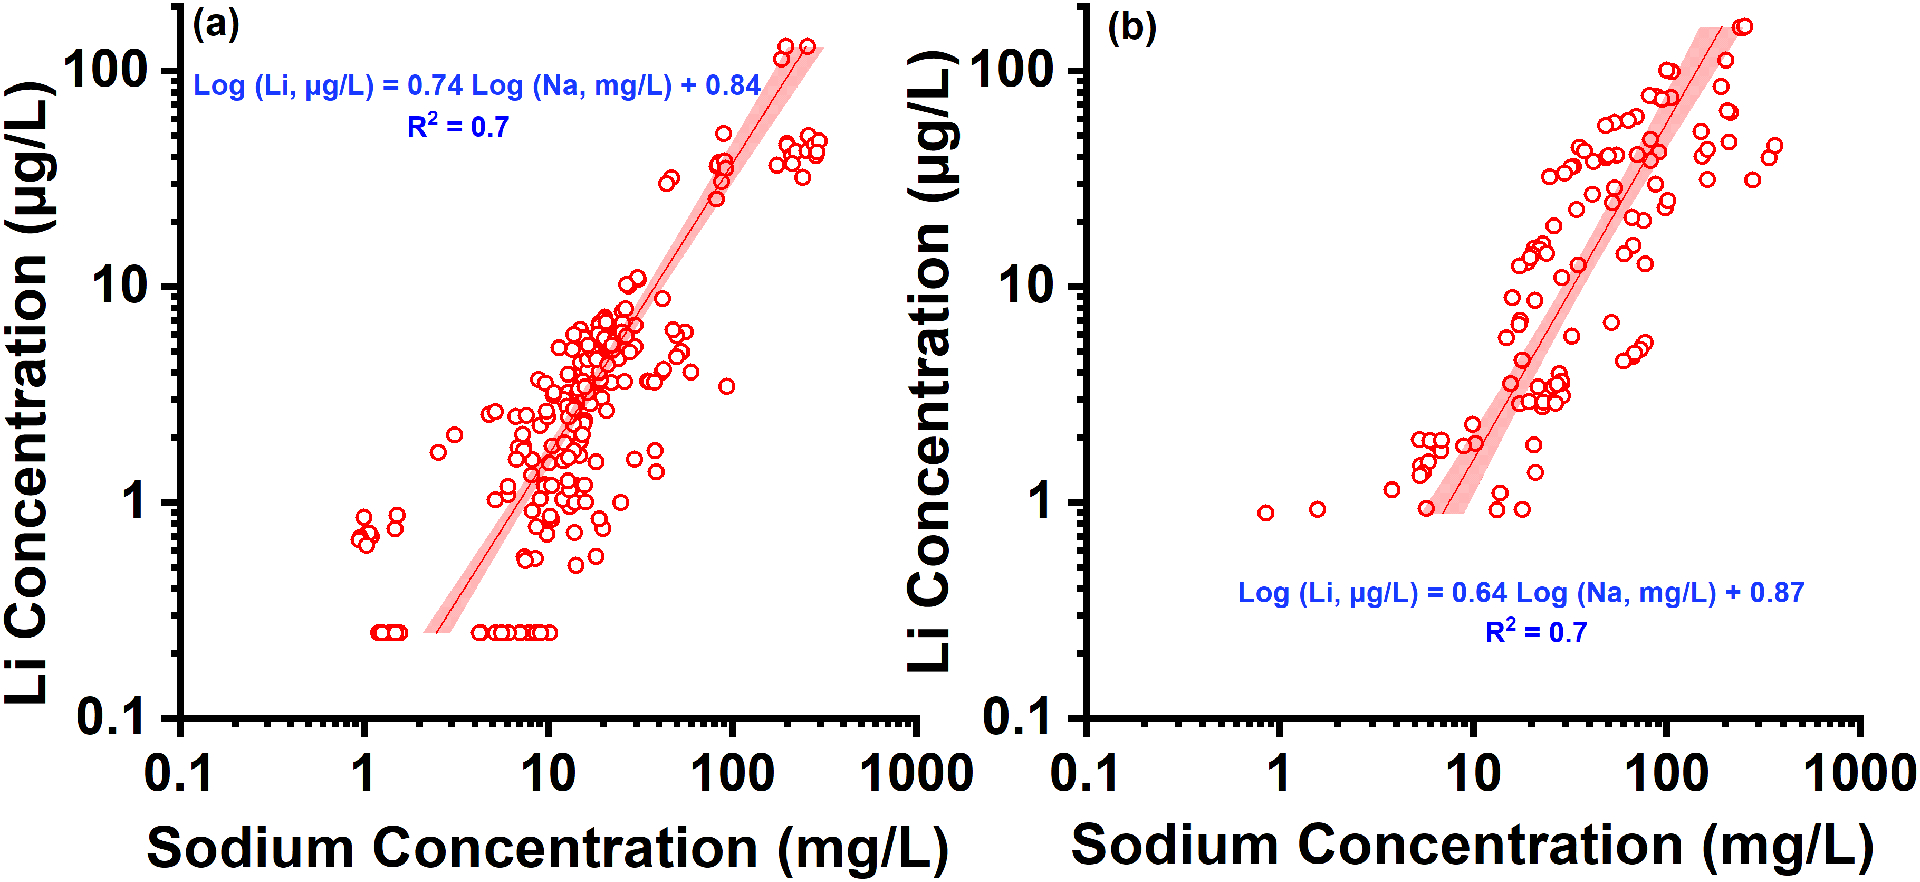
Correlations between Lithium and sodium (Na) in the study samples collected from DWTP source waters: (a) surface water; (b) groundwater. Linear regression of Lithium concentration with Na is applied. The fitted formula and correlation coefficient (R2) are provided in the figure. The highlighted area shows 95% confidence interval of the regressions.
Besides Na, Lithium was also positively correlated with other elements as shown in Table S3 and Figs. S3 and S4. Elements such as B, Br, Ca, Cl, K, Mg, and Sr are commonly found in Lithium brines and geothermal water (Pogge von Strandmann et al., 2016; Tan et al., 2012; Tan et al., 2018). K is also a major component in one most important Lithium mineral lepidolite. No correlations were found between Lithium and potential indicators of anthropogenic sources such as Co, Cu, and Ni that commonly present in Li-based industry leachate (Calvert et al., 2019). Gadolinium (Gd), a tracer of urban wastewater (Verplanck et al., 2005), was below the MDL in all the samples, thus it could not be correlated with Lithium or used to assess potential contributions of WWTP to downstream DWTP sources. Overall, the results indicated Lithium in the source waters was mainly from natural sources, and Lithium increased with water-rock interaction.
3.1.3. Lithium removal during water treatment
Lithium in the source waters sampled from DWTPs ranged from <0.5 μg/L to >100 μg/L (Fig. 1). To assess whether DWTPs removed Li, three paired samples (source and treated waters) were collected from three DWTPs. Table S4 shows only 8% of the Lithium was removed after treatment processes (from 120 to 110 μg/L) in the samples taken from UD-4. For the samples taken from UD-5, Lithium concentrations remained the same (about 47 μg/L) after treatment. The results indicate currently applied drinking water treatment processes at these sampled DWTPs are not effective in removing Li. This agrees with a nationwide study that compared Lithium in source water and treated water from 25 PWSs (Glassmeyer et al., 2017). Because Lithium is conserved across DWTPs, residents in regions with elevated Lithium in the source waters could be exposed chronically to Lithium above the HBSL in their drinking water. Results also suggest that water treatment plant chemicals are unlikely to add any lithium to treated waters.
3.2. Lithium in potentially relevant drinking water sources from publicly available database
The WQP database was used to expand the coverage from the nationwide source water survey. Figs.5a and 5b show the spatial distributions of Lithium for surface water and groundwater using all WQP database values, respectively. Additionally, Figs. 5c and 5d plot a subset of the WQP database where the water quality could potentially be suitable as a drinking water source (i.e., sources with Cl− < 250 mg/L, post 1980; only 27% of the WQP database sources met these criteria). Lithium data in sources potentially-suitable as drinking water was available in 47 states for groundwater sources (Fig. 5d) but only available in 9 states for surface water sources (Fig. 5c). Lithium ranged from <1 μg/L to 2,500 μg/L in surface water sources and up to 290,000 μg/L in groundwater sources (Fig. S1b). And 58% of the potentially relevant drinking water sources exceeded the recommended HBSL. The elevated Lithium concentrations in GW samples in certain states can be attributed to the local Lithium reserves. A USGS study conducted in 1955 (Norton and Schlegel, 1955), reported the presence of 129,000,000 units of Lithium reserves in the form of LiO2 present in the states of North Carolina and South Carolina (in Tin-spodumene belt); South Dakota (Black Hills); Colorado, Arizona, New Mexico, California, and Wyoming (as Pegamatite deposits). Because of the localized nature of such Lithium deposits, the local water sources maybe enriched in Lithium with stark differences across the state boundaries. Although the maximum and 95th percentile concentrations in the WQP database were 3–20 times greater than those in the drinking water sources surveyed in this study, the median concentrations (13 μg/L in both surface water and groundwater) were in the same order of magnitude (3.3 and 0.9 times higher for surface water and groundwater, respectively) compared to the surveyed source waters. Therefore, the WQP database helps add valuable Lithium information where data is sparse. For example, the publicly available databases fill Lithium data gaps in USEPA Regions 8 and 10. Median Lithium in potentially-relevant drinking water sources were 26.8 μg/L in Region 8 and 5 μg/L in Region 10 (range: 1–2,500 μg/L) in surface water; and 43 μg/L in Region 8 and 10 μg/L in Region 10 (range: 1–80,000 μg/L) in groundwater.
Figure 5.
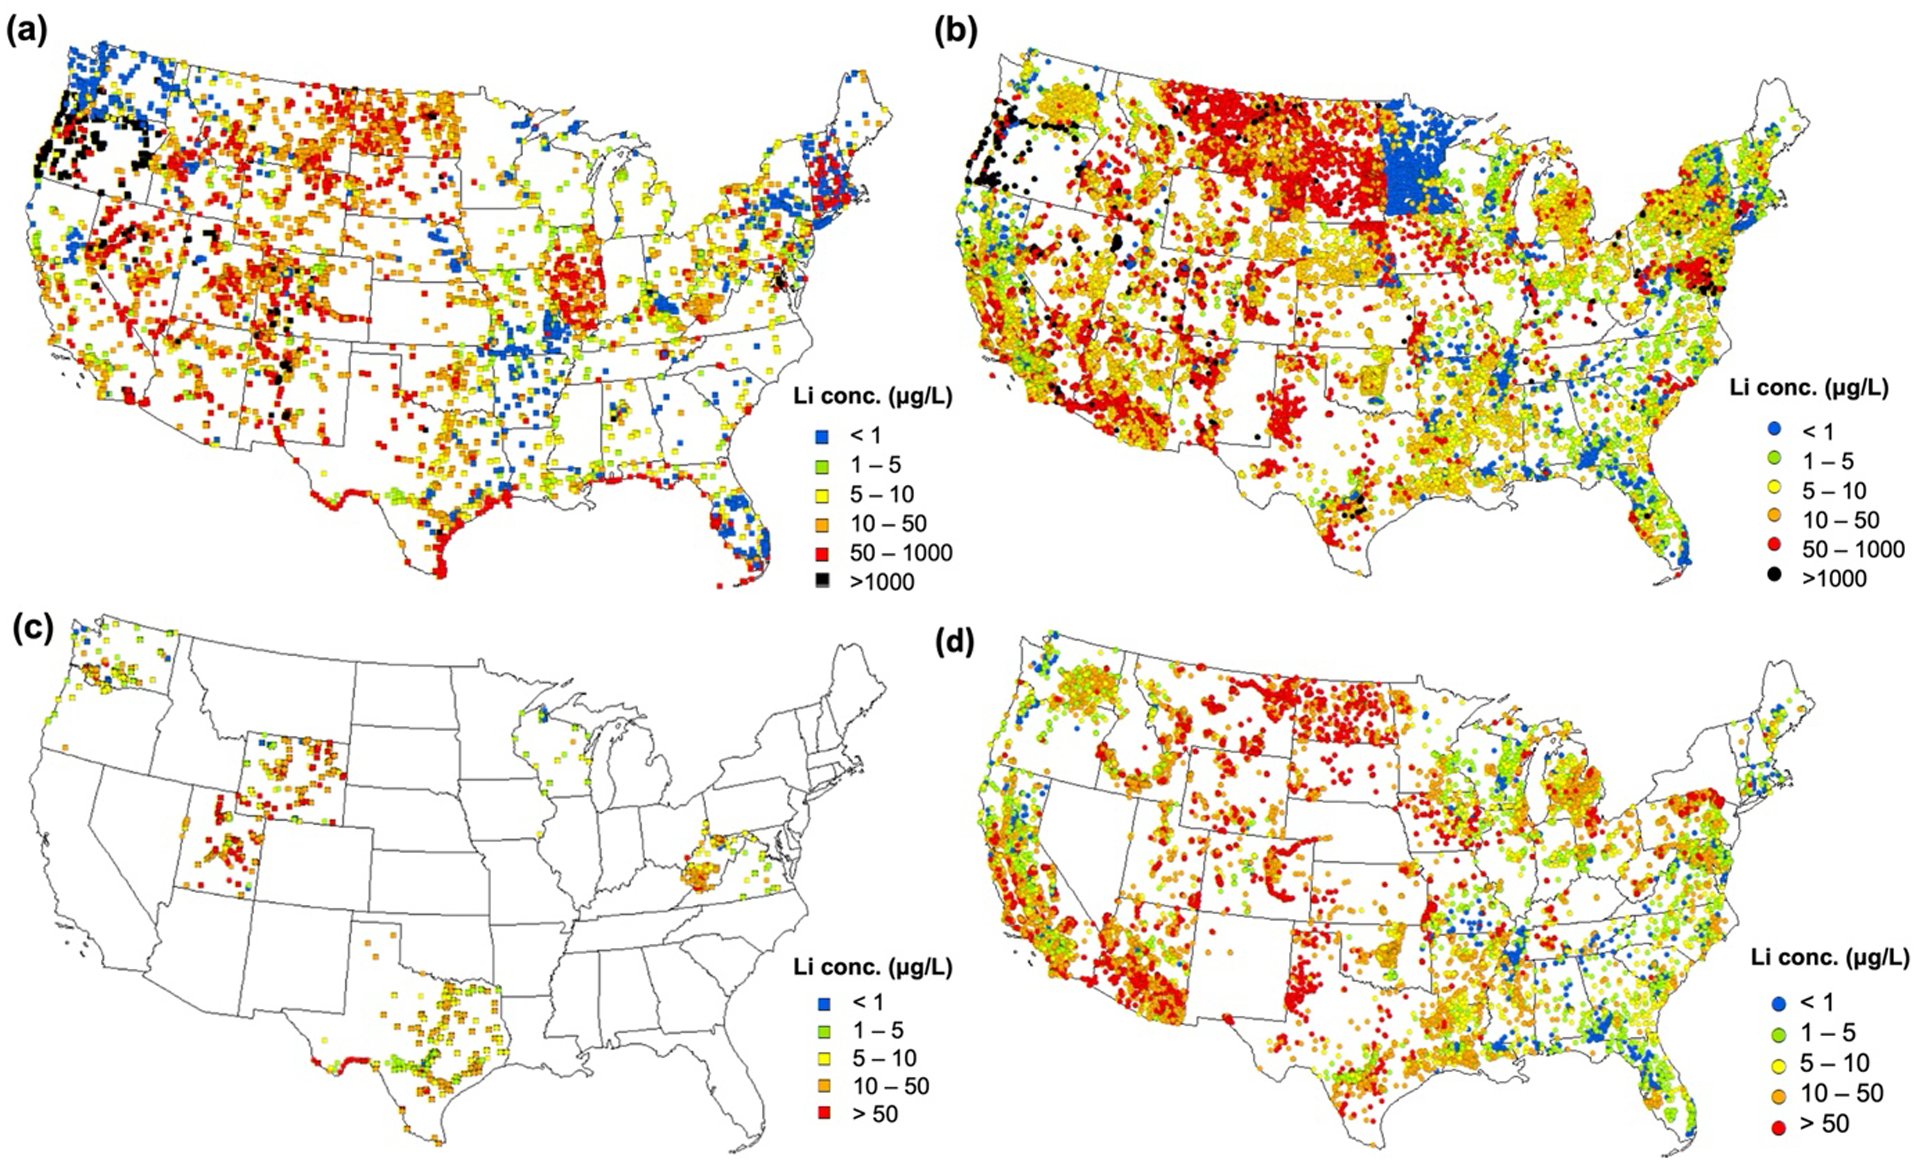
Spatial distribution of Lithium from the entire WQP database: (a) surface water and (b) groundwater. The subset of WQP database that is potentially-suitable as drinking water sources based upon having a chloride (Cl−) concentration below 250 mg/L post 1980: (c) surface water and (d) groundwater. Average Lithium concentration was used for locations with multiple data point.
4. Conclusions
Lithium in 56% of the groundwater and 13% of the surface water samples from the surveyed DWTP source waters were above the HBSL of 10 μg/L, with a few sites had Lithium more than 10 times higher than the HBSL. From the WQP database, approximately 60% of potentially-suitable drinking water sources (i.e., Cl− < 250 mg/L) had Lithium above the HBSL. Lithium is a conservative element in the natural environment, and more importantly, it is not removed by currently used drinking water treatment processes. Although the pharmacological effects of Lithium have been widely studied, limited information is available about the health effects stemming from long-term exposure to trace levels of Li. Our groundwater analysis builds on prior work, and the main contribution herein relates to surface water, which provide roughly 60% of the total drinking water public supply in the US (Dieter et al., 2018). We observed strong positive correlation between Na and Li, indicating that Na can be used to help site selection for Lithium surveys.
Supplementary Material
Acknowledgements
Research reported was partially supported by National Institute of Environmental Health Sciences through the Metals and metal mixtures: Cognitive aging, remediation and exposure sources (MEMCARE) center [P42ES030990]. The content is solely the responsibility of the authors and does not necessarily represent the official views of the National Institutes of Health. The authors acknowledge collaboration from water utilities and partial funding from Water Research Foundation (WRF #4711) and National Science Foundation (EEC-1449500) Nanosystems Engineering Research Center on Nanotechnology-Enabled Water Treatment. Laurel Passantino provided technical editing. The authors declare no conflict of interest.
Footnotes
Supporting Information
Supporting information contains additional methodology details. It also contains Tables S1–S4 and Figures S1–S5.
References
- Appelo CAJ, 1994. CATION AND PROTON-EXCHANGE, PH VARIATIONS, AND CARBONATE REACTIONS IN A FRESHENING AQUIFER. Water Resources Research 30:2793–2805. [Google Scholar]
- Aral H, Vecchio-Sadus A, 2008. Toxicity of lithium to humans and the environment--a literature review. Ecotoxicol Environ Saf 70:349–356. [DOI] [PubMed] [Google Scholar]
- Aral H, Vecchio-Sadus A, 2011. Lithium: Environmental Pollution and Health Effects, in: Nriagu O (Ed.), Encyclopedia of Environmental Health. Elsevier: Burlington, pp. 499–508. [Google Scholar]
- Araoka D, Kawahata H, Takagi T, Watanabe Y, Nishimura K, Nishio Y, 2013. Lithium and strontium isotopic systematics in playas in Nevada, USA: constraints on the origin of lithium. Mineralium Deposita 49:371–379. [Google Scholar]
- Barber LB, Antweiler RC, Flynn JL, Keefe SH, Kolpin DW, Roth DA, Schnoebelen DJ, Taylor HE, Verplanck PL, 2011. Lagrangian mass-flow investigations of inorganic contaminants in wastewater-impacted streams. Environ Sci Technol 45:2575–2583. [DOI] [PubMed] [Google Scholar]
- Barber LB, Murphy SF, Verplanck PL, Sandstrom MW, Taylor HE, Furlong ET, 2006. Chemical loading into surface water along a hydrological, biogeochemical, and land use gradient: A holistic watershed approach. Environmental Science & Technology 40:475–486. [DOI] [PubMed] [Google Scholar]
- Barjasteh-Askari F, Davoudi M, Amini H, Ghorbani M, Yaseri M, Yunesian M, Mahvi AH, Lester D, 2020. Relationship between suicide mortality and lithium in drinking water: A systematic review and meta-analysis. J Affect Disord 264:234–241. [DOI] [PubMed] [Google Scholar]
- Blondes MS, Gans KD, Engle MA, Kharaka YK, Reidy ME, Saraswathula V, Thordsen JJ, Rowan EL, Morrissey EA, 2018. U.S. Geological Survey National Produced Waters Geochemical Database (ver. 2.3, January 2018): U.S. Geological Survey data release, 10.5066/F7J964W8. [DOI] [Google Scholar]
- Bolan N, Hoang SA, Tanveer M, Wang L, Bolan S, Sooriyakumar P, Robinson B, Wijesekara H, Wijesooriya M, Keerthanan S, Vithanage M, Markert B, Franzle S, Wunschmann S, Sarkar B, Vinu A, Kirkham MB, Siddique KHM, Rinklebe J, 2021. From mine to mind and mobiles - Lithium contamination and its risk management. Environ Pollut 290:118067. [DOI] [PubMed] [Google Scholar]
- Bowell RJ, Lagos L, de los Hoyos CR, Declercq J, 2020. Classification and Characteristics of Natural Lithium Resources. Elements 16:259–264. [Google Scholar]
- Bradley DC, McCauley AD, Stillings LM, 2017a. Mineral-deposit model for lithium-cesium-tantalum pegmatites: U.S. Geological Survey Scientific Investigations Report 2010–5070–O, 48 p., 10.3133/sir20105070O. [DOI] [Google Scholar]
- Bradley DC, Stillings LL, Jaskula BW, Munk LeeAnn, and McCauley AD, 2017b, Lithium, Critical mineral resources of the United States—Economic and environmental geology and prospects for future supply: U.S. Geological Survey Professional Paper 1802, p. K1–K21, 10.3133/pp1802K. [DOI] [Google Scholar]
- Broberg K, Concha G, Engstrom K, Lindvall M, Grander M, Vahter M, 2011. Lithium in drinking water and thyroid function. Environ Health Perspect 119:827–830. [DOI] [PMC free article] [PubMed] [Google Scholar]
- Calvert G, Kaksonen A, Cheng K, Van Yken J, Chang B, Boxall N, 2019. Recovery of Metals from Waste Lithium Ion Battery Leachates Using Biogenic Hydrogen Sulfide. Minerals 9. [Google Scholar]
- Choi HB, Ryu JS, Shin WJ, Vigier N, 2019. The impact of anthropogenic inputs on lithium content in river and tap water. Nat Commun 10:5371. [DOI] [PMC free article] [PubMed] [Google Scholar]
- Cipriani A, Hawton K, Stockton S, Geddes JR, 2013. Lithium in the prevention of suicide in mood disorders: updated systematic review and meta-analysis. BMJ 346:f3646. [DOI] [PubMed] [Google Scholar]
- Decarreau A, Vigier N, Pálková H, Petit S, Vieillard P, Fontaine C, 2012. Partitioning of lithium between smectite and solution: An experimental approach. Geochimica et Cosmochimica Acta 85:314–325. [Google Scholar]
- Dierberg FE, DeBusk TA, 2005. An evaluation of two tracers in surface-flow wetlands: rhodamine-wt and lithium. Wetlands 25:8–25. [Google Scholar]
- Dieter CA, Maupin MA, Caldwell RR, Harris MA, Ivahnenko TI, Lovelace JK, Barber NL, Linsey KS, 2018. Estimated use of water in the United States in 2015, Circular, Reston, VA, p. 76. [Google Scholar]
- Glassmeyer ST, Furlong ET, Kolpin DW, Batt AL, Benson R, Boone JS, Conerly O, Donohue MJ, King DN, Kostich MS, Mash HE, Pfaller SL, Schenck KM, Simmons JE, Varughese EA, Vesper SJ, Villegas EN, Wilson VS, 2017. Nationwide reconnaissance of contaminants of emerging concern in source and treated drinking waters of the United States. Sci Total Environ 581–582:909–922. [DOI] [PMC free article] [PubMed] [Google Scholar]
- Greim P, Solomon AA, Breyer C, 2020. Assessment of lithium criticality in the global energy transition and addressing policy gaps in transportation. Nature Communications 11:4570. [DOI] [PMC free article] [PubMed] [Google Scholar]
- Grew ES, 2020. The Minerals of Lithium. Elements 16:235–240. [Google Scholar]
- Houk RS, Fassel VA, Flesch GD, Svec HJ, Gray AL, Taylor CE, 1980. INDUCTIVELY COUPLED ARGON PLASMA AS AN ION-SOURCE FOR MASS-SPECTROMETRIC DETERMINATION OF TRACE-ELEMENTS. Analytical Chemistry 52:2283–2289. [Google Scholar]
- Huang T-Y, Pérez-Cardona JR, Zhao F, Sutherland JW, Paranthaman MP, 2021. Life Cycle Assessment and Techno-Economic Assessment of Lithium Recovery from Geothermal Brine. ACS Sustainable Chemistry & Engineering 9:6551–6560. [Google Scholar]
- Ishii N, Terao T, 2018. Trace lithium and mental health. J Neural Transm (Vienna) 125:223–227. [DOI] [PubMed] [Google Scholar]
- Jahns X, 1952, Pegmatite deposits of the White Picacho District, Maricopa and Yavapai Counties, Arizona. University of Arizona Bulletin, Arizona Bureau of Mines, Bulletin 162, 105 p. [Google Scholar]
- Keefe SH, Barber LB, Hubbard LE, Bradley PM, Roth DA, Kolpin DW, 2019. Behavior of major and trace elements in a transient surface water/groundwater system following removal of a long-term wastewater treatment facility source. Sci Total Environ 668:867–880. [DOI] [PubMed] [Google Scholar]
- Kessing LV, Gerds TA, Knudsen NN, Jorgensen LF, Kristiansen SM, Voutchkova D, Ernstsen V, Schullehner J, Hansen B, Andersen PK, Ersboll AK, 2017. Association of Lithium in Drinking Water With the Incidence of Dementia. JAMA Psychiatry 74:1005–1010. [DOI] [PMC free article] [PubMed] [Google Scholar]
- Lindsey BD, Belitz K, Cravotta CA 3rd, Toccalino PL, Dubrovsky NM, 2021. Lithium in groundwater used for drinking-water supply in the United States. Sci Total Environ 767:144691. [DOI] [PubMed] [Google Scholar]
- Nguyen T, Westerhoff P, Furlong ET, Kolpin DW, Batt AL, Mash HE, Schenck KM, Boone JS, Rice J, Glassmeyer ST, 2018. Modeled De Facto Reuse and Contaminants of Emerging Concern in Drinking Water Source Waters. Journal AWWA 110:E2–E18. [DOI] [PMC free article] [PubMed] [Google Scholar]
- Norman JE, Toccalino PL, Morman SA, 2018. Health-Based Screening Levels for evaluating water-quality data (2d ed.). U.S. Geological Survey web page, accessible at https://water.usgs.gov/water-resources/hbsl/, doi:10.5066/F71C1TWP. [DOI] [PubMed] [Google Scholar]
- Norton JJ, Schlegel DM, 1955. Lithium resources of North America, Bulletin, - ed.
- Pogge von Strandmann PAE, Burton KW, Opfergelt S, Eiríksdóttir ES, Murphy MJ, Einarsson A, Gislason SR, 2016. The effect of hydrothermal spring weathering processes and primary productivity on lithium isotopes: Lake Myvatn, Iceland. Chemical Geology 445:4–13. [Google Scholar]
- Pogge von Strandmann PAE, Kasemann SA, Wimpenny JB, 2020. Lithium and Lithium Isotopes in Earth’s Surface Cycles. Elements 16:253–258. [Google Scholar]
- Sharma N, Karanfil T, Westerhoff P, 2019. Historical and Future Needs for Geospatial Iodide Occurrence in Surface and Groundwaters of the United States of America. Environmental Science & Technology Letters 6:379–388. [Google Scholar]
- Starkey HC, 1982. The role of clays in fixing lithium, in: USGS (Ed.). [Google Scholar]
- Tan H, Chen J, Rao W, Zhang W, Zhou H, 2012. Geothermal constraints on enrichment of boron and lithium in salt lakes: An example from a river-salt lake system on the northern slope of the eastern Kunlun Mountains, China. Journal of Asian Earth Sciences 51:21–29. [Google Scholar]
- Tan H, Su J, Xu P, Dong T, Elenga HI, 2018. Enrichment mechanism of Li, B and K in the geothermal water and associated deposits from the Kawu area of the Tibetan plateau: Constraints from geochemical experimental data. Applied Geochemistry 93:60–68. [Google Scholar]
- USEPA, 2009. Summary of National Inorganics and Radionuclides Survey (NIRS) Data for CCL 3 Chemical Occurrence Analysis. Docket ID EPA–HQ–OW–2007–1189. Available on the internet at http://www.regulations.gov.
- USEPA, 2021a. Revisions to the Unregulated Contaminant Monitoring Rule (UCMR 5) for Public Water Systems and Announcement of Public Meetings. Available on the internet at https://www.govinfo.gov/content/pkg/FR-2021-12-27/pdf/2021-27858.pdf
- USEPA, 2021b. Drinking Water Contaminant Candidate List 5—Draft. Available on the internet at https://www.federalregister.gov/documents/2021/07/19/2021-15121/drinking-water-contaminant-candidate-list-5-draft.
- USGS, 2021. U.S. Geological Survey, 2021, Mineral commodity summaries 2021: U.S. Geological Survey, 200 p., 10.3133/mcs2021. [DOI] [Google Scholar]
- Verplanck PL, Taylor HE, Nordstrom DK, Barber LB, 2005. Aqueous stability of gadolinium in surface waters receiving sewage treatment plant effluent, Boulder Creek, Colorado. Environmental Science & Technology 39:6923–6929. [DOI] [PubMed] [Google Scholar]
- Xu C, Dai Q, Gaines L, Hu M, Tukker A, Steubing B, 2020. Future material demand for automotive lithium-based batteries. Communications Materials 1:99. [Google Scholar]
Associated Data
This section collects any data citations, data availability statements, or supplementary materials included in this article.