

Abstract
Interactions between plants and neighboring microbial species are fundamental elements that collectively determine the structure and function of the plant microbiota. However, the molecular basis of such interactions is poorly characterized. Here, we colonize Arabidopsis leaves with nine plant‐associated bacteria from all major phyla of the plant microbiota and profile cotranscriptomes of plants and bacteria six hours after inoculation. We detect both common and distinct cotranscriptome signatures among plant–commensal pairs. In planta responses of commensals are similar to those of a disarmed pathogen characterized by the suppression of genes involved in general metabolism in contrast to a virulent pathogen. We identify genes that are enriched in the genome of plant‐associated bacteria and induced in planta, which may be instrumental for bacterial adaptation to the host environment and niche separation. This study provides insights into how plants discriminate among bacterial strains and lays the foundation for in‐depth mechanistic dissection of plant–microbiota interactions.
Keywords: Arabidopsis, bacterial adaptation, commensal, cotranscriptome, plant microbiota
Subject Categories: Chromatin, Transcription & Genomics; Microbiology, Virology & Host Pathogen Interaction; Plant Biology
The molecular basis of interactions between plants and commensal microbial species is poorly characterized. This study reveals common and distinct cotranscriptome signatures among plant–commensal bacteria pairs.

Introduction
In nature, plants assemble bacterial communities with well‐defined taxonomic structures (the plant microbiota) (Hacquard et al, 2015), which can be harnessed for plant health and survival (Durán et al, 2018; Kwak et al, 2018; Carrión et al, 2019). How plants discriminate among various bacterial strains and establish strain‐specific associations in a community context remains an open question in basic plant microbiota research and is key to facilitating the application of microbiota‐based strategies to improve plant health in agricultural settings. Answering this question requires a comprehensive and unified understanding of plant and bacterial responses during their interactions.
The plant innate immune system contributes to the assembly and maintenance of healthy bacterial communities (Lebeis et al, 2015; Chen et al, 2020). A crucial part of the plant immune system is the perception of environmental microbes using cell surface receptors that detect conserved microbial epitopes, termed microbe‐associated molecular patterns (MAMPs) (Boller & Felix, 2009). Recognition of MAMPs triggers defense responses collectively called pattern‐triggered immunity (PTI), which can inhibit pathogen growth (Jones & Dangl, 2006). MAMPs such as the bacterial flagellin peptide flg22 are widely conserved in nonpathogenic bacteria and pathogenic bacteria (Hacquard et al, 2017), and some nonpathogenic Proteobacteria strains were shown to trigger defense responses in plant leaves likely via PTI pathways (Vogel et al, 2016). On the contrary, diverse microbiota members can suppress PTI triggered by flg22 in roots (Garrido‐Oter et al, 2018; Yu et al, 2019; Teixeira et al, 2021), which can facilitate colonization by the root microbiota (Yu et al, 2019; Teixeira et al, 2021). Thus, PTI activation by divergent MAMPs and subsequent PTI modulation by plant‐associated bacteria might steer plant responses in a bacterial strain‐specific manner, contributing to microbiota assembly in plants. A recent study identified, in the aboveground part of plants, a core set of genes induced by phylogenetically diverse endogenous bacteria; some of these genes contribute to plant defense against pathogens (Maier et al, 2021). Therefore, studying common and specific plant responses to diverse bacteria is crucial to understand the role of the plant immune system in the face of both pathogenic and nonpathogenic microbes.
When colonized densely and heterogeneously by various bacterial species, plants might not be able to tailor their responses to individual bacterial strains. Yet, it might be possible that the same microenvironments created by plants differently affect different plant‐associated bacterial species. If so, analyzing plant responses alone does not wholly explain bacterial responses during interactions with hosts. The explanation requires directly interrogating bacterial responses in planta at the genome‐wide scale. In planta bacterial omics approaches, such as transcriptomics, are powerful in understanding bacterial gene functions in the plant microbiome and how plants influence bacterial activities (Levy et al, 2018). To date, however, there are only a few available in planta bacterial transcriptome studies, which focus on pathogenic Proteobacteria strains (Yu et al, 2013, 2014; Chapelle et al, 2015; Lovelace et al, 2018; Nobori et al, 2018, 2020; Velásquez et al, 2022). It is, therefore, unknown whether plant‐associated bacteria have any common or phylum‐specific gene expression signatures and what kind of functions are important for their nonpathogenic and sometimes beneficial traits in plants. Integrated analysis of plant and bacterial transcriptome responses is key for building hypotheses about the molecular dialog between plants and microbiota members.
Here, we coprofiled the transcriptomes of the model plant Arabidopsis thaliana and various bacterial strains isolated from healthy (asymptomatic) plants in nature (hereafter commensal strains), representing all major phyla of the plant microbiota residing in leaves. Commensal strains commonly induced PTI responses in plants, but these differed in intensity. We found examples of both common and strain‐specific regulation of commensal gene expression in plants. Bacterial genes enriched in plant‐associated strains tended to be induced in planta. These included genes involved in sulfur, nitrogen, and carbon transport and metabolism, which were induced in planta in a strain‐specific manner. This suggests that nutrient status differs for different strains in plants, which may affect bacterial fitness and niche separation. We also observed that plants could elicit different transcriptional responses from different bacterial strains without tailoring their own transcriptional reprogramming. This study provides a framework for dissecting plant–microbiota interactions at the strain level using cotranscriptomics and unravels diverse modes of interactions between plants and commensal bacteria.
Results
Cotranscriptome analysis of plants and plant microbiota members
We developed a pipeline to simultaneously investigate host and microbial transcriptomes during plant colonization with a single bacterial strain. We colonized A. thaliana wild‐type Col‐0 leaves with individual commensal strains and profiled transcriptomes of plants and bacteria by RNA‐seq (Fig 1A). For in planta bacterial RNA‐seq, we used a previously developed method with some modifications (Materials and Methods). Briefly, bacterial cells are isolated from plant leaves before extracting RNA, followed by rRNA depletion and RNA‐seq (Nobori et al, 2018). For plant and bacterial RNA‐seq, respectively, 18 and nine commensal strains covering all major phyla of the plant microbiota were selected (Fig 1B and Table EV1). Three biological replicates from independent experiments were taken for each condition. We used the same strain IDs as in the original study where these bacterial strains were isolated from wild A. thaliana plants (leaves and roots) or soil (Bai et al, 2015). A strain ID indicates the original compartment from which the strain was isolated, but many root/soil isolates can also colonize the shoot, indicating extensive niche overlap (Bai et al, 2015).
Figure 1. Cotranscriptomics of plants and bacteria.
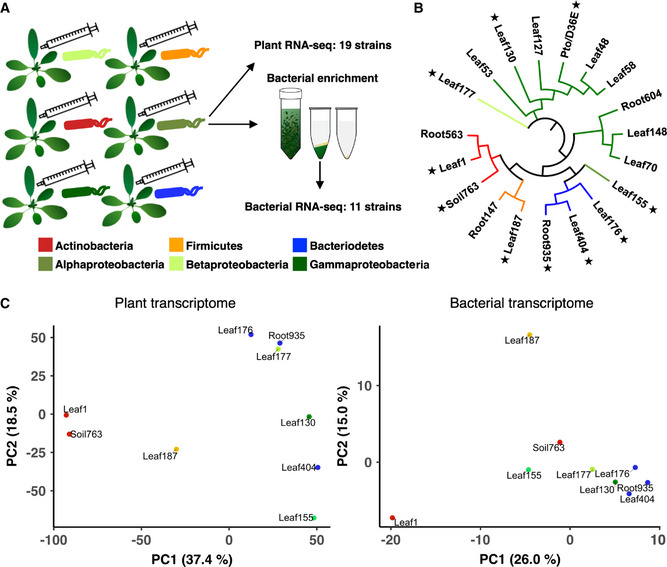
- Experimental scheme. Individual bacterial strains were syringe‐infiltrated into leaves of A. thaliana at OD600 of 0.5. Leaves were sampled at 6‐h postinoculation. Total RNA was extracted for plant RNA‐seq. For bacterial RNA‐seq, bacterial cells were isolated from plant leaves before extracting RNA using a method previously reported (Nobori et al, 2018).
- Bacterial strains used in this study. Stars indicate the strains used for cotranscriptome analysis. Detailed taxonomic information is shown in Table EV1.
- Principal component analysis of gene expression fold changes (FCs) of plants (left: bacteria‐inoculated vs. water‐inoculated) and bacteria (right: in planta vs. in vitro). For each condition, mean values of three independent replicates were taken. Orthologous groups (OGs) of bacterial genes shared among all strains are used for the analysis. The taxonomic affiliation (phylum/class level) of each strain is indicated with different colors.
For cotranscriptome analysis, we used nine commensal strains, the virulent pathogen Pseudomonas syringae pv. tomato DC3000 (Pto), and its avirulent mutant D36E (36 type III effectors are depleted) (Fig 1B). These strains could colonize in the leaf endosphere to various degrees three days after inoculation when inoculated on the leaf surface (Appendix Fig S1). To avoid different bacterial population densities to influence plant and bacterial transcriptomes, we syringe‐infiltrated bacteria at a defined dose and harvested samples at 6‐h postinoculation (hpi) where the population density of fast‐growing Pto remained unchanged (Nobori et al, 2018).
For plants, we compared gene expression changes between bacteria‐inoculated plants and water‐inoculated plants (Fig 1C; Appendix Fig S2B, left). For bacteria, we compared expression changes between in planta and in vitro (rich media) conditions (Fig 1C; Appendix Fig S2A and B, right). To directly compare bacterial gene expression patterns among phylogenetically diverse bacterial strains, genes of different strains were grouped based on sequence homology, resulting in 6,823 orthologous groups (OGs) (Appendix Fig S2E). Of these OGs, 454 OGs were shared among all strains (see Dataset EV1), indicating that the commensal strains used in this study possess highly diverse gene sets.
Principal component analysis revealed marked differences in both microbial and host transcriptional outputs between plant‐commensal pairs, indicating strain‐specific interactions between plants and bacteria (Fig 1C). Interestingly, patterns of transcriptional variation of plants and bacteria were incongruent (Fig 1C). For instance, we observed similarity between the plant transcriptome changes elicited by different Actinobacteria strains (Leaf1 and Soil763), but these Actinobacteria strains responded highly differently in planta (Fig 1C). Also, Bacteroidetes strains (Leaf176, Leaf404, and Root935) showed similar bacterial transcriptional changes in plants, but plant transcriptome changes triggered by these strains were distinct (Fig 1C). These results indicate that plant responses do not fully predict commensal responses and vice versa, pointing to the necessity of cotranscriptome analysis to understand their interactions.
Next, we included pathogens (Pto and D36E) in our analysis. The virulent pathogen Pto triggered a highly different plant transcriptome response compared with commensals and the disarmed pathogen D36E (Appendix Fig S2C). In planta responses of D36E were similar to those of commensals and distinct from the virulent Pto (Pto in planta resembled commensals in vitro) (Appendix Fig S2D). Taken together, cotranscriptome data captured differences in bacterial lifestyles (i.e., virulent vs nonvirulent) and revealed commonalities between commensals and a disarmed pathogen.
Conserved and strain‐specific regulation of commensal functions in planta
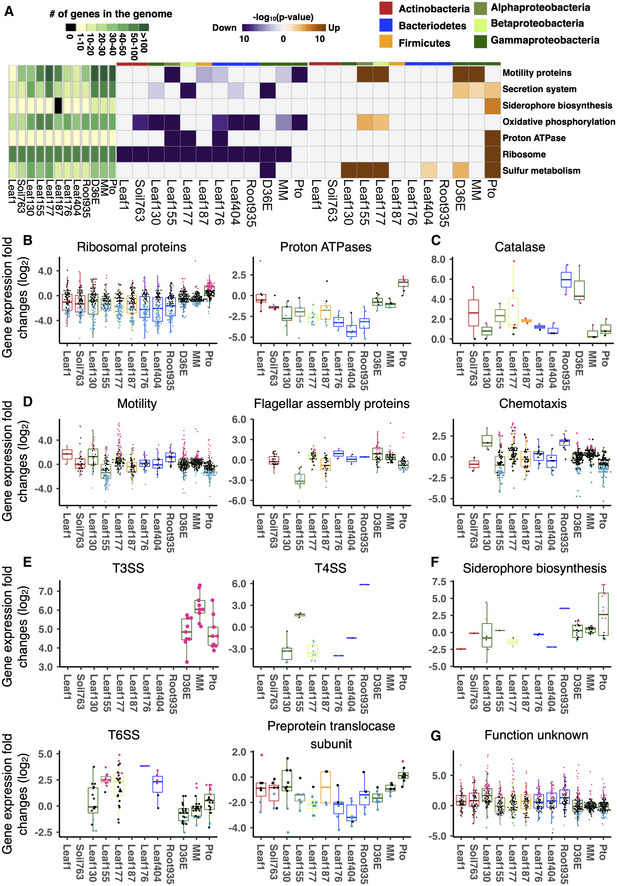
We sought to further analyze bacterial transcriptome data to understand different modes of interactions between different commensal strains and plants. However, the high variability in bacterial genomes complicates a gene‐level comparison of bacterial responses among phylogenetically diverse strains (Appendix Fig S2E). One way to overcome this problem is to compare the regulation of bacterial functions rather than of individual genes. Thus, for each strain, we performed functional enrichment analysis on genes significantly up‐ or downregulated in planta compared with in vitro using KEGG functional categories assigned to individual OGs (Materials and Methods). Then, enrichment scores (P‐values) for individual KEGG functional categories were summarized for all the strains (Fig 2A and Appendix Fig S3A–C). We used gene expression fold changes in most analyses to avoid baseline transcriptome differences among strains to confound our analysis (see Discussion for details). Data from Pto grown in a minimal medium were included to determine the effect of nutrient availability on gene expression changes. A clear pattern distinguishing virulent and avirulent strains was seen in the process “ribosome” (Fig 2A and B). Genes encoding ribosomal subunits were significantly suppressed in planta in all the commensal strains tested and the avirulent pathogen D36E, while these genes were induced in the virulent pathogen Pto (Fig 2A and B). The contrasting pattern between commensals and Pto supports that suppression of these genes in commensals is not merely an artifact caused by the transition from the rich media to the plant apoplast. Since the population density of Pto remains unchanged at this time point (Nobori et al, 2018), suppression of ribosome‐related genes is not the consequence of bacterial growth in planta, while these changes could influence on bacterial growth at later time points. Similar to ribosomal protein‐encoded genes, genes encoding proton ATPases, which are involved in energy production (and possibly alteration of extracellular pH), were induced in Pto in planta, but suppressed or not altered in the commensal strains and D36E (Fig 2A and B). Together, these results suggest that commensal strains and the disarmed pathogen D36E are metabolically less active in planta at an early stage of interactions compared with a virulent pathogen. Since D36E is a mutant of Pto lacking PTI‐suppressing effector molecules, PTI is likely responsible for suppressing bacterial metabolism in planta, and only pathogens can overcome PTI to be metabolically active at six hours after infection. Catalase genes were commonly induced in most commensals and D36E at varying degrees but not in Pto (Fig 2C), suggesting that commensals are responding to plant ROS burst, a characteristic PTI response.
Figure 2. Conserved and strain‐specific regulation of bacterial functions in plants.
-
AKEGG orthology terms enriched in genes that are significantly up‐ (orange) or down (purple)‐regulated in planta compared with in vitro (rich media). The heatmaps indicate −log10 P‐value (FDR corrected by Benjamini–Hochberg method). A KEGG orthology can be both significantly up‐ and downregulated in the same strain. The left green panel shows the number of genes involved in each KEGG orthology term. The top color bars indicate the taxonomic affiliation (phylum/class level) of each strain. See Appendix Fig S3A for a more comprehensive list of KEGG orthology.
-
B–GExpression fold changes (in planta vs. in vitro) of genes associated with KEGG orthology terms related to (B) general metabolism, (C) catalase metabolic pathway, (D) motility, (E) secretion systems, (F) siderophore biosynthesis, and (G) unknown functions. T3SS, type III secretion system. T4SS, type IV secretion system. T6SS, type VI secretion system. MM, Pto grown in a minimal medium. Results are shown as box plots with boxes displaying the 25th–75th percentiles, the centerline indicating the median, whiskers extending to the minimum, and maximum values no further than 1.5 interquartile range. All individual data points (genes) are overlaid with colors for DEGs (red: upregulated, blue: downregulated, black: non‐DEG).
Data information: (B–G) For each condition, mean values of three biological replicates were taken.
Genes involved in bacterial motility were differentially regulated among bacteria in plants. Many of these genes were suppressed in Pto in planta but induced in D36E (Fig 2A and D). Leaf177, a Burkholderia (Betaproteobacteria) strain, showed a similar pattern to D36E (Fig 2A and D). However, the Rhizobiales (Alphaproteobacteria) Leaf155 more closely resembled virulent Pto—a majority of the genes were suppressed in planta (Fig 2D). Motility‐related genes can be classified into two major functional categories: flagellar assembly and chemotaxis. Genes encoding flagellar assembly proteins were globally suppressed in planta in Leaf155 as in Pto, and many Leaf177 chemotaxis‐related genes were induced in planta in contrast to Pto (Fig 2D). Thus, physiological processes were differentially regulated among different plant‐associated commensal strains, with some species even exhibiting similarity to a virulent pathogen (Fig 2D).
The type III secretion system, an essential component of the virulence of bacterial pathogens, including Pto (Toruño et al, 2016), was strongly induced in Pto and D36E, while these genes were absent in the commensals (Fig 2E). The type IV secretion system is involved in multiple processes such as translocating proteins and DNA into other cells and bacterial motility (Costa et al, 2015). This process was globally suppressed in Leaf130 and Leaf177, but not in Leaf155 (Fig 2E). The type VI secretion system is an injection machine involved in bacteria–host and bacteria–bacteria interactions (Russell et al, 2014). This machinery was globally induced in Leaf155 (Agrobacterium) and Leaf404 and partially induced in Leaf177 and Pto (Fig 2E). Lastly, preprotein translocase subunits, which are involved in the bacterial general secretory pathway (Osborne et al, 2005), tended to be suppressed in all commensals and D36E, but not in Pto (Fig 2E). Strain‐specific regulation of secretion pathways demonstrated here may explain how different strains interact with plant hosts and surrounding microbes. The results showing diverse transcriptional outputs in conserved genes also indicate that presence/absence information of bacterial genes is not sufficient to infer bacterial functions, and in planta bacterial gene expression analysis is necessary.
We previously reported that genes encoding iron‐chelating siderophores are strongly induced in Pto upon plant infection, and the induction of these genes is blocked by plant immunity to suppress bacterial growth (Nobori et al, 2018) (Fig 2F). Most of commensal genes associated with KEGG orthology terms related to siderophore biosynthesis were not induced in planta resembling D36E, although it is possible that there are other noncharacterized genes involved in siderophore biosynthesis in commensals (Fig 2F). Notably, many genes (3.9–5.1% of the KEGG annotated genes) annotated as “Function unknown” were significantly induced in planta in various commensals (Fig 2G). These functionally unannotated genes induced in planta may have unique roles in plant–bacterial interactions.
Phylum and strain‐specific gene expression
To compare expression of individual genes between different strains, we conducted comparative transcriptome analysis focusing on specific phyla (Appendix Fig S4A and C). This approach allows more comprehensive comparative transcriptome analysis as more genes are shared among strains within the same phylum. We focused on Bacteroidetes and Proteobacteria, in which 1,422 and 1,122 OGs were shared, respectively (compared with the 454 OGs shared among the nine commensals) (Appendix Fig S4A and C). In both of these phyla, a large number of genes were commonly suppressed among the three strains in plants, but induced genes were primarily strain‐specific (Appendix Figs S4B and D, and S5). Clusters of genes commonly suppressed in planta (clusters 7 & 8 in Bacteroidetes and clusters 1 & 4 in Proteobacteria) were enriched with “ribosome”‐related genes (Appendix Fig S4E). “Transporters” were enriched in multiple clusters with various expression patterns (Appendix Figs S4F and S6A), suggesting that transporters can be separated into subgroups based on the regulation in plants. Also, genes annotated as part of a “two‐component system” showed strain‐specific expression patterns (Appendix Figs S4G and S6B). Taken together, our intraphylum analysis reveals that even relatively closely related commensal strains respond differently in planta at the transcriptional level.
In planta bacterial transcriptomics illuminates bacterial adaptation to the leaf environment
Various bacterial functions were differentially regulated in plants in a strain‐specific manner. An important question is whether such functional regulation is relevant for bacterial fitness in plants. Comparative genomics is one way to infer bacterial functions associated with adaptation to the plant environment. A previous study compared the genomes of nearly 4,000 plant‐associated and nonplant‐associated bacterial strains and defined “plant‐associated (PA) genes” that are significantly enriched in plant‐associated strains (Levy et al, 2017). We analyzed how PA genes are regulated in plants in our transcriptome data. When analyzing the genes shared among nine commensal strains, we observed that genes induced in planta tended to be enriched with PA genes, whereas genes suppressed in planta tended to be enriched with non‐PA genes (Fig 3A). Remarkably, PA and non‐PA genes were significantly enriched with plant‐induced and plant‐suppressed genes, respectively, for all the commensals, except for the Firmicutes strain Leaf187 (Fig 3B). Therefore, our data suggest that bacterial genes associated with adaptation to the plant environment are indeed induced during the interaction with plants.
Figure 3. Genes enriched in plant‐associated bacteria are induced in planta .

- (Right panel) Bacterial gene expression fold changes (FC) in plants compared with in vitro (rich media). (Middle panel) Genes differentially expressed in planta compared with in vitro (¦log2FC¦ > 1; FDR < 0.01; two‐tailed Student's t‐test followed by Storey's q‐value). (Left panel) Genes previously shown to be “plant‐associated” (Levy et al, 2017) are shown as black. The bar and dots indicate the taxonomic affiliation (phylum/class level) of each strain. The dotted rectangles indicate genes that are “plant‐associated (PA) and induced in planta” (bottom) and “non‐plant‐associated (nonPA) and suppressed in planta” (top).
- Violin plots showing expression changes of PA and nonPA genes between in planta and in vitro. Each dot represents a gene. Genes significantly up‐ or downregulated in planta are colored in red and blue, respectively. The proportion of genes up‐ or downregulated are shown. For the full expression data with the orthologous group, KEGG annotation, DEG, and PA information, see Dataset EV3.
Data information: (B) For each condition, mean values of three biological replicates were taken. Asterisks indicate statistically significant enrichment (FDR < 0.05; Hypergeometric test corrected by Benjamini–Hochberg method) of up or downregulated genes in the PA or nonPA category.
We then performed KEGG functional category enrichment analysis for PA genes induced in plants and non‐PA genes suppressed in plants. Ribosome‐related genes were conserved among all strains (and are thus non‐PA genes) and were generally suppressed in plants (Fig 4A), which may be a strategy by which plants control bacterial growth. Glycan degradation genes were highly plant‐associated and induced in Bacteroidetes strains Leaf176 and Root935 (Fig 4A; Appendix Fig S6A). Among such genes were homologs of beta‐galactosidase, alpha‐L‐fucosidase, and glucosylceramidase, which can degrade plant cell wall components. Thus, Leaf176 and Root935 may have evolved the ability to degrade the plant cell wall enabling the establishment of favorable niches during plant colonization.
Figure 4. Nutrient acquisition systems are associated with bacterial adaptation to the plant environment in a strain‐specific manner.

- KEGG enrichment analysis of genes that are plant‐associated (PA) and significantly induced in planta compared with in vitro (rich media) (orange) and genes that are non‐PA and significantly suppressed in planta compared with in vitro (purple). The left panel shows the number of genes involved in each KEGG orthology term.
- Expression fold changes (in planta vs. in vitro) of genes with different functions. The top bars indicate the ratio of PA genes in each strain. All individual data points (genes) are overlaid to the box plots with colors for DEGs (red: upregulated, blue: downregulated, black: non‐DEG).
- Suflur metabolic pathways. For each step, a strain name was indicated when the strain has at least one gene significantly induced (red) or suppressed (blue) in planta. APS, adenosine 50‐phosphosulfate; PAPS, 30‐phosphoadenosine‐50‐phosphosulfate.
- Expression fold changes (in planta vs. in vitro) of genes with different functions. The top bars indicate the ratio of PA genes in each strain. All individual data points (genes) are overlaid to the box plots with colors for DEGs (red: upregulated, blue: downregulated, black: non‐DEG).
- Expression of the plant gene (E) AtDUR3 (urea transporter) based on the RNA‐seq data.
- Expression fold changes (in planta vs. in vitro) of genes with different functions. The top bars indicate the ratio of PA genes in each strain. All individual data points (genes) are overlaid to the box plots with colors for DEGs (red: upregulated, blue: downregulated, black: non‐DEG).
- Expression of the plant gene AtSTP13 (sugar transporter) based on the RNA‐seq data.
Data information: For the full expression data with the orthologous group, KEGG annotation, DEG, and PA information, see Dataset EV3. (B, D, F) For each condition, mean values of three biological replicates were taken. (E, G) Nine and three biological replicates were taken for the mock condition and the other conditions, respectively. Asterisks indicate statistically significant difference (¦log2FC¦ > 1; FDR < 0.01; two‐tailed Student's t‐test followed by Storey's q‐value) compared with the mock (water‐inoculated) condition. (B, D–G) In the box plots, boxes display the 25th–75th percentiles, the centerline indicating the median, whiskers extending to the minimum, and maximum values no further than 1.5 interquartile range.
We found a significant number of “sulfur metabolism”‐related genes that are PA genes and induced in planta in the three Proteobacteria strains (Fig 4A–C). The sulfur metabolism process includes translocating environmental sulfonate and alkane sulfate into bacterial cells, converting sulfate to APS (adenosine 50‐phosphosul‐fate), PAPS (30‐phosphoadenosine‐50‐phosphosulfate), sulfite, and then sulfide, which can be converted to amino acids (Fig 4C). A previous proteomics study showed that the expression of proteins involved in sulfur metabolism and uptake was induced on the leaf surface in two commensal Proteobacteria, Sphingomonas melonis, and Methylobacterium extorquens (Müller et al, 2016). Another study showed the beneficial endophytic bacterium Enterobacter sp. SA187 (Proteobacteria) transcriptionally induces sulfur metabolic pathways in planta (Andrés‐Barrao et al, 2021). These results suggest that sulfate acquisition is important for the adaptation of commensal Proteobacteria to the plant environment. On the contrary, a significant number of sulfur metabolism‐related genes were non‐PA genes and suppressed in planta in the Bacteroidetes strains Leaf176 and Leaf404 (Fig 4A and B). Furthermore, the number of genes predicted to be involved in sulfur metabolism was lower in Bacteroidetes strains than in Proteobacteria strains (Fig 4A). These results may indicate that Bacteroidetes strains are less reliant on sulfur acquisition during plant colonization. As Arabidopsis employs sulfur‐containing defense metabolites (Wittstock & Burow, 2010), it is also possible that sulfur metabolism‐related genes induced in some commensals may serve as a detoxification mechanism rather than a nutrient acquisition mechanism.
Genes encoding ABC transporters were PA genes and induced specifically in some Proteobacteria strains in planta (Fig 4A). Among such genes were urea transporters (Fig 4D). Interestingly, genes encoding ureases, which hydrolyze urea in the bacterial cytoplasm, were also PA and induced in some Proteobacteria strains (Fig 4D). It has been shown that Yersinia enterocolitica, a Gammaproteobacteria strain, can use urea as a nitrogen source (Young et al, 1996). These results suggest that Proteobacteria (especially Leaf177 and D36E) might use urea as a nitrogen source in the plant apoplast. Genes involved in the nitrate transport system were induced in Leaf130, Leaf155, and D36E in planta, but not in Pto (Appendix Fig S7), suggesting that some commensal Proteobacteria strains activate nitrogen acquisition systems in plants. Similarly, ribose transporters and glycerol transporters are PA genes and were commonly induced in planta in commensal or avirulent Proteobacteria strains (Leaf155, Leaf177, and D36E) but not in the virulent Pto (Fig 4F). Moreover, arabinose and xylose transporters (both monosaccharide transporters) were induced in Leaf177 and D36E in planta, but not in Pto (Appendix Fig S7). Thus, these Proteobacteria strains may use various types of sugars as carbon sources in plants. The induction of urea and sugar acquisition systems may indicate that commensal bacteria activate nutrient starvation responses in the leaf apoplast. We hypothesized that plants sequester nitrogen and carbon sources from the apoplast to limit the growth of commensal and avirulent pathogenic bacteria. In line with this hypothesis, the plant urea transporter AtDUR3, which sequestrates urea from the apoplast (Bohner et al, 2015), was induced upon inoculation with many commensal strains while suppressed by the virulent Pto (Fig 4E). Since induction of AtDUR3 has been shown to associate with leaf aging (Bohner et al, 2015), it is also possible that these commensals may promote leaf senescence. A previous study showed that plants sequester extracellular sugars by activating the sugar influx transporter AtSTP13 via the PTI pathway (Yamada et al, 2016). Indeed, our plant transcriptome data showed that AtSTP13 is induced by the commensals as well as D36E and Pto (Fig 4G). In summary, we revealed bacterial phylum/strain‐specific gene repertoires and gene regulation, which may be actively controlled by plants and drive bacterial niche separation in planta.
Commensals activate plant PTI in a strain‐specific manner
As commensal strains showed differing responses in plants, indicating strain specificity in the interactions of plants with bacteria, we further investigated genome‐wide plant responses to individual commensals. In addition to the nine commensal strains used for the cotranscriptome analysis, we included nine more commensal strains to enrich our plant transcriptome dataset (Fig 1A and Table EV1). Global gene expression changes (bacteria‐inoculated vs. water‐inoculated) were qualitatively similar among all commensal strains as well as D36E at 6 hpi (Fig 5A). Shared plant responses to diverse commensal bacteria were also observed in a previous study (Maier et al, 2021). Plant gene expression changes triggered by commensals overlapped markedly with responses to flg22 (Hillmer et al, 2017), a potent PTI inducer. PTI‐inducible genes accounted for clusters of genes commonly and strongly induced by most of the commensals (clusters 3/5/7 in Fig 5A). GO enrichment analysis showed that these clusters are enriched with genes related to defense responses (Fig 5B). Thus, commensal strains, when infiltrated into plant leaves, induce common PTI responses.
Figure 5. Plant transcriptome responses to phylogenetically diverse commensals.

- (Green/purple heatmap) Gene expression fold changes (FCs) of differentially expressed plant genes at least in one sample between bacteria‐inoculated plants and water‐inoculated plants. (Red/blue heatmap) Plant genes significantly induced or suppressed upon flg22 treatment at different time points (Hillmer et al, 2017). The number of strains causing differential gene expression (¦log2FC¦ > 1; FDR < 0.01; two‐tailed Student's t‐test followed by Storey's q‐value) are indicated in the sidebar (# of DEG strains). DEG, differentially expressed gene. Genes were clustered by k‐mean clustering (k = 8). The bars on the heatmaps indicate the taxonomic affiliation (phylum/class level) of each strain. See Dataset EV4 for gene expression data.
- Gene ontology enrichment analysis for genes in clusters 3, 4, 5, 7, and 8 of (A) ‐log10 P‐values (FDR corrected by Benjamini–Hochberg method) were shown.
- Expression fold changes (FC; z‐score) of genes in clusters 3 and 5. Results are shown as box plots with boxes displaying the 25th–75th percentiles, the centerline indicating the median, whiskers extending to the minimum, and maximum values no further than 1.5 interquartile range.
- Relationships between amino acid (AA) sequence conservation of flg22 or elf18 and normalized expression FCs of genes in clusters 3 and 5. AA sequence conservation of flg22 and elf18 compared with the canonical sequences known to induce strong defense responses in plants (Elf18: SKEKFERTKPHVNVGTIG. Flg22: QRLSTGSRINSAKDDAAGLQIA). The Pearson's correlation coefficients are shown. (C‐D) The same color code was used for the taxonomic affiliation.
Data information: (A–D) Nine and three biological replicates were taken for the mock condition and the other conditions, respectively.
The degree of PTI induction varied among strains in a manner that is partly determined by phylogeny: Gammaproteobacteria and Actinobacteria strains induced stronger PTI than Bacteroidetes strains (Fig 5C). We then investigated the amino acid sequences of the major MAMPs flg22 and elf18 across the different strains. Intriguingly, strains with flg22 and elf18 sequences similar to those known to be particularly potent PTI inducers (Felix et al, 1999; Kunze et al, 2004) tended to elicit strong PTI induction (gene expression fold changes in clusters 3 or 5) (Fig 5D). Thus, sequence variation in these MAMPs may partly determine the degree of PTI induced by some of these commensal strains, which is consistent with a previous finding (Colaianni et al, 2021).
Plant responses are incongruent with bacterial responses in plants
To get deeper insights into the relationships between plant and bacterial gene expression, we measured the correlation between gene expression changes in individual plant genes and shared bacterial OGs using cotranscriptome data of nine commensal strains. To prevent a single outlier strain from impacting correlation scores, we took a bootstrapping approach in which correlations were calculated using all the combinations of eight strains as well as all the nine strains and then combined (Materials and Methods) (Fig 6A and Appendix Fig S8). This analysis revealed that the expression of a majority of plant and bacterial genes is not correlated, further indicating that the plant and bacterial responses are largely uncoupled in our dataset (Fig 6B). For instance, in many cases, commensal strains that triggered similar plant transcriptional responses (e.g., Soil763 and Leaf1; Figs 1C and 6B) showed distinct gene expression in plants (Figs 1C and 6B). However, a subset of plant and bacterial genes showed a stronger correlation (Fig 6B). Enrichment analysis of KEGG functional categories showed that expression of bacterial genes annotated as “proton ATPases” and “purine metabolism” positively correlates with plant defense‐related genes (Fig 6B). More specifically, the expression of such bacterial genes was higher when plants showed stronger PTI activation, but a causal relationship between these functions remains elusive. Overall, our data show that plant and bacterial gene expression can be largely uncoupled at an early stage of interaction, indicating that cotranscriptome analysis is required for fully capturing and comparing among various plant–microbe interactions.
Figure 6. Plant and bacterial transcriptomes are largely uncoupled.

- Schematic diagram of the integration of plant and bacterial RNA‐seq data. For each interaction condition, the correlation coefficients between individual plant genes and bacterial OGs were calculated. The correlation coefficient data were corrected by bootstrapping (see Materials and Methods and Appendix Fig S8)
- A map of correlation coefficients between plant genes and bacterial OGs calculated as described in (A). Rows and columns are bacterial OGs and plant genes, respectively. The top and left heatmaps indicate gene expression FCs of plants and bacteria, respectively. KEGG enrichment analysis was performed for the clusters of plant and bacterial genes with strong correlation.
Data information: (B) See Dataset EV5 for the full correlation data. For bacterial RNA‐seq, three biological replicates were taken. For plant RNA‐seq, nine and three biological replicates were taken for the mock condition and the other conditions, respectively.
Discussion
Previous studies of the plant microbiota have suggested that plants assemble bacterial communities and regulate their functions by interacting with commensals in a strain‐specific manner. However, only a limited number of studies have interrogated the responses of plants and commensal bacteria at a genome‐wide scale, and thus, we do not have a comprehensive understanding of the two‐way molecular dialog between plants and microbiota members. Here, we profiled cotranscriptomes of plants and commensal bacteria using diverse strains covering all major phyla of the plant microbiota. We chose to study an early time point where in planta bacterial population density remained unchanged to prevent differential growth across strains that would strongly influence their transcriptomes. Our dataset demonstrated that different commensal strains (1) trigger qualitatively similar yet quantitatively different immune responses in plants and (2) show both common and highly strain‐specific responses in plants.
In this study, we primarily analyzed gene expression fold changes (in planta vs in vitro) to understand bacterial responses during interactions with plants using in vitro conditions as a “baseline.” Caution is needed when interpreting such data as expression of some genes might be highly different among strains in vitro. In our analysis, however, similar patterns were observed even when in planta gene expression data alone were used (Appendix Fig S9). Employing multiple baseline conditions in future experiments, such as different media or soil, or performing time course analysis will increase the power of capturing more biologically relevant responses.
We syringe‐infiltrated bacterial cells into leaves to bypass stomatal entry as different commensals might have different abilities to access the apoplast. Transcriptomes were profiled at 6 hpi, where the population density of even the virulent pathogen Pto has not yet increased (Nobori et al, 2018), and thus, we assumed that the population density of commensals remained the same at this time point. Therefore, our experimental setup allowed us to characterize strain‐specific cotranscriptomes under controlled conditions without the influence of stomatal immunity and differences in the sizes of bacterial populations. It is, however, important to note that transcriptome analysis under more natural conditions will reveal additional layers of plant–microbiota interactions. This requires technological innovations that enable in planta transcriptome analysis of bacteria with much smaller populations.
We found that suppression of genes related to general metabolic activity and energy production in planta is a common trait among phylogenetically diverse commensals, in marked contrast to a virulent pathogen, which elicited the opposite response (Fig 2). Note that we sampled bacteria at the time point when they did not start multiplying. Thus, higher metabolic activity of the virulent pathogen was not simply due to their active growth. PTI was commonly induced by the commensal strains (Fig 5A), suggesting that plant immunity might act to keep commensal metabolic activity in check to avoid overgrowth. This notion is in line with a previous finding that commensals can proliferate in an unrestrained manner in the leaf apoplast of plant mutants lacking key immune components (Xin et al, 2016; Chen et al, 2020). Further transcriptome analysis of commensals in immunocompromised plants and different environmental conditions will unravel how different immune pathways tailor their responses to effectively control commensal growth and function. Also, testing various other pathogens would be important to reveal lifestyle‐dependent transcriptome signatures of bacteria in plants.
We provide evidence that bacterial genes enriched in the genomes of plant‐adapted strains are frequently induced in planta (Fig 3A and B), suggesting that those genes which enable bacteria to thrive in the plant environment are indeed induced in plants. This finding is somewhat in contrast to a previous study that showed gene expression of a bacterial pathogen in planta does not correlate with fitness scores determined by transposon insertion mutagenesis (Helmann et al, 2019). Importantly, loss‐of‐function screening with single mutants has limitations in assigning gene function owing to functional redundancy. In this case, a gain‐of‐function assay is a complementary, albeit also limited, approach. For instance, in planta bacterial transcriptome data could predict bacterial genes that contribute to bacterial growth in planta when overexpressed (Nobori et al, 2018, 2020).
We found that processes involved in the uptake of nutrients, such as sulfur, urea, and sugars, were enriched in plant‐associated Alpha‐ and Betaproteobacteria (L155 and L177) and induced in planta (Fig 4). We also observed that plants induce transporters that could sequester urea and sugars from the apoplast during interactions with commensals (Fig 4E and G), which potentially affects bacterial nutrient acquisition processes and eventually bacterial fitness in plants. Notably, we found many other bacterial nutrient transporters to be regulated in planta in a strain‐specific manner (Appendix Fig S7). The results imply that different commensals experience distinct nutrient status in the plant apoplast, which might affect bacterial fitness in planta. Alternatively, different commensals may respond differently to the same nutrient status. Our cotranscriptome data set the stage for investigating whether plants control nutrient availability for particular strains to drive bacterial niche separation in plants and shape the plant microbiota.
We did not observe a strong association between gene expression changes in plants and commensals (Figs 1C and 6B), implying that similar programs of plant gene expression could divergently affect different commensals. This seems reasonable, given that plants have to deal with complex bacterial communities residing in an area smaller than the plant cell where plant immune responses elicited by a microbe can affect other microbes. In such a situation, recognition of microbes by immune receptors might be insufficient for distinguishing different microbes. Divergent effects of plant immune outputs on bacterial responses may enable plants to selectively host specific strains from complex microbial sources. In the future, time‐course analysis of a larger number of strains combined with plant and bacterial genetics will facilitate the prediction of mechanistic links between plant and bacterial responses.
Since plants used in this study were not grown in a strictly sterile condition, we do not exclude the possibility that the preexisting plant microbiota influenced plant and bacterial responses. However, influence of the preexisting microbiota on data interpretation was minimized by including the mock control (for plant transcriptomics), randomizing sampling, and taking three independent biological replicates (for plant and bacterial transcriptomics).
We demonstrated that an in planta bacterial transcriptome approach can be applied to all major phyla of the plant microbiota, opening a new avenue for in planta transcriptome analysis of synthetic communities that are generated by mixing bacterial strains in a desired manner. This in planta bacterial metatranscriptome approach together with individual bacterial transcriptomes can capture more complex traits such as microbe–microbe interactions, which are important to understand the functions of the microbiota as a community.
This study provides a wealth of information regarding gene regulation of both plants and commensals. In Appendix Fig S10–S13, we provided additional insights on the regulation of genes related to diverse functions, including biosynthesis/metabolism of various compounds, transporters, and nucleic acid regulation. Notably, we found many genes with unknown functions to be dynamically regulated in commensals during interactions with plants (Fig 2G). To explore these commensal functions, it will be critical in the future to link bacterial transcriptome responses to bacterial niche preference and reproductive fitness in plants. Our cotranscriptome dataset will provide a robust platform for hypothesis‐driven functional investigation of plant and bacterial genes that play critical roles in plant–microbiota interactions.
Materials and Methods
Plant materials and growth conditions
The Arabidopsis thaliana accession Col‐0 plants were grown in a chamber at 22°C with a 10‐h light period and 60% relative humidity for 24 days and then in another chamber at 22°C with a 12‐h light period and 60% relative humidity. For all experiments, 31‐ to 33‐day‐old plants were used.
Bacterial strains
Commensal strains were previously isolated from wild A. thaliana plants (Bai et al, 2015) (http://www.at‐sphere.com/) (Table EV1). The Pto mutant D36E was previously described (Wei et al, 2015). Bacterial strains were cultured at 20°C (commensal strains) or 28°C (Pto and D36E) at 200 rpm in liquid 50% TSB medium (Sigma‐Aldrich, USA).
Sampling of bacteria in vitro
Commensal strains were pregrown on solid 50% TSB plates for 2–4 days and then grown in liquid 50% TSB medium (starting at OD600 = 0.1) and harvested at the late log phase, which was determined by in vitro time course growth assays (Appendix Fig S14). 0.1 volume of the stop buffer (95% EtOH, 5% Phenol) was directly added to liquid bacterial cultures before centrifuging to collect bacterial cells. Target OD600 for each strain: Leaf1 = 0.7 (harvested after 6 h), Leaf130 = 1.2 (harvested after 4 h), Leaf155 = 0.5 (harvested after 6 h), Leaf176 = 0.9 (harvested after 8 h), Leaf177 = 0.6 (harvested after 8 h), Leaf187 = 0.8 (harvested after 4 h), Leaf404 = 0.6 (harvested after 4 h), Root935 = 0.8 (harvested after 4 h), Soil763 = 1.8 (harvested after 7 h).
Bacterial inoculation to plant leaves and sampling
Commensal strains were grown in the liquid 50% TSB medium. For each strain, multiple cultures were prepared with different bacterial densities to ensure that unsaturated cultures were used for experiments. Bacterial cells were harvested by centrifugation, washed twice with sterile water, and resuspended in sterile water to OD600 of 0.5. Plants grown in pots were randomized before bacterial inoculation. Leaves were harvested 6 h after inoculation. At this time point, the virulent Pto did not show increased population density (Nobori et al, 2018); thus, the population density of slow‐growing or nongrowing commensals likely remained unchanged. For bacterial RNA‐seq, 80–100 A. thaliana leaves (four fully expanded leaves per plant) were syringe‐inoculated with bacterial suspensions using a needleless syringe. For plant RNA‐seq, approximately six leaves (two fully expanded leaves per plant) were treated. Mock control (water infiltration) was included in every plant RNA‐seq experiment. Leaves were harvested at 6 h after inoculation. A pool of 80–100 and approximately six leaves for bacterial and plant RNA‐seq, respectively, was treated as a biological replicate. Sampling took approximately 5 min per biological replicate. Leaves were immediately frozen in liquid nitrogen and stored at −80°C. Three biological replicates from independent experiments were taken for each condition of plant and bacterial RNA‐seq.
Sequencing library preparation and RNA sequencing
In planta bacterial transcriptome analysis was conducted as described previously (Nobori et al, 2018) with slight modifications. Briefly, bacteria‐infected leaves were coarsely pulverized and released into bacterial isolation buffer (9.5% ethanol, 0.5% phenol, 25 mM TCEP (tris(2‐carboxyethyl)phosphine) pH 4.5 adjusted with NaOH) at 4°C, filtered, and centrifuged to isolate bacterial cells from plant cells. The original RNA extraction method based on chemical lysis of bacterial cells by TriFast (Nobori et al, 2018) did not work for some bacterial strains, thus we used FastRNA PRO™ BLUE KIT (MP Biomedicals), which involves mechanical cell lysis. rRNA was depleted to enrich mRNA, and the cDNA libraries were prepared using Ovation Complete Prokaryotic RNA‐seq kit 1–8 (NuGEN).
For plant RNA‐seq, RNA was extracted with FastRNA PRO™ KIT with Lysing Matrix E (MP Biomedicals), and DNA was digested with TURBO DNase (Ambion). RNA quality was determined using a 2100 Bioanalyzer (Agilent Technologies, USA). Initially, 500 ng total RNA was used for polyA enrichment with the NEBNext® Poly(A) mRNA Magnetic Isolation Module (New England Biolabs). Subsequent library preparation was performed with NEBNext® Ultra™ II Directional RNA Library Prep Kit for Illumina® (New England Biolabs) according to the manufacturer's instructions.
Libraries were immobilized and processed onto a flow cell with cBot (Illumina) and subsequently sequenced on the HiSeq3000 system (Illumina) with 1 x 150 bp single reads. Primary data analysis (incl. Image analysis, cluster identification, base calling, and assignment of quality scores) has been performed with RTA (real‐time analysis software; Illumina) installed on the sequencing platform.
For bacterial and plant samples, approximately 10 and 30 million reads, respectively, were obtained. Bacterial reads were mapped onto the corresponding bacterial genomes (Bai et al, 2015) using Bowtie2 (Langmead & Salzberg, 2012). Plant reads were mapped onto the Arabidopsis genome (TAIR10) using HISAT2 (Kim et al, 2015). Mapped reads were counted with the Python package HTSeq (Anders et al, 2015). The RNA‐seq data used in this study are deposited in NCBI Gene Expression Omnibus database (accession no. GSE150422).
Raw data
Raw RNA‐seq count and bacterial gene annotation files are available at https://github.com/tnobori/co‐transcriptomics.
Data analysis—Plant RNA‐seq
The statistical analysis of the RNA‐seq data was performed in the R environment. Genes with average counts < 5 were excluded from the analysis. The count data were TMM‐normalized and log‐transformed using the function calcNormFactors in the package edgeR (Robinson et al, 2010) and the function voomWithQualityWeights in the package limma (Ritchie et al, 2015), respectively. To each gene, a mixed linear model was fitted using the function lmFit in the limma package (Ritchie et al, 2015). Note that mock control (water infiltration) was included in every plant RNA‐seq experiment. The eBayes function in the limma package was used for variance shrinkage during the calculation of the P‐values. The false discovery rate (FDR; the Storey's q‐values) was calculated using the q‐value function in the qvalue package (Storey & Tibshirani, 2003). Genes with q‐value < 0.01 and ¦log2 fold change¦ > 1 were defined as differentially expressed genes. The prcomp function was used for principal component analysis. Heatmaps were created with the pheatmap function in the R environment. Enriched GO terms were identified using the BiNGO plugin for Cytoscape (Maere et al, 2005). Scatter plots and box plots were generated using the R‐package ggplot2.
Data analysis—Bacterial RNA‐seq
Bacterial phylogenetic analysis
The bacterial genomes were searched for the bacterial small ribosomal subunit 16S rRNA gene using RNAmmer (Lagesen et al, 2007). Next, a multiple sequence alignment was performed using Clustal Omega (Sievers et al, 2011) with default parameters. Finally, we employed FastTree (Price et al, 2010) to build a maximum‐likelihood phylogeny using the gamma time reversible substitution model (GTR) of DNA evolution. This tree was visualized (Fig 1B) using the interactive Tree of Life (Letunic & Bork, 2019).
Orthologous gene prediction and KEGG annotation
De novo orthology prediction was performed by using OrthoFinder (Emms & Kelly, 2015) with default parameters on the predicted protein coding sequences extracted from the bacterial genome assemblies. OrthoFinder is a reference‐free algorithm that uses pair‐wise protein alignments followed by a graph‐clustering step to infer orthologous relationships, and has been shown to have a higher accuracy than traditional approaches such as identifying best‐bidirectional hits (doi: 10.1093/gbe/evt132). Next, individual genes were annotated with the KEGG database as a reference (Kanehisa et al, 2014) using the blastkoala webserver (Prokaryotes group) (Kanehisa et al, 2016). Subsequently, orthologous genes were assigned a single KEGG orthology annotation by majority vote of individually annotated sequences in each group. The genomes of the commensal strains were previously reported (Bai et al, 2015) and are available at our GitHub repository (https://github.com/tnobori/co‐transcriptomics).
Data normalization and visualization
RNA‐seq data were normalized for each strain. After omitting genes with average count < 5, count data were TMM‐normalized and log‐transformed as described above. Genes with FDR < 0.01 (corrected by Benjamini–Hochberg method) and ¦log2 fold change¦ > 1 were defined as differentially expressed genes. Commensal genes were annotated with OGs to integrate gene expression data of different strains. When multiple genes are annotated with the same OG, the mean expression value was taken. Data visualization was performed as described above. UpSet plots were generated in the R environment using the package UpSetR (Conway et al, 2017).
KEGG orthology enrichment analysis (related to Fig 2A and Appendix Fig S3A)
A custom KEGG orthology database was created by taking only functional terms encoded in at least one bacterial genome (downloaded in January 2019). For each strain, a list of KEGG orthologies was generated by subsetting the corresponding KEGG IDs from the custom KEGG orthology database (see Dataset EV2). KEGG orthology enrichment test was performed using a hypergeometric test (FDR corrected by Benjamini–Hochberg method). KEGG orthologies with FDR < 0.01 and containing more than three genes were defined as significantly enriched KEGG orthologies. An R script and KEGG orthology databases are available at https://github.com/tnobori/co‐transcriptomics.
Generating plots of genes with various functions (related to Figs 2B–G, and 4B–D and F, Appendix Figs S3B and C, S6, S7, and S9–S12)
Bacterial genes were selected by KEGG pathway annotations or keyword searches from KEGG BRITE annotations. R scripts for this analysis are available at https://github.com/tnobori/co‐transcriptomics.
Intersecting plant‐associated bacterial genes and differentially regulated genes in planta (related to Fig 3)
In a previous study (Levy et al, 2017), comparative genomics analyses defined “plant‐associated (PA) genes” for each phylum/class using multiple statistical tests. The study defined two groups of Actinobacteria (Actinobacteria1 and Actinobacteria2). The Actinobacteria strains used in the present study are all (Actinobacteria1). We defined genes that passed at least one statistical test as “PA genes” and the others were defined as nonPA genes. An R script and PA‐gene datasets for this analysis are available at https://github.com/tnobori/co‐transcriptomics.
MAMP conservation analysis (related to Fig 5D)
Canonical flg22 and elf18 sequences were blasted against the bacterial genomes using blastp (Camacho et al, 2009) with standard settings. The results of these homology searches were filtered by retaining hits covering at least 90% of the length of the MAMP sequence in the alignment and subsequently retrieving the alignment with the highest percentage identity.
Integration of plant and bacterial RNA‐seq data (related to Fig 6)
Cotranscriptome fold change data (bacteria: in planta vs. in vitro; plants: bacteria vs. mock) of nine strains were used for this analysis. Plant genes whose expression was significantly changed by at least one strain were used. Pearson's correlation coefficients between individual plant genes and bacterial OGs were calculated. The same analysis was performed for all the combinations of eight strains (bootstrapping). Among these 8‐strain and 9‐strain datasets, the weakest correlation coefficient value was used for each combination of a bacterial OG and a plant gene (Fig S8). An R script and plant/bacterial gene expression datasets for this analysis are available at https://github.com/tnobori/co‐transcriptomics.
Determination of bacterial colony forming units (related to Appendix Fig S1)
Bacterial colonization of the leaves was determined following a previous study (Chen et al, 2020) with slight modifications. The Cl2‐gas‐sterilized seeds were stratified for 2 days at 4°C, sown on half Murashige & Skoogs (MS, Duchefa‐Biochemie, MO255.0050) agar medium with 1% sucrose, and allowed to germinate for 5 days. Seedlings of the same physiological state were transplanted on half MS agar medium and were grown for another 9 days (a total of 2 weeks) prior to inoculation with bacteria. One day before inoculation, bacterial cultures were grown on half TSB for 24 h at 22°C with 200 rpm shaking. On the day of inoculation, bacterial cells were harvested by centrifugation at 3000 rpm for 15 min, washed twice with sterile water, and then finally suspended in 10 mM MgCl2. The resulting bacterial suspensions were diluted to a final OD600 of 0.5 with sterile water and with this, each plate of 2‐week‐old seedlings was flood‐inoculated for 1 min, drained, and allowed to dry for 15 min. Plants were then grown for 3 days and 2–3 leaves of the same physiological state were harvested aseptically and weighed. To quantify bacteria in the endophytic compartment, leaves were surface‐sterilized with 75% ethanol for 30 s and washed twice with sterile water, and the leaves were homogenized on 10 mM MgCl2 buffer using TissueLyserll (Qiagen) with the frequency of 30 s−1 for 5 min. The samples were then serially diluted (100 to 105) and spread‐plated on 0.5x TSB agar medium. Plates were incubated at ambient temperature, colonies were observed and counted for 1–3 d and colony‐forming units were expressed per mg FW. The total compartment was assayed similarly but without surface sterilization.
Author contributions
Tatsuya Nobori: Conceptualization; data curation; formal analysis; validation; investigation; visualization; methodology; writing – original draft. Yu Cao: Investigation. Frederickson Entila: Investigation. Eik Dahms: Data curation; software. Yayoi Tsuda: Investigation. Ruben Garrido‐Oter: Data curation; software. Kenichi Tsuda: Conceptualization; resources; supervision; funding acquisition; project administration; writing – review and editing.
Disclosure and competing interests statement
Kenichi Tsuda is an advisory editorial board member of EMBO Reports.
Supporting information
Appendix
Table EV1
Dataset EV1
Dataset EV2
Dataset EV3
Dataset EV4
Dataset EV5
Acknowledgments
We thank Paul Schulze‐Lefert and Julia Vorholt for providing the commensal strains, Alan Collmer for providing the Pto DC3000 D36E strain, the Max Planck Genome Centre for sequencing support, Dieter Becker, Ryosuke Kanaoka, Shinpei Shimokawa, and Ying Tang for research assistance, and Neysan Donnelly, You Lu, and Natsuki Omae for critical comments on the manuscript. This work was supported by the Fundamental Research Funds for the Central Universities (Program No. 2662020ZKPY009) (to KT), Joint Funding of Huazhong Agricultural University and Agricultural Genomics Institute at Shenzhen, Chinese Academy of Agricultural Sciences (SZYJY2021007) (to KT), The Huazhong Agricultural University Scientific & Technological Self‐innovation Foundation (to KT), the Max Planck Society (to RG‐O and KT), a German Research Foundation grant (SPP2125) (to RG‐O and KT), a predoctoral fellowship from the Nakajima Foundation (to TN), and a Chinese Scholarship Council PhD stipend (CSC Student ID 201808440401) (to YC).
EMBO reports (2022) 23: e55380
Data availability
The RNA sequencing data used in this study are deposited in the National Center for Biotechnology Information Gene Expression Omnibus database (accession no. GSE150422, https://www.ncbi.nlm.nih.gov/geo/query/acc.cgi?acc=GSE150422). Key data and scripts are available at https://github.com/tnobori/co‐transcriptomics.
References
- Anders S, Pyl PT, Huber W (2015) HTSeq‐‐a python framework to work with high‐throughput sequencing data. Bioinformatics 31: 166–169 [DOI] [PMC free article] [PubMed] [Google Scholar]
- Andrés‐Barrao C, Alzubaidy H, Jalal R, Mariappan KG, de Zélicourt A, Bokhari A, Artyukh O, Alwutayd K, Rawat A, Shekhawat K et al (2021) Coordinated bacterial and plant sulfur metabolism in Enterobacter sp. SA187‐induced plant salt stress tolerance. Proc Natl Acad Sci U S A 118: e2107417118 [DOI] [PMC free article] [PubMed] [Google Scholar]
- Bai Y, Müller DB, Srinivas G, Garrido‐Oter R, Potthoff E, Rott M, Dombrowski N, Münch PC, Spaepen S, Remus‐Emsermann M et al (2015) Functional overlap of the Arabidopsis leaf and root microbiota. Nature 528: 364–369 [DOI] [PubMed] [Google Scholar]
- Bohner A, Kojima S, Hajirezaei M, Melzer M, von Wirén N (2015) Urea retranslocation from senescing Arabidopsis leaves is promoted by DUR3‐mediated urea retrieval from leaf apoplast. Plant J 81: 377–387 [DOI] [PMC free article] [PubMed] [Google Scholar]
- Boller T, Felix G (2009) A renaissance of elicitors: perception of microbe‐associated molecular patterns and danger signals by pattern‐recognition receptors. Annu Rev Plant Biol 60: 379–406 [DOI] [PubMed] [Google Scholar]
- Camacho C, Coulouris G, Avagyan V, Ma N, Papadopoulos J, Bealer K, Madden TL (2009) BLAST+: architecture and applications. BMC Bioinformatics 10: 421 [DOI] [PMC free article] [PubMed] [Google Scholar]
- Carrión VJ, Perez‐Jaramillo J, Cordovez V, Tracanna V, de Hollander M, Ruiz‐Buck D, Mendes LW, van Ijcken WFJ, Gomez‐Exposito R, Elsayed SS et al (2019) Pathogen‐induced activation of disease‐suppressive functions in the endophytic root microbiome. Science 366: 606–612 [DOI] [PubMed] [Google Scholar]
- Chapelle E, Alunni B, Malfatti P, Solier L, Pédron J, Kraepiel Y, Van Gijsegem F (2015) A straightforward and reliable method for bacterial in planta transcriptomics: application to the Dickeya dadantii/Arabidopsis thaliana pathosystem. Plant J 82: 352–362 [DOI] [PubMed] [Google Scholar]
- Chen T, Nomura K, Wang X, Sohrabi R, Xu J, Yao L, Paasch BC, Ma L, Kremer J, Cheng Y et al (2020) A plant genetic network for preventing dysbiosis in the phyllosphere. Nature 580: 653–657 [DOI] [PMC free article] [PubMed] [Google Scholar]
- Colaianni NR, Parys K, Lee H‐S, Conway JM, Kim NH, Edelbacher N, Mucyn TS, Madalinski M, Law TF, Jones CD et al (2021) A complex immune response to flagellin epitope variation in commensal communities. Cell Host Microbe 29: 635–649.e9 [DOI] [PubMed] [Google Scholar]
- Conway JR, Lex A, Gehlenborg N (2017) UpSetR: an R package for the visualization of intersecting sets and their properties. Bioinformatics 33: 2938–2940 [DOI] [PMC free article] [PubMed] [Google Scholar]
- Costa TRD, Felisberto‐Rodrigues C, Meir A, Prevost MS, Redzej A, Trokter M, Waksman G (2015) Secretion systems in gram‐negative bacteria: structural and mechanistic insights. Nat Rev Microbiol 13: 343–359 [DOI] [PubMed] [Google Scholar]
- Durán P, Thiergart T, Garrido‐Oter R, Agler M, Kemen E, Schulze‐Lefert P, Hacquard S (2018) Microbial interkingdom interactions in roots promote Arabidopsis survival. Cell 175: 973–983.e14 [DOI] [PMC free article] [PubMed] [Google Scholar]
- Emms DM, Kelly S (2015) OrthoFinder: Solving fundamental biases in whole genome comparisons dramatically improves orthogroup inference accuracy. Genome Biol 16: 157 [DOI] [PMC free article] [PubMed] [Google Scholar]
- Felix G, Duran JD, Volko S, Boller T (1999) Plants have a sensitive perception system for the most conserved domain of bacterial flagellin. Plant J 18: 265–276 [DOI] [PubMed] [Google Scholar]
- Garrido‐Oter R, Nakano RT, Dombrowski N, Ma K‐W, AgBiome Team , AC MH, Schulze‐Lefert P (2018) Modular traits of the Rhizobiales root microbiota and their evolutionary relationship with symbiotic rhizobia. Cell Host Microbe 24: 155–167 [DOI] [PMC free article] [PubMed] [Google Scholar]
- Hacquard S, Garrido‐Oter R, González A, Spaepen S, Ackermann G, Lebeis S, McHardy AC, Dangl JL, Knight R, Ley R et al (2015) Microbiota and host nutrition across plant and animal kingdoms. Cell Host Microbe 17: 603–616 [DOI] [PubMed] [Google Scholar]
- Hacquard S, Spaepen S, Garrido‐Oter R, Schulze‐Lefert P (2017) Interplay between innate immunity and the plant microbiota. Annu Rev Phytopathol 55: 565–589 [DOI] [PubMed] [Google Scholar]
- Helmann TC, Deutschbauer AM, Lindow SE (2019) Genome‐wide identification of pseudomonas syringae genes required for fitness during colonization of the leaf surface and apoplast. Proc Natl Acad Sci U S A 116: 18900–18910 [DOI] [PMC free article] [PubMed] [Google Scholar]
- Hillmer RA, Tsuda K, Rallapalli G, Asai S, Truman W, Papke MD, Sakakibara H, Jones JDG, Myers CL, Katagiri F (2017) The highly buffered Arabidopsis immune signaling network conceals the functions of its components. PLoS Genet 13: e1006639 [DOI] [PMC free article] [PubMed] [Google Scholar]
- Jones JDG, Dangl JL (2006) The plant immune system. Nature 444: 323–329 [DOI] [PubMed] [Google Scholar]
- Kanehisa M, Goto S, Sato Y, Kawashima M, Furumichi M, Tanabe M (2014) Data, information, knowledge and principle: back to metabolism in KEGG. Nucleic Acids Res 42: D199–D205 [DOI] [PMC free article] [PubMed] [Google Scholar]
- Kanehisa M, Sato Y, Morishima K (2016) BlastKOALA and GhostKOALA: KEGG tools for functional characterization of genome and metagenome sequences. J Mol Biol 428: 726–731 [DOI] [PubMed] [Google Scholar]
- Kim D, Langmead B, Salzberg SL (2015) HISAT: A fast spliced aligner with low memory requirements. Nat Methods 12: 357–360 [DOI] [PMC free article] [PubMed] [Google Scholar]
- Kunze G, Zipfel C, Robatzek S, Niehaus K, Boller T, Felix G (2004) The N terminus of bacterial elongation factor Tu elicits innate immunity in Arabidopsis plants. Plant Cell 16: 3496–3507 [DOI] [PMC free article] [PubMed] [Google Scholar]
- Kwak M‐J, Kong HG, Choi K, Kwon S‐K, Song JY, Lee J, Lee PA, Choi SY, Seo M, Lee HJ et al (2018) Rhizosphere microbiome structure alters to enable wilt resistance in tomato. Nat Biotechnol 36: 1100–1109 [DOI] [PubMed] [Google Scholar]
- Lagesen K, Hallin P, Rødland EA, Staerfeldt H‐H, Rognes T, Ussery DW (2007) RNAmmer: Consistent and rapid annotation of ribosomal RNA genes. Nucleic Acids Res 35: 3100–3108 [DOI] [PMC free article] [PubMed] [Google Scholar]
- Langmead B, Salzberg SL (2012) Fast gapped‐read alignment with bowtie 2. Nat Methods 9: 357–359 [DOI] [PMC free article] [PubMed] [Google Scholar]
- Lebeis SL, Paredes SH, Lundberg DS, Breakfield N, Gehring J, McDonald M, Malfatti S, Glavina del Rio T, Jones CD, Tringe SG et al (2015) PLANT MICROBIOME. Salicylic acid modulates colonization of the root microbiome by specific bacterial taxa. Science 349: 860–864 [DOI] [PubMed] [Google Scholar]
- Letunic I, Bork P (2019) Interactive tree of life (iTOL) v4: recent updates and new developments. Nucleic Acids Res 47: W256–W259 [DOI] [PMC free article] [PubMed] [Google Scholar]
- Levy A, Conway JM, Dangl JL, Woyke T (2018) Elucidating bacterial gene functions in the plant microbiome. Cell Host Microbe 24: 475–485 [DOI] [PubMed] [Google Scholar]
- Levy A, Salas Gonzalez I, Mittelviefhaus M, Clingenpeel S, Herrera Paredes S, Miao J, Wang K, Devescovi G, Stillman K, Monteiro F et al (2017) Genomic features of bacterial adaptation to plants. Nat Genet 50: 138–150 [DOI] [PMC free article] [PubMed] [Google Scholar]
- Lovelace AH, Smith A, Kvitko BH (2018) Pattern‐triggered immunity alters the transcriptional regulation of virulence‐associated genes and induces the sulfur starvation response in Pseudomonas syringae pv. Tomato DC3000. Mol Plant Microbe Interact 31: 750–765 [DOI] [PubMed] [Google Scholar]
- Maere S, Heymans K, Kuiper M (2005) BiNGO: a Cytoscape plugin to assess overrepresentation of gene ontology categories in biological networks. Bioinformatics 21: 3448–3449 [DOI] [PubMed] [Google Scholar]
- Maier BA, Kiefer P, Field CM, Hemmerle L, Bortfeld‐Miller M, Emmenegger B, Schäfer M, Pfeilmeier S, Sunagawa S, Vogel CM et al (2021) A general non‐self response as part of plant immunity. Nat Plants 7: 696–705 [DOI] [PMC free article] [PubMed] [Google Scholar]
- Müller DB, Schubert OT, Röst H, Aebersold R, Vorholt JA (2016) Systems‐level proteomics of two ubiquitous leaf commensals reveals complementary adaptive traits for Phyllosphere colonization. Mol Cell Proteomics 15: 3256–3269 [DOI] [PMC free article] [PubMed] [Google Scholar]
- Nobori T, Velásquez AC, Wu J, Kvitko BH, Kremer JM, Wang Y, He SY, Tsuda K (2018) Transcriptome landscape of a bacterial pathogen under plant immunity. Proc Natl Acad Sci U S A 115: E3055–E3064 [DOI] [PMC free article] [PubMed] [Google Scholar]
- Nobori T, Wang Y, Wu J, Stolze SC, Tsuda Y, Finkemeier I, Nakagami H, Tsuda K (2020) Multidimensional gene regulatory landscape of a bacterial pathogen in plants. Nat Plants 6: 883–896 [DOI] [PubMed] [Google Scholar]
- Osborne AR, Rapoport TA, van den Berg B (2005) Protein translocation by the Sec61/SecY channel. Annu Rev Cell Dev Biol 21: 529–550 [DOI] [PubMed] [Google Scholar]
- Price MN, Dehal PS, Arkin AP (2010) FastTree 2 – approximately maximum‐likelihood trees for large alignments. PLoS One 5: e9490 [DOI] [PMC free article] [PubMed] [Google Scholar]
- Ritchie ME, Phipson B, Wu D, Hu Y, Law CW, Shi W, Smyth GK (2015) Limma powers differential expression analyses for RNA‐sequencing and microarray studies. Nucleic Acids Res 43: e47 [DOI] [PMC free article] [PubMed] [Google Scholar]
- Robinson MD, McCarthy DJ, Smyth GK (2010) edgeR: A Bioconductor package for differential expression analysis of digital gene expression data. Bioinformatics 26: 139–140 [DOI] [PMC free article] [PubMed] [Google Scholar]
- Russell AB, Peterson SB, Mougous JD (2014) Type VI secretion system effectors: poisons with a purpose. Nat Rev Microbiol 12: 137–148 [DOI] [PMC free article] [PubMed] [Google Scholar]
- Sievers F, Wilm A, Dineen D, Gibson TJ, Karplus K, Li W, Lopez R, McWilliam H, Remmert M, Söding J et al (2011) Fast, scalable generation of high‐quality protein multiple sequence alignments using Clustal omega. Mol Syst Biol 7: 539 [DOI] [PMC free article] [PubMed] [Google Scholar]
- Storey JD, Tibshirani R (2003) Statistical significance for genomewide studies. Proc Natl Acad Sci U S A 100: 9440–9445 [DOI] [PMC free article] [PubMed] [Google Scholar]
- Teixeira PJPL, Colaianni NR, Law TF, Conway JM, Gilbert S, Li H, Salas‐González I, Panda D, Del Risco NM, Finkel OM et al (2021) Specific modulation of the root immune system by a community of commensal bacteria. Proc Natl Acad Sci U S A 118: e2100678118 [DOI] [PMC free article] [PubMed] [Google Scholar]
- Toruño TY, Stergiopoulos I, Coaker G (2016) Plant‐pathogen effectors: Cellular probes interfering with plant defenses in spatial and temporal manners. Annu Rev Phytopathol 54: 419–441 [DOI] [PMC free article] [PubMed] [Google Scholar]
- Velásquez AC, Huguet‐Tapia JC, He SY (2022) Shared in planta population and transcriptomic features of nonpathogenic members of endophytic phyllosphere microbiota. Proc Natl Acad Sci U S A 119: e2114460119 [DOI] [PMC free article] [PubMed] [Google Scholar]
- Vogel C, Bodenhausen N, Gruissem W, Vorholt JA (2016) The Arabidopsis leaf transcriptome reveals distinct but also overlapping responses to colonization by phyllosphere commensals and pathogen infection with impact on plant health. New Phytol 212: 192–207 [DOI] [PubMed] [Google Scholar]
- Wei H‐L, Chakravarthy S, Mathieu J, Helmann TC, Stodghill P, Swingle B, Martin GB, Collmer A (2015) Pseudomonas syringae pv. Tomato DC3000 type III secretion effector Polymutants reveal an interplay between HopAD1 and AvrPtoB. Cell Host Microbe 17: 752–762 [DOI] [PMC free article] [PubMed] [Google Scholar]
- Wittstock U, Burow M (2010) Glucosinolate breakdown in Arabidopsis: Mechanism, regulation and biological significance. Arabidopsis Book 8: e0134 [DOI] [PMC free article] [PubMed] [Google Scholar]
- Xin X‐F, Nomura K, Aung K, Velásquez AC, Yao J, Boutrot F, Chang JH, Zipfel C, He SY (2016) Bacteria establish an aqueous living space in plants crucial for virulence. Nature 539: 524–529 [DOI] [PMC free article] [PubMed] [Google Scholar]
- Yamada K, Saijo Y, Nakagami H, Takano Y (2016) Regulation of sugar transporter activity for antibacterial defense in Arabidopsis . Science 354: 1427–1430 [DOI] [PubMed] [Google Scholar]
- Young GM, Amid D, Miller VL (1996) A bifunctional urease enhances survival of pathogenic Yersinia enterocolitica and Morganella morganii at low pH. J Bacteriol 178: 6487–6495 [DOI] [PMC free article] [PubMed] [Google Scholar]
- Yu K, Liu Y, Tichelaar R, Savant N, Lagendijk E, van Kuijk SJL, Stringlis IA, van Dijken AJH, Pieterse CMJ, Bakker PAHM et al (2019) Rhizosphere‐associated pseudomonas suppress local root immune responses by gluconic acid‐mediated lowering of environmental pH. Curr Biol 29: 3913–3920.e4 [DOI] [PubMed] [Google Scholar]
- Yu X, Lund SP, Greenwald JW, Records AH, Scott RA, Nettleton D, Lindow SE, Gross DC, Beattie GA (2014) Transcriptional analysis of the global regulatory networks active in pseudomonas syringae during leaf colonization. MBio 5: e01683‐01614 [DOI] [PMC free article] [PubMed] [Google Scholar]
- Yu X, Lund SP, Scott RA, Greenwald JW, Records AH, Nettleton D, Lindow SE, Gross DC, Beattie GA (2013) Transcriptional responses of pseudomonas syringae to growth in epiphytic versus apoplastic leaf sites. Proc Natl Acad Sci U S A 110: E425–E434 [DOI] [PMC free article] [PubMed] [Google Scholar]