

Abstract
Autophagy is responsible for clearance of an extensive portfolio of cargoes, which are sequestered into vesicles, called autophagosomes, and are delivered to lysosomes for degradation. The pathway is highly dynamic and responsive to several stress conditions. However, the phospholipid composition and protein contents of human autophagosomes under changing autophagy rates are elusive so far. Here, we introduce an antibody‐based FACS‐mediated approach for the isolation of native autophagic vesicles and ensured the quality of the preparations. Employing quantitative lipidomics, we analyze phospholipids present within human autophagic vesicles purified upon basal autophagy, starvation, and proteasome inhibition. Importantly, besides phosphoglycerides, we identify sphingomyelin within autophagic vesicles and show that the phospholipid composition is unaffected by the different conditions. Employing quantitative proteomics, we obtain cargo profiles of autophagic vesicles isolated upon the different treatment paradigms. Interestingly, starvation shows only subtle effects, while proteasome inhibition results in the enhanced presence of ubiquitin–proteasome pathway factors within autophagic vesicles. Thus, here we present a powerful method for the isolation of native autophagic vesicles, which enabled profound phospholipid and cargo analyses.
Keywords: autophagic vesicles, autophagy, cargo profiling, lipid profiling, vesicle isolation
Subject Categories: Autophagy & Cell Death, Methods & Resources, Proteomics
This report introduces an antibody‐based FACS‐mediated method for isolation of native autophagic vesicles in large quantities, enabling subsequent phospholipid and cargo analyses.

Introduction
Macroautophagy (hereafter autophagy) is a eukaryotic catabolic pathway responsible for the removal and recycling of an extensive portfolio of cytosolic cargoes. Numerous proteins, aggregates, organelles, cellular compartments, or pathogens have been characterized as autophagy substrates, which are sequestered into vesicles, called autophagosomes, and are delivered to lysosomes for degradation (Mizushima & Komatsu, 2011).
Autophagosome formation starts with a cup‐shaped membrane, the phagophore, which expands around the degradable material until it surrounds it and seals (Lamb et al, 2013). This de novo vesicle synthesis is initiated by activation of the ULK1/2 kinase and the phosphoinositide 3‐kinase (PI3‐kinase) complex that facilitates the recruitment of proteins and phospholipids (PLs) essential for phagophore generation (Nascimbeni et al, 2017; Mercer et al, 2018). The exact lipid sources are elusive so far; however, recent studies suggest a direct PL transfer from the ER via ATG2A/B (Osawa et al, 2019; Valverde et al, 2019) and from post‐Golgi compartments via ATG9A (Gomez‐Sanchez et al, 2021).
The elongation of the phagophore is linked to two ubiquitin‐like conjugation reactions (Mizushima, 2020). ATG12 is conjugated to ATG5, which facilitates the conjugation of ATG8 proteins to phosphatidylethanolamine (PE) (Kabeya et al, 2004; Noda & Inagaki, 2015). In humans, six Atg8 family members have been identified: MAP1LC3A, MAP1LC3B, MAP1LC3C (shortly LC3A‐C), as well as GABARAP, GABARAPL1, and GABARAPL2 (Slobodkin & Elazar, 2013). Lipidated ATG8 proteins (referred to as ATG8‐II) are inserted into both sides of the growing phagophore membrane and stay attached to mature autophagosomes, facilitating phagophore elongation and closure as well as autophagosome‐lysosome fusion (Weidberg et al, 2010; Nguyen et al, 2016; Tsuboyama et al, 2016). Besides their prominent roles in autophagy, distinct lipidated ATG8 proteins have additionally been associated with nonautophagic vesicles, modulating their maturation, trafficking, or degradation (Florey & Overholtzer, 2012; Heckmann et al, 2017; Nieto‐Torres et al, 2021).
Moreover, ATG8 proteins provide binding sites for cargo receptors. Autophagy was initially described as a nonselective process that degrades random material of the cytosol to recycle building blocks responding to changing metabolic requirements. The identification of cargo receptors, though, established a selective part, resulting in the degradation of specific substrates (Stolz et al, 2014; Khaminets et al, 2016). Via its LC3 interacting domain and its ubiquitin‐binding domain, the cargo receptor SQSTM1/p62, for example, binds to ATG8 proteins and directs selective cargoes into autophagosomes (Pankiv et al, 2007; Kirkin et al, 2009; Gatica et al, 2018).
Autophagy is highly dynamic and rapidly adapts to changing cellular conditions. Unstressed cells are characterized by a basal autophagy rate that constantly degrades and recycles cellular material at (comparably) low levels. Various stress situations alter autophagy, resulting in a substantially enhanced cargo degradation (He & Klionsky, 2009). However, the impact of different autophagy conditions on the exact PL and cargo profiles of autophagosomes is not defined in detail yet. Several studies have isolated autophagosomes using elaborate cellular fractionation methods (Gao et al, 2010; Dengjel et al, 2012; Mancias et al, 2014) or have performed cargo analyses employing proximity labeling in combination with quantitative proteomics (Le Guerroue et al, 2017; Zellner et al, 2021). Still, a potent method for the isolation of unmanipulated autophagic vesicles at large quantities that enables rapid and efficient lipid and cargo profiling is missing to date.
Here, we now introduce an antibody‐based FACS‐ (fluorescence‐activated cell sorting‐) mediated isolation approach to purify intact native autophagic vesicles. We characterized the quality of the isolates and performed quantitative lipidomics and proteomics analyses to identify PLs and cargo proteins of autophagic vesicles enriched upon basal autophagy conditions, nutrient deprivation, and proteasome inhibition.
Results and Discussion
Isolation of intact native autophagic vesicles in large quantities
We established a protocol for the isolation of native autophagic vesicles, employing antibody‐based fluorescence tagging of ATG8 proteins and subsequent sorting via FACS (Fig 1A, Appendix Fig S1A). Upon mild cell disruption, we incubated the cellular extract with a primary antibody directed against an ATG8 protein, followed by treatment with a secondary fluorophore‐conjugated antibody. The selective and stable attachment of the fluorophore allowed the specific purification of the labeled granular structures using FACS. The sorting resulted in preparations of approx. 1,000 positive events per μl PBS and thus allowed the isolation of autophagic vesicles in large quantities.
Figure 1. FACS‐mediated isolation of autophagic vesicles.
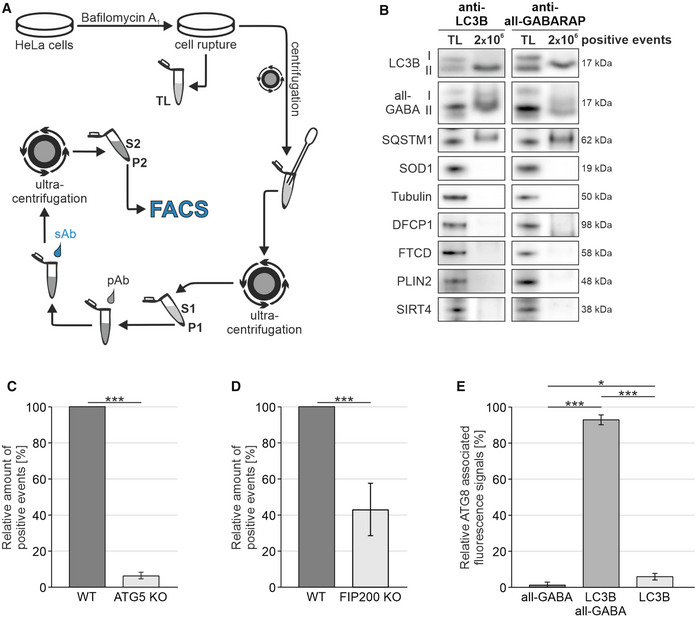
- Schematic representation of the antibody‐based FACS‐mediated isolation method. TL, total lysate; P1‐2, pellet fractions; S1‐2, supernatants.
- Western blot analysis of purified autophagic vesicles. Isolations were performed using antibodies directed against LC3B or all GABARAP isoforms, respectively, and are represented with total lysate (TL). Depicted are representative blots of 14 independent approaches.
- Quantification of fluorophore‐labeled events in WT and ATG5 KO HeLa cells. Shown percentages represent the relative number of detected events in three independent experiments.
- Quantification of fluorophore‐labeled events in WT and FIP200 KO MEFs. Shown percentages represent the relative number of detected events in three independent experiments.
- Co‐localization of fluorescence signals linked to antibodies directed against LC3B and all GABARAP isoforms. Shown percentages represent the average distribution of three independent experiments, excluding double negative events.
Data information: (C–E) Statistics are depicted as mean ± SD; t‐test (C + D) or one‐way ANOVA (E); *P ≤ 0.05; ***P ≤ 0.001.
In order to investigate the successful enrichment of autophagic vesicles by the FACS‐based approach, we analyzed the presence of specific autophagosomal proteins within the isolate fractions via Western blotting. Upon isolations using antibodies directed against LC3B or all GABARAP isoforms (Fig 1B), we observed the lipidated variants of both ATG8 proteins and SQSTM1/p62 within the isolate fractions, confirming the enrichment of autophagic vesicles. Unlipidated ATG8 proteins, which are not bound to autophagic vesicles, were hardly detectable. They were effectively depleted from the isolates by the centrifugation steps and the FACS‐based sorting included in the isolation protocol (Appendix Fig S1B, Fig 1A). To emphasize the quality of the preparations, we investigated the presence of proteins specific for the cytosol (SOD1), cytoskeleton (Tubulin), ER (DFCP1), Golgi (FTCD), lipid droplets (PLIN2), or mitochondria (SIRT4). Importantly, all investigated proteins were quantitatively excluded from the isolate fractions, illustrating the quality of the FACS‐based method (Fig 1B).
To additionally stress the potency of the isolation approach, we used a cell line that expresses endogenously HA‐tagged GABARAP (Appendix Fig S2). Employing an antibody directed against the HA‐tag, we efficiently enriched HA‐positive autophagic vesicles without accumulating additional cellular organelles or compartments (Fig EV1).
Figure EV1. Isolation of autophagic vesicles from HA‐GABARAP‐expressing HeLa cells.
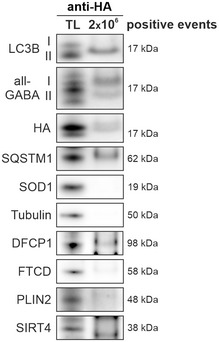
Western blot analysis of purified HA‐tagged autophagic vesicles. Isolations were based on an antibody directed against the HA‐tag and are represented with total lysate (TL). Shown blots are representative for three independent experiments.
For further quality control, we investigated whether total amounts of fluorophore‐labeled events detected via FACS correlated with the numbers of ATG8‐positive structures present within cells and employed ATG5 KO HeLa cells and FIP200 KO MEFs. We generated ATG5 KO HeLa cells and confirmed that the stable loss of ATG5 deteriorated LC3B lipidation and abrogated canonical autophagy (Appendix Fig S3A). FIP200 is functionally involved in ULK1‐mediated autophagy induction and its knockout disturbs autophagosome formation (Hara et al, 2008). However, although at decreased levels, the lipidated form of LC3B is still present in FIP200 KO MEFs and is primarily associated with nonautophagic vesicles (Appendix Fig S3B). Importantly, due to autophagy dysfunction, both KO lines accumulated SQSTM1/p62 aggregates that co‐localized with LC3B, confirming previous studies (Pankiv et al, 2007; Kishi‐Itakura et al, 2014) (Appendix Fig S3).
Upon starvation‐mediated autophagy induction, we purified ATG8‐positive structures and detected reduced quantities of fluorophore‐labeled events in both KO lines compared with appropriate wild‐type (WT) cells (Fig 1C and D, Appendix Fig S4). ATG5 KO cells showed a strong decline in total numbers, and FIP200 KO MEFs displayed reduced amounts. Thus, levels of isolatable material and eventually isolated structures indeed correlated, which emphasized the specificity of the isolation approach.
We analyzed the proteins present within the isolate fractions of both KO lines via Western blotting and detected the unlipidated form of LC3B for ATG5 KO cells and lipidated LC3B for FIP200 KO MEFs (Fig EV2). The cargo receptor SQSTM1/p62 was present in both fractions. Thus, besides autophagic vesicles, the employed LC3B antibody sufficiently labeled additional targets and enabled their purification. This emphasized the potential of the isolation approach to enrich every epitope‐offering structure of granular appearance. These granular structures might include SQSTM1/p62‐positive aggregate particles that co‐localize with unlipidated and lipidated LC3B (Runwal et al, 2019) as well as LC3B‐positive nonautophagic vesicles.
Figure EV2. Western blot analysis of isolates from ATG5 KO HeLa cells and FIP200 KO MEFs.
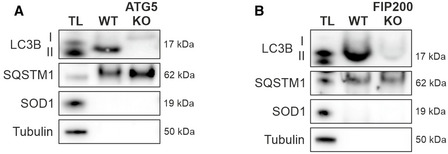
-
A, BWestern blot analysis of purified structures from ATG5 KO HeLa cells (A) and FIP200 KO MEFs (B). Isolations were performed with an antibody directed against LC3B and are represented with total lysate (TL). Shown blots are representative for three independent experiments.
To gain deeper insights into antibody specificity and identity of the isolated structures in WT HeLa cells, we determined the co‐localization of antibodies directed against LC3B and all GABARAP isoforms using FACS (Fig 1E, Appendix Fig S5). Importantly, both antibodies co‐localized on approx. 93% of positive events. Concurrently, only a minor fraction was decorated exclusively by one ATG8 protein, which was possibly due to insufficient antibody binding and/or the presence of nonautophagic vesicles, such as LC3‐associated phagosomes (Sanjuan et al, 2007). However, we treated cells with bafilomycin A1 prior to isolation, which resulted in the substantial accumulation of autophagic vesicles within cells and, moreover, reduced the recruitment of LC3 to nonautophagic lipidation processes (Florey et al, 2015; Stempels et al, 2022). This substantiated the clear predominance of autophagic vesicles within isolate fractions of WT HeLa cells.
To directly visualize and characterize the purified structures, we performed microscopy. Differential interference contrast microscopy showed vesicular structures of different sizes without evidence of cellular debris or accumulations of other cellular material (Fig 2A). This was validated by negative stain electron microscopy, which identified intact vesicles (Fig 2B), whose inner core often showed a granular appearance and was filled with darkly stained materials most likely resembling proteinous cargoes.
Figure 2. Isolated autophagic vesicles are sealed.

- Differential interference contrast microscopy images of purified autophagic vesicles at high (I) or low (II) dilution. Images are representative of three independent approaches. Scale bar = 10 μm.
- Negative stain electron microscopy images of isolated vesicles. Scale bar = 500 nm.
- Size evaluation of isolated vesicles. The diameters of approx. 60 individual vesicles were determined using EM images. Statistics are depicted as mean ± SD.
- Western blot analysis of isolated autophagic vesicles upon proteinase K digestion. Mechanically opened vesicles served as positive control. For negative control, isolates were incubated with BSA instead of proteinase K. Depicted are two different blots that are representative for five independent experiments.
Size evaluation of isolated vesicles demonstrated that their diameters ranged from 340 to 1,150 nm (Fig 2C), fully consistent with the size described for autophagosomes (Mizushima et al, 2002). Interestingly, the enriched vesicles could be clustered into different size groups: the group with the smallest diameters covered 426 nm on average, and the largest grouped with a mean diameter of 1,034 nm. Covering 42%, the most abundant vesicles showed a mean size of 651 nm in diameter. Thus, microscopical visualization confirmed the purification of sealed vesicles that showed typical size characteristics of autophagic vesicles.
To further investigate whether the isolated autophagic vesicles were intact, we used proteinase K digestion and analyzed its impact on SQSTM1/p62 (Fig 2D). In closed vesicles, the cargo receptor is inaccessible and protected from degradation by the proteinase (Velikkakath et al, 2012). Indeed, SQSTM1/p62 was not prominently degraded, indicating that the majority of autophagic structures were sealed. For control, we opened vesicles mechanically, which resulted in the exhaustive digestion of the cargo receptor.
Thus, the antibody‐based FACS‐mediated isolation approach efficiently enriched intact native autophagic vesicles at large quantities, which qualified the isolates for subsequent PL and cargo profiling.
Phospholipid composition of native autophagic vesicles
The autophagosome shows explicit requirements regarding membrane curvature and fusion ability, which is determined by a distinct PL composition (Schutter et al, 2020; Laczko‐Dobos et al, 2021). However, the PLs of native human autophagosomes are elusive so far, and thus, we performed targeted multiplex quantitative MS to quantify distinct PL species and associated fatty acids of isolated autophagic vesicles.
Importantly, we identified all analyzed PL classes within autophagic vesicles with diverse fatty acid combinations concerning chain length and saturation level (Fig 3A). Compared with HeLa total lysates, the PL composition was essentially altered. In particular, the short‐chained form of phosphatidylcholine (PC) was significantly enriched and accounted for approx. 42% of all detected PLs in autophagic vesicles. Remarkably, phosphatidylinositol (PI) was exclusively represented with its short‐chained variant, and phosphatidylglycerol (PG) was almost completely excluded.
Figure 3. Phospholipid profiles of isolated autophagic vesicles.

- Phospholipids identified in isolated autophagic vesicles in comparison with HeLa total lysates. Relative amounts were calculated based on total levels of detected phospholipids. PC, phosphatidylcholine; PE, phosphatidylethanolamine; PI, phosphatidylinositol; PS, phosphatidylserine; PG, phosphatidylglycerol; SM, sphingomyelin.
- Distribution of SM within HeLa cells. BODIPY FL C5‐SM (green) was used to localize SM. Nuclei were stained by DAPI. Shown image is representative for 28 slices of three independent experiments. Scale bar = 20 μm.
- Immunocytochemical analysis of SM (green) and LC3B (red). DAPI was used to stain nuclei. Shown image is representative for 33 slices from three independent experiments. Pearson's correlation coefficient for co‐localization: 0.44 ± 0.09. Single channels are presented in Appendix Fig S6A. Scale bars = 20 or 2 μm.
- Immunocytochemical analysis of SM (green), LC3B (red), and LAMP2 (blue). Shown image is representative for 21 slices of three independent experiments. Single channels are presented in Appendix Fig S6B. Scale bars = 20 or 2 μm.
- Phospholipids identified in autophagic vesicles isolated upon different conditions. Relative amounts were calculated based on total levels of detected phospholipids. Abbreviations are depicted in (A).
Data information: (A, E) Statistics are depicted as mean ± SD of three independent samples for each condition; one‐way ANOVA; *P ≤ 0.05; **P ≤ 0.01; ***P ≤ 0.001. No significant alterations were observed in (E).
Excitingly, besides phosphoglycerides, we also observed sphingomyelin (SM) within the isolate fractions (Fig 3A). SM is the only PL that is not exclusively synthesized within the ER, but is generated from ceramide within the Golgi apparatus. The PL is commonly found at the Golgi network, the plasma membrane, in the endocytic system, and in lysosomes (Slotte, 2013).
To confirm the presence of SM in autophagic vesicles, we analyzed the co‐localization of SM and LC3B employing immunocytochemistry. Dye‐conjugated SM was detected at the expected cellular compartments and, indeed, co‐localized with LC3B‐positive structures (Figs 3B and C, and EV3, Appendix Fig S6A). However, the isolation approach does not distinguish between autophagosomes and autolysosomes, the autophagosome‐lysosome fusion product. Consequently, autolysosomes will also be present within the isolate fractions and could be the source of the detected SM. Thus, to further elucidate the identity of SM‐ and LC3B‐positive vesicles, we analyzed their co‐localization with the lysosome marker LAMP2. Importantly, we observed autolysosomes, positive for all three markers, but also vesicles solely positive for SM and LC3B (Fig 3D, Appendix Fig S6B), indicating that SM is a component of autophagic vesicles.
Figure EV3. Localization analysis of SM within HeLa cells.

- SM is localized at the trans‐Golgi network. Immunocytochemical analysis of SM (green) and TGN (red). DAPI was used to stain nuclei. Shown images are representative for 27 slices of three independent experiments. Pearson's correlation coefficient for co‐localization: 0.57 ± 0.08. Scale bars: 20 and 2 μm.
- SM is localized at lysosomes. Immunocytochemical analysis of SM (green) and LAMP2 (red). Nuclei were stained by DAPI. Shown images are representative for 30 slices of three independent experiments. Pearson's correlation coefficient for co‐localization: 0.62 ± 0.1. Scale bars: 20 and 2 μm.
Since SM is mainly located in post‐Golgi compartments, ATG9A is a key candidate to potentially mediate the trafficking of this particular PL to the site of autophagosome formation. ATG9A‐positive vesicles cycle between the Golgi‐endosomal compartment and the site of autophagosome formation, delivering lipids and proteins to facilitate phagophore nucleation and maturation (Gomez‐Sanchez et al, 2021). However, since the lipidomics analysis was performed with intact autophagic vesicles, a distinct fraction of detected PLs might indeed derive from engulfed membranous materials.
Next, we investigated whether altered rates of autophagy affect the PLs present within autophagic vesicles. Autophagy is highly dynamic and the rate of autophagosome formation rapidly adapts to satisfy cellular requirements (Gamerdinger et al, 2009; He & Klionsky, 2009). However, the impact of different levels of autophagy on the PLs of autophagic vesicles is mostly elusive. Therefore, besides vesicles isolated under basal autophagy conditions, we additionally investigated the PLs of autophagic vesicles purified upon EBSS‐induced starvation and MG132‐mediated proteasome inhibition. Starvation enhanced autophagy, while the longer period of proteasome inhibition resulted in a decreased autophagic activity (Fig EV4). Importantly, we observed that the PLs were unaffected by the treatments (Fig 3E). Compared with autophagic vesicles enriched under basal autophagy conditions, the PL composition was not altered by starvation or proteasome inhibition. Thus, the PL pattern is maintained under changing rates of autophagosome formation, indicating that discrete PLs are indeed important for structure and function of autophagic vesicles.
Figure EV4. Autophagic activity upon EBSS‐induced starvation and MG132‐mediated proteasome inhibition.

- Western blot analysis of autophagic activity upon different treatments. Cells were treated with EBSS or MG132 for 2 or 8 h, respectively, and DMSO (control) or bafilomycin A1 was added for the last 2 h. LC3B‐II levels were corrected over the loading control tubulin. Shown blots are representative for three independent experiments. Statistics are depicted as mean ± SD; One‐Way ANOVA, *P ≤ 0.05; **P ≤ 0.01.
- Immunocytochemical stainings of LC3B (red). Nuclei were stained with DAPI. Shown images are representative for 12 stacks of three independent experiments. Scale bar: 20 μm.
In conclusion, lipidomics analyses yielded in the characterization of PLs present within autophagic vesicles under different autophagy conditions. These data are the basis for novel insights into the structural composition of native human autophagic vesicles and stressed the potential of the antibody‐based FACS‐mediated isolation approach.
Protein cargo profiles of native autophagic vesicles
The FACS‐based isolations enabled the enrichment of intact autophagic vesicles at large quantities, which qualified the isolates for cargo profiling using quantitative LC–MS/MS.
We investigated the protein content of autophagic vesicles purified under basal autophagy conditions and detected 4,514 cargo proteins in total, including multiple autophagosomal proteins (Dataset EV1, Appendix Fig S7A). Pathway analysis of the three independently performed approaches showed only subtle changes (Appendix Fig S7B), confirming the quality of each isolation, protein processing, and quantitative MS.
To investigate the impact of different autophagy conditions on cargo composition, we compared the cargo profiles of vesicles enriched under basal autophagy conditions with the protein content of vesicles purified upon EBSS‐induced starvation or MG132‐mediated proteasome inhibition.
Interestingly, starvation showed only minor effects on the protein content despite a significantly enhanced autophagic activity (Fig 4A, Appendix Fig S8). Thus, nutrient deprivation resulted in a globally increased turnover of autophagy substrates without the selection of particular cargoes.
Figure 4. Protein profiles of isolated autophagic vesicles upon different autophagy conditions.

- Volcano plot showing the differential appearance of proteins in autophagic vesicles of EBSS‐treated cells in comparison with vesicles isolated under basal autophagy. Log2‐transformed fold changes. For proteins that were excluded from autophagic vesicles upon EBSS treatment or which exclusively appeared within these vesicles, no fold changes could be calculated and they are indicated as not determinable (nd).
- Volcano plot showing the differential appearance of proteins in autophagic vesicles of MG132‐treated cells in comparison with vesicles isolated upon basal autophagy. Log2‐transformed fold changes. For proteins that were excluded from autophagic vesicles upon MG132 treatment or which exclusively appeared within these vesicles, no fold changes could be calculated and they are indicated as not determinable (nd).
- KEGG pathway analysis of proteins with enhanced localization in autophagic vesicles upon MG132 treatment. Pathways are presented with the number of proteins found in the data set and computed FDRs for enrichment.
- KEGG pathway analysis of proteins with reduced appearance in autophagic vesicles upon MG132 treatment. Pathways are presented with the number of proteins found in the data set and computed FDRs for enrichment.
In contrast to starvation, proteasome inhibition showed stronger effects on the cargo profile (Fig 4B). A prominent subset of proteins with enhanced appearance in autophagic vesicles grouped within the proteasome pathway, including multiple proteasome subunits and factors of the ubiquitination process (Figs 4C and EV5A). Thus, inhibition of the proteasome resulted in the enhanced autophagic degradation of components of the ubiquitin–proteasome system in HeLa cells. Interestingly, proteins of the lysosome pathway, such as LAMP proteins and several acidic hydrolases, appeared at decreased levels within autophagic vesicles (Figs 4D and EV5B). Since MG132 treatment reduced autophagic activity (Fig EV4), the declined abundance might be due to lower numbers of autolysosomes present within the isolate fractions.
Figure EV5. Protein cargo analysis of autophagic vesicles upon proteasome inhibition.

-
A, BString analysis of proteins with enhanced (A) or reduced (B) abundance in autophagic vesicles upon MG132 treatment.
In conclusion, protein cargo analysis resulted in the detailed representation of autophagy substrates upon different autophagy conditions and revealed treatment‐specific alterations upon proteasome inhibition. This emphasized the quality of the antibody‐based FACS‐mediated isolation approach and highlighted its value to investigate protein contents of native autophagic vesicles.
In summary, here we introduce a powerful method to purify native autophagic vesicles without the requirement of exhaustive cellular fractionation or genetic manipulation. The antibody‐based FACS‐mediated isolation approach resulted in the enrichment of large numbers of intact autophagic vesicles, which enabled profound investigations of their PL and protein cargo profiles.
Materials and Methods
Reagents and Tools table
| Reagent/Resource | Reference or source | Identifier or catalog number |
|---|---|---|
| Experimental models | ||
|
HeLa WT (Homo sapiens) |
Prof Christian Behl | |
|
HeLa ATG5 KO (Homo sapiens) |
Prof Christian Behl | |
|
HeLa HA‐GABARAP (Homo sapiens) |
Prof Christian Behrends | |
|
MEF WT (Mus musculus) |
Prof Ivan Dikic | |
|
MEF FIP200 KO (Mus musculus) |
Prof Ivan Dikic | |
| Antibodies | ||
| Rabbit polyclonal anti‐MAP1LC3B (FlowCyt 4 μg; IF 1:200) | Novus | NB100‐2220 |
| Rabbit polyclonal anti‐MAP1LC3B‐AlexaFluor647 (FlowCyt 2 μg/4 μg) | Novus | NB100‐2220AF647 |
| Rabbit polyclonal anti‐MAP1LC3B (WB 1:500) | Sigma | L7543 |
| Mouse monoclonal [2G6] anti‐MAP1LC3B (IF 1:200) | Nanotools | 0260‐100/LC3‐2G6 |
| Mouse monoclonal [2G6] anti‐MAP1LC3B‐Fluorescein (FlowCyt 1 μg) | Enzo | BML‐PW1205‐0025 |
| Rabbit monoclonal [EPR4805] anti‐GABARAP+GABARAPL1+GABARAPL2 (FlowCyt 1 μg/4 μg; WB 1:500) | Abcam | ab109364 |
| Rabbit monoclonal [EPR4805] anti‐GABARAP+GABARAPL1+GABARAPL2‐APC (FlowCyt 2 μg) | Abcam | ab223949 |
| Rabbit polyclonal anti‐HA (FlowCyt 4 μg; IF 1:200) | Sigma | H6908 |
| Mouse monoclonal [6E2] anti‐HA (WB 1:500) | Cell Signaling | 2367 |
| Guinea pig polyclonal anti‐SQSTM1 (WB 1:500) | Progen | GP62‐C |
| Rabbit polyclonal anti‐ZFYVE1 (DFCP1) (WB 1:500) | ABclonal | A7527 |
| Mouse monoclonal [AP125] anti‐PLIN2 (WB 1:500) | Progen | 610102 |
| Rabbit polyclonal anti‐Sirt4 (WB 1:500) | Abcam | ab90485 |
| Mouse monoclonal [58K‐9] anti‐ 58K Golgi protein (FTCD) (WB 1:500) | Abcam | ab27043 |
| Mouse monoclonal [DM1A] anti‐Tubulin α (WB 1:500) | Sigma | T9026 |
| Mouse monoclonal [30F11] anti‐SOD1 (WB 1:500) | Leica Biosystems (Novocastra) | NCL‐SOD1 |
| Rabbit monoclonal [D5F5U] anti‐ATG5 (WB 1:500) | Cell Signaling | 12994 |
| Rabbit monoclonal [D10D11] anti‐FIP200 (WB 1:500) | Cell Signaling | 12436 |
| Mouse monoclonal [H4B4] anti‐LAMP2 (IF 1:200) | Abcam | ab25631 |
| Sheep polyclonal anti‐TGN46 (IF 1:200) | BioRad | AHP500 |
| Donkey polyclonal anti‐rabbit‐Cy3 (IF 1:200) | Jackson ImmunoResearch | 711‐165‐152 |
| Donkey polyclonal anti‐mouse‐Cy3 (IF 1:200) | Jackson ImmunoResearch | 715‐165‐151 |
| Donkey polyclonal anti‐sheep‐Cy3 (IF 1:200) | Jackson ImmunoResearch | 713‐165‐147 |
| Donkey polyclonal anti‐rabbit‐Cy5 (FlowCyt 3 μg/12 μg; IF 1:200) | Jackson ImmunoResearch | 711‐175‐152 |
| Donkey polyclonal anti‐mouse‐Cy5 (IF 1:200) | Jackson ImmunoResearch | 715‐175‐150 |
| Donkey polyclonal anti‐rabbit‐HRP (WB 1:7,000) | Jackson ImmunoResearch | 711‐035‐152 |
| Donkey polyclonal anti‐mouse‐HRP (WB 1:7,000) | Jackson ImmunoResearch | 715‐035‐151 |
| Donkey polyclonal anti‐guinea pig‐HRP (WB 1:7,000) | Jackson ImmunoResearch | 706‐035‐148 |
| Chemicals, enzymes, and other reagents | ||
| Acetonitrile | Carl Roth | AE70.1 |
| Antibiotic‐antimycotic solution | Sigma | A5955 |
| Bafilomycin A1 | Biozol | TRCB110000 |
| BODIPY FL C5‐shingomyelin | Fisher Scientific | 11510306 |
| BSA | Sigma | A7906 |
| CHAPS | Carl Roth | 1479 |
| Chloroacetamide | Sigma | 22790 |
| Chloroform | Carl Roth | 4432 |
| DAPI | Calbiochem | 382061 |
| DMEM | Thermo Fisher Scientific | 41965‐039 |
| DMSO | Carl Roth | A994.1 |
| EBSS | Sigma | E2888 |
| EDTA‐free protease inhibitor | Roche | 11873580001 |
| Empore SDB‐RPS | CDS Empore | 13‐110‐022 |
| FBS | Thermo Fisher Scientific | 10437‐028 |
| Formic acid solution | Merck | 1.11670.0250 |
| Isopropanol | Carl Roth | AE73.1 |
| LysC | Wako Chemicals | 4987481427648 |
| Methanol | VWR | 20903.368 |
| MG132 | Sigma | P0042 |
| Nonfat dried milk powder | AppliChem | A0830 |
| PBS | Sigma | D8537 |
| PMSF | Sigma | P7626 |
| Proteinase K | Roche | 03115887001 |
| ROTI Histofix (PFA), 4% | Carl Roth | P087 |
| Sodium deoxycholate | Applichem | A1531 |
| Sodium pyruvate | Thermo Fisher Scientific | 11360070 |
| TCEP | Sigma | 646547 |
| TFA | Sigma | 302031 |
| TRIS | Carl Roth | 4855 |
| Trypsin | Promega | V5113 |
| Trypsin/EDTA | Thermo Fisher Scientific | 15400054 |
| Tween20 | Carl Roth | 9127 |
| Urea | VWR | 28877.235 |
| Software | ||
| Aida Image Analyzer 4.26 | Raytest | |
| CorelDraw 2022 | Corel Corporation | |
| Cytoscape 3.8.2 | Cytoscape Consortium | |
| Excel 2016 | Microsoft | |
| FIJI ImageJ 1.53c | GNU General Public License | Nature Methods, 9(7), 676–682 |
| FlowJo 10.6.1 | BD Biosciences | |
| GIMP 2.8 | GNU General Public License | |
| GraphPad Prism 6.0 | GraphPad Software | |
| MaxQuant 1.6.17 | Max Planck Institute of Biochemistry | |
| Multiquant 3.0.3 | AB Sciex | |
| SigmaStat 4.0 | Systat Software | |
| Other | ||
| AF7000 widefield microscope | Leica | |
| Amersham Imager 600 | GE Healthcare Life Science | |
| Amicon Ultra‐15 filters | Merck | UFC901024 |
| BCA Protein‐Assay‐Kit | Thermo Fisher Scientific | J63283.QA |
| EASY‐nCL 1200 | Thermo Fisher Scientific | |
| FACSAria III SORP | BD Biosciences | |
| LSM710 laser scanning microscope | Zeiss | |
| LSRFortessa SORP | BD Biosciences | |
| NuPage Bis‐Tris gels | Thermo Fisher Scientific | NP0335 |
| Optima MAX‐XP Ultracentrifuge; TLA120.2 and TLA110 rotor | Beckman Coulter | |
| Precellys 24 | Bertin Technologies | |
| QExactive HF mass spectrometer | Thermo Fisher Scientific | |
| QTRAP 55500 mass spectrometer | AB Sciex | |
| ReproSil‐Pur Fused‐silica column C18 | Dr. Maisch | |
| TEM900 transmission electron microscope (2K CCD camera) |
Zeiss (TRS Tröndle) |
|
| Trans‐Blot Turbo RTA mini nitrocellulose transfer kit | BioRad | 170‐4270 |
| UP50H ultrasonic processor | Hielscher | |
| Venor GeM Mycoplasma PCR detection kit | Minerva Biolabs | 11‐1050 |
| Vivaspin 2 filters | VWR | 512‐3760 |
Methods and Protocols
Cell culture
Cells were cultivated in DMEM, supplemented with 10% fetal bovine serum, 1 mM sodium pyruvate, and 1 × antibiotic‐antimycotic solution at 37°C in a 5% CO2‐humidified atmosphere. HeLa cell identity was authenticated via STR analysis, and cells were regularly tested negative for the presence of mycoplasma using the Venor GeM Mycoplasma PCR detection kit (Minerva Biolabs, 11‐1050). Stock solutions of bafilomycin A1 (Biozol, TRCB110000) and MG132 (Sigma, P0042) were prepared in DMSO. For starvation, cells were treated with serum‐free EBSS for 2 h. For proteasome inhibition, cells were incubated with 10 μM MG132 for 8 h. Bafilomycin A1 was added to each condition 2 h before cells were collected. To generate ATG5 KO HeLa cells, ATG5‐targeting CRISPR/Cas9 plasmids were obtained from Manuel Kaulich (Frankfurt, Germany). HeLa cells were transfected with 15 μg of plasmids, and positive clones were selected using culture medium containing 1 mg/ml puromycin. KO clones were identified via immunoblotting and qPCR.
FACS‐based isolation of autophagic vesicles
At least 1 × 10⁷ cells were collected using Trypsin/EDTA, centrifuged with 306 g for 4 min, and resuspended in PBS supplemented with EDTA‐free protease inhibitor (Roche, 11873580001). Cell disruption was performed using a UP50H ultrasonic processor (Hielscher) for 3 × 2 s with an amplitude of 60%. Lysates were centrifuged with 3,000 g for 10 min at 4°C, and supernatants were collected and centrifuged with 150,000 g (rav) for 30 min at 4°C using an Optima™ MAX‐XP Ultracentrifuge (Beckman Coulter; TLA120.2 rotor). Pellets were resuspended in PBS, and 4 μg of primary antibody was added for 30 min, followed by the addition of 12 μg Cy5‐conjugated secondary antibody for 1 h. Alternatively, resuspended pellets were incubated in 4 μg of fluorophore‐conjugated primary antibody for 1 h. The samples were centrifuged with 150,000 g (rav) for 30 min at 4°C, and pellets were resuspended in PBS. Autophagic vesicle sortings were performed using a BD FACSAria III SORP (BD Biosciences) equipped with a 70 μm nozzle and a 1.0 FSC neutral density filter. The autophagic vesicles containing compartment was first established using an FSC/SSC plot on a logarithmic scale, followed by a doublet discrimination gate using SSC‐A/W. Autophagic structures were defined as Cy5‐positive events (640 nm, BP 670/30), whose positivity was conducted according to the background given by an unstained and a secondary antibody‐only negative control. Cy5‐positive autophagic vesicles were sorted at minimum speed (flow rate < 3.0) maintaining < 19,000 events per second. Analysis was performed using FlowJo v10.6.1 (BD Biosciences). Primary antibodies: MAP1LC3B (Novus, NB100‐2220); GABARAP+GABARAPL1+GABARAPL2 (Abcam, ab109364); HA (Sigma, H6908); MAP1LC3B‐AlexaFluor647 (Novus, NB100‐2220AF647). Secondary antibody: Cy5 anti‐rabbit (ImmunoResearch, 711‐175‐152).
FACS‐based analysis of antibody co‐localization
Approximately 1 × 10⁶ cells were prepared for FACS analysis as described above using 1 μg primary and 3 μg secondary antibody. Here, a fluorophore‐conjugated primary antibody (1 μg) was used in parallel. Autophagic vesicles were defined as Cy5‐positive (640 nm, BP 670/30) and Alexa Fluor 488‐ or Fluorescein‐positive events (488 nm, BP 530/30). Positivity was conducted according to the background given by an unstained, a secondary antibody‐only, and an unconjugated primary antibody/secondary antibody (Cy5)‐only negative control. Analysis was performed using FlowJo v10.6.1 (BD Biosciences). Primary antibodies: GABARAP+GABARAPL1+GABARAPL2 (Abcam, ab109364); MAP1LC3B‐Fluorescein (Enzo, BML‐PW1205‐0025); Secondary antibody: Cy5 anti‐rabbit (ImmunoResearch, 711‐175‐152).
FACS‐based analysis of ATG5 KO HeLa cells and FIP200 KO MEFs
5 × 10⁶ cells were prepared for FACS analysis as described above using 2 μg fluorophore‐conjugated primary antibody and were concentrated using Vivaspin 2 filters (VWR, 512‐3760). FACS analysis was performed using the LSRFortessa SORP (BD Biosciences) flow cytometer. Autophagic vesicles were defined as APC‐or AF647‐positive (640 nm, BP 670/30) events. Positivity was conducted according to the background given by an unstained negative control. Analysis was performed using FlowJo v10.6.1 (BD Biosciences). Primary antibodies: Recombinant GABARAP+GABARAPL1+GABARAPL2‐APC [EPR4805] (Abcam, ab223949); MAP1LC3B‐AlexaFluor647 (Novus, NB100‐2220AF647).
Western blotting
Western blot analyses were performed as previously described (Bekbulat et al, 2020). Proteins of isolated autophagic vesicles were precipitated using a methanol/chloroform (2:1) precipitation protocol and resuspended in urea buffer (8 M urea and 4% (w/v) CHAPS in 30 mM Tris (pH 8.5 with HCl)), including EDTA‐free protease inhibitor. Usually, 5 μg of total lysate and precipitated proteins of 1–2 × 10⁶ autophagic vesicles was subjected to 4–12% NuPage Bis‐Tris gels (Thermo Scientific, MP0335) and transferred onto a nitrocellulose membrane using the Trans‐Blot Turbo RTA mini nitrocellulose transfer kit (BioRad, 170‐4270). After blocking with 5% fat‐free milk in PBS‐Tween20, the membrane was probed with appropriate primary and HRP‐conjugated secondary antibodies. Proteins were visualized via chemiluminescence using the Amersham Imager 600 (GE Healthcare Life Science). Quantification was performed using Aida Image Analyzer v4.26 (Raytest). Primary antibodies: MAP1LC3B (Sigma, L7543); GABARAP+GABARAPL1+GABARAPL2 (Abcam, ab109364); SQSTM1 (Progen, GP62‐C); Tubulin α (Sigma, T9026); HA (Cell Signaling, 2367); ZFYVE1 (DFCP1) (ABclonal, A7527); PLIN2 (Progen, 610102); SIRT4 (Abcam, ab90485); Golgi58/FTCD (Abcam, ab27043); SOD1 (Leica Biosystems, NCL‐SOD1) ATG5 (Cell Signaling, 12994), FIP200 (Cell Signaling, 12436). Secondary antibodies: Peroxidase anti‐guinea pig (ImmunoResearch, 706‐035‐148); Peroxidase anti‐mouse (ImmunoResearch, 715‐035‐151); Peroxidase anti‐rabbit (ImmunoResearch, 711‐035‐152).
Proteinase K digest
Five microgram per milliliter proteinase K was supplemented to purified autophagic vesicles (5 × 10⁶) and incubated for 15 min on ice. To stop enzyme activity, PMSF (100 mM) was added for 5 min and proteins were immediately precipitated using a methanol/chloroform (2:1) precipitation protocol. For positive control, isolated autophagic structures were sonicated using a UP50H ultrasonic processor (Hielscher) for 3 × 3 s with an amplitude of 80% before proteinase K supplementation. For negative control, 5 μg/ml BSA instead of proteinase K was added to the samples.
Immunocytochemistry
Immunocytochemistry was performed as previously described (Bekbulat et al, 2020). Briefly, cells were grown on glass coverslips, fixated with 4% PFA, and permeabilized with 90% (v/v) methanol. Unspecific binding sites were blocked with 3% BSA in PBS followed by incubation with primary antibody, fluorophore‐conjugated secondary antibody, and DAPI. For sphingomyelin analyses, cells were treated with 500 nM BODIPY FL C5‐shingomyelin (Fisher, 11510306) in serum‐free EBSS for 1 h and thereafter were incubated for 1 h with bafilomycin A1 in EBSS. Cells were imaged using the laser scanning microscope LSM710 (Zeiss). Primary antibody: MAP1LC3B (Nanotools, 0260‐100/LC3‐2G6); MAP1LC3B (Novus, NB100‐2220); SQSTM1 (Progen, GP62‐C); LAMP2 (Abcam, ab25631); TGN46 (BioRad, AHP500); HA (Sigma, H6908). Secondary antibody: Cy3 anti‐mouse (ImmunoResearch, 715‐165‐151), Cy3 anti‐rabbit (ImmunoResearch, 711‐165‐152), Cy3 anti‐sheep (ImmunoResearch, 713‐165‐147), Cy5 anti‐mouse (ImmunoResearch, 715‐175‐150), Cy5 anti‐rabbit (ImmunoResearch, 711‐175‐152).
Microscopical analysis
For differential interference contrast microscopy, isolated autophagic vesicles were concentrated using Amicon Ultra‐15 filters (Merck, UFC901024) and dried on the surface of microscope slides. After sealing the samples with glass coverslips, they were imaged using the widefield microscope AF7000 (Leica).
For negative stain electron microscopy, 5 μl of the isolate fractions was applied onto freshly prepared Formvar‐coated copper mesh EM grids and incubated for 1 min at RT. Then, excess liquid was drained by using filter paper and grids were dried at RT. Ten microliter of a 2% (w/v) uranyl acetate (UA) solution was applied to the grid and incubated for 30 s. The grid was washed 3 × using drops of distilled water and drained using filter paper. The grid was dried overnight at RT and analyzed using a TEM900 (Zeiss) operated at 80 keV and equipped with a wide‐angle dual‐speed digital 2K CCD camera (TRS Tröndle).
Lipidomics
Lipids were extracted from isolated autophagic vesicles using a liquid–liquid extraction method previously described (Lerner et al, 2017). Briefly, the preparations were allowed to thaw at 4°C. One thousand microliter methyl tert‐butyl‐ether (MTBE)/methanol (10:3, v/v) spiked 10 μl of internal standard mixture for PLs and 250 μl 0.1% formic acid containing 5 μM THL/URB and 10 μg/ml BHT were added, and samples were subjected to homogenization for 20 s at 6,000 rpm with a Precellys 24 (Bertin Technologies), were vortexed for 30 s at 4°C, and centrifuged for 10 min at 13,000 rpm at 4°C. Then, samples were allowed to freeze at −20°C for 15 min, and the upper organic phase containing lipids was recovered and dried under a gentle stream of nitrogen at 37°C. The dried lipid extracts were re‐solubilized in 90 μl methanol and stored at −20°C until analysis. The aqueous phase containing proteins was stored at −20°C for BCA assay protein content determination, which was used for normalization of PL values. Lipids were analyzed by liquid‐chromatography multiple reaction monitoring (LC/MRM) on a QTRAP 55500 mass spectrometer (AB Sciex) operated in positive negative ion mode switching. The chromatographic, ionization and detection conditions were set as previously described (Lerner et al, 2017). The MRM transitions for the analysis of selected PLs and calibration standards used for quantification were set as previously reported (Lerner et al, 2017, 2019). For LC/MRM analysis, 3 μl water was added to a 27 μl methanolic solution of extracted lipids and 10 μl of this solution was injected into the LC/MRM instrument. Lipids were quantified using Multiquant 3.0.3 software, and determined levels were normalized to the protein content of the samples.
Proteomics
8 × 10⁶ autophagic vesicles were denatured with 2% sodium deoxycholate, 50 mM Tris–HCl pH 8.5, 2.5 mM TCEP, 10 mM chloroacetamide at 95°C for 10 min. Lysates were prepared with in‐StageTip (iST) processing method for LC–MS/MS as previously described by (Kulak et al, 2014). Briefly, proteins were digested overnight at 37°C with 1 vol of 50 mM Tris–HCl pH 8.5 containing LysC (Wako Chemicals) at 1:100 (w/w) ratio and trypsin (Promega, V5113) at 1:100 (w/w) ratio. Digestion was stopped with 2 vol of 1% TFA in isopropanol. Digested peptides were purified with Empore SDB‐RPS (styrenedivinylbenzene—reverse phase sulfonate) disks in stage tip (CDS Empore) and were dried for LC–MS/MS.
Dried peptides of each sample were resuspended in 2% (v/v) acetonitrile/1% (v/v) formic acid solution. Peptides were separated with Easy‐nLC 1200 (Thermo Fisher Scientific) using a 30 cm long, 75 μm inner diameter fused‐silica column packed with 1.9 μm C18 particles (ReproSil‐Pur, Dr. Maisch) and kept at 50°C using an integrated column oven (Sonation). Individual peptides were eluted by a nonlinear gradient from 4 to 28% acetonitrile over 120 min, followed by a step‐wise increase to 76% acetonitrile in 6 min, which was kept for another 9 min and sprayed into a QExactive HF mass spectrometer (Thermo Fisher Scientific). Full‐scan MS spectra (300–1,650 m/z) were acquired with a resolution of 60,000 at m/z 200, maximum injection time of 20 ms and AGC target value of 3 × 10⁶. The 15 most intense precursors were selected for fragmentation (Top 15) and isolated with a quadrupole isolation window of 1.4 Th. MS2 scans were acquired in centroid mode with a resolution of 15,000 at m/z 200, a maximum injection time of 25 ms, AGC target value of 1 × 10⁵. Ions were then fragmented using higher energy collisional dissociation (HCD) with a normalized collision energy (NCE) of 27; and the dynamic exclusion was set to 25 s to minimize the acquisition of fragment spectra of already acquired precursors.
Raw files were analyzed with MaxQuant 1.6.17 with default settings using human trypsin digested “one sequence per gene” proteome database (Homo sapiens SwissProt database [TaxID:9606, version 2020‐03‐12]) with label‐free quantification (Cox & Mann, 2008). Carbamidomethyl on cysteines was set as fixed modification, and acetyl on the protein N‐term and methionine oxidation on methionines were set as variable modifications. Protein quantification and data normalization relied on the MaxLFQ algorithm implemented in MaxQuant and used for statistical analysis (Cox et al, 2014). Proteins only identified by a single modified peptide or matching to the reversed or contaminants databases were removed. Only well‐quantified proteins and showing no missing value in any of the samples were used for statistical analysis. Significantly altered proteins were determined by a two‐sided, unpaired Student's t‐test (P‐value < 0.05) adding minimum fold‐change cut‐off (≥ 0.5) with GraphPad Prism 6 or Microsoft Excel 2016. No fold change could be calculated is indicated as not determinable (nd) in the volcano plots.
Protein pathway network analysis was performed with Cytoscape (Shannon et al, 2003) (version 3.8.2) in combination with StringApp, which is using STRING database (Doncheva et al, 2019). KEGG databases were used to obtain pathway enrichment (Kanehisa et al, 2010).
Statistics
In dependence of normal distribution or variance differences, statistical significance between the samples was determined by unpaired Student's t‐test or one‐way ANOVA using SigmaStat (SPSS Science). The results are shown as mean ± standard deviation (SD). Statistical significance was accepted at a level of P < 0.05 (P‐value ≤ 0.05 = *, ≤ 0.01 = **, ≤ 0.001 = ***).
Author contributions
Daniel Schmitt: Conceptualization; data curation; formal analysis; validation; investigation; writing – review and editing. Süleyman Bozkurt: Data curation; investigation; methodology; writing – review and editing. Pascale Henning‐Domres: Data curation; investigation; writing – review and editing. Heike Huesmann: Investigation. Stefan Eimer: Data curation; investigation; methodology; writing – review and editing. Laura Bindila: Data curation; investigation; methodology; writing – review and editing. Christian Behrends: Resources; data curation; writing – review and editing. Emily Boyle: Data curation; investigation; methodology; writing – review and editing. Florian Wilfling: Data curation; investigation; methodology; writing – review and editing. Georg Tascher: Data curation; investigation; methodology; writing – review and editing. Christian Münch: Data curation; investigation; methodology; writing – review and editing. Christian Behl: Data curation; supervision; writing – review and editing. Andreas Kern: Conceptualization; data curation; formal analysis; supervision; funding acquisition; validation; writing – original draft; writing – review and editing.
Disclosure and competing interests statement
The authors declare that they have no conflict of interest.
Supporting information
Appendix
Expanded View Figures PDF
Dataset EV1
PDF+
Acknowledgements
We thank Drs Stefanie Möckel, Stephanie Nick, and Jesús Gil‐Pulido of the Flow Cytometry Core Facility as well as Drs Sandra Ritz and Petri Turunen of the Microscopy and Histology Core Facility, both Institute of Molecular Biology, Mainz, for scientific help and discussions. We thank Prof Ivan Dikic, Institute of Biochemistry II, Frankfurt, for providing WT and FIP200 KO MEFs and Dr Manuel Kaulich, Institute of Biochemistry II, Frankfurt, for providing CRISPR/Cas9 plasmids. We thank Marion Basoglu for help with EM experiments conducted in the FB15 EM Facility of the Goethe University Frankfurt, which is part of the Frankfurt Center for Electron Microscopy (FCEM). We acknowledge support from the Electron Microscopy Core Facility of the Max Planck Institute of Biophysics, Frankfurt am Main. We thank the quantitative proteomics unit at IBC2 for technical support and MS measurements. This work was funded by the Deutsche Forschungsgemeinschaft (German Research Foundation)—Project‐ID 259130777‐SFB1177. Lipidomic experiments were financially supported by the Core Facility of the Clinical Lipidomics Unit, Mainz. Open access funding enabled and organized by Projekt DEAL.
EMBO reports (2022) 23: e53065
Data availability
The mass spectrometry proteomics data have been deposited to the ProteomeXchange Consortium via the PRIDE partner repository (Perez‐Riverol et al, 2019) with the dataset identifier PXD024419, https://www.ebi.ac.uk/pride/archive/projects/PXD024419.
References
- Bekbulat F, Schmitt D, Feldmann A, Huesmann H, Eimer S, Juretschke T, Beli P, Behl C, Kern A (2020) RAB18 loss interferes with lipid droplet catabolism and provokes autophagy network adaptations. J Mol Biol 432: 1216–1234 [DOI] [PubMed] [Google Scholar]
- Cox J, Mann M (2008) MaxQuant enables high peptide identification rates, individualized p.p.b.‐range mass accuracies and proteome‐wide protein quantification. Nat Biotechnol 26: 1367–1372 [DOI] [PubMed] [Google Scholar]
- Cox J, Hein MY, Luber CA, Paron I, Nagaraj N, Mann M (2014) Accurate proteome‐wide label‐free quantification by delayed normalization and maximal peptide ratio extraction, termed MaxLFQ. Mol Cell Proteomics 13: 2513–2526 [DOI] [PMC free article] [PubMed] [Google Scholar]
- Dengjel J, Hoyer‐Hansen M, Nielsen MO, Eisenberg T, Harder LM, Schandorff S, Farkas T, Kirkegaard T, Becker AC, Schroeder S et al (2012) Identification of autophagosome‐associated proteins and regulators by quantitative proteomic analysis and genetic screens. Mol Cell Proteomics 11: M111.014035 [DOI] [PMC free article] [PubMed] [Google Scholar]
- Doncheva NT, Morris JH, Gorodkin J, Jensen LJ (2019) Cytoscape StringApp: network analysis and visualization of proteomics data. J Proteome Res 18: 623–632 [DOI] [PMC free article] [PubMed] [Google Scholar]
- Florey O, Overholtzer M (2012) Autophagy proteins in macroendocytic engulfment. Trends Cell Biol 22: 374–380 [DOI] [PMC free article] [PubMed] [Google Scholar]
- Florey O, Gammoh N, Kim SE, Jiang X, Overholtzer M (2015) V‐ATPase and osmotic imbalances activate endolysosomal LC3 lipidation. Autophagy 11: 88–99 [DOI] [PMC free article] [PubMed] [Google Scholar]
- Gamerdinger M, Hajieva P, Kaya AM, Wolfrum U, Hartl FU, Behl C (2009) Protein quality control during aging involves recruitment of the macroautophagy pathway by BAG3. EMBO J 28: 889–901 [DOI] [PMC free article] [PubMed] [Google Scholar]
- Gao W, Kang JH, Liao Y, Ding WX, Gambotto AA, Watkins SC, Liu YJ, Stolz DB, Yin XM (2010) Biochemical isolation and characterization of the tubulovesicular LC3‐positive autophagosomal compartment. J Biol Chem 285: 1371–1383 [DOI] [PMC free article] [PubMed] [Google Scholar]
- Gatica D, Lahiri V, Klionsky DJ (2018) Cargo recognition and degradation by selective autophagy. Nat Cell Biol 20: 233–242 [DOI] [PMC free article] [PubMed] [Google Scholar]
- Gomez‐Sanchez R, Tooze SA, Reggiori F (2021) Membrane supply and remodeling during autophagosome biogenesis. Curr Opin Cell Biol 71: 112–119 [DOI] [PubMed] [Google Scholar]
- Hara T, Takamura A, Kishi C, Iemura S, Natsume T, Guan JL, Mizushima N (2008) FIP200, a ULK‐interacting protein, is required for autophagosome formation in mammalian cells. J Cell Biol 181: 497–510 [DOI] [PMC free article] [PubMed] [Google Scholar]
- He C, Klionsky DJ (2009) Regulation mechanisms and signaling pathways of autophagy. Annu Rev Genet 43: 67–93 [DOI] [PMC free article] [PubMed] [Google Scholar]
- Heckmann BL, Boada‐Romero E, Cunha LD, Magne J, Green DR (2017) LC3‐associated phagocytosis and inflammation. J Mol Biol 429: 3561–3576 [DOI] [PMC free article] [PubMed] [Google Scholar]
- Kabeya Y, Mizushima N, Yamamoto A, Oshitani‐Okamoto S, Ohsumi Y, Yoshimori T (2004) LC3, GABARAP and GATE16 localize to autophagosomal membrane depending on form‐II formation. J Cell Sci 117: 2805–2812 [DOI] [PubMed] [Google Scholar]
- Kanehisa M, Goto S, Furumichi M, Tanabe M, Hirakawa M (2010) KEGG for representation and analysis of molecular networks involving diseases and drugs. Nucleic Acids Res 38: D355–D360 [DOI] [PMC free article] [PubMed] [Google Scholar]
- Khaminets A, Behl C, Dikic I (2016) Ubiquitin‐dependent and independent signals in selective autophagy. Trends Cell Biol 26: 6–16 [DOI] [PubMed] [Google Scholar]
- Kirkin V, McEwan DG, Novak I, Dikic I (2009) A role for ubiquitin in selective autophagy. Mol Cell 34: 259–269 [DOI] [PubMed] [Google Scholar]
- Kishi‐Itakura C, Koyama‐Honda I, Itakura E, Mizushima N (2014) Ultrastructural analysis of autophagosome organization using mammalian autophagy‐deficient cells. J Cell Sci 127: 4089–4102 [DOI] [PubMed] [Google Scholar]
- Kulak NA, Pichler G, Paron I, Nagaraj N, Mann M (2014) Minimal, encapsulated proteomic‐sample processing applied to copy‐number estimation in eukaryotic cells. Nat Methods 11: 319–324 [DOI] [PubMed] [Google Scholar]
- Laczko‐Dobos H, Maddali AK, Jipa A, Bhattacharjee A, Vegh AG, Juhasz G (2021) Lipid profiles of autophagic structures isolated from wild type and Atg2 mutant drosophila. Biochim Biophys Acta Mol Cell Biol Lipids 1866: 158868 [DOI] [PMC free article] [PubMed] [Google Scholar]
- Lamb CA, Yoshimori T, Tooze SA (2013) The autophagosome: origins unknown, biogenesis complex. Nat Rev Mol Cell Biol 14: 759–774 [DOI] [PubMed] [Google Scholar]
- Le Guerroue F, Eck F, Jung J, Starzetz T, Mittelbronn M, Kaulich M, Behrends C (2017) Autophagosomal content profiling reveals an LC3C‐dependent piecemeal mitophagy pathway. Mol Cell 68: 786–796 [DOI] [PubMed] [Google Scholar]
- Lerner R, Post J, Loch S, Lutz B, Bindila L (2017) Targeting brain and peripheral plasticity of the lipidome in acute kainic acid‐induced epileptic seizures in mice via quantitative mass spectrometry. Biochim Biophys Acta Mol Cell Biol Lipids 1862: 255–267 [DOI] [PubMed] [Google Scholar]
- Lerner R, Pascual Cuadrado D, Post JM, Lutz B, Bindila L (2019) Broad lipidomic and transcriptional changes of prophylactic PEA administration in adult mice. Front Neurosci 13: 527 [DOI] [PMC free article] [PubMed] [Google Scholar]
- Mancias JD, Wang X, Gygi SP, Harper JW, Kimmelman AC (2014) Quantitative proteomics identifies NCOA4 as the cargo receptor mediating ferritinophagy. Nature 509: 105–109 [DOI] [PMC free article] [PubMed] [Google Scholar]
- Mercer TJ, Gubas A, Tooze SA (2018) A molecular perspective of mammalian autophagosome biogenesis. J Biol Chem 293: 5386–5395 [DOI] [PMC free article] [PubMed] [Google Scholar]
- Mizushima N (2020) The ATG conjugation systems in autophagy. Curr Opin Cell Biol 63: 1–10 [DOI] [PubMed] [Google Scholar]
- Mizushima N, Komatsu M (2011) Autophagy: renovation of cells and tissues. Cell 147: 728–741 [DOI] [PubMed] [Google Scholar]
- Mizushima N, Ohsumi Y, Yoshimori T (2002) Autophagosome formation in mammalian cells. Cell Struct Funct 27: 421–429 [DOI] [PubMed] [Google Scholar]
- Nascimbeni AC, Giordano F, Dupont N, Grasso D, Vaccaro MI, Codogno P, Morel E (2017) ER‐plasma membrane contact sites contribute to autophagosome biogenesis by regulation of local PI3P synthesis. EMBO J 36: 2018–2033 [DOI] [PMC free article] [PubMed] [Google Scholar]
- Nguyen TN, Padman BS, Usher J, Oorschot V, Ramm G, Lazarou M (2016) Atg8 family LC3/GABARAP proteins are crucial for autophagosome‐lysosome fusion but not autophagosome formation during PINK1/parkin mitophagy and starvation. J Cell Biol 215: 857–874 [DOI] [PMC free article] [PubMed] [Google Scholar]
- Nieto‐Torres JL, Leidal AM, Debnath J, Hansen M (2021) Beyond autophagy: the expanding roles of ATG8 proteins. Trends Biochem Sci 46: 673–686 [DOI] [PMC free article] [PubMed] [Google Scholar]
- Noda NN, Inagaki F (2015) Mechanisms of autophagy. Annu Rev Biophys 44: 101–122 [DOI] [PubMed] [Google Scholar]
- Osawa T, Kotani T, Kawaoka T, Hirata E, Suzuki K, Nakatogawa H, Ohsumi Y, Noda NN (2019) Atg2 mediates direct lipid transfer between membranes for autophagosome formation. Nat Struct Mol Biol 26: 281–288 [DOI] [PubMed] [Google Scholar]
- Pankiv S, Clausen TH, Lamark T, Brech A, Bruun JA, Outzen H, Overvatn A, Bjorkoy G, Johansen T (2007) p62/SQSTM1 binds directly to Atg8/LC3 to facilitate degradation of ubiquitinated protein aggregates by autophagy. J Biol Chem 282: 24131–24145 [DOI] [PubMed] [Google Scholar]
- Perez‐Riverol Y, Csordas A, Bai J, Bernal‐Llinares M, Hewapathirana S, Kundu DJ, Inuganti A, Griss J, Mayer G, Eisenacher M et al (2019) The PRIDE database and related tools and resources in 2019: improving support for quantification data. Nucleic Acids Res 47: D442–D450 [DOI] [PMC free article] [PubMed] [Google Scholar]
- Runwal G, Stamatakou E, Siddiqi FH, Puri C, Zhu Y, Rubinsztein DC (2019) LC3‐positive structures are prominent in autophagy‐deficient cells. Sci Rep 9: 10147 [DOI] [PMC free article] [PubMed] [Google Scholar]
- Sanjuan MA, Dillon CP, Tait SW, Moshiach S, Dorsey F, Connell S, Komatsu M, Tanaka K, Cleveland JL, Withoff S et al (2007) Toll‐like receptor signalling in macrophages links the autophagy pathway to phagocytosis. Nature 450: 1253–1257 [DOI] [PubMed] [Google Scholar]
- Schutter M, Giavalisco P, Brodesser S, Graef M (2020) Local fatty acid channeling into phospholipid synthesis drives phagophore expansion during autophagy. Cell 180: 135–149 [DOI] [PubMed] [Google Scholar]
- Shannon P, Markiel A, Ozier O, Baliga NS, Wang JT, Ramage D, Amin N, Schwikowski B, Ideker T (2003) Cytoscape: a software environment for integrated models of biomolecular interaction networks. Genome Res 13: 2498–2504 [DOI] [PMC free article] [PubMed] [Google Scholar]
- Slobodkin MR, Elazar Z (2013) The Atg8 family: multifunctional ubiquitin‐like key regulators of autophagy. Essays Biochem 55: 51–64 [DOI] [PubMed] [Google Scholar]
- Slotte JP (2013) Biological functions of sphingomyelins. Prog Lipid Res 52: 424–437 [DOI] [PubMed] [Google Scholar]
- Stempels FC, Janssens MH, Ter Beest M, Mesman RJ, Revelo NH, Ioannidis M, van den Bogaart G (2022) Novel and conventional inhibitors of canonical autophagy differently affect LC3‐associated phagocytosis. FEBS Lett 596: 491–509 [DOI] [PubMed] [Google Scholar]
- Stolz A, Ernst A, Dikic I (2014) Cargo recognition and trafficking in selective autophagy. Nat Cell Biol 16: 495–501 [DOI] [PubMed] [Google Scholar]
- Tsuboyama K, Koyama‐Honda I, Sakamaki Y, Koike M, Morishita H, Mizushima N (2016) The ATG conjugation systems are important for degradation of the inner autophagosomal membrane. Science 354: 1036–1041 [DOI] [PubMed] [Google Scholar]
- Valverde DP, Yu S, Boggavarapu V, Kumar N, Lees JA, Walz T, Reinisch KM, Melia TJ (2019) ATG2 transports lipids to promote autophagosome biogenesis. J Cell Biol 218: 1787–1798 [DOI] [PMC free article] [PubMed] [Google Scholar]
- Velikkakath AK, Nishimura T, Oita E, Ishihara N, Mizushima N (2012) Mammalian Atg2 proteins are essential for autophagosome formation and important for regulation of size and distribution of lipid droplets. Mol Biol Cell 23: 896–909 [DOI] [PMC free article] [PubMed] [Google Scholar]
- Weidberg H, Shvets E, Shpilka T, Shimron F, Shinder V, Elazar Z (2010) LC3 and GATE‐16/GABARAP subfamilies are both essential yet act differently in autophagosome biogenesis. EMBO J 29: 1792–1802 [DOI] [PMC free article] [PubMed] [Google Scholar]
- Zellner S, Schifferer M, Behrends C (2021) Systematically defining selective autophagy receptor‐specific cargo using autophagosome content profiling. Mol Cell 81: 1337–1354 [DOI] [PubMed] [Google Scholar]