

Abstract
Many of the diseases that plague society today are driven by a loss of protein quality. One method to quantify protein quality is to measure the protein folding stability (PFS). Here, we present a novel mass spectrometry (MS)-based approach for PFS measurement, iodination protein stability assay (IPSA). IPSA quantifies the PFS by tracking the surface-accessibility differences of tyrosine, histidine, methionine, and cysteine under denaturing conditions. Relative to current methods, IPSA increases protein coverage and granularity to track the PFS changes of a protein along its sequence. To our knowledge, this study is the first time the PFS of human serum proteins has been measured in the context of the blood serum (in situ). We show that IPSA can quantify the PFS differences between different transferrin iron-binding states in near in vivo conditions. We also show that the direction of the denaturation curve reflects the in vivo surface accessibility of the amino acid residue and reproducibly reports a residue-specific PFS. Along with IPSA, we introduce an analysis tool Chalf that provides a simple workflow to calculate the residue-specific PFS. The introduction of IPSA increases the potential to use protein structural stability as a structural quality metric in understanding the etiology and progression of human disease. Data is openly available at Chorusproject.org (project ID 1771).
Keywords: protein stability, protein folding stability, ligand binding (iron), transferrin, proteostasis, structural correlation, human blood serum measurement, TMT multiplexing
Introduction
Currently, most diagnosis and biomarker studies focus on concentration changes for proteins or other biomolecules to understand causes of a disease state or effects of drug administration. However, the concentration is not sufficient to assess whether a given protein is active and influencing patient health. Proteins need to maintain specific structures in order to perform their designated functions. There is a need to quantify the folding quality of the proteins in the context of the proteome to understand disease mechanisms and promote earlier and/or more effective treatments. The quality of individual proteins can be evaluated in part using protein folding stability (ΔG folding) as a quantifiable metric of protein structure, which is directly related to the 3-dimensional structure and functionality.1−6 Changes in protein folding are frequently associated with changes in stability. For example, the formation of thermodynamically stabile amyloid or aggregate, as is the case for many neurodegenerative diseases.7−9 A change in the protein folding stability (PFS) between conditions may indicate an individual protein’s tendency for proper function (stable2), misfolding (less stable2), and aggregation (ultrastable2) and thus quantify the quality of the measured protein.10 Ideally, such measurement should be made for each protein in the context of the entire proteome to retain the effect from the interactions with other proteins and ligands. However, the experimental techniques available currently limit studies of the PFS at the proteome level.
The PFS is traditionally measured by circular dichroism (CD) spectroscopy or thermal shift assay (ThermoFluor), both of which have been well defined experimentally and have good time resolution. The limitation for both CD and ThermoFluor is that they require purified proteins and cannot therefore be run under physiological conditions.11,12 To measure the PFS of proteins in complex mixtures and retain the proteins’ physiological environment, multiple mass spectrometry (MS)-based methods have been developed. The first general type of MS-based methods use thermal denaturation: TPP (thermal proteome profiling) and LiP (limited proteolysis) allow for proteome-wide measurements but calculate only the average stability of the entire protein or the domains of a protein. Stability information for individual residues across the protein sequence is lost.13 Moreover, it is difficult to apply thermal denaturation methods on blood serum, the most common biological source for diagnosis. This is because serum albumin (HSA), the most abundant serum protein, has a relatively high melting temperature14,15 and thus reduces the efficiency of the temperature gradient to aggregate the proteins using thermal cyclers currently commercially available.10,16 Removing HSA prior to thermal denaturation is not a viable answer as that may alter many other proteins’ PFS because HSA also stabilizes many serum proteins. The second general type of MS-based methods use chemical modification which can measure the PFS of different residues across the protein sequence. These methods build on the idea of protein footprinting, which monitors the change in an amino acid’s surface accessibility in different conditions.9,17 Thus, the PFS assay increases the accessible surface area by denaturation and then uses protein footprinting to track the surface-accessibility differences (Figure 1A) due to ligand binding or structural change. Covalent chemical probes monitor the surface-accessibility change and thus are highly protein sequence dependent. For example, SPROX (stability of proteins from rates of oxidation) uses oxidized methionine as a reporter.18,19 However, proteins may have few methionines, which limits the sequence coverage of any individual protein and makes it a challenge to measure domain-specific information. NHS-biotin is another common reagent used for protein surface modification.20,21 It mostly modifies lysine and can potentially modify serines, tyrosine, and threonine.22 The used of biotinylation has an advantage in subsequent pull-down of modified peptides.23,24 On the other hand, since NHS-biotin is also used as a cross-linker,25 the experiment needs to be carefully monitored to avoid cross-linking products and interfering with peptide identification.26 Hydrogen–deuterium exchange can provide residue specific stability information, but the deuterium modifications are exchangeable and therefore not amenable to sample fractionation strategies.27 Fast photochemical oxidation of proteins (FPOP) has high reaction efficiency and greater coverage (modifying 19 out of the 20 amino acids).28 However, the excimer laser required for FPOP is not available in most laboratories.
Figure 1.

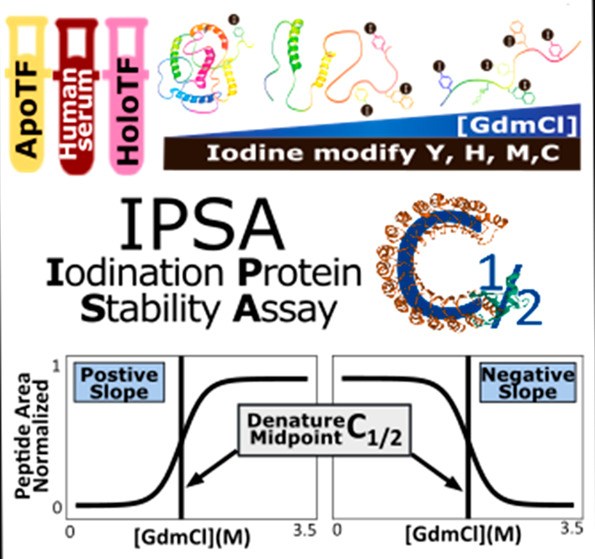
IPSA workflow. (A) Gradient of GdmCl from 0 to 6 M is added to aliquots of a sample, unfolding each type of protein within the mixture to a different degree. Then, iodine solution is added to each aliquot to modify surface-exposed Y, H, M, and C. After quenching, each aliquot is subjected to standard proteomic workflow: denaturation, reduction, alkylation, digestion, LC/MSMS acquisition, identification for protein/peptide/post-translational modification, and quantification. Quantification results are input to Chalf to obtain the C1/2 value and slope direction. (B) Chemical reaction of iodination on Y and H, and oxidation on M and C due to the addition of iodine solution. (C) Chalf graphical output of the denaturation curve for each peptide. Normalized area of a given peptide from 3 replications is used for generating one denaturation curve and the denature midpoint (C1/2) value. Fitting statistic identifies outliers (outside the standard error range) which are trimmed for a final C1/2 value and confidence interval at 95% calculation. On the left is an example of a denaturation curve that has positive slope, and curve on the right has a negative slope. (D) Each residue in a protein is plotted with its C1/2 vs residue number for each experimental condition.
To address the limitations mentioned above, we modified the traditional chemical denaturation method by using iodine to modify the amino acid side chains. We termed this assay IPSA, iodination protein stability assay (Figure 1A). IPSA introduces irreversible iodination of tyrosine (Y) and histidine (H) as well as oxidation of methionine (M) and cystine (C) (Figure 1B). The additional reporters for the PFS given by IPSA increase both the breadth of the proteome and the granularity of information within individual proteins.10 The biggest advantage of IPSA is that it quantifies residue stability, which gives higher resolution to track the PFS change within different regions of a protein. We and others observe that the PFS can vary between different domains within the same protein.29 A greater reporter density allows more measurements around ligand binding at specific sites. We also introduce a user-friendly analysis tool Chalf to calculate the residue stability. In the analysis, the normalized peptide area from different [GdmCl] is fit into a denaturation curve, and the denature midpoint (C1/2) of each peptide is calculated (Figure 1C). The C1/2 of peptides that share the same label site and label type are then combined to calculate the site C1/2. The site-specific C1/2 values from the same protein are then plotted (Figure 1D) across the protein sequence to compare domain-specific changes with other conditions. Using IPSA, we are able to study the residue-specific structural details including the surface accessibility and domain-specific folding stability.
This study applies IPSA to undepleted human serum from a healthy subject to show that IPSA is capable of reproducibly measuring the PFS of proteins in a complex mixture of blood serum at near-physiological conditions. We quantify the assay efficiency and reproducibility and provide a survey of the top proteins in the serum proteome. We observe that the slope of each denaturation curve is a metric of the amino acid surface exposure in vivo and discuss how the PFS is related to the structural information extracted from X-ray crystallography. We then compare the PFS of the transferrin protein in serum versus purified forms for two different iron binding states. Lastly, we discuss the variation of C1/2 and structural parameters of different binding status of transferrin. This study is the first, to the best of our knowledge, to measure the PFS of proteins in the context of the human serum proteome. It emphasizes the potential of using the PFS to quantify protein folding changes in situ and lays the foundation for future applications of the IPSA technique.
Experimental Procedure
Samples and Analytical Optimization
Serum samples were collected at BYU from a single healthy subject (BYU IRB# F17175), and the serum protein concentration was measured using BCA protein assay (Thermo Fisher #23225). The use of a single subject was to minimize the biological variability and focus on characterization of the IPSA. Purified apo transferrin (apoTF) and holo transferrin (holoTF) were purchased from Lee Biosolutions and dissolved at a concentration of 10 mg/mL in 50 mM Tris pH 7.4. All protein samples were aliquoted into a volume that contained sufficient protein to generate one full denaturation curve (to avoid freeze/thaw cycles and minimize any alterations in protein structure) and then stored at −80 °C until use.
There were 3 samples, purified iron-free transferrin (apoTF), purified iron-saturated transferrin (holoTF), and native serum. For each of the sample sources, three independent replicates were prepared and subjected to IPSA and protein digestion. One-half of the serum sample from each process replicate was subjected to TMT multiplexing after digestion. ApoTF, and holoTF were run label free on an Agilent 6560 IM-QTOF without ion mobility separation. Serum samples were run label free on both the Agilent 6560 IM-QTOF (serum QTOF-LFQ) and a Thermo Fusion Lumos Orbitrap (serum Orbi-LFQ), and after TMT multiplexing were run on a Thermo Fusion Lumos Orbitrap (serum Orbi-TMT).
All samples and data types were used in the efficiency and reproducibility analysis. Serum QTOF-LFQ was used for slope analysis, IPSA application on serum and transferrin, and C1/2’s correlation to structural parameters. ApoTF and holoTF are used for IPSA application on transferrin. In addition, two control experiments were conducted. As a negative control, we applied IPSA on predenatured serum. Second, as a positive control, we applied SPROX on the human serum. Data for these two control experiments were collected label free on an Agilent 6560 IM-QTOF without ion mobility separation. Table 1 lists the details of the experiments.
Table 1. Experiments in This Paper.
| experiment name | sample source | PFS assay | quant | MS |
|---|---|---|---|---|
| serum-QTOF-LFQ | human serum | IPSA | label free | QTOF |
| serum-Orbi-LFQ | human serum | IPSA | label free | Orbi |
| serum-Orbi-TMT | human serum | IPSA | TMT | Orbi |
| apoTF | purified apoTF | IPSA | label free | QTOF |
| holoTF | purified holoTF | IPSA | label free | QTOF |
| predenatured serum | human serum | IPSA | label free | QTOF |
| SPROX serum | human serum | SPROX | label free | QTOF |
Optimizing Iodination
The iodination chemistry was modified from Huntley et al.30 We tested the combination of a 50-, 100-, 200-, or 400-fold molar excess with a 15, 30, or 60 min incubation time at room temperature or 37 °C. We utilized amino acid modification percentages and trypsin cleavage specificity as our readouts. The results suggested there is no increase in random backbone cleavage due to iodination in any combination tested. We also observed that that the incubation time does not affect the peptide counts and label efficiency. However, there is a significant drop in peptide count when a 200- and 400-fold molar excess of iodine is added. Therefore, we decided to use a 100-fold molar excess of iodine to get the most iodine label efficiency without sacrificing the peptide count with a 5 min reaction at 37 °C to keep the protein as close to the physiology environment and cause minimal change to the protein structure due to a long incubation time. Additional details are in the legend of Supporting Figure 1.
Iodine Protein Stability Assay
Generally, protein homogenate was diluted to 10 μg/μL and aliquoted into fractions. Each fraction was unfolded to a different degree using guanidinium chloride (GdmCl, in 50 mM Tris, pH 7.4) gradient for 30 min at 37 °C: native structure at 0 M and most unfolded at the highest [GdmCl] (>6 M) as described below. To initiate covalent labeling a 2 μL volume of 150 mM I2 (Alfa Aesar, Cat# 41955) in 600 mM aqueous KI (Fisher Scientific, Cat# 5324-100), making the 125 mM KI3 reagent was added to each aliquot. The expected structure of each amino acid modification is shown in Figure 1B. The reaction is quenched by addition of 50 mM imidazole (final concentration).
For apoTF and holoTF experiments, 900 μg of 10 μg/μL purified protein was aliquoted into 9 fractions and incubated with 13.8 μL of 0, 0.75, 1.5, 2.25, 3, 3.75, 4.5, 5.25, and 6 M stock GdmCl. After the 30 min incubation at 37 °C, 2 μL of 125 mM KI3 was then added, mixed rapidly, and allowed to react for 5 min at 37 °C followed by adding 25 μL of 100 mM imidazole to quench. For serum experiments, 2000 μg of serum protein was aliquoted into 10 fractions and incubated with 27.6 μL of 0, 0.75, 1.5, 2.25, 3, 3.75, 4.5, 5.25, 6, and 6.2 M stock GdmCl. After the 30 min incubation at 37 °C, 2 μL of 150 mM KI3 was added and allowed to react at 37 °C. After 5 min, 50 μL of 100 mM imidazole was added to quench the reaction. For the predenatured serum experiment, the serum was denatured, reduced, and alkylated with guanidine hydrochloride (final concentration = 4 M), TCEP (final concentration = 10 mM), and CAA (final concentration = 40 mM). This mixture was then heated at 98 °C for 5 min, followed by 5 min of sonication, transferred to a 30 kDa spin filter, and spun for 15 min at 14 000 × g to remove salts. The protein was resuspended in 50 mM Tris pH 7.4 to 10 μg/μL, aliquoted, and then subjected to the same IPSA procedure as that for the other serum experiments.
SPROX Serum
We referenced the SPROX protocol of Walker et al.18 for our SPROX serum experimental conditions. In brief, 2000 μg of protein in 200 μL of the same serum used for IPSA was aliquoted into 10 fractions and incubated with 27.6 μL of 0, 0.75, 1.5, 2.25, 3, 3.75, 4.5, 5.25, 6, and 6.2 M stock GdmCl. After the 60 min incubation at 37 °C, 3% v/v H2O2 was added and incubated for 1 min at room temperature. After 1 min, a 4-fold molar excess of TCEP was added to quench the reaction.
Protein Digestion
After IPSA (or SPROX), 200 μL of 6 M guanidine hydrochloride, 9 μL of 250 mM tris(2-carboxyethyl)phosphine hydrochloride (TCEP, final concentration = 10 mM), and 36 μL of 250 mM 2-chloroacetamide (CAA, final concentration = 40 mM) were added to denature, reduce, and alkylate the protein solution. This mixture was then heated at 98 °C for 5 min, followed by 5 min of sonication, transferred to a 30 kDa spin filter, and spun for 15 min at 14 000 × g to remove salts. The protein was washed twice with 200 μL of 25 mM ammonium bicarbonate (ABC) and then spun at 14 000 × g for 15 min. The filtrate was discarded. The protein was then digested in 300 μL of 25 mM ABC overnight with 4 μL of 1 μg/μL LCMS-grade trypsin protease (Pierce, Cat# 90058) in 50 mM acetic acid and incubated at 37 °C with shaking overnight. The digested peptides were collected by spinning at 14 000 × g for 15 min, adding another 100 μL of 25 mM ABC, and then spinning again at 14 000 × g for 15 min. The filtrate containing the digested peptides was dried in a SpeedVac concentrator (SAVANT SPD131DDA , and then resuspended in 0.1% formic acid in 3% acetonitrile. The samples were then stored at −20 °C before MS acquisition.
TMT Multiplexing
For the serum Orbi-TMT experiment, we labeled each of the 10 samples in the denaturation curve with a different channel from TMT10plex (Thermo Fisher #90111) following the scale-down protocol from Zecha et al.31 and then combined the channels into one sample for each denaturation curve. Specifically, 50 μg of digested peptide from each [GdnHCL] sample was placed in a screw cap vial, dried, and resuspended in 10 μL of 100 mM TEAB pH 8.5 to reach a 5 μg/μL concentration. The TMT reagent vials were equilibrated to room temperature and dissolved in 100% acetonitrile (LCMS grade). Each TMT reagent vial was opened and dissolved in ACN immediately before the TMT solution was added to the samples. After 1 equiv of TMT was added, the samples were incubated at room temperature for 1 h with shaking. Following incubation, 1 μL of 5% hydroxylamine was added to each sample to quench the reaction, and the samples were then incubated for 15 min at room temperature. For each denaturation curve, the entire TMT-labeled volume was then combined into one tube and speed vac to dry. Unused TMT solution was dried under argon and then stored under argon at −80 °C. The dried peptides were resuspended in 300 μL of 0.1% TFA for desalting. Peptide desalting spin columns (Thermo Fisher #89851) were placed into low protein-binding 2 mL microcentrifuge tubes and spun at 5000 × g for 1 min. The columns were washed twice with ACN and twice with 0.1% TFA at 5000 × g for 1 min for each wash. The samples were then added to the columns, which were then spun for 1 min at 3000 × g. This was followed by three washes of 300 μL of 0.1% TFA at 3000 × g for 1 min each. Next, the column was washed twice with 300 μL of 5% MeOH, 0.1% TFA for 1 min each at 3000 × g. The peptides were eluted using 50% ACN, 0.1% TFA. The peptides were dried, resuspended to 0.1% formic acid, 3% acetonitrile, and stored at −20 °C until MS acquisition.
LCMS/MS Acquisition
Three different mass spectrometric acquisition methods were used primarily based on the experimental conditions. The Agilent 6560-LFQ method was used for apoTF, holoTF, and serum QTOF-LFQ. The Thermo Lumos-LFQ method was used for serum Orbi-LFQ. The Thermo Lumos-MS3 method was used for serum Orbi-TMT. All of the MS raw files are available for download at https://Chorusproject.org (project ID 1771; experiment IDs 3683, 3684, 3685, 3686, and 3687).
Agilent 6560-LFQ Method
Digested peptides were separated on a Luna Omega 1.6 μM Polar C18 100 Å LC Column, 150 × 2.1 mm (Phenomenex, cat# AJ0-9502), coupled with a C18 security guard cartridge (Phenomenex, cat #00F-4742-AN) using the Agilent 1290 Infinity II LC system and then analyzed with an Agilent 6560 Ion Mobility QTOF without active IM. For each sample, 40 μg of peptide in 10 μL was eluted with a mixture of solvent A (LCMS grade 0.1% formic acid, 3% acetonitrile in water) and solvent B (0.1% formic acid, 80% acetonitrile) at a flow rate of 0.3 mL/min for 60 min. The linear gradient applied was 0–5% solvent B for 12 s, 5–40% solvent B for 40 min, 40–100% solvent B for 5 min, and 100% solvent B for 10 min. There were two 5 min seesaw washes from 100% to 0% at the end.
Peptides were electrosprayed at 3000 V with a Dual AJS ESI Source. The gas temperature was 325 °C, the drying gas flow rate was 5 L/min, and the nebulizer pressure was 40 psi. The sheath gas temperature was 275 °C with a flow rate of 8 L/min. The mass spectrometer was operated in auto MS/MS, positive ion, and QTOF-only mode. The precursor ion (MS1) and fragmented ion both had a scan range from 100 to 1700 m/z with scan rate 3 spectra/s and medium (∼4 amu) isolation width. The formula 3.6 × m/z/100 – 3 was used for the collision energy. Precursor ions that were above 10 000 counts and had charge states +2 and above were isolated for MS2. Active exclusion was enabled to exclude after 2 spectra and release after 1 min. A maximum of 6 precursors were allowed per cycle, and the mass tolerance was set at 20 ppm.
Thermo Lumos-LFQ method
Digested peptides were separated on a C18 Easy-Spray analytical column with a 2 μm particle size, 100 Å pore size, 75 μM diameter, and 250 mm length (Thermo PN ES902) coupled with a C18 precolumn with a 5 μm particle size, 100 Å pore size, 300 μM diameter, and 5 mm length C18 (Thermo PN160454) using the Thermo Utlimate 3000 LC system and then analyzed with a Thermo Fusion Lumos Orbitrap. A 2 μg amount of peptide in 1 μL was eluted with a mixture of solvent A (LCMS grade 0.1% formic acid, 3% acetonitrile in water) and solvent B (0.1% formic acid, 80% acetonitrile) at a flow rate of 0.3 μL/min for 144 min. The linear gradient was held at 5% solvent for 2 min, 5–22% solvent B for 85 min, 22–32% solvent B for 15 min, 32–95% solvent B for 10 min, and 95% solvent B for 10 min. The last 22 min included two seesaw washes from 100% to 0%.
Peptides were electrosprayed using an EasySpray NSI source in positive mode. The voltage started from 1200 V at 0 min, was increased stepwise to 2400 V at 3 min, and was held at 2400 V until 144 min. The ion transfer tube was set at 275 °C. The cycle time was 3 s. MS1 was detected in the Orbitrap at 120 000 resolution (fwhm) with a scan range from 375 to 1700 m/z, maximum injection time of 50 ms, AGC at 400 000, and a RF lens at 30%. MS1 precursors that were above the 5000 intensity threshold and with a charge stage between 2 and 6 were allowed for MS2 fragmentation. The dynamic exclusion was set to 60 s after 1 occurrence and with 10 ppm mass tolerance. The isotopes were also excluded from MS/MS fragmentation. Precursors were fragmented using CID mode with the collision energy set at 30%, activation time set at 10 ms, and isolation window set at 1.6 m/z. MS2 spectra were detected in an ion trap using DDA mode with the scan rate set at normal, maximum injection time set at 35 ms, and AGC target set at 100 000.
Thermo Lumos-MS3 Method
Digested peptides were separated on a C18 Easy-Spray analytical column with a 2 μm particle size, 100 Å pore size, 75 μM diameter, and 250 mm length (Thermo PN ES902) coupled with a C18 precolumn with a 5 μm particle size, 100 Å pore size, 300 μM, diameter and 5 mm length C18 (Thermo PN160454) using the Thermo Ultimate 3000 LC system and then analyzed with a Thermo Fusion Lumos Orbitrap. A 2 μg amount of peptide in 1 μL was eluted with a mixture of solvent A (LCMS grade 0.1% formic acid, 3% acetonitrile in water) and solvent B (0.1% formic acid, 80% acetonitrile) at a flow rate of 0.3 μL/min for 144 min. The linear gradient applied was held at 5% solvent for 1.5 min, 5–22% solvent B for 63.5 min, 22–52% solvent B for 35 min, 52–95% solvent B for 10 min, and 95% solvent B for 10 min. The last 22 min included two seesaw washes from 100% to 0%.
Peptides were electrosprayed using an EasySpray NSI source in positive mode. The voltage started from 1200 V at 0 min, increased stepwise to 2400 V at 3 min, and was held at 2400 V until 90 min. The ion transfer tube was set at 275 °C. The cycle time was 3 s. MS1 was detected in the Orbitrap at 120 000 resolution (fwhm) with a scan range from 360 to 1700 m/z, maximum injection time of 50 ms, AGC at 400 000, and a RF lens at 30%. Precursors that were above the 5000 intensity threshold and with a charge stage between 2 and 6 were allowed for MS2 fragmentation. The dynamic exclusion was set to 45 s after 1 occurrence and with 10 ppm mass tolerance. The isotopes were also excluded from MS/MS fragmentation. Precursors were fragmented using HCD mode with the collision energy set at 35%, activation time set at 10 ms, and isolation window set at 0.7 m/z. MS2 spectra were detected in an ion trap using DDA mode with scan rate set at normal, maximum injection time set at auto, and AGC target set at 100 000. MS2 detection was followed by SPS MS3 acquisition with 10 notches.32 The resolution of SPS MS3 was set at 50 000 and with a scan range from 100 to 500 m/z. MS2 precursors were fragmented using HCD mode with the collision energy set at 55% and detected in the Orbitrap. The maximum injection time was set at 86 ms, isolation window was set at 2.5 m/z, and AGC target was set at 250 000.
Data Processing
Identification and Quantification
The peptides, proteins, and TMT modification were identified and quantified using PEAKs Studio 10.6 (Bioinformatics Solution Inc.). Raw files from the same denaturation curve were analyzed in the same project as individual samples. Data refinement was set to use the correct precursor and mass only. De novo peptides were searched against a uniport Homo sapiens database (downloaded in October 2020) with a precursor mass tolerance at 20 ppm (monoisotopic) and fragment ion mass tolerance at 0.5 Da. Trypsin was the enzyme with the digestion mode set at unspecific and 3 missed cleavages allowed per peptide. Eleven PTMs were included in the search: carbamidomethylation (C (+57.02)) as a fixed PTM; Pyro-glu from Q (Q (−17.03)), iodination (HY(+125.90)), di-iodination (HY(+251.79)), oxidation (M(+15.99)), sulfone (M(31.99)), sulfenoic acid (C(+15.99)), sulfinoic acid (C(+31.99)), and sulfonoic acid (C(+47.98)) as variable PTMs. TMT-10plex (+228) was added as a fixed PTM for TMT samples. The FDR was set at 1% for peptide and proteins. For LFQ, quantification was run with a 20 ppm mass error tolerance and a 3 min retention time shift tolerance. For TMT, reporter ion quantification was run with MS3 as the reporter ion type, mass error tolerance set at 0.5 DA, and FDR threshold set at 1%. Prior to exporting quantification results, the filters were all turned off. The LFQ result was normalized to TIC, and auto normalization was applied to TMT the result.
C1/2 Calculation
The denatured midpoint (C1/2) is the GdmCl concentration where the native and unfolded protein are in a 1:1 ratio.33 The C1/2 value represents the resistance of the protein to the denaturation caused by GdmCl and is proportional to ΔG unfolding (ΔG°unfolding = −m × C1/2).19 A higher C1/2 value indicates a more stable area of the protein. Quantification results exported from PEAKS Studio were imported to Chalf, our data processing tool (https://github.com/JC-Price/Chalf_public/releases/tag/CHalf_v4.2.1). Using Chalf, the denature midpoint (C1/2) of each peptide was solved by fitting the normalized signal intensity into a sigmoid curve using eq 1.19
| 1 |
The peptide-specific parameters for the equation were normalized signal intensity in each fraction (y), final GdmCl concentration of each fraction (x), pretransition baseline (A), post-transition baseline (B), denature midpoint (C1/2), and slope of transition (b), respectively. After an initial regression, the program excluded outliers outside the range of standard error, and performed the regression for each peptide for the second time. After data filtration, the peptides that share the same modification type and site in the protein were all compiled into one set and undergo regression. The C1/2 resulting from this regression was then the C1/2 of the individual residue. The data filters applied to identify high quality sites are C1/2 in the range of measurement (0–3.48 M), R2 > 0.6, and confidence interval <1/3 of the measurement range.
For assay efficiency and reproducibility analysis, each replication from the same experimental condition was considered as an individual condition and fit separately in Chalf. For denaturation curve slope analysis, assay application, and correlation with X-ray Crystallography structures, all replicates from the same experimental condition were combined to generate a single regression.
Structure Parameter Extraction
Site-specific C1/2 from serum QTOF-LFQ experiments were compared with X-ray crystallography structure parameters (secondary structure (SS), solvent-accessible surface area (SASA), Rosetta energy unit (REU), and b factor) and extracted using protein_info_extract.py (https://github.com/JC-Price/Chalf_public/releases/tag/Protein_Info_Extractor). PyRosetta34 utilizes cleaned protein PDB files (without nonprotein molecules). If a protein’s small-molecule ligand is not parametrized in the PyRosetta database, it will automatically discard it. Secondary structures were assigned based on the Dictionary of Protein Secondary Structure (DSSP)35 algorithm by recognizing the hydrogen-bonding patterns extrapolated from the atomic coordinates of the input PDB files.
The solvent-accessible surface area of each amino acid residue was calculated using the Lee–Richards molecular surface.36,37 The total residue energy (Rosetta energy unit, REU) of each residue is based on the Rosetta score function (energy function is used as the default score function).38,39 Though the REU was not created to be interchangeable with the actual physical energy units (kcal/mol or kJ/mol), the nature of the REU is similar to the Gibbs free energy. In other words, a low REU represents a possible native-like protein conformation and thermodynamic stability.38−40 The b factor of each residue is an experimental value known to be an indicator of the mobility and dynamics of individual atoms or side chains. A large b factor reflects the higher flexibility of the atoms and side chains.41
Result
Pre-denatured Control
Since molecular iodine is a strong oxidant, we tested whether iodine incubation damages the protein before digestion by looking at the peptide cleavage patterns in samples with and without iodine labeling (Supporting Figure 1). In serum that does not undergo iodine labeling, 69.86 ± 3.22% of peptides had trypsin-specific digestion patterns, 29.60 ± 3.13% were semispecific, and 0.54 ± 0.21% had unspecific patterns. For serum that was treated with iodine, 74.95 ± 3.07% of the peptide had specific digestion patterns, 24.60 ± 2.82% has semispecific digestion, and 0.46 ± 0.30% had unspecific digestion. The results suggest that there was no backbone cleavage due to iodine.
We also applied IPSA to denatured serum that was reduced and alkylated at 98 °C in the presence of GdmCl. Our hypothesis is that this pre-denatured control should contain all of the labeled sites, but not generate “real” C1/2 values for labeled sites. Although a comparable number of labeled amino acid sites were identified, we observed that 66% fewer C1/2 sites passed the quality filters (C1/2 in the range 0–3.48 M, R2 > 0.6, and confidence interval < 1/3 of the measurement range) in pre-denatured serum in comparison to regular serum. Of the sites that passed the filters and were shared between pre-denatured serum and regular serum, 41% had a flat denaturation curve compared to regular serum’s sigmoid denaturation curve (Supporting Figure 2). The results suggested that the quality control filters do a good job of identifying quantifiable changes and removing flat or noisy curves. In addition, there was no amino acid type that made it through the final filters more frequently. In summary, the control experiments confirm that IPSA does not induce nonspecific damage to proteins and requires a folded protein structure for a “good” measurement.
Efficiency
The large range of protein concentrations in the serum reduces the total number of peptides useful for the IPSA and SPROX efficiency and analytical assessments; thus, detected peptides percentages are the most comparable metric. We compared the label efficiency, which is the percentage of the number of modified peptides to the number of peptides that have a target, of IPSA and SPROX when applied to undepleted human serum. Both PFS assays track the exchange between modified peptide and its unmodified version; the optimized efficiency at the peptide level should be close to 50%. The current version of IPSA has an overall label efficiency of 33.73 ± 0.33% at the peptide level and 58.88 ± 4.05% at the protein level. In comparison, SPROX has an overall label efficiency of 31.41 ± 0.36% at the peptide level and 72.54 ± 3.46% at the protein level (Figure 2A, Supporting Data 1). We also compared the fitting efficiency, which is the percentage of the number of modified amino acid sites that have C1/2 values that pass-through quality filters to the number of peptide that can be fitted. The fitting efficiency for IPSA is 16.42 ± 2.52% at the peptide level and 32.28 ± 3.80% at the protein level. On the other hand, the fitting efficiency for SPROX is 4.34 ± 0.97% at the peptide level and 14.86 ± 3.39% at the protein level (Figure 2B, Supporting Data 1). In short, the SPROX approach has better efficiency in modifying methionine, but IPSA provides doubled protein coverage and four times the peptide coverage. In IPSA, 74% of the proteins had 2 or more sites measured and 23% of the proteins had more than 5 sites measured. On the other hand, in SPROX, 53% had 2 or more sites measured and only 6% of the protein had more than 5 sites measured (Figure 2C, Supporting Data 1). IPSA and SPROX are comparable in terms of the peptide (Figure 2B) and protein (Figure 2C) fitting efficiency. In general, SPROX would be preferred when methionine is available in the protein sequence because of its robust label efficiency. However, IPSA would be more ideal for proteins that have no methionine in the MS-detectable region and for quantifying the PFS changes in multiple domains within the same proteins (for example, IPSA measured 44, 18, and 2 C1/2 sites for serum albumin, transferrin, and transthyretin, respectively, while SPROX measured 10, 3, and 0 sites, respectively).
Figure 2.

Efficiency comparison between IPSA data (serum QTOF-LFQ, blue) and SPROX data (serum QTOF-LFQ, orange). (A) Label efficiency is the percentage of the number of peptides that have a modified amino acid relative to the total number of peptides with that amino acid. The left most columns are the overall label efficiency at the protein and peptide level, and the rest of the columns are the label efficiency of each label type. (B) Fitting efficiency is the percentage of the number of high-quality C1/2 sites to the number of peptides that can be fit. First column is the overall fitting efficiency at the peptide level, and the rest of the columns are the label type breakdown from the high-quality C1/2 site in the first column. (C) The left most columns are the overall fitting efficiency at the protein level, and the rest of the columns show the percentage of protein population that have multiple C1/2 sites measured per protein. Data for each column can be found in Supporting Data 1.
Reproducibility
C1/2 Variation between ISPA and SPROX
Because of the reporter distribution and data-filtering criteria, there are only 4 shared C1/2 sites between the 283 sites from IPSA and the 45 sites from SPROX. Although the PFS can change dramatically across a protein sequence, we assume that the PFS should be similar for sites in sufficiently close proximity. Thirty percent of the SPROX sites had a comparison in the IPSA data if we allowed them to be within 6 amino acid residues of each other (Figure 3A). Comparing these proximal sites showed that they are highly reproducible (slope = 1.0021x) with a strong C1/2 correlation (R2 = 0.93). The results suggested that IPSA measures the PFS reproducibly, similar to SPROX, but with a different distribution of reporter amino acids.
Figure 3.

Reproducibility. (A) SPROX C1/2 vs IPSA C1/2 of proximal (within 6 AA residues) sites. (B) Percentage of the number of C1/2 sites shared between 3 replicates for each serum experiment: QTOF-LFQ (pink, 330 sites), Orbi-TMT (blue, 139 sites), Orbi-LFQ (green, 537 sites), and SPROX-serum (orange, 45 sites). Solid fill shows 3 sites shared, diagonal strip shows 2 sites shared, and checker board shows the site is not shared with other replicates. (C) CV of C1/2 for the sites that are shared between 3 replicates: QTOF-LFQ (pink, 87 sites), Orbi-TMT (blue, 17 sites), and Orbi-LFQ (green, 45 sites). (D) Percentage measurements that reproducibly exhibit a positive or negative slope QToF = 189, TMT = 67, Orbi = 181, apo vs holo = 12, and SPROX = 1223. (E) CV of C1/2 for the sites observed in 3 IPSA serum experiments. From top to bottom: 3 instruments (20 sites), QTOF-LFQ vs Orbi-TMT (37 sites), Orbi-TMT vs Orbi-LFQ (12 sites), and QTOF-LFQ vs Orbi-LFQ (70 sites).
C1/2 Variation between Analytical Approaches
The ability to repeatedly measure the C1/2 of the same site on the same protein is essential for comparing the PFS changes between conditions. We found that 54.85% of the C1/2 sites measured in QTOF-LFQ are shared at least in 2 out of 3 replicates. The QToF data was consistently the best for reproducibility in IPSA so it was used for the SPROX data as well (Figure 3B). The C1/2 variations between replicates (Figure 3C) or analytical approaches (Figure 3E) were 77.01%, 70.59%, and 37.78% C1/2 sites that have CV ≤ 0.15 for QTOF-LFQ, Orbi-TMT, and Orbi-LFQ respectively (Figure 3C). As for the C1/2 variation between analytical approaches, 60.00%, 75.68%, 33.33%, and 34.43% C1/2 sites have CV ≤ 0.15 for the shared C1/2 sites between the 3 analytical approaches for QTOF-LFQ vs Orb-TMT, Orbi-TMT vs Orbi-LFQ, and Orbi-LFQ vs QTOF-LFQ, respectively. As shown, the variation increased whenever Orbi-LFQ is involved. Such findings suggest that the results from the IPSA QTOF-LFQ and Orbi-TMT runs are the most comparable and reproducible. As expected, multiplexing resulted in less variation than label free when using Orbitrap to acquire the MS spectrum but at the cost of a reduced number of peptides identified. When using label-free quantification, QTOF data has less variation than Orbitrap data. This is mostly because the reproducibility of the QTOF system in conjunction with LC’s μL/min flow rate reduces the variation between runs.
Slope Direction between Analytical Approaches
Comparing the technical replicates for QTOF-LFQ, Orbi-TMT, and Orbi-LFQ, we measured the reproducibility of the denaturation curve’s slope direction (Figure 1C). We found that the slope direction is highly reproducible from run to run in all methods. We compared the percentages of agreeing and disagreeing curve signs between the 3 technical replicates in cases where a given site was found in only 2 runs or was found in all 3 runs. Comparing run to run reproducibility between the methods, we found that QTOF-LFQ is the most reproducible followed by Orbi-TMT and then Orbi-LFQ with total agreement levels being, respectively, 99.45%, 95.52%, and 94.18% (Figure 3D). The slope direction in the SPROX control was collected on the QToF and had the same highly reproducible slope with a 100% agreement level.
Given our findings regarding QTOF-LFQ, Orbi-TMT, and Orbi-LFQ, we can confidently state that the QTOF-LFQ and Orbi-TMT outputs can readily be compared. This confidence in the data quality and breadth meant that most subsequent experiments used QTOF-LFQ.
Denaturation Slope as a Metric of Surface Exposure
The fundamental theory behind SPROX and IPSA is that the amino acid modification reactivity increases when the amino acid is solvent exposed. Therefore, the signal intensity of modified peptides can serve as the reporter for the protein’s denaturation in that region of the sequence. Amino acids that are buried in the core of the protein would become more and more surface accessible as the protein unfolds. Hence, for an amino acid that is buried in the core, we expect to see a positive transition: the signal intensity for the modified peptide is low when the protein is in its native folded state, and the signal increases as the protein unfolds. We observed both positive (positive slope) and negative (negative slope) transitions within the highest quality data (Figure 1C, Figure 3D). We tested whether such differences are a reflection of the protein structure. According to our model, amino acids that are on the surface of the folded protein would start with high reactivity; however, the signal could decrease when it was unfolded because of the formation of new secondary structures or competition for iodine from other previously buried amino acids, resulting in a reduced modification efficiency as the protein unfolds.
Slope Direction Is Reproducible
Comparing each of the replicates for the purified protein and serum, we calculated the percentages of sites where the slope had the same sign in at least 2 of 3 replicates. We found that the slope direction was highly reproducible from run to run, with total agreement levels being 99.45% for the serum (Figure 3D). In the purified protein, we found that 10 of the 12 shared sites had the same slope direction (83.33%) (Figure 3D). The reproducibility of the slope direction between runs and across conditions implies that the slope direction may have significant implications in describing the protein structure and unfolding. We found that although positive (96%) and negative slopes (4%) were both observed in SPROX, the data was 100% reproducible. This high degree of reproducible slopes for both IPSA and SPROX and suggest that it may be intrinsic to the protein structure.
Slope Direction vs Amino Acid/Label Type
We then examined trends in the C1/2 value and slope direction of the sigmoid curve in reference to amino acid residue identity and label type observed in at least 10 peptides from serum runs. Assuming a stepwise reaction mechanism for both IPSA and SPROX labeling, multiple products are possible (Figure 1B). In terms of the slope direction, monoiodinated histidine (H(+125.90)) tended to have a negative slope (Poisson test, p < 0.0001). Di-iodinated histidine (H(+251.79)), however, tends to have a more positive slope (Poisson test, p = 0.0385). Mono- and di-iodinated tyrosine species (Y(+125.90) and Y(+251.79)) tended to have a positive slope (Poisson test, p < 0.0001 and 0.0001). Oxidized methionine (M(+15.99)) appeared to have a trend toward a positive slope, but such a trend lacked statistical significance (Poisson test, p = 0.0710). Cysteine, probed in its sulfinated form (C(+31.99)), tended to have a positive slope (Poisson test, p = 0.0089). Other observed amino acid and label types showed no statistically significant trend in slope direction. (Figure 4A, Supporting Data 2). Similarly, we checked the slope tendency for SPROX serum data: mono-oxidized methionine residues (M(+15.99)) overwhelmingly tended to have a positive slope (p < 0.0001) and dioxidized methionine residues (M(+31.99)) tended to have a negative slope (p = 0.1839). Cysteine, probed in its sulfinated form (C(+31.99)), tended to have a negative slope (p < 0.0001), and its sulfonated form (C(+47.98)) tended to have a positive slope (p = 0.0595) (Supporting Data 2). The slope tendency of both forms of methionine is similar between IPSA and SPROX. We again confirm the observation that both negative and positive slopes are not unique to IPSA but universal among similar chemistry denaturation approaches.
Figure 4.

Analysis of slope direction. (A) Percentage of C1/2 sites that have positive slopes (solid filled) vs negative slopes (pattern filled) for each label type from the IPSA serum QTOF-LFQ experiment is highly reproducible. Hydrophobicity of a site seems to correlate with slope direction. (* = p value < 0.05) Only label types that have at least 10 measured are shown in the plot; numerical data available in Supporting Data 2. Since histidine (orange) C1/2 sites are mostly negative, they are compared with tyrosine, methionine, and cysteine (blue) in C–E and G–I. (B) Serum C1/2 site solvent-accessible surface area distribution per positive (blue) and negative (orange) slope group. Higher the SASA value, the more solvent accessible the site. (C–E) Serum C1/2 site solvent-accessible surface area distribution of Y, M, and C (blue) compared to H (orange). (F) Serum site C1/2 distribution per positive (blue) and negative (orange) slope group. (G–I) Serum site solvent-accessible surface area distribution of Y, M, and C (blue) compared to H (orange). All of the distributions in B–I have p values <0.05. Refer to Supporting Data 2 for Poisson test and Kruskal–Wallis test result details.
Slope Direction vs SASA
We tested whether the amino acid hydrophobicity correlated with the slope direction. The hydrophobicity decreases from C, M, Y, to H with hydropathy indexes 2.5, 1.9, −1.3, and −3.2, respectively.42 There was a pronounced trend of increased frequency of negative slopes for H relative to C (Figure 4A). Because the hydrophobicity influences the surface accessibility in folded structures, we tested the hypothesis that the slope direction is correlated to whether an amino acid is buried in the core of the protein. To do this we calculated the solvent-accessible surface area value of proteins observed in our serum run from published X-ray crystallography structures using Pyrosetta.34 In our serum data, 37 proteins with 202 sites have corresponding X-ray crystallography data available. For these comparisons, we avoided structures containing drugs or non-native protein complexes. For a comprehensive list of selected structures, see Supporting Data 3.43−79 We found that the SASA values were significantly different between label sites that have positive and negative slope in the serum (Figure 4B). The mean SASA values for C, M, Y, and H are 12.66 ± 13.40, 27.51 ± 27.64, 30.11 ± 32.63, and 74.55 ± 43.44, respectively (Supporting Data 2). Of those, histidine residues, which exhibit both a negative slope and a positive slope, had significantly higher SASA values than the other residues, Y, C, and M, that have mostly positive slopes (Kruskal–Wallis test, p values all <0.0001) (Figure 4C–E). The standard deviation for these SASA values is a reflection of the diversity of structures, not an error in the calculation. The C1/2 values were significantly different for the label sites that have positive and negative slopes in the serum (Figure 4F). Histidine residues’ average C1/2 values of 1.45 ± 0.76 were significantly lower than those of other residues, Y (1.83 ± 0.68), M (1.92 ± 0.84), and C (2.02 ± 0.61) with p = 0.0006, 0.0259, 0.0078, respectively (Figure 4G–I, Supporting Data 2). These findings are largely consistent with the hypothesis that as the concentration of GdmCl increases and the protein unfolds, formerly buried, hydrophobic residues are exposed to iodine labeling resulting in an increase in the abundance of labeled hydrophobic species, hence yielding a positive slope. Conversely, as more residues are exposed to iodine labeling, iodinated hydrophilic species see a decrease in abundance due to formation of a new secondary structure or increased competition for access to iodine.80
C1/2 for Transferrin and Other Serum Proteins
Reproducible C1/2 Measurements in the Context of the Serum Proteome
Three technical replicates of serum from a healthy human subject were combined to generate one regression curve. We measured high-quality C1/2 values for 283 sites across 57 serum proteins. The extreme protein concentration gradient in the serum makes it difficult to measure more than the top 10 proteins. For the 6 most concentrated proteins we observed >10 sites, 9 proteins between 6 and 10 sites, 24 proteins measured at between 2 and 5 sites, and 18 proteins measured at 1 site. Of the proteins that have at least two C1/2 sites measured, the average C1/2 shows a normal distribution with 72% of the proteins having an average C1/2 between 1 and 2 M (Supporting Figure 3A). Table 2 lists the number of C1/2 sites measured, average C1/2, C1/2 standard deviation, C1/2 relative standard deviation, length, mass, concentration, and melting temperature (when purified) for the 39 most concentrated serum proteins, according to the literature.81 Although there are significant differences in the unfolding mechanisms, measurement techniques, and interpretation, the folding stability (C1/2) measured by IPSA and the thermal stability (Tm) have a strong positive correlation (R2 = 0.94, Supporting Figure 3B). Using the DAVID Bioinformatics Resource,82,83 we tested whether the average C1/2 changed between ontology clusters. We observed that the complement and coagulation cascades (n = 7), immunoglobulin-like domain (n = 10), and transport (n = 10) have C1/2 means of 1.78 ± 0.05, 1.63 ± 0.25, and 1.60 ± 1.33 M. However, the comparison of protein level PFS is far less useful than the comparison of specific sites within proteins.
Table 2. Denature Midpoint (C1/2) and Melting Point (Tm) of the Serum Proteins.
| Uniprot ID | protein name | no. of C1/2 sites | C1/2 average | C1/2 stdev | C1/2 RSD (%) | length (AA) | mass (kDa) | log 10(pg/mL)81 | Tm(°C) |
|---|---|---|---|---|---|---|---|---|---|
| P02768 | albumin | 44 | 1.96 | 0.54 | 27 | 609 | 69.4 | 9.2 | 63.284 |
| P01023 | α2 macroglobulin | 20 | 1.41 | 0.63 | 45 | 1474 | 163.3 | 9.0 | 6585 |
| P02787 | serotransferrin | 17 | 1.72 | 0.80 | 47 | 698 | 77.1 | 9.1 | 71, 8485 |
| P01024 | compliment C3 | 13 | 1.80 | 0.51 | 28 | 1663 | 187.1 | 9.05 | 60, 7685 |
| P00738 | haptoglobin | 12 | 1.59 | 0.76 | 47 | 406 | 45.2 | 8.9 | 6285 |
| P02647 | apolipoprotein A1 | 11 | 2.08 | 0.60 | 29 | 267 | 30.8 | 9 | 5884 |
| P01876 | IgA | 9 | 1.47 | 0.67 | 45 | 353 | 37.7 | NA | 7285 |
| P01859 | IgG | 9 | 1.82 | 0.77 | 42 | 326 | 35.9 | NA | 7185 |
| P06727 | apolipoprotein A4 | 8 | 1.31 | 0.48 | 37 | 396 | 45.4 | 8 | 50.5, 53.986 |
| P0DOX5 | IgG | 8 | 1.49 | 0.53 | 36 | 449 | 49.3 | NA | 7185 |
| P01009 | α1 antitrypsin | 7 | 1.58 | 0.79 | 50 | 418 | 46.7 | 8.4 | 59.684 |
| P01860 | IgG | 7 | 1.64 | 0.86 | 53 | 377 | 41.3 | NA | 7185 |
| P01861 | IgG | 7 | 1.35 | 0.91 | 68 | 327 | 35.9 | 8.5 | 7185 |
| P01834 | immunoglobin kappa constant | 7 | 2.65 | 0.18 | 7 | 107 | 11.8 | NA | NA |
| P00739 | haptoglobin-related protein | 5 | 1.08 | 0.59 | 54 | 348 | 39.0 | 7.6 | NA |
| P01871 | IgM | 5 | 1.77 | 0.62 | 35 | 453 | 49.4 | 8.2 | 7185 |
| P01011 | alpha-1-antichymotrypsin | 4 | 1.48 | 0.70 | 47 | 423 | 47.7 | 8.0 | 5885 |
| P02652 | apolipoprotein A2 | 4 | 1.99 | 0.32 | 16 | 100 | 11.2 | 8.5 | 8087 |
| P04114 | apolipoprotein B100 | 4 | 1.57 | 0.37 | 24 | 4563 | 515.6 | 8.5 | 31.1, 57.1, 73.584 |
| P08603 | compliment factor H | 4 | 1.78 | 0.19 | 11 | 1231 | 139.1 | 7.6 | NA |
| P02042 | hemoglobin subunit delta | 4 | 1.76 | 0.63 | 35 | 147 | 16.1 | 7.5 | NA |
| P02763 | alpha-1-acidglycoprotein 1 | 3 | 1.09 | 0.78 | 72 | 201 | 23.5 | 8.2 | 5884 |
| P04217 | alpha-1B glycoprotein | 3 | 0.84 | 0.19 | 23 | 495 | 54.3 | 7.9 | NA |
| P00450 | ceruloplasmin | 3 | 1.78 | 0.24 | 13 | 1065 | 122.2 | 8.2 | 85.188 |
| P0DOX6 | IgM | 3 | 2.14 | 0.17 | 8 | 576 | 63.5 | NA | 7185 |
| P19823 | interalpha-trypsin inhibitor heavy chain H2 | 3 | 1.32 | 0.32 | 24 | 946 | 106.5 | 7.3 | NA |
| P01042 | kininogen-1 | 3 | 2.07 | 0.95 | 46 | 644 | 71.9 | 8.6 | NA |
| P02774 | vitamin D binding protein | 3 | 1.18 | 1.02 | 87 | 474 | 52.9 | 7.8 | NA |
| P02765 | alpha-2-HS-glycoprotein | 2 | 2.16 | 0.94 | 44 | 367 | 39.3 | 7.9 | NA |
| P02751 | fibronectin | 2 | 1.21 | 0.33 | 27 | 2477 | 272.4 | 7.6 | 6484 |
| P06396 | gelsolin | 2 | 1.93 | 0.37 | 19 | 782 | 85.7 | 8.3 | 6089 |
| P00734 | prothrombin | 2 | 2.02 | 0.29 | 14 | 622 | 70.0 | 7.1 | |
| P02766 | transthyretin | 2 | 1.11 | 0.55 | 50 | 147 | 15.9 | 8.6 | 101.790 |
| P04004 | vitronectin | 2 | 1.80 | 0.15 | 8 | 478 | 54.3 | 7.7 | 5991 |
C1/2 Variation Across a Sequence of Human Serum Albumin (HSA)
The protein with the best coverage and most frequently observed peptide measurements was human serum albumin (HSA). HSA is the most abundant serum protein, which makes up about 60% of the total protein concentration. It is a known lipid and metal carrier and is used for drug delivery. We observed that HSA has a relatively high average C1/2 at 1.96 ± 0.55 M perhaps due to the large number of disulfide bonds (∼17) in its structure. Like with transferrin, we observed that most sites had a remarkably low variance between replicate measurements (Supporting Figure 3D). HSA has three domains, and each domain has two subdomains. Domains IB, IIA (Sudlow I), and IIIA (Sudlow II) are known small-molecule binding sites92 (Supporting Figure 3C). Examining the C1/2 of the subdomains of HSA, we found that domain IIB has the most C1/2 variation between residues and between replicates. The BioGRID 4.4 interactome database shows 349 known interactors for HSA. The variation in C1/2 across the sequence suggested a mobile and flexible role for protein interactions or ligand binding in domains I and II. In contrast, domain IIIB has the least variation which can be possibly due to the C-terminal’s role in stabilizing the half-life of HSA93 (Supporting Figure 3D). There is no obvious correlation found between SASA and C1/2 (Supporting Figure 3E). Note that the SASA values used here are from a purified protein (PDB ID 1N5U) with no ligands and other protein binding partners, which is not reflective of the environment in the plasma. On the other hand, the C1/2 value is collected from a physiological condition and is supposed to reflect its interaction with the environment. Thus, the regions with high surface exposure in the X-ray structure which more stable (large C1/2 value) should be examined further as possible binding sites for interactors.
Transferrin (TF) Structural Stability Changes with Binding of Iron
Although the albumin results suggest that binding interactions can change the PFS, albumin binds many different small molecules but few with high specificity. Using the transferrin (TF) protein, we tested whether IPSA had the sensitivity and reproducibility to measure C1/2 changes between different conditions and across the protein sequence. TF is a good candidate for this proof of principle analysis for two reasons. First, TF is one of the abundant serum proteins and has 698 residues divided into two major domains connected by a short loop, and we had good peptide coverage of the entire protein even in the blood serum. Second, TF has two distinct forms differentiated by substrate (iron) binding. TF is the primary transport protein for nonheme iron in blood serum. The N-terminal domain includes amino acids 20–347, and the C-terminal domain includes amino acids 361–698. Each domain has an iron binding site which has slightly different iron binding affinities.94,95 The iron binding site in the N-terminal domain is comprised of D82, Y114, Y207, and H268,96 and the C-terminal binding site is comprised of D411, Y445, Y536, H60496 (Figure 5A). The holo form of transferrin has Fe3+ bound in both domains, and the apo from has both domains empty. It has previously been shown that the folding stability of the iron binding sites decreases when the lobes open and the iron is released,97 and the transferrin saturation for a healthy individual is between 20% and 45%.98 Thus, we expect that the C1/2 is lowest in apoTF and highest in holoTF, and the C1/2 of serum TF should be somewhere in between apoTF and holoTF.
Figure 5.

Site C1/2 of Transferrin. (A) Crystal structure of transferrin (4X1B). N-domain residues 20–180 are in cornflower blue, and 181–348 are in light sea green. C-domain residues 362–529 are in pink, 530–699 are in orange, and connecting loop 349–361 is in gray. Iron biding sites are in purple with the amino acid side chain turned on. Number label pointing to the amino acid with the side chain turned on highlights the structure location of each of C1/2 site shown in B. Residue number used here is from uniport ID. (B) Site C1/2 measured from N′ to C′ of transferrin. C1/2 sites that are shared in at least 2 of the experiments (apoTF, holoTF, and serum) are shown. Error bars show the confidence interval at 95% of the site C1/2 after fitting all data points that cover the same site. (C) Shared site C1/2 distribution of transferrin from apoTF and holo TF experiments. (D) Shared site C1/2 variation of transferrin between each of the serum technical replicates and between apoTF and holo TF experiments.
To better assess the PFS of TF in serum as a reflection of iron binding status, we established the baseline by subjecting purified apoTF and purified holoTF to IPSA. There were 17 site-specific C1/2 values measured in serum TF, 32 in apoTF, and 26 in holoTF. Acquiring the C1/2 of the same site across conditions is one of the challenges in the current IPSA workflow, primarily because of the shotgun proteomics approach. We measured the C1/2 values for 6 out of the 8 iron binding sites on TF. We were able to measure the C1/2 for 3 of the amino acids that directly chelate the iron (Y114, H268, and H604). Poor signal-to-noise for these amino acids resulted in missing values in some of the conditions; thus, these could not be used for comparison. We were able to monitor the PFS of Y115, the residue immediately adjacent to the iron binding site Y114 in both apoTF and holoTF. We found it was significantly higher in holoTF than in apoTF (Figure5B, Supporting Figure 4). This suggests that the environment close to the binding site has a lower C1/2, is less stable when there is no iron bound (apoTF), has a higher C1/2, and is more stable when both iron binding sites are occupied (holoTF). Such observation agrees with the expectation that apoTF is less stable than holoTF97 and further confirms that IPSA has the sensitivity to quantify the PFS difference between protein states.
Comparing changes in site-specific C1/2 across the conditions showed that apoTF sites are generally lower than those in holoTF sites, and serum TF is slightly below holo TF (Figure 5B, Supporting Data 4). The shared site C1/2 was statistically significant between apo and holo (1.60 ± 0.70 and 1.95 ± 0.77 M, respectively, p = 0.0056, Figure 5C). Serum TF has an average C1/2 of 1.72 ± 0.78 M, which is slightly higher than that of apo (Supporting Data 2). The PFS of serum TF seems to imply that as soon as one of the TF iron binding sites is occupied, the overall protein structure is stabilized. It has been previously observed that the two iron binding sites are not identical and have different affinities.97 Note that the observed sites are observed less frequently in the C-terminal domain than in the N-terminal domain across 3 conditions. It is likely that there are other factors affecting the efficiency of the modification of the reporter amino acids
Comparing replicate C1/2 values for shared sites in purified protein versus the serum, we found that the variation between serum replicates was significantly lower than the variation between apo and holo (p = 0.004) with median standard deviations of 0.1276 and 0.3406 M for serum replicates and apo/holo, respectively (Figure 5D). We also noticed that some regions of the protein had higher variability (Y64, Y242, H308, Y593) than the other, which may indicate conformational flexibility or multiprotein complex formation, which creates multiple conformations at these sites. On the basis of these findings, we suggest that IPSA can measure meaningful differences in the PFS between different conditions and also that individual sites in the protein report independent values for conformational change.
X-ray Crystallography Suggests In Vivo Structural Ensembles for TF
To test whether the variation in folded structures might explain the higher variation in the C1/2 values of some protein domains, we compared the variability in known structures for TF. At the time of publication there were 17 published TF structures64,78,79,96,99−107 that are full-length and have resolution < 3 Å without extra ligands or binding partners.
To quantify the variation between the X-ray crystal structures, we calculated the relative standard deviation (RSD) for each of the structural parameters (SASA, b factor, and REU). The RSD range highlights TF regions where SASA (15–183%), b factor (18–59%), and REU (74–7841%) changed between structures (Supporting Figure 5, Supporting Data 5). This variation in the crystal structure may replicate some of the in vivo structural dynamics occurring in blood serum and highlights the structural variability which may affect the C1/2 values. For transferrin, the population of in vivo structures may be influenced primarily by the iron concentration, but the variation profile of each parameter (SASA, b factor, RUE, and C1/2) between the crystal structures was unique. REU has significant variation around residues 200, 320, and 670. On the other hand, the linear regression does not show significant correlation between the C1/2 RSD and the RSD of SASA, b factor, and REU, which suggests that there are other factors that take place in order to model the correlation. Low correlation with C1/2 values versus the calculated SASA/b factor/REU for the rest of the serum proteins (Supporting Figure 6, Supporting Data 3) may reflect the fact that the environment during crystallization did not contain the milieu of small-molecule and protein binding partners available in the serum.
Discussion
Poor control of protein homeostasis across the proteome is a critical precursor to many of today’s untreatable diseases.2 A common observation among these diseases and even during healthy aging is that protein aggregates have formed.108 To address the etiology of these diseases, an in vivo metric of folding quality is necessary. The goal of this study is to introduce new tools for researchers to study the protein folding stability across the proteome in situ. The iodine protein stability assay (IPSA) modifies H, Y, M, and, C, providing higher resolution across the protein sequence, and can monitor the PFS changes in subdomains, during ligand binding, or upon protein–protein interaction. It utilizes a chemical denaturation approach which is effective in human serum, facilitating human studies. The covalent modification introduced by iodine is irreversible and allows downstream fractionation or enrichment to broaden coverage. IPSA provides increased granularity to track a change in a protein’s denaturation midpoint (C1/2, which is proportional to ΔGunfolding) along the protein sequence in different conditions. We also introduce the Chalf data processing tool to provide a user-friendly method to calculate the denaturation midpoint for both chemical (SPROX, IPSA) and thermal (TPP, LiP) data with easily modifiable settings.
Traditionally, the chemical denaturation method for the protein folding stability targets the hydrophobic amino acids, like methionine, because these tend to be at the core of the protein. We observed that in addition to the C1/2 value, the denaturation curve slope direction is biased by the surface accessibility of the amino acid. The inclusion of slope direction opens up the possibility for using any amino acid as a reporter as long as the modification is irreversible and the reaction efficiency is reasonable. The IPSA method uses common reagents and is reproducible in complex matrices like human serum, where we measure 283 sites across 57 proteins. To our knowledge, this is the first time the PFS information for human serum proteins has been measured in the context of the blood serum (in situ). The work in this study creates a reference point for researchers that have interest in the quality metrics of human serum proteome change with time, diet, or other variables. Using transferrin as a model, we were able to confirm that IPSA can measure the significant difference in stability between conditions (apoTF and holoTF) in agreement with the literature expectation. In addition, we also observe that the C-terminal domain in TF reacts differently to iodine treatment, which suggests a difference in functionality. This concurs with the literature that the C-terminus of TF has an effect on iron release.109−111
The structure of a protein is critical to its function, especially in ligand binding and protein–protein interactions. While maintaining certain stability is important for protein integrity, structural flexibility is a critical part of how proteins do their jobs. In our attempt to link C1/2 and structural parameters (SASA, b factor, and REU) from X-ray crystal structures, we found only weak correlations. At the same time, we observed that there is significant variation of these structure parameters between different crystal structures even without protein binding partners or ligands. The variation between structures suggests that the weak correlation between C1/2 and structural parameters may be due to structural ensemble differences between experimental conditions. This illustrates the fact that while X-ray crystal structures are remarkably valuable in understanding the protein structure and function, it is important to combine other in vivo measurements to access in vivo structural changes relevant to disease conditions or drug binding states. Note that in some instances, we need to be able to identify the unstable region in a stable protein for better and earlier diagnosis. Techniques like IPSA may allow us to assess changes in the stability of the disordered region that is usually not accessible from crystallization data and assess the dynamics of the protein structure in different conditions and biological contexts.
Similar to the results shown here, SPROX has been shown previously to detect structural changes due to ligand binding.18,112,113 The increased number of reporters provided by IPSA increases the ability to monitor drug binding to proteins. This increases the potential to use the protein folding stability in drug development and potentially for diagnosis.10 This is valuable because the PFS quantifies the protein folding stability, which makes it perfectly suitable to study diseases of protein aggregation, like Alzheimer’s or cardiac amyloidosis. Finally, the PFS in combination with the kinetics of protein synthesis (turnover rate, synthesis rate, and degradation rate) can help better describe the mechanism of the loss proteostasis, which is one of the primary reasons for aging and age-related diseases. All of these IPSA applications provide orthogonal information to current concentration-focused studies.
To accomplish these potential applications, the most urgent next step is to create assays which measure C1/2 for the same site consistently across different conditions to facilitate comparisons. This may be addressed by using different MS acquisition methods, such as targeted MS, DIA, or real-time search, to measure iodinated peptides repeatedly and reliably. Despite this hurdle, the current IPSA study supports the potential for more applications.
In summary, we have demonstrated that IPSA gives reproducible measurements of biologically relevant differences in the protein folding stability and has high resolution to track stability differences within the protein. This study also provides an initial census of C1/2 for proteins in undepleted human serum, which lays the foundation for future study.
Acknowledgments
We are grateful to Richard Watt and the Watt lab for productive discussions regarding transferrin iron trafficking. We gratefully acknowledge BYU undergraduate research awards supporting I.J., C.D.H., C.T.H., M.J.Z., T.M.B., M.B., S.P., S.A.D., and N.R.Z. The research reported in this publication was supported by the Fritz B. Burns Foundation and the National Institute On Aging of the National Institutes of Health under Award Number R01AG066874 to J.C.P. The content is solely the responsibility of the authors and does not necessarily represent the official views of the National Institutes of Health.
Glossary
Abbreviations
- apoTF
apo transferrin
- C1/2
denature midpoint
- CD
circular dichroism spectroscopy
- DSSP
Dictionary of Protein Secondary Structure
- GdmCl
guanidinium chloride
- holoTF
holo transferrin
- HSA
serum albumin
- IPSA
iodination protein stability assay
- LCMS
liquid chromatography-mass spectrometry
- LiP
limited proteolysis
- MS
mass spectrometry
- Orbi-LFQ
Orbitrap mass spectrometer in label-free comparison
- Orbi-TMT
Orbitrap mass spectrometer in tandem mass tag comparison
- PFS
protein folding stability
- PTM
post-translation modification
- QTOF-LFQ
quadrupole time of flight mass spectrometer in label free comparison
- REU
Rosetta energy unit
- SASA
solvent-accessible surface area
- SPROX
stability of proteins from rates of oxidation
- SS
secondary structure
- TMT
tandem mass tag
- TPP
thermal proteome profiling
Supporting Information Available
The Supporting Information is available free of charge at https://pubs.acs.org/doi/10.1021/acs.jproteome.2c00323.
IPSA and SPROX’s label and fitting efficiency (XLSX)
Statistics test results for reproducibility, slope tendency, C1/2 and SASA distribution, and C1/2’s correlation to structural parameter (XLSX)
C1/2 value and structural parameters for each site measured (XLSX)
Merged CHalf output (combined label site) and average C1/2 for serum protein (XLSX)
Structural parameters of 17 different transferrin structures (XLSX)
Optimizing iodination; ion count for IPSA reporter; average C1/2 of serum proteins; denaturation curve for transferrin Y115 (+125.90); variation between transferrin crystal structures; structural parameters vs C1/2; spectra for each label type Y(+125.90), H(+125.90), H(+251.79), M(+15.99), M(+31.99), C(+15.99), C(+31.99), and C(+47.98) (PDF)
The authors declare no competing financial interest.
Supplementary Material
References
- Morimoto R. I. Cell-Nonautonomous Regulation of Proteostasis in Aging and Disease. Cold Spring Harb Perspect Biol. 2020, 12 (4), a034074. 10.1101/cshperspect.a034074. [DOI] [PMC free article] [PubMed] [Google Scholar]
- Hipp M. S.; Kasturi P.; Hartl F. U. The proteostasis network and its decline in ageing. Nat. Rev. Mol. Cell Biol. 2019, 20 (7), 421–435. 10.1038/s41580-019-0101-y. [DOI] [PubMed] [Google Scholar]
- Onuchic J. N.; Wolynes P. G. Theory of protein folding. Curr. Opin Struct Biol. 2004, 14 (1), 70–75. 10.1016/j.sbi.2004.01.009. [DOI] [PubMed] [Google Scholar]
- Leopold P. E.; Montal M.; Onuchic J. Protein folding funnels: a kinetic approach to the sequence-structure relationship. Proc. Natl. Acad. Sci. U. S. A. 1992, 89 (18), 8721–8725. 10.1073/pnas.89.18.8721. [DOI] [PMC free article] [PubMed] [Google Scholar]
- Grantcharova V.; Alm E. J.; Baker D.; Horwich A. L. Mechanisms of protein folding. Curr. Opin Struct Biol. 2001, 11 (1), 70–82. 10.1016/S0959-440X(00)00176-7. [DOI] [PubMed] [Google Scholar]
- Dinner A. R.; Sali A.; Smith L. J.; Dobson C. M.; Karplus M. Understanding protein folding via free-energy surfaces from theory and experiment. Trends Biochem. Sci. 2000, 25 (7), 331–339. 10.1016/S0968-0004(00)01610-8. [DOI] [PubMed] [Google Scholar]
- Huang L.; Liu X.; Cheng B.; Huang K. How our bodies fight amyloidosis: effects of physiological factors on pathogenic aggregation of amyloidogenic proteins. Arch. Biochem. Biophys. 2015, 568, 46–55. 10.1016/j.abb.2015.01.007. [DOI] [PubMed] [Google Scholar]
- Sanders C. R.; Nagy J. K. Misfolding of membrane proteins in health and disease: the lady or the tiger.?. Curr. Opin. Struct. Biol. 2000, 10 (4), 438–442. 10.1016/S0959-440X(00)00112-3. [DOI] [PubMed] [Google Scholar]
- Bamberger C.; Pankow S.; Martinez-Bartolome S.; Ma M.; Diedrich J.; Rissman R. A.; Yates J. R. 3rd Protein Footprinting via Covalent Protein Painting Reveals Structural Changes of the Proteome in Alzheimer’s Disease. J. Proteome Res. 2021, 20 (5), 2762–2771. 10.1021/acs.jproteome.0c00912. [DOI] [PMC free article] [PubMed] [Google Scholar]
- Criddle R. S.; Lin H. L.; James I.; Park J. S.; Hansen L. D.; Price J. C. Proposing a minimal set of metrics and methods to predict probabilities of amyloidosis disease and onset age in individuals. Aging (Albany NY) 2020, 12 (22), 22356–22369. 10.18632/aging.202208. [DOI] [PMC free article] [PubMed] [Google Scholar]
- Greenfield N. J. Using circular dichroism spectra to estimate protein secondary structure. Nat. Protoc 2006, 1 (6), 2876–2890. 10.1038/nprot.2006.202. [DOI] [PMC free article] [PubMed] [Google Scholar]
- Huynh K.; Partch C. L. Analysis of protein stability and ligand interactions by thermal shift assay. Curr. Protoc Protein Sci. 2015, 79, 28.9.1–28.9.14. 10.1002/0471140864.ps2809s79. [DOI] [PMC free article] [PubMed] [Google Scholar]
- Park Z. Y.; Russell D. H. Thermal denaturation: a useful technique in peptide mass mapping. Anal. Chem. 2000, 72 (11), 2667–2670. 10.1021/ac991444k. [DOI] [PubMed] [Google Scholar]
- Garbett N. C.; Mekmaysy C. S.; DeLeeuw L.; Chaires J. B. Clinical application of plasma thermograms. Utility, practical approaches and considerations. Methods 2015, 76, 41–50. 10.1016/j.ymeth.2014.10.030. [DOI] [PMC free article] [PubMed] [Google Scholar]
- Lin H.-J. L.; Parkinson D. H.; Holman J. C.; Thompson W. C.; Andersen C. K.; Hadfield M.; Ames S.; Zuniga N. R.; Bowden J. N.; Quinn C.; et al. Structural stability of human serum albumin is modified in rheumatoid arthritis. BioRxiv 2022. 10.1101/2022.06.23.497357. [DOI] [PMC free article] [PubMed] [Google Scholar]
- Pal S.; Pyne P.; Samanta N.; Ebbinghaus S.; Mitra R. K. Thermal stability modulation of the native and chemically-unfolded state of bovine serum albumin by amino acids. Phys. Chem. Chem. Phys. 2020, 22 (1), 179–188. 10.1039/C9CP04887A. [DOI] [PubMed] [Google Scholar]
- Nielsen J. B.; Nielsen A. V.; Carson R. H.; Lin H. L.; Hanson R. L.; Sonker M.; Mortensen D. N.; Price J. C.; Woolley A. T. Analysis of thrombin-antithrombin complex formation using microchip electrophoresis and mass spectrometry. Electrophoresis 2019, 40 (21), 2853–2859. 10.1002/elps.201900235. [DOI] [PMC free article] [PubMed] [Google Scholar]
- Walker E. J.; Bettinger J. Q.; Welle K. A.; Hryhorenko J. R.; Ghaemmaghami S. Global analysis of methionine oxidation provides a census of folding stabilities for the human proteome. Proc. Natl. Acad. Sci. U. S. A. 2019, 116 (13), 6081–6090. 10.1073/pnas.1819851116. [DOI] [PMC free article] [PubMed] [Google Scholar]
- Roberts J. H.; Liu F.; Karnuta J. M.; Fitzgerald M. C. Discovery of Age-Related Protein Folding Stability Differences in the Mouse Brain Proteome. J. Proteome Res. 2016, 15 (12), 4731–4741. 10.1021/acs.jproteome.6b00927. [DOI] [PMC free article] [PubMed] [Google Scholar]
- Liu X. R.; Zhang M. M.; Gross M. L. Mass Spectrometry-Based Protein Footprinting for Higher-Order Structure Analysis: Fundamentals and Applications. Chem. Rev. 2020, 120 (10), 4355–4454. 10.1021/acs.chemrev.9b00815. [DOI] [PMC free article] [PubMed] [Google Scholar]
- Dreger M.; Leung B. W.; Brownlee G. G.; Deng T. A quantitative strategy to detect changes in accessibility of protein regions to chemical modification on heterodimerization. Protein Sci. 2009, 18 (7), 1448–1458. 10.1002/pro.159. [DOI] [PMC free article] [PubMed] [Google Scholar]
- Gabant G.; Augier J.; Armengaud J. Assessment of solvent residues accessibility using three Sulfo-NHS-biotin reagents in parallel: application to footprint changes of a methyltransferase upon binding its substrate. J. Mass Spectrom 2008, 43 (3), 360–370. 10.1002/jms.1328. [DOI] [PubMed] [Google Scholar]
- Bayer E. A.; Wilchek M. Protein biotinylation. Methods Enzymol 1990, 184, 138–160. 10.1016/0076-6879(90)84268-L. [DOI] [PubMed] [Google Scholar]
- Wilchek M.; Bayer E. A. Introduction to avidin-biotin technology. Methods Enzymol 1990, 184, 5–13. 10.1016/0076-6879(90)84256-G. [DOI] [PubMed] [Google Scholar]
- Altin J. G.; Pagler E. B. A one-step procedure for biotinylation and chemical cross-linking of lymphocyte surface and intracellular membrane-associated molecules. Analytical biochemistry 1995, 224 (1), 382–389. 10.1006/abio.1995.1054. [DOI] [PubMed] [Google Scholar]
- Nierves L.; Lange P. F. Detectability of Biotin Tags by LC-MS/MS. J. Proteome Res. 2021, 20 (5), 3002–3008. 10.1021/acs.jproteome.0c01049. [DOI] [PubMed] [Google Scholar]
- Hamuro Y.; Coales S. J.; Southern M. R.; Nemeth-Cawley J. F.; Stranz D. D.; Griffin P. R. Rapid analysis of protein structure and dynamics by hydrogen/deuterium exchange mass spectrometry. J. Biomol. Tech 2003, 14 (3), 171–182. [PMC free article] [PubMed] [Google Scholar]
- Johnson D. T.; Di Stefano L. H.; Jones L. M. Fast photochemical oxidation of proteins (FPOP): A powerful mass spectrometry-based structural proteomics tool. J. Biol. Chem. 2019, 294 (32), 11969–11979. 10.1074/jbc.REV119.006218. [DOI] [PMC free article] [PubMed] [Google Scholar]
- Leuenberger P.; Ganscha S.; Kahraman A.; Cappelletti V.; Boersema P. J.; von Mering C.; Claassen M.; Picotti P. Cell-wide analysis of protein thermal unfolding reveals determinants of thermostability. Science 2017, 355 (6327), eaai7825. 10.1126/science.aai7825. [DOI] [PubMed] [Google Scholar]
- Huntley T. E.; Strittmatter P. The reactivity of the tyrosyl residues of cytochrome b 5. J. Biol. Chem. 1972, 247 (14), 4648–4653. 10.1016/S0021-9258(19)45036-9. [DOI] [PubMed] [Google Scholar]
- Zecha J.; Satpathy S.; Kanashova T.; Avanessian S. C.; Kane M. H.; Clauser K. R.; Mertins P.; Carr S. A.; Kuster B. TMT Labeling for the Masses: A Robust and Cost-efficient, In-solution Labeling Approach. Mol. Cell Proteomics 2019, 18 (7), 1468–1478. 10.1074/mcp.TIR119.001385. [DOI] [PMC free article] [PubMed] [Google Scholar]
- Robitaille A. M.; Huguet R.; Bomgarden R.; Canterbury J. D.; Lopez-Ferrer D. Real-Time Search enables a new gold standard for TMT quantitation accuracy on the Orbitrap Eclipse Tribrid mass spectrometer. Braz. J. Anal. Chem. 2020, 7 (29), 91–99. [Google Scholar]
- Rose G. D.; Fleming P. J.; Banavar J. R.; Maritan A. A backbone-based theory of protein folding. Proc. Natl. Acad. Sci. U. S. A. 2006, 103 (45), 16623–16633. 10.1073/pnas.0606843103. [DOI] [PMC free article] [PubMed] [Google Scholar]
- Chaudhury S.; Lyskov S.; Gray J. J. PyRosetta: a script-based interface for implementing molecular modeling algorithms using Rosetta. Bioinformatics 2010, 26 (5), 689–691. 10.1093/bioinformatics/btq007. [DOI] [PMC free article] [PubMed] [Google Scholar]
- Kabsch W.; Sander C. Dictionary of protein secondary structure: pattern recognition of hydrogen-bonded and geometrical features. Biopolymers 1983, 22 (12), 2577–2637. 10.1002/bip.360221211. [DOI] [PubMed] [Google Scholar]
- Lee B.; Richards F. M. The interpretation of protein structures: estimation of static accessibility. J. Mol. Biol. 1971, 55 (3), 379–400. 10.1016/0022-2836(71)90324-X. [DOI] [PubMed] [Google Scholar]
- Shrake A.; Rupley J. A. Environment and exposure to solvent of protein atoms. Lysozyme and insulin. J. Mol. Biol. 1973, 79 (2), 351–371. 10.1016/0022-2836(73)90011-9. [DOI] [PubMed] [Google Scholar]
- Alford R. F.; Leaver-Fay A.; Jeliazkov J. R.; O’Meara M. J.; DiMaio F. P.; Park H.; Shapovalov M. V.; Renfrew P. D.; Mulligan V. K.; Kappel K.; et al. The Rosetta All-Atom Energy Function for Macromolecular Modeling and Design. J. Chem. Theory Comput 2017, 13 (6), 3031–3048. 10.1021/acs.jctc.7b00125. [DOI] [PMC free article] [PubMed] [Google Scholar]
- Park H.; Bradley P.; Greisen P. Jr; Liu Y.; Mulligan V. K.; Kim D. E.; Baker D.; DiMaio F. Simultaneous Optimization of Biomolecular Energy Functions on Features from Small Molecules and Macromolecules. J. Chem. Theory Comput 2016, 12 (12), 6201–6212. 10.1021/acs.jctc.6b00819. [DOI] [PMC free article] [PubMed] [Google Scholar]
- RosettaCommons. Units in Rosetta; https://www.rosettacommons.org/docs/latest/rosetta_basics/Units-in-Rosetta (accessed April 25, 2022).
- Yuan Z.; Bailey T. L.; Teasdale R. D. Prediction of protein B-factor profiles. Proteins 2005, 58 (4), 905–912. 10.1002/prot.20375. [DOI] [PubMed] [Google Scholar]
- Kyte J.; Doolittle R. F. A simple method for displaying the hydropathic character of a protein. J. Mol. Biol. 1982, 157 (1), 105–132. 10.1016/0022-2836(82)90515-0. [DOI] [PubMed] [Google Scholar]
- Schonfeld D. L.; Ravelli R. B.; Mueller U.; Skerra A. The 1.8-A crystal structure of alpha1-acid glycoprotein (Orosomucoid) solved by UV RIP reveals the broad drug-binding activity of this human plasma lipocalin. J. Mol. Biol. 2008, 384 (2), 393–405. 10.1016/j.jmb.2008.09.020. [DOI] [PubMed] [Google Scholar]
- Carrell R. W.; Stein P. E.; Fermi G.; Wardell M. R. Biological implications of a 3 A structure of dimeric antithrombin. Structure 1994, 2 (4), 257–270. 10.1016/S0969-2126(00)00028-9. [DOI] [PubMed] [Google Scholar]
- Bento I.; Peixoto C.; Zaitsev V. N.; Lindley P. F. Ceruloplasmin revisited: structural and functional roles of various metal cation-binding sites. Acta Crystallogr. D: Biol. Crystallogr. 2007, 63 (2), 240–248. 10.1107/S090744490604947X. [DOI] [PMC free article] [PubMed] [Google Scholar]
- Cryo-EM structures shows the mechanistic basis of pan-peptidase inhibition by human alpha2-macroglobulin. RCSB PDB; https://www.rcsb.org/structure/removed/4acq (accessed May 16, 2022). [DOI] [PMC free article] [PubMed]
- Aggarwal M.; Tapas S.; Preeti; Siwach A.; Kumar P.; Kuhn R. J.; Tomar S. Crystal structure of aura virus capsid protease and its complex with dioxane: new insights into capsid-glycoprotein molecular contacts. PLoS One 2012, 7 (12), e51288. 10.1371/journal.pone.0051288. [DOI] [PMC free article] [PubMed] [Google Scholar]
- Schwarzenbacher R.; Zeth K.; Diederichs K.; Gries A.; Kostner G. M.; Laggner P.; Prassl R. Crystal structure of human beta2-glycoprotein I: implications for phospholipid binding and the antiphospholipid syndrome. EMBO J. 1999, 18 (22), 6228–6239. 10.1093/emboj/18.22.6228. [DOI] [PMC free article] [PubMed] [Google Scholar]
- Saul F. A.; Poljak R. J. Crystal structure of human immunoglobulin fragment Fab New refined at 2.0 A resolution. Proteins 1992, 14 (3), 363–371. 10.1002/prot.340140305. [DOI] [PubMed] [Google Scholar]
- Sugio S.; Kashima A.; Mochizuki S.; Noda M.; Kobayashi K. Crystal structure of human serum albumin at 2.5 A resolution. Protein Eng. 1999, 12 (6), 439–446. 10.1093/protein/12.6.439. [DOI] [PubMed] [Google Scholar]
- Chen Z.; Pelc L. A.; Di Cera E. Crystal structure of prethrombin-1. Proc. Natl. Acad. Sci. U. S. A. 2010, 107 (45), 19278–19283. 10.1073/pnas.1010262107. [DOI] [PMC free article] [PubMed] [Google Scholar]
- Borhani D. W.; Rogers D. P.; Engler J. A.; Brouillette C. G. Crystal structure of truncated human apolipoprotein A-I suggests a lipid-bound conformation. Proc. Natl. Acad. Sci. U. S. A. 1997, 94 (23), 12291–12296. 10.1073/pnas.94.23.12291. [DOI] [PMC free article] [PubMed] [Google Scholar]
- Sen U.; Dasgupta J.; Choudhury D.; Datta P.; Chakrabarti A.; Chakrabarty S. B.; Chakrabarty A.; Dattagupta J. K. Crystal structures of HbA2 and HbE and modeling of hemoglobin delta 4: interpretation of the thermal stability and the antisickling effect of HbA2 and identification of the ferrocyanide binding site in Hb. Biochemistry 2004, 43 (39), 12477–12488. 10.1021/bi048903i. [DOI] [PubMed] [Google Scholar]
- Otterbein L. R.; Cosio C.; Graceffa P.; Dominguez R. Crystal structures of the vitamin D-binding protein and its complex with actin: structural basis of the actin-scavenger system. Proc. Natl. Acad. Sci. U. S. A. 2002, 99 (12), 8003–8008. 10.1073/pnas.122126299. [DOI] [PMC free article] [PubMed] [Google Scholar]
- Delker S. L.; West A. P. Jr.; McDermott L.; Kennedy M. W.; Bjorkman P. J. Crystallographic studies of ligand binding by Zn-alpha2-glycoprotein. J. Struct Biol. 2004, 148 (2), 205–213. 10.1016/j.jsb.2004.04.009. [DOI] [PubMed] [Google Scholar]
- Vásquez G. B.; Karavitis M.; Ji X.; Pechik I.; Brinigar W. S.; Gilliland G. L.; Fronticelli C. Cysteines β93 and β112 as Probes of Conformational and Functional Events at the Human Hemoglobin Subunit Interfaces. Biophys. J. 1999, 76 (1), 88–97. 10.1016/S0006-3495(99)77180-8. [DOI] [PMC free article] [PubMed] [Google Scholar]
- Lewis S. M.; Wu X.; Pustilnik A.; Sereno A.; Huang F.; Rick H. L.; Guntas G.; Leaver-Fay A.; Smith E. M.; Ho C.; et al. Generation of bispecific IgG antibodies by structure-based design of an orthogonal Fab interface. Nat. Biotechnol. 2014, 32 (2), 191–198. 10.1038/nbt.2797. [DOI] [PubMed] [Google Scholar]
- Pearce M. C.; Powers G. A.; Feil S. C.; Hansen G.; Parker M. W.; Bottomley S. P. Identification and characterization of a misfolded monomeric serpin formed at physiological temperature. J. Mol. Biol. 2010, 403 (3), 459–467. 10.1016/j.jmb.2010.09.007. [DOI] [PubMed] [Google Scholar]
- Teplyakov A.; Zhao Y.; Malia T. J.; Obmolova G.; Gilliland G. L. IgG2 Fc structure and the dynamic features of the IgG CH2-CH3 interface. Mol. Immunol 2013, 56 (1–2), 131–139. 10.1016/j.molimm.2013.03.018. [DOI] [PubMed] [Google Scholar]
- Herr A. B.; Ballister E. R.; Bjorkman P. J. Insights into IgA-mediated immune responses from the crystal structures of human FcalphaRI and its complex with IgA1-Fc. Nature 2003, 423 (6940), 614–620. 10.1038/nature01685. [DOI] [PubMed] [Google Scholar]
- Briggs D. C.; Langford-Smith A. W. W.; Birchenough H. L.; Jowitt T. A.; Kielty C. M.; Enghild J. J.; Baldock C.; Milner C. M.; Day A. J. Inter-alpha-inhibitor heavy chain-1 has an integrin-like 3D structure mediating immune regulatory activities and matrix stabilization during ovulation. J. Biol. Chem. 2020, 295 (16), 5278–5291. 10.1074/jbc.RA119.011916. [DOI] [PMC free article] [PubMed] [Google Scholar]
- Greene L. H.; Chrysina E. D.; Irons L. I.; Papageorgiou A. C.; Acharya K. R.; Brew K. Role of conserved residues in structure and stability: tryptophans of human serum retinol-binding protein, a model for the lipocalin superfamily. Protein Sci. 2001, 10 (11), 2301–2316. 10.1110/ps.22901. [DOI] [PMC free article] [PubMed] [Google Scholar]
- Structural Analysis of Delval122 Transthyretin-A Deletion Mutant. RCSB PDB; https://www.rcsb.org/structure/1BZ8 (accessed May 16, 2022).
- Stodkilde K.; Torvund-Jensen M.; Moestrup S. K.; Andersen C. B. Structural basis for trypanosomal haem acquisition and susceptibility to the host innate immune system. Nat. Commun. 2014, 5, 5487. 10.1038/ncomms6487. [DOI] [PubMed] [Google Scholar]
- Shah I. S.; Lovell S.; Mehzabeen N.; Battaile K. P.; Tolbert T. J. Structural characterization of the Man5 glycoform of human IgG3 Fc. Mol. Immunol 2017, 92, 28–37. 10.1016/j.molimm.2017.10.001. [DOI] [PMC free article] [PubMed] [Google Scholar]
- Davies A. M.; Rispens T.; Ooijevaar-de Heer P.; Gould H. J.; Jefferis R.; Aalberse R. C.; Sutton B. J. Structural determinants of unique properties of human IgG4-Fc. J. Mol. Biol. 2014, 426 (3), 630–644. 10.1016/j.jmb.2013.10.039. [DOI] [PMC free article] [PubMed] [Google Scholar]
- Nishi K.; Ono T.; Nakamura T.; Fukunaga N.; Izumi M.; Watanabe H.; Suenaga A.; Maruyama T.; Yamagata Y.; Curry S.; et al. Structural insights into differences in drug-binding selectivity between two forms of human alpha1-acid glycoprotein genetic variants, the A and F1*S forms. J. Biol. Chem. 2011, 286 (16), 14427–14434. 10.1074/jbc.M110.208926. [DOI] [PMC free article] [PubMed] [Google Scholar]
- He X. M.; Ruker F.; Casale E.; Carter D. C. Structure of a human monoclonal antibody Fab fragment against gp41 of human immunodeficiency virus type 1. Proc. Natl. Acad. Sci. U. S. A. 1992, 89 (15), 7154–7158. 10.1073/pnas.89.15.7154. [DOI] [PMC free article] [PubMed] [Google Scholar]
- Structure of bsfc at 2.4 Angstroms resolution. RCSB PDB; https://www.rcsb.org/structure/6IFJ (accessed May 16, 2022).
- Szakonyi G.; Guthridge J. M.; Li D.; Young K.; Holers V. M.; Chen X. S. Structure of complement receptor 2 in complex with its C3d ligand. Science 2001, 292 (5522), 1725–1728. 10.1126/science.1059118. [DOI] [PubMed] [Google Scholar]
- Deng X.; Morris J.; Dressmen J.; Tubb M. R.; Tso P.; Jerome W. G.; Davidson W. S.; Thompson T. B. The structure of dimeric apolipoprotein A-IV and its mechanism of self-association. Structure 2012, 20 (5), 767–779. 10.1016/j.str.2012.02.020. [DOI] [PMC free article] [PubMed] [Google Scholar]
- Structure of Fibronectin domain 12–14. RCSB PDB; https://www.rcsb.org/structure/3R8Q (accessed May 16, 2022).
- McPherson A.; Larson S. B. The structure of human apolipoprotein C-1 in four different crystal forms. J. Lipid Res. 2019, 60 (2), 400–411. 10.1194/jlr.M089441. [DOI] [PMC free article] [PubMed] [Google Scholar]
- Shin K.; Lechtenberg B. C.; Fujimoto L. M.; Yao Y.; Bartra S. S.; Plano G. V.; Marassi F. M. Structure of human Vitronectin C-terminal domain and interaction with Yersinia pestis outer membrane protein Ail. Sci. Adv. 2019, 5 (9), eaax5068. 10.1126/sciadv.aax5068. [DOI] [PMC free article] [PubMed] [Google Scholar]
- Structure of the CXC Chemokine, Connective Tissue Activating Peptide-III, Complexed with the Heparin Analogue, Polyvinylsulfonic Acid. RCSB PDB; https://www.rcsb.org/structure/1f9p (accessed May 16, 2022).
- Tame J. R. H.; Vallone B. The structures of deoxy human haemoglobin and the mutant Hb Tyr—42His at 120 K. Acta Crystallogr. D Biol. Crystallogr. 2000, D56, 805. 10.1107/S0907444900006387. [DOI] [PubMed] [Google Scholar]
- Clark L. E.; Mahmutovic S.; Raymond D. D.; Dilanyan T.; Koma T.; Manning J. T.; Shankar S.; Levis S. C.; Briggiler A. M.; Enria D. A.; et al. Vaccine-elicited receptor-binding site antibodies neutralize two New World hemorrhagic fever arenaviruses. Nat. Commun. 2018, 9 (1), 1884. 10.1038/s41467-018-04271-z. [DOI] [PMC free article] [PubMed] [Google Scholar]
- Petersen C. M.; Edwards K. C.; Gilbert N. C.; Vincent J. B.; Thompson M. K. X-ray structure of chromium(III)-containing transferrin: First structure of a physiological Cr(III)-binding protein. J. Inorg. Biochem 2020, 210, 111101. 10.1016/j.jinorgbio.2020.111101. [DOI] [PubMed] [Google Scholar]
- Wang M.; Lai T. P.; Wang L.; Zhang H.; Yang N.; Sadler P. J.; Sun H. ″Anion clamp″ allows flexible protein to impose coordination geometry on metal ions. Chem. Commun. (Camb) 2015, 51 (37), 7867–7870. 10.1039/C4CC09642H. [DOI] [PubMed] [Google Scholar]
- Ramachandran L. Protein-iodine interaction. Chem. Rev. 1956, 56 (2), 199–218. 10.1021/cr50008a001. [DOI] [Google Scholar]
- Geyer P. E.; Kulak N. A.; Pichler G.; Holdt L. M.; Teupser D.; Mann M. Plasma Proteome Profiling to Assess Human Health and Disease. Cell Syst 2016, 2 (3), 185–195. 10.1016/j.cels.2016.02.015. [DOI] [PubMed] [Google Scholar]
- Huang D. W.; Sherman B. T.; Lempicki R. A. Bioinformatics enrichment tools: paths toward the comprehensive functional analysis of large gene lists. Nucleic Acids Res. 2009, 37 (1), 1–13. 10.1093/nar/gkn923. [DOI] [PMC free article] [PubMed] [Google Scholar]
- Huang D.; Sherman B.; Lempicki R. Systematic and integrative analysis of large gene lists using DAVID bioinformatics resources. Nat. Protoc. 2009, 4 (1), 44–57. 10.1038/nprot.2008.211. [DOI] [PubMed] [Google Scholar]
- Nikam R.; Kulandaisamy A.; Harini K.; Sharma D.; Gromiha M. M. ProThermDB: thermodynamic database for proteins and mutants revisited after 15 years. Nucleic Acids Res. 2021, 49 (D1), D420–D424. 10.1093/nar/gkaa1035. [DOI] [PMC free article] [PubMed] [Google Scholar]
- Garbett N. C.; Miller J. J.; Jenson A. B.; Chaires J. B. Calorimetry outside the box: a new window into the plasma proteome. Biophys. J. 2008, 94 (4), 1377–1383. 10.1529/biophysj.107.119453. [DOI] [PMC free article] [PubMed] [Google Scholar]
- Acharya P.; Segall M. L.; Zaiou M.; Morrow J.; Weisgraber K. H.; Phillips M. C.; Lund-Katz S.; Snow J. Comparison of the stabilities and unfolding pathways of human apolipoprotein E isoforms by differential scanning calorimetry and circular dichroism. Biochim. Biophys. Acta 2002, 1584 (1), 9–19. 10.1016/S1388-1981(02)00263-9. [DOI] [PubMed] [Google Scholar]
- Jayaraman S.; Gantz D. L.; Gursky O. Kinetic stabilization and fusion of apolipoprotein A-2:DMPC disks: comparison with apoA-1 and apoC-1. Biophys. J. 2005, 88 (4), 2907–2918. 10.1529/biophysj.104.055921. [DOI] [PMC free article] [PubMed] [Google Scholar]
- Musci G.; Bonaccorsi di Patti M. C.; Petruzzelli R.; Giartosio A.; Calabrese L. Divalent cation binding to ceruloplasmin. Biometals 1996, 9 (1), 66–72. 10.1007/BF00188092. [DOI] [PubMed] [Google Scholar]
- Kazmirski S. L.; Isaacson R. L.; An C.; Buckle A.; Johnson C. M.; Daggett V.; Fersht A. R. Loss of a metal-binding site in gelsolin leads to familial amyloidosis-Finnish type. Nat. Struct. Biol. 2002, 9 (2), 112–116. 10.1038/nsb745. [DOI] [PubMed] [Google Scholar]
- Shnyrov V. L.; Villar E.; Zhadan G. G.; Sanchez-Ruiz J. M.; Quintas A.; Saraiva M. J.; Brito R. M. Comparative calorimetric study of non-amyloidogenic and amyloidogenic variants of the homotetrameric protein transthyretin. Biophys Chem. 2000, 88 (1–3), 61–67. 10.1016/S0301-4622(00)00199-X. [DOI] [PubMed] [Google Scholar]
- Zhuang P.; Chen A. I.; Peterson C. B. Native and Multimeric Vitronectin Exhibit Similar Affinity for Heparin: DIFFERENCES IN HEPARIN BINDING PROPERTIES INDUCED UPON DENATURATION ARE DUE TO SELF-ASSOCIATION INTO A MULTIVALENT FORM*. J. Biol. Chem. 1997, 272 (11), 6858–6867. 10.1074/jbc.272.11.6858. [DOI] [PubMed] [Google Scholar]
- Rabbani G.; Ahn S. N. Structure, enzymatic activities, glycation and therapeutic potential of human serum albumin: A natural cargo. Int. J. Biol. Macromol. 2019, 123, 979–990. 10.1016/j.ijbiomac.2018.11.053. [DOI] [PubMed] [Google Scholar]
- Nilsen J.; Trabjerg E.; Grevys A.; Azevedo C.; Brennan S. O.; Stensland M.; Wilson J.; Sand K. M. K.; Bern M.; Dalhus B.; et al. An intact C-terminal end of albumin is required for its long half-life in humans. Commun. Biol. 2020, 3 (1), 181. 10.1038/s42003-020-0903-7. [DOI] [PMC free article] [PubMed] [Google Scholar]
- Mazurier J.; Lhoste J. M.; Montreuil J.; Spik G. Comparative study of the iron-binding properties of human transferrins. II. Electron paramagnetic resonance of mixed metal complexes of human lactotransferrin. Biochim. Biophys. Acta 1983, 745 (1), 44–49. 10.1016/0167-4838(83)90168-1. [DOI] [PubMed] [Google Scholar]
- Krysteva M. A.; Mazurier J.; Spik G.; Montreuil J. Comparative study on histidine modification by diethylpyrocarbonate in human serotransferrin and lactotransferrin. FEBS Lett. 1975, 56 (2), 337–340. 10.1016/0014-5793(75)81122-7. [DOI] [PubMed] [Google Scholar]
- Noinaj N.; Easley N. C.; Oke M.; Mizuno N.; Gumbart J.; Boura E.; Steere A. N.; Zak O.; Aisen P.; Tajkhorshid E.; et al. Structural basis for iron piracy by pathogenic Neisseria. Nature 2012, 483 (7387), 53–58. 10.1038/nature10823. [DOI] [PMC free article] [PubMed] [Google Scholar]
- Kulakova A.; Indrakumar S.; Sonderby P.; Gentiluomo L.; Streicher W.; Roessner D.; Friess W.; Peters G. H. J.; Harris P. Small angle X-ray scattering and molecular dynamic simulations provide molecular insight for stability of recombinant human transferrin. J. Struct Biol. X 2020, 4, 100017. 10.1016/j.yjsbx.2019.100017. [DOI] [PMC free article] [PubMed] [Google Scholar]
- Elsayed M. E.; Sharif M. U.; Stack A. G. Transferrin Saturation: A Body Iron Biomarker. Adv. Clin Chem. 2016, 75, 71–97. 10.1016/bs.acc.2016.03.002. [DOI] [PubMed] [Google Scholar]
- The additional metal-binding site on human serum transferrin surface. RCSB PDB; https://www.rcsb.org/structure/5X5P (accessed May 16, 2022).
- Binding of ruthenium and osmium at non-iron sites of transferrin explains their iron-independent cellular uptake. RCSB PDB; https://www.rcsb.org/structure/6JAS (accessed May 16, 2022). [DOI] [PubMed]
- Wally J.; Halbrooks P. J.; Vonrhein C.; Rould M. A.; Everse S. J.; Mason A. B.; Buchanan S. K. The crystal structure of iron-free human serum transferrin provides insight into inter-lobe communication and receptor binding. J. Biol. Chem. 2006, 281 (34), 24934–24944. 10.1074/jbc.M604592200. [DOI] [PMC free article] [PubMed] [Google Scholar]
- Pratt R.; Handelman G. J.; Edwards T. E.; Gupta A. Ferric pyrophosphate citrate: interactions with transferrin. Biometals 2018, 31 (6), 1081–1089. 10.1007/s10534-018-0142-2. [DOI] [PMC free article] [PubMed] [Google Scholar]
- Yang N.; Zhang H.; Wang M.; Hao Q.; Sun H. Iron and bismuth bound human serum transferrin reveals a partially-opened conformation in the N-lobe. Sci. Rep 2012, 2, 999. 10.1038/srep00999. [DOI] [PMC free article] [PubMed] [Google Scholar]
- Ruthenium bound to the N-lobe of human serum transferrin. RCSB PDB; https://www.rcsb.org/structure/5wtd(accessed May 16, 2022).
- Calmettes C.; Alcantara J.; Yu R. H.; Schryvers A. B.; Moraes T. F. The structural basis of transferrin sequestration by transferrin-binding protein B. Nat. Struct Mol. Biol. 2012, 19 (3), 358–360. 10.1038/nsmb.2251. [DOI] [PMC free article] [PubMed] [Google Scholar]
- Jiang N.; Cheng T.; Wang M.; Chan G. C.; Jin L.; Li H.; Sun H. Tracking iron-associated proteomes in pathogens by a fluorescence approach. Metallomics 2018, 10 (1), 77–82. 10.1039/C7MT00275K. [DOI] [PubMed] [Google Scholar]
- Tinoco A. D.; Saxena M.; Sharma S.; Noinaj N.; Delgado Y.; Quinones Gonzalez E. P.; Conklin S. E.; Zambrana N.; Loza-Rosas S. A.; Parks T. B. Unusual Synergism of Transferrin and Citrate in the Regulation of Ti(IV) Speciation, Transport, and Toxicity. J. Am. Chem. Soc. 2016, 138 (17), 5659–5665. 10.1021/jacs.6b01966. [DOI] [PMC free article] [PubMed] [Google Scholar]
- David D. C.; Ollikainen N.; Trinidad J. C.; Cary M. P.; Burlingame A. L.; Kenyon C. Widespread protein aggregation as an inherent part of aging in C. elegans. PLoS Biol. 2010, 8 (8), e1000450. 10.1371/journal.pbio.1000450. [DOI] [PMC free article] [PubMed] [Google Scholar]
- Mason A. B.; He Q.-Y.; Halbrooks P. J.; Everse S. J.; Gumerov D. R.; Kaltashov I. A.; Smith V. C.; Hewitt J.; MacGillivray R. T. A. Differential Effect of a His Tag at the N- and C-Termini: Functional Studies with Recombinant Human Serum Transferrin. Biochemistry 2002, 41 (30), 9448–9454. 10.1021/bi025927l. [DOI] [PubMed] [Google Scholar]
- Williams J.; Moreton K. The dimerization of half-molecule fragments of transferrin. Biochem. J. 1988, 251 (3), 849–855. 10.1042/bj2510849. [DOI] [PMC free article] [PubMed] [Google Scholar]
- MASON A. B.; WOODWORTH R. C.; OLIVER R. W. A.; GREEN B. N.; LIN L.-N.; BRANDTS J. F.; SAVAGE K. J.; TAM B. M.; MACGILLIVRAY R. T. A. Association of the two lobes of ovotransferrin is a prerequisite for receptor recognition. Studies with recombinant ovotransferrins. Biochem. J. 1996, 319 (2), 361–368. 10.1042/bj3190361. [DOI] [PMC free article] [PubMed] [Google Scholar]
- West G. M.; Tang L.; Fitzgerald M. C. Thermodynamic Analysis of Protein Stability and Ligand Binding Using a Chemical Modification- and Mass Spectrometry-Based Strategy. Anal. Chem. 2008, 80 (11), 4175–4185. 10.1021/ac702610a. [DOI] [PubMed] [Google Scholar]
- West G. M.; Tucker C. L.; Xu T.; Park S. K.; Han X.; Yates J. R. 3rd; Fitzgerald M. C. Quantitative proteomics approach for identifying protein-drug interactions in complex mixtures using protein stability measurements. Proc. Natl. Acad. Sci. U. S. A. 2010, 107 (20), 9078–9082. 10.1073/pnas.1000148107. [DOI] [PMC free article] [PubMed] [Google Scholar]
Associated Data
This section collects any data citations, data availability statements, or supplementary materials included in this article.