

Abstract
Background
Novel parameters that detect failed microvascular reperfusion might identify better the patients likely to benefit from adjunctive treatments during primary percutaneous coronary intervention (PCI).
Aims
The aim of this study was to test the hypothesis that a novel invasive parameter, the thermodilution-derived temperature recovery time (TRT), would be associated with microvascular obstruction (MVO) and prognosis.
Methods
TRT was derived and validated in two independent ST-elevation myocardial infarction populations and was measured immediately post PCI. TRT was defined as the duration (seconds) from the nadir of the hyperaemic thermodilution curve to 20% from baseline body temperature. MVO extent (% left ventricular mass) was assessed by cardiovascular magnetic resonance imaging at 2-7 days.
Results
In the retrospective derivation cohort (n=271, mean age 60±12 years, 72% male), higher TRT was associated with more MVO (coefficient: 4.09 [95% CI: 2.70-5.48], p<0.001), independently of IMR >32, CFR ≤2, hyperaemic Tmn >median, thermodilution waveform, age and ischaemic time. At five years, higher TRT was multivariably associated with all-cause death/heart failure hospitalisation (OR 4.14 [95% CI: 2.08-8.25], p<0.001) and major adverse cardiac events (OR 4.05 [95% CI: 2.00-8.21], p<0.001). In the validation population (n=144, mean age 59±11 years, 80% male), the findings were confirmed prospectively.
Conclusions
TRT represents a novel diagnostic advance for predicting MVO and prognosis. ClinicalTrials.gov Identifiers: NCT02072850 & NCT02257294
Introduction
Microvascular obstruction (MVO) reflects failed myocardial reperfusion following acute ST-segment elevation myocardial infarction (STEMI). Despite routinely restoring epicardial coronary patency with primary percutaneous coronary intervention (PCI), MVO affects about half of patients and impairs prognosis1. There are no evidence-based treatments for MVO. Novel parameters that measure failed microvascular reperfusion accurately, and provide prognostic information incremental to clinical indices, have potential to refine clinical trial design. Stratified medicine is the identification of patient subgroups that are distinguishable from a heterogenous population by disease severity and potential response to treatments during primary PCI2.
The index of microcirculatory resistance (IMR) is a validated measure of the immediate efficacy of microcirculatory reperfusion3. Higher IMR values indicate greater degrees of microvascular dysfunction. An IMR ≥32 or >40 predicts all-cause death or heart failure hospitalisations4. An IMR >32 also predicts worse recovery of left ventricular (LV) function post STEMI5 and is being used to select patients for clinical trials (RESTORE-MI [ACTRN12618000778280]). However, there are limitations for clinical translation, e.g., when calculating IMR the clinician should verify that the software has correctly positioned the distal coronary pressure (Pd) marker at the lowest stable Pd divided by mean aortic pressure (Pa) in hyperaemia (Pd/Pa)2. Second, manual saline injection can be a source of variability2. This variability can be reduced by thermodilution-based absolute flow and resistance measurement, using continuous saline infusion through a dedicated coronary catheter6.
Coronary flow reserve (CFR)7 and bimodal thermodilution waveforms8 have also been associated with MVO and clinical outcomes. However, due to variations in resting flow, CFR has limited reproducibility3. The potential of bimodal waveform for clinical translation is limited by requiring off-line processing for waveform classification and, if used alone, bimodal waveform may miss some high-risk patients2.
We theorised that the later part of the thermodilution curve might be less susceptible to variability in the speed of manual intracoronary saline injections. We conceived and evaluated a novel parameter, termed temperature recovery time (TRT). TRT is the time taken (seconds) for temperature recorded at the distal wire sensor to recover from the nadir value to baseline body temperature, during maximal hyperaemia. We hypothesised that TRT would be associated with the amount of MVO and clinical outcomes.
Methods
POPULATION
TRT was derived from a retrospective cohort of 288 consecutive all-comer acute STEMI patients, who underwent emergency PCI, from a single centre (2011-2012) (MR-MI Study; NCT02072850)9 (Supplementary Figure 1).
Validation of TRT was performed prospectively in patients from the physiology substudy of the T-TIME trial (NCT02257294)10. From 2016 to 2017, 144 patients with acute STEMI, from three U.K. hospitals, were randomised to intracoronary alteplase (10 mg or 20 mg) or placebo, infused into the culprit artery before stenting. Eligibility criteria are shown in Supplementary Appendix 1.
The studies were approved by the National Research Ethics Service (13-WS-0119 and 10-S0703-28) and complied with the Declaration of Helsinki.
INVASIVE CORONARY PHYSIOLOGY
IMR (PdxTmn during hyperaemia3), CFR (resting Tmn ÷ hyperaemic Tmn7) and TRT were measured post PCI, using a pressure- and temperature-sensing guidewire (Abbott Vascular, Temecula, CA, USA), using standard thermodilution methodology (Supplementary Appendix 2). The shapes of hyperaemic thermodilution curves were assessed as narrow unimodal, wide unimodal, or bimodal8 (Supplementary Appendix 2).
TRT was defined as the duration (seconds) from the nadir of the hyperaemic thermodilution curve to 20% from baseline temperature. The optimal threshold (20%) for the end of the TRT measurement was chosen after comparison of five percentage thresholds (i.e., 7.5%, 10%, 20%, 30% and 60%), from the first 100 consecutive patients in the derivation cohort. The percentage threshold that gave the highest area under the curve (AUC) for predicting MVO on receiver operating characteristic (ROC) curve analysis was used to define TRT (Supplementary Figure 2). If the time when the temperature returns exactly to baseline is used, then the TRT parameter becomes sensitive to small errors in the measurement. The mean TRT (from triplicate measurements) was calculated using an automated algorithm using dedicated software (Coroventis, Uppsala, Sweden). In the derivation cohort, TRT was calculated retrospectively. In the validation cohort, coronary physiology parameters were calculated prospectively and were submitted to the data coordination centre prior to database lock.
ANGIOGRAM AND ELECTROCARDIOGRAM ANALYSES
Percentage ST-segment resolution on electrocardiograms (ECGs) obtained 60 minutes post reperfusion compared to pre reperfusion was calculated. Angiographic analyses included Thrombolysis In Myocardial Infarction (TIMI) coronary flow grade, corrected TIMI frame count and myocardial perfusion grade (Supplementary Appendix 3).
CARDIOVASCULAR MAGNETIC RESONANCE
CMR imaging was performed at 1.5-Tesla. MVO extent (% LV mass) was demonstrated by late gadolinium enhancement imaging, at 2-7 days post PCI. The CMR protocols in these studies were similar and have been described previously9,10.
CLINICAL OUTCOMES
The clinical outcomes were: (i) all-cause death or hospitalisation for heart failure after the initial acute STEMI, and (ii) major adverse cardiac events (MACE), defined as cardiac death, non-fatal MI, or heart failure hospitalisation. Clinical outcomes were independently assessed by physicians who were blinded to the other data. Clinical follow-up was completed for all patients.
STATISTICAL ANALYSIS
Associations with MVO extent were assessed with linear regression, and the regression coefficients represented mean change in MVO extent for a 1-unit increase in TRT. Association with MVO presence or clinical outcomes was evaluated using odds ratios (ORs), from logistic regression. The associations with MVO were adjusted for age, ischaemic time, CFR ≤2, IMR >32, hyperaemic Tmn >median and thermodilution waveform (bimodal or wide unimodal vs narrow unimodal). There was a priori concern that these covariates were clinically relevant confounders. ROC curve comparisons were made using the DeLong method. Further details of the statistical methods are shown in Supplementary Appendix 4.
Results
The flow of patients through the study is shown in Supplementary Figure 1. The findings were broadly similar when IMR >32 was substituted for IMR >40 in multivariable regression analyses (Supplementary Table 1-Supplementary Table 3).
POPULATION CHARACTERISTICS
DERIVATION POPULATION
Seventeen patients were excluded from the derivation cohort because coronary physiology recordings were unsuitable for digital analysis. Among the 271 included patients (mean age 60±12 years, 72% male) (Table 1, Table 2), most (92%) underwent primary PCI, whilst seven had PCI after successful thrombolysis, and 14 had PCI after failed thrombolysis.
Table 1. Characteristics of the derivation population.
| Derivation population characteristics | Overall (n=271) | TRT ≤0.5 (n=143) | TRT >0.5 (n=128) | p-value | |
| Age, years | 59.5±1.5 | 57.2±11.1 | 62.0±11.4 | 0.001† | |
| Male | 194 (71.6) | 98 (68.5) | 96 (75.0) | 0.239‡ | |
| Current smoker | 170 (62.7) | 98 (68.5) | 72 (56.3) | 0.037‡ | |
| Body mass index, kg/m2 | 28.7±4.8 | 29.2±4.9 | 28.0±4.5 | 0.040† | |
| Hypertension | 85 (31.4) | 45 (31.5) | 40 (31.3) | 0.969‡ | |
| Diabetes mellitus | 30 (11.1) | 15 (10.5) | 15 (11.7) | 0.747‡ | |
| Previous myocardial infarction | 18 (6.6) | 9 (6.3) | 9 (7.0) | 0.808‡ | |
| Reperfusion strategy | Primary PCI | 250 (92.3) | 134 (93.7) | 116 (90.6) | 0.344‡ |
| Thrombolysis followed by PCI | 21 (7.8) | 9 (6.3) | 12 (9.4) | ||
| Presenting heart rate, beats per minute | 78.1±16.7 | 78.2±16.9 | 78.0±16.7 | 0.928† | |
| Presenting systolic blood pressure, mmHg | 135.2±25.1 | 134.5±24.8 | 133.2±25.4 | 0.217† | |
| Ischaemic time, hours, median (IQR) | 2.92 (2.0-5.4) | 2.8 (2.0-5.0) | 3.4 (2.2-5.7) | 0.101§ | |
| Baseline creatinine, μmol/L | 76.9±18.8 | 74.5±19.1 | 79.7±18.1 | 0.022‡ | |
| Procedural characteristics | |||||
| Culprit artery | Left anterior descending/left main | 100 (36.9) | 50 (35.0) | 50 (39.1) | 0.364‡ |
| Circumflex | 52 (19.2) | 32 (22.4) | 20 (15.6) | ||
| Right coronary artery | 119 (43.9) | 61 (42.7) | 58 (45.3) | ||
| No. of main vessels diseased | 1 | 148 (54.6) | 78 (54.6) | 70 (54.7) | 0.650‡ |
| 2 | 84 (31.0) | 42 (29.4) | 42 (32.8) | ||
| 3 | 39 (14.4) | 23 (16.1) | 16 (12.5) | ||
| Thrombus aspiration | 195 (72.0) | 102 (71.3) | 93 (72.7) | 0.808‡ | |
| Glycoprotein IIb/IIIa inhibitor | 249 (91.9) | 132 (92.3) | 117 (91.4) | 0.786‡ | |
| Data are mean±SD, or n (%) unless otherwise stated. † Student’s t-test. ‡ χ2 test. § Mann-Whitney test. Missing data: ischaemic time, n=18; creatinine n=1. IQR: interquartile range; PCI: percutaneous coronary intervention; TRT: temperature recovery time | |||||
Table 2. From the derivation population, electrocardiogram, angiogram, and coronary physiology parameters on admission and CMR findings at 2-7 days after PCI for STEMI.
| Derivation population parameters | Overall (n=271) | TRT ≤0.5 (n=143) | TRT >0.5 (n=128) | p-value | |
| Electrocardiogram | |||||
| ST-segment resolution | Complete, ≥70% | 123 (45.6) | 76 (53.5) | 47 (36.7) | 0.020‡ |
| <70% | 147 (54.4) | 66 (46.5) | 81 (63.3) | ||
| Angiogram | |||||
| Initial TIMI coronary flow grade | 0 | 157 (57.9) | 73 (51.1) | 84 (65.6) | 0.029‡ |
| 1 | 34 (12.6) | 18 (12.6) | 16 (12.5) | ||
| 2 | 43 (15.9) | 25 (17.5) | 18 (14.1) | ||
| 3 | 37 (13.7) | 27 (18.9) | 10 (7.8) | ||
| Final TIMI coronary flow grade | 1 | 1 (0.4) | 1 (0.7) | 0 | 0.003‡ |
| 2 | 13 (4.8) | 1 (0.7) | 12 (9.4) | ||
| 3 | 257 (94.8) | 141 (98.6) | 116 (90.6) | ||
| TIMI frame count post PCI, median (IQR) | 14.0 (10.0-24.0) | 12.0 (8.2-20.0) | 17.8 (10.6-25.4) | 0.004§ | |
| Myocardial perfusion grade post PCI | ≤1 | 76 (28.0) | 32 (22.4) | 44 (34.4) | 0.028‡ |
| ≥2 | 195 (72.0) | 111 (77.6) | 84 (65.6) | ||
| Coronary physiology post PCI | |||||
| Hyperaemic Pa, mmHg, median (IQR) | 76.0 (68.0-87.0) | 76.0 (68.0-89.0) | 76.0 (67.0-86.5) | 0.515§ | |
| Hyperaemic Pd, mmHg, median (IQR) | 70.0 (60.0-80.0) | 69.0 (60.0-79.8) | 71.0 (60.0-81.5) | 0.983§ | |
| IMR, median (IQR) | 24.0 (15.0-43.0) | 15.4 (11.0-21.1) | 44.1 (27.0-63.0) | <0.001§ | |
| IMR >32 | 100 (36.9) | 13 (9.1) | 87 (68.0) | <0.001§ | |
| CFR, median (IQR) | 1.6 (1.1-2.1) | 1.7 (1.3-2.4) | 1.4 (1.0-1.8) | <0.001§ | |
| CFR ≤2 | 196 (72.3) | 93 (66.0) | 103 (83.1) | 0.002‡ | |
| Hyperaemic Tmn, sec, median (IQR) | 0.4 (0.2-0.6) | 0.2 (0.2-0.3) | 0.6 (0.4-0.9) | <0.001§ | |
| Hyperaemic Tmn >median | 132 (48.7) | 22 (15.4) | 110 (0.9) | <0.001‡ | |
| Waveform | Bimodal | 34 (12.5) | 5 (3.5) | 29 (22.7) | <0.001‡ |
| Wide unimodal | 98 (36.2) | 38 (26.6) | 60 (46.9) | ||
| Narrow unimodal | 139 (51.3) | 100 (69.9) | 39 (30.5) | ||
| CMR 2-7 days after PCI | |||||
| Time from PCI to CMR, days | 2.1±1.9 | 2.2±1.9 | 1.9±1.9 | 0.174† | |
| MVO extent (% left ventricular mass) | 0.2 (0.0-3.3) | 0.0 (0.0-1.6) | 2.0 (0.0-6.8) | <0.001§ | |
| MVO present | 138 (50.9) | 53 (37.1) | 85 (66.4) | <0.001‡ | |
| Data are mean±SD, or n (%) unless otherwise stated. ‡ χ2 test. § Mann-Whitney test. † Student’s t-test. Missing: CFR, n=6; Pa post PCI, n=57; ST-segment resolution, n=1; MVO extent, n=1. CFR: coronary flow reserve; CMR: cardiovascular magnetic resonance; IMR: index of microcirculatory resistance; IQR: interquartile range; MVO: microvascular obstruction; Pa: aortic pressure; PCI: percutaneous coronary intervention; Pd: distal coronary pressure; TIMI: Thrombolysis In Myocardial Infarction; Tmn: mean transit time; TRT: temperature recovery time | |||||
TRT (median: 0.5; range: 0.1-2.5) had a right-skewed distribution (Supplementary Figure 3). TRT correlated with IMR (r=0.8, p<0.001), CFR (r= -0.3, p<0.001) and with hyperaemic Tmn (r=0.9, p<0.001). Baseline and procedural characteristics associated with higher TRT in multivariable linear regression analysis were: IMR >32 (p<0.001), hyperaemic Tmn >median (p<0.001), CFR ≤2 (p<0.001), bimodal or wide unimodal thermodilution waveform (p=0.018), TIMI coronary flow grade post PCI ≤2 (p<0.001), and higher creatinine (p=0.044).
VALIDATION POPULATION
The median TRT in the validation population (n=144) was 0.5 (range: 0.2-2.4). Baseline and procedural characteristics (Supplementary Table 4, Supplementary Table 5) associated with higher TRT in multivariable linear regression analysis were bimodal or wide unimodal thermodilution waveform, higher final TIMI frame count and hyperaemic Tmn >median (all p<0.001).
ASSOCIATIONS OF TRT WITH MVO
DERIVATION POPULATION
In the derivation population, MVO presence/absence was available in 271 patients, and MVO extent was evaluable in 270 patients. MVO was present in 138 patients (51%). In ROC curve analysis, there was no difference in the discriminatory ability of TRT compared to IMR for predicting MVO presence (Figure 1). The TRT cut-off with the highest combination of sensitivity (61%) and specificity (68%) for predicting MVO presence was >0.5. Case examples are shown in Supplementary Figure 4.
Figure 1.
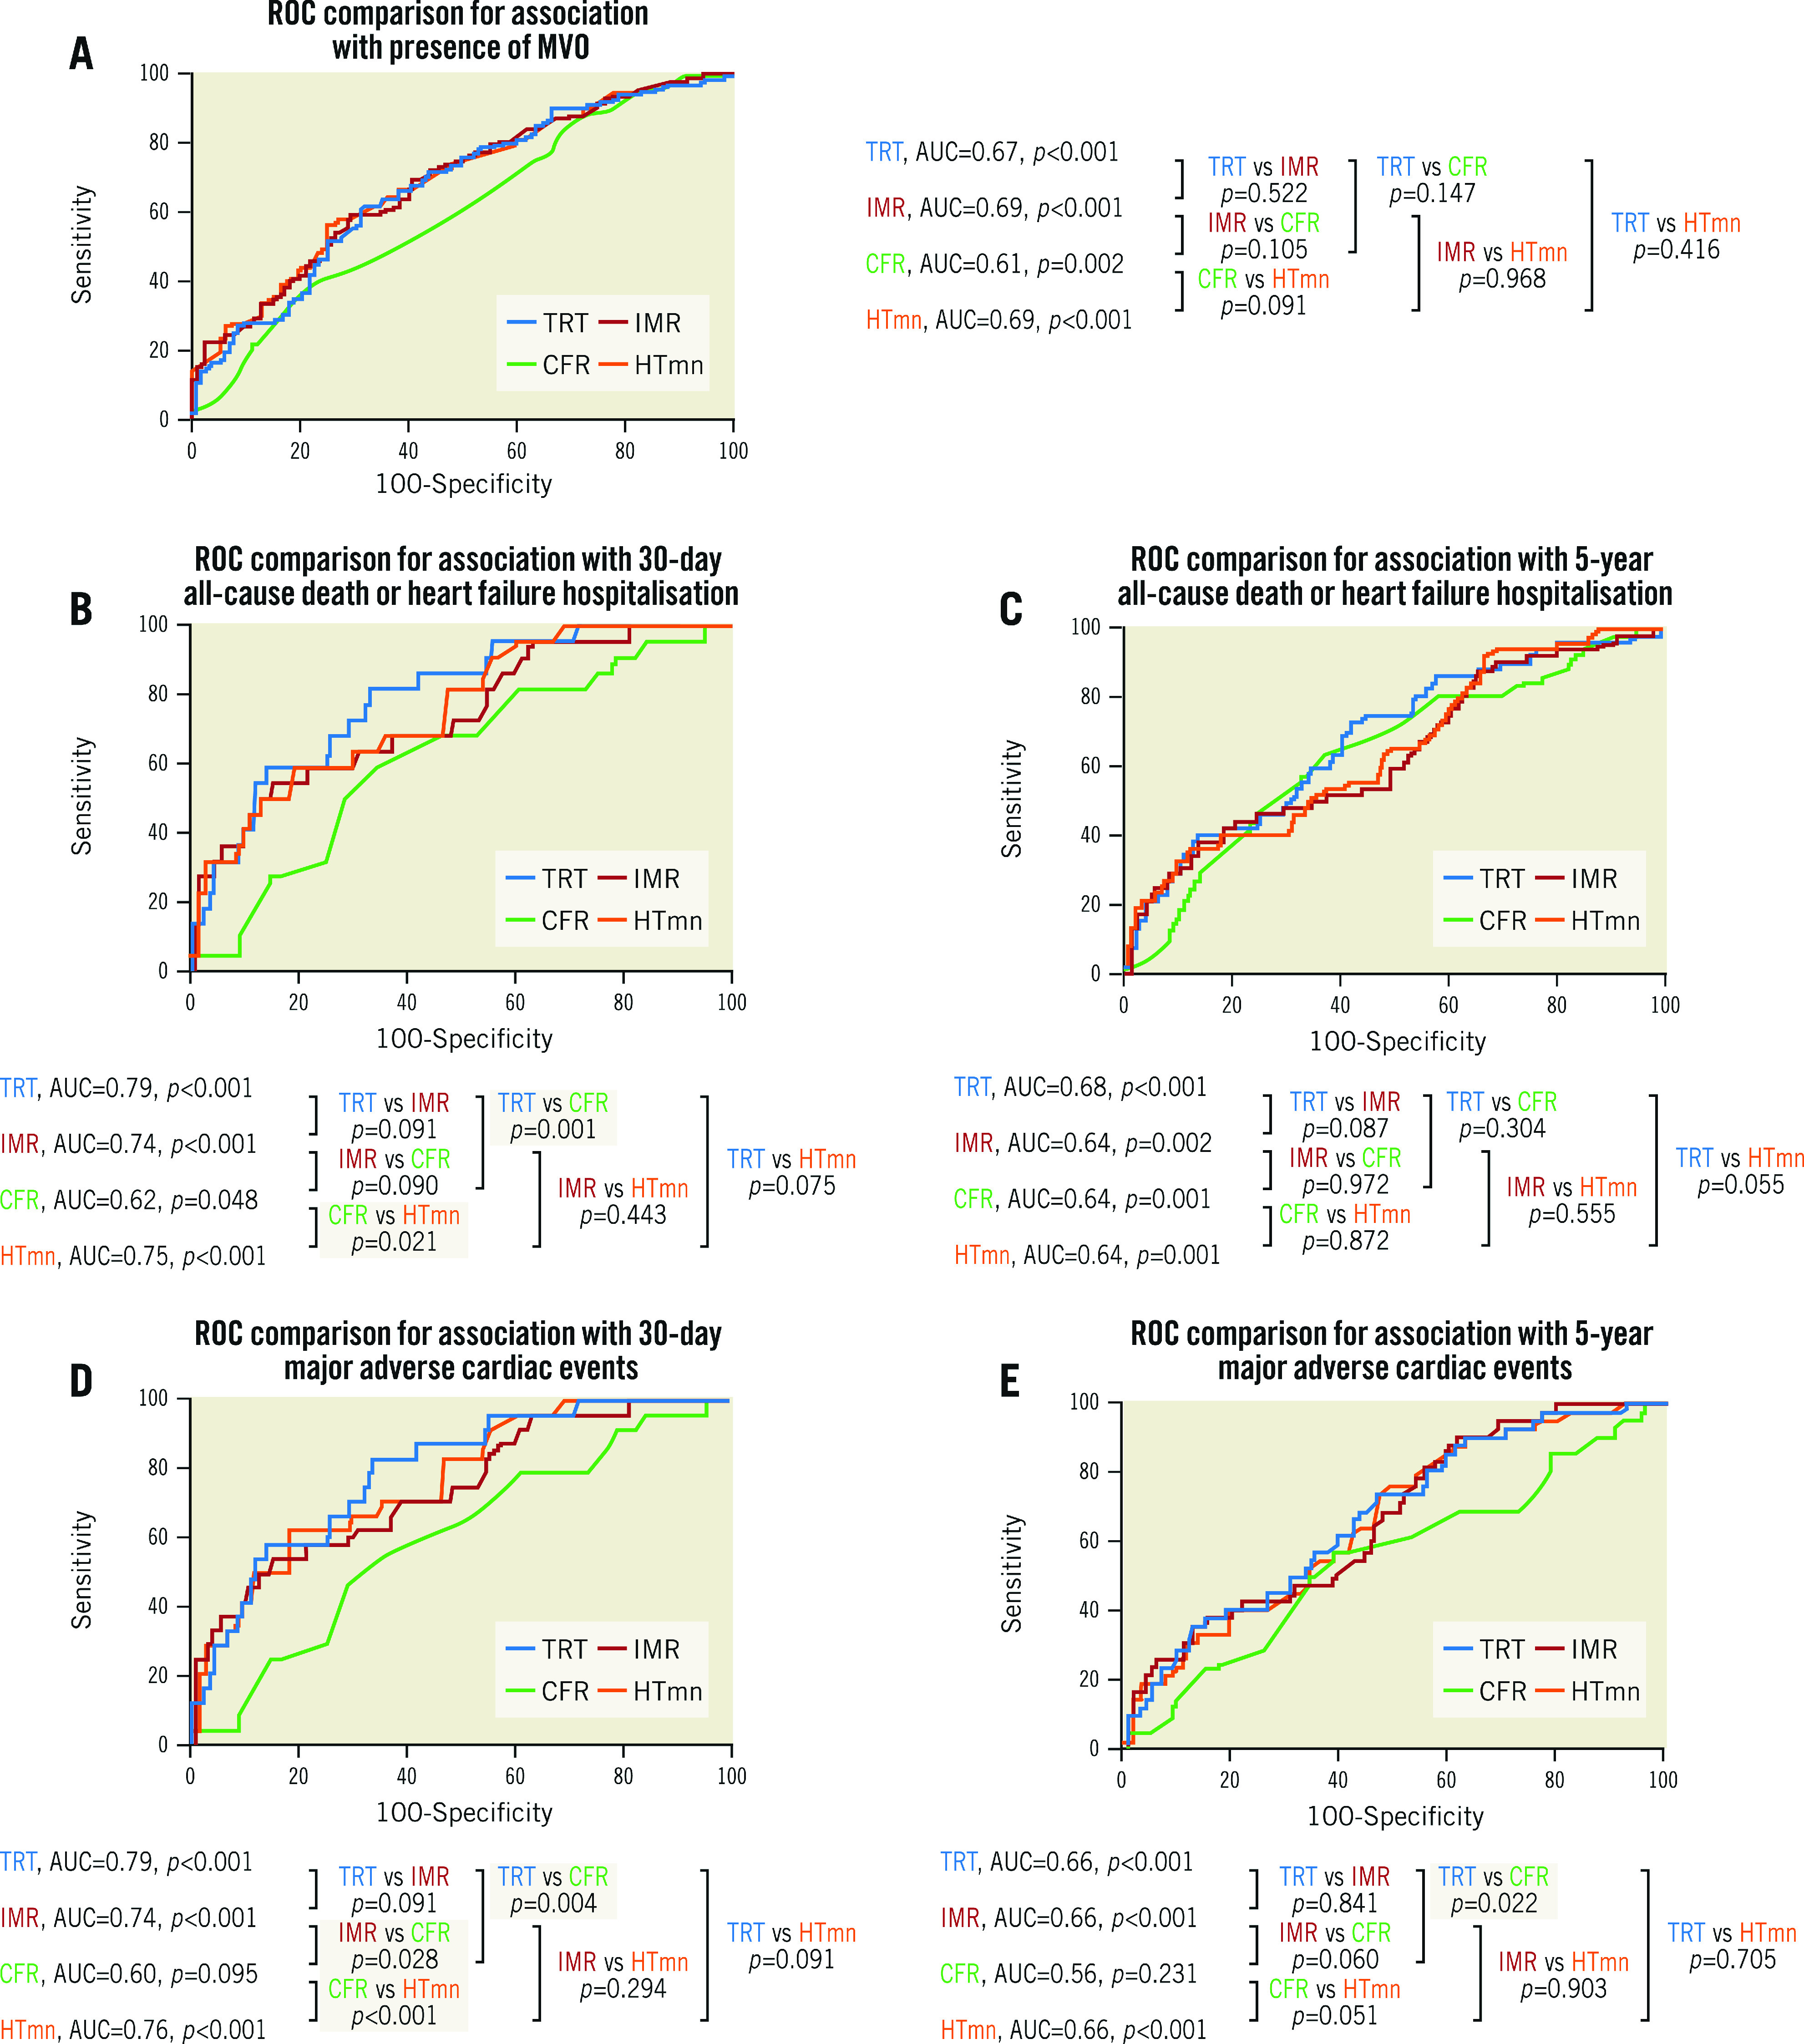
. ROC curves from the derivation population, for association with presence of MVO (A), death/heart failure hospitalisation (B & C), and MACE (D & E). CFR: coronary flow reserve; HTmn: mean hyperaemic transit time; IMR: index of microcirculatory resistance; MVO: microvascular obstruction; ROC: receiver operating characteristic; TRT: temperature recovery time
TRT dichotomised by 0.5 correctly predicted MVO presence, or absence, in 65% (n=175/271) of patients. IMR dichotomised by 32 correctly predicted MVO presence, or absence, in 62.0% (n=167/271) of patients. There was no difference in the predictive accuracy for detecting MVO presence/absence, when TRT and IMR dichotomised by 0.5 and 32, respectively, were compared, using the McNemar test (difference 2.95% [95% confidence interval [CI]: −2.39%, 8.29%], p=0.341). Figure 2 shows discordance between IMR and TRT.
Figure 2.
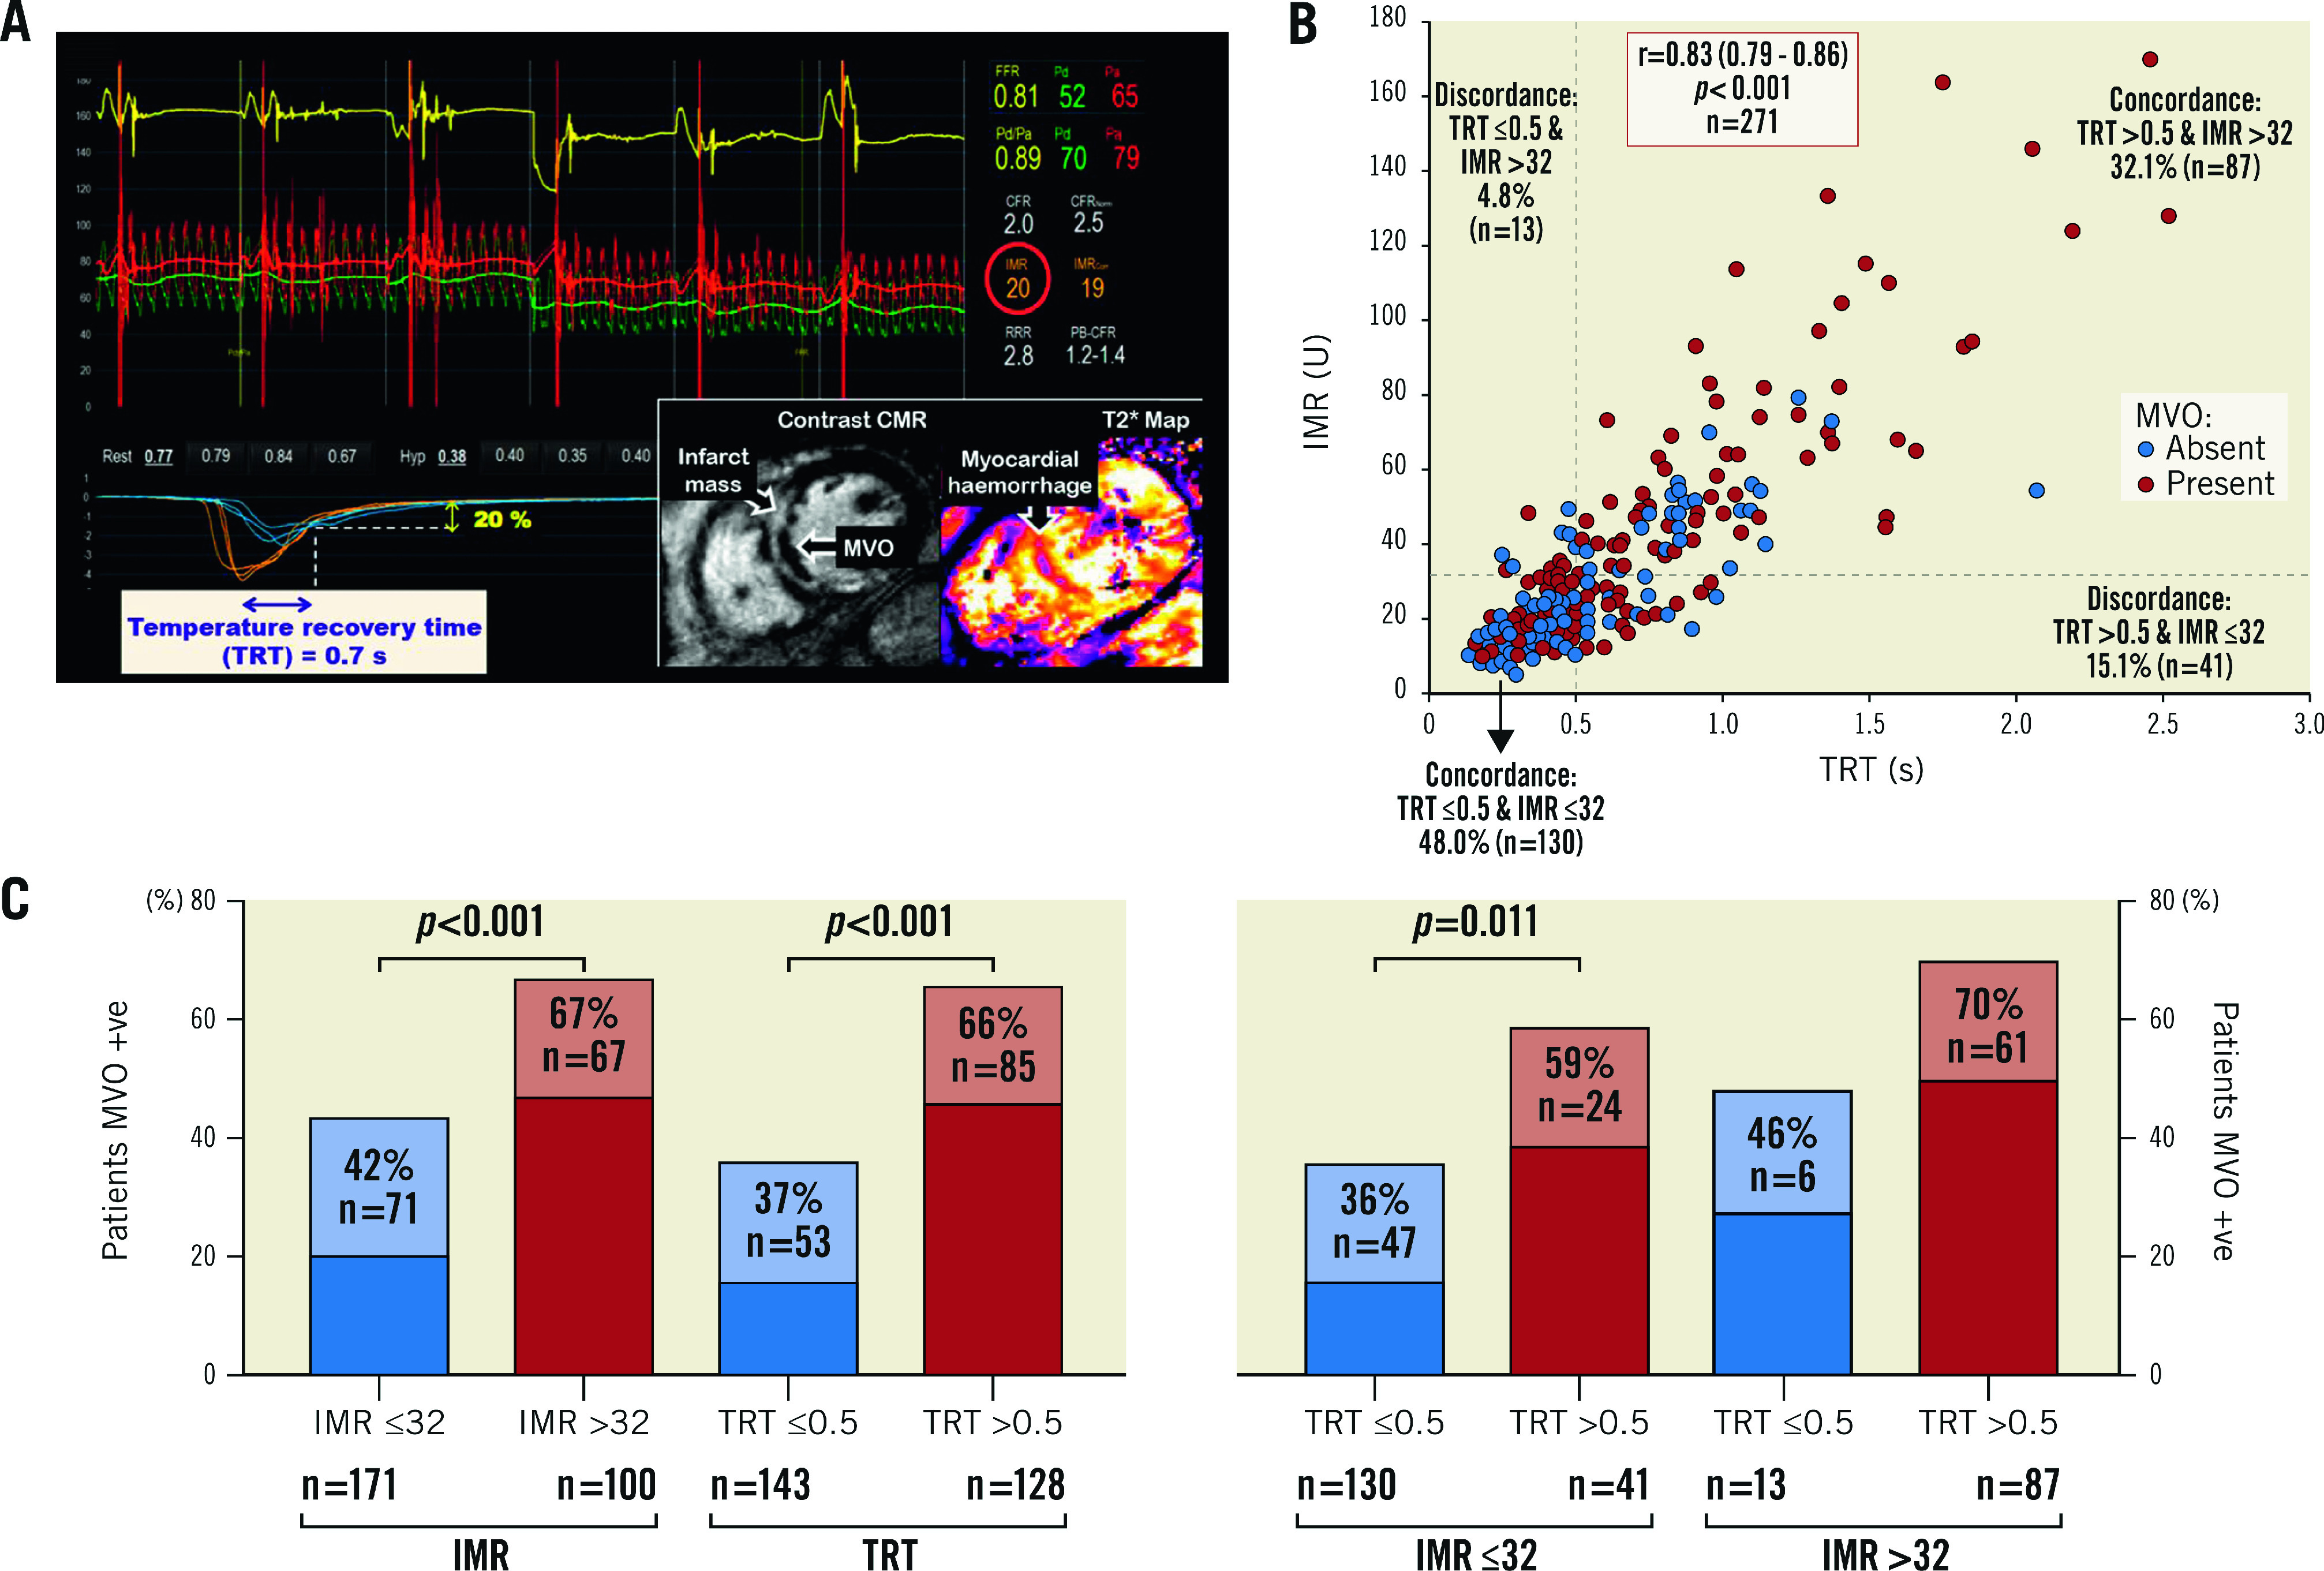
From the derivation population, example of IMR-TRT discordance (A*), scatter graph showing IMR-TRT discordance and IMR/TRT–MVO (microvascular obstruction) discordance (B), and patients with MVO stratified by combinations of IMR ≤32, IMR >32, TRT ≤0.5 and TRT >0.5 (C**). * Thermodilution curves obtained in triplicate at rest (blue) and during hyperaemia (orange), after primary percutaneous coronary intervention. This patient had high TRT and normal IMR. CMR imaging revealed transmural anteroseptal myocardial infarction complicated by MVO. ** p-values from chi-square test (χ2). CMR: cardiovascular magnetic resonance; IMR: index of microcirculatory resistance; TRT: temperature recovery time
Continuous TRT was multivariably associated with MVO extent (coefficient: 4.09 [95% CI: 2.70-5.48], p<0.001), i.e., MVO extent increased by 4.09 units for every 1-unit increase in TRT. Continuous TRT was also multivariably associated with MVO presence (OR 5.26 [95% CI: 2.52-11.74], p<0.001). The performance of TRT >0.5 for predicting MVO is shown in Table 3.
Table 3. From the derivation population, logistic and linear regression analyses, showing associations between TRT, MVO, and clinical outcomes.
| Univariable analysis | Multivariable analysis | |||
| OR/coefficient (95% CI) | p-value | OR/coefficient (95% CI) | p-value | |
| Associations with MVO extent (%LV mass) on CMR 2-7 days post PCI* | ||||
| TRT continuous | 4.38 (3.07-5.68) | <0.001 | 4.09 (2.70-5.48) | <0.001 |
| TRT >0.5 | 2.84 (1.71-3.97) | <0.001 | 2.69 (1.49-3.89) | <0.001 |
| TRT >0.5 (IMR >32, substituted by continuous IMR in model) | 1.53 (-0.18, 3.23) | 0.080 | ||
| Associations with MVO presence on CMR 2-7 days post PCI* | ||||
| TRT continuous | 5.52 (2.59-11.77) | <0.001 | 5.26 (2.52-11.74) | <0.001 |
| TRT >0.5 | 3.36 (2.04-5.53) | <0.001 | 3.01 (1.75-5.16) | <0.001 |
| TRT >0.5 (IMR >32, substituted by continuous IMR in model) | 1.72 (0.78-3.77) | 0.178 | ||
| Associations with 30-day death/heart failure hospitalisation‡ | ||||
| TRT continuous | 6.64 (2.90-15.24) | <0.001 | 7.37 (2.37-22.94) | 0.001 |
| TRT >0.5 | 8.14 (2.35-28.20) | 0.001 | 7.13 (1.78-28.66) | 0.006 |
| TRT >0.5 (IMR >32, substituted by continuous IMR in model) | 4.48 (1.14-17.63) | 0.032 | ||
| Associations with death/heart failure hospitalisation at median 5 years§ | ||||
| TRT continuous | 3.85 (1.97-7.51) | <0.001 | 4.14 (2.08-8.25) | <0.001 |
| TRT >0.5 | 3.11 (1.63-5.93) | 0.001 | 6.44 (2.48-16.71) | <0.001 |
| TRT >0.5 (IMR >32, substituted by continuous IMR in model) | 5.37 (2.00-14.43) | 0.001 | ||
| Associations with 30-day MACE‡ | ||||
| TRT continuous | 6.51 (2.89-14.69) | <0.001 | 7.38 (2.41-22.55) | <0.001 |
| TRT >0.5 | 9.16 (2.66-31.51) | <0.001 | 8.57 (2.18-33.63) | 0.002 |
| TRT >0.5 (IMR >32, substituted by continuous IMR in model) | 5.18 (1.34-19.99) | 0.017 | ||
| Associations with MACE at median 5 years§ | ||||
| TRT continuous | 3.55 (1.79-7.03) | <0.001 | 4.05 (2.00-8.21) | <0.001 |
| TRT >0.5 | 2.39 (1.21-4.71) | 0.012 | 2.65 (1.32-5.30) | 0.006 |
| TRT >0.5 (IMR >32, substituted by continuous IMR in model) | 2.19 (0.76-6.29) | 0.145 | ||
| *Other variables in multivariable model: age, ischaemic time, IMR >32, CFR ≤2, hyperaemic Tmn >median, thermodilution waveform. ‡Other variables in multivariable model: IMR >32. §Other variables in multivariable model: IMR >32, CFR ≤2, hyperaemic Tmn >median, thermodilution waveform. CFR: coronary flow reserve; CI: confidence interval; CMR: cardiovascular magnetic resonance; IMR: index of microcirculatory resistance; LV: left ventricular; MVO: microvascular obstruction; OR: odds ratio; PCI: percutaneous coronary intervention; Tmn: mean transit time; TRT: temperature recovery time | ||||
VALIDATION POPULATION
In the validation population, continuous TRT was multivariably associated with MVO extent (coefficient: 2.86 [95% CI: 1.26-4.46], p=0.001).
PROGNOSTIC SIGNIFICANCE OF TRT
DERIVATION POPULATION
During the initial 30 days post STEMI, all-cause death/heart failure hospitalisation occurred in 22 patients (8%), and MACE occurred in 24 patients (9%). ROC analysis showed that TRT had superior discriminatory ability compared to CFR for predicting 30-day clinical outcomes (Figure 1). TRT was multivariably associated with 30-day clinical outcomes, independent of IMR (Table 3).
During a median follow-up of five years, 52 patients died or experienced heart failure hospitalisation, and 43 patients experienced MACE. ROC curve analysis demonstrated that TRT had superior discriminatory ability compared to CFR for predicting five-year MACE (Figure 1). TRT was multivariably associated with five-year clinical outcomes (Table 3).
VALIDATION POPULATION
During one-year follow-up in the validation population, all-cause death/heart failure hospitalisation occurred in 22 patients (15%), and MACE occurred in 23 patients (16%). Continuous TRT was multivariably associated with all-cause death/heart failure hospitalisations (OR 6.10 [95% CI: 2.42-15.42], p<0.001), and MACE (OR 7.65 [95% CI: 1.87-31.29], p=0.005), independent of IMR >32, CFR ≤2, hyperaemic Tmn >median and thermodilution waveform. The results were similar when IMR >32 was substituted for IMR >40 in the multivariable model (all-cause death/heart failure hospitalisation: OR 5.85 [95% CI: 1.43-23.94], p=0.014, and MACE: OR 5.84 [95% CI: 1.44-23.76], p=0.014).
REPEATABILITY OF TRT AND ASSOCIATIONS WITH HAEMODYNAMICS
Paired TRT measurements, obtained 0.5-8 minutes apart, post primary PCI, by four cardiologists in 13 patients were correlated (r=0.93, p<0.001), with a mean difference between duplicate TRT measurements of 0.02±0.08 (p=0.489). The coefficient of variation from duplicate TRT measurements was 12.7%. The Bland-Altman plot is shown in Supplementary Figure 5. The coefficient of variation from duplicate IMR measurements was 15.5%.
Relationships between TRT, IMR, CFR, or hyperaemic Tmn with haemodynamic parameters were examined in the derivation cohort, because predictive performance may be impaired if influenced by haemodynamic conditions. Pd did not correlate with TRT (r= –0.04, p=0.543), or hyperaemic Tmn (r= –0.01, p=0.883). However, Pd was correlated with IMR (r=0.3, p<0.001) and CFR (r=0.2, p=0.014). Pa did not correlate with TRT (r= –0.1, p=0.311), or hyperaemic Tmn (r= –0.05, p=0.506). However, Pa was correlated with IMR (r=0.2, p=0.001) and CFR (r=0.2, p=0.011).
Neither TRT, IMR, nor hyperaemic Tmn was correlated with heart rate, but CFR was (TRT, r= –0.1, p=0.399; IMR, r=0.01, p=0.926; hyperaemic Tmn, r= –0.03, p=0.615; CFR, r= –0.13, p=0.030).
Discussion
We have described and validated a novel measure for the efficacy of microvascular reperfusion in two independent STEMI cohorts. Higher TRT had clinical utility for predicting MVO extent and clinical outcomes, independent of established predictors. The results support the potential clinical utility of TRT for stratified medicine in patients with acute MI.
Though TRT and IMR are correlated, we observed discordance between high and low dichotomised TRT and IMR values in 54 patients (20%), indicating that these parameters are not one and the same. We used 32 as the cut-off for dichotomising IMR, because IMR >32 is being used to select patients for inclusion in clinical trials2. When an IMR cut-off of 40 was used, discordance between high and low dichotomised IMR and TRT occurred in 61 patients (23%). TRT measures different aspects of the thermodilution curve than Tmn, which is used to calculate IMR. For calculating IMR, the Tmn starts at the steepest downslope of the temperature-time curve (measured by the wire’s shaft thermistor). This transit time measurement ends midway between the peak temperature drop (measured by the wire’s distal thermistor) and 10% from return of the distal thermistor temperature to baseline. In contrast, the TRT measurement only incorporates the part of the temperature-time curve from peak temperature drop to 20% from return to baseline temperature. The independence of TRT, but not IMR, from coronary and systemic haemodynamics (i.e., Pa or Pd) further distinguishes TRT from IMR.
The reproducibility of IMR may be influenced by coronary perfusion pressure and variability in manual bolus injection speed2. It is theoretically plausible that, when injection speed is slower, it would take longer for the initial part of the thermodilution curve to reach peak temperature drop than when injection speed is faster. It is potentially plausible that the recovery part of the thermodilution curve (nadir to baseline body temperature) may be less sensitive to this variability. Published literature evaluating this theory is not available, hence it may merit evaluation in future research.
Considering translation to clinical practice, measuring TRT should be more straightforward for use by clinicians who are less experienced with thermodilution methodology. This is because TRT is calculated precisely using an automated algorithm using dedicated software in the catheterisation laboratory. Alternatively, for precise calculation of IMR, the operator must confirm that the position of the marker is at the lowest stable Pd/Pa during hyperaemia, which may be positioned incorrectly by automated software. The classification of bimodal thermodilution waveforms is not automatically determined by analysis software. CFR, which reflects epicardial and microcirculatory vasodilator capacity, and residual epicardial stenosis, is calculated using an automated algorithm; however, CFR does not improve the predictive ability of IMR alone9.
Reliable identification of patients with a high probability of having MVO may potentially improve research study design by selecting patients in the catheterisation laboratory for inclusion in therapeutic trials. Moreover, accurate identification of STEMI patients who will not develop MVO could potentially reduce healthcare costs through stratification and triage for earlier hospital discharge11.
Strengths and limitations
Strengths of this study include the blinding of coronary physiology measurements to minimise bias, the high follow-up rates with CMR, and the prospective validation of TRT with independent adjudication of clinical events.
A limitation is that duplicate TRT and IMR measurements were available in only 13 patients. Therefore, further research is needed to study the reproducibility of TRT compared to IMR in a larger number of patients. Second, the limited number of composite outcome events constrained the statistical power of the multivariable models.
Limitations of the bolus-derived thermodilution technique should be considered. Notably, higher intra-observer variability of thermodilution-derived, compared to Doppler-derived CFR measurements has been demonstrated12, the hyperaemic response to adenosine can be attenuated by caffeine, and manual bolus injections of saline can be a source of variability. Thermodilution-based absolute flow and microvascular resistance measurements, using continuous infusion of saline to induce steady-state maximal hyperaemia, has potential to have superior reproducibility6. However, it requires a dedicated infusion catheter and can be more technically challenging.
A test with a binary cut-off (normal/abnormal) is generally helpful for patient stratification in the clinic and in therapeutic trials. However, the optimal cut-off for predicting adverse events may vary between different populations and different endpoints. There was discordance between post-PCI TRT (dichotomised by 0.5) and MVO presence/absence in about one third of patients, which was also observed when an IMR threshold of 32 was applied. There may be several explanations. First, higher TRT and IMR are correlated with greater amounts of MVO, hence one would expect there to be discordance when binary cut-offs are applied. Second, the differences in timing of measuring TRT or IMR (acute) versus CMR imaging (subacute) are relevant because microvascular dysfunction is dynamic within minutes to the first few days after reperfusion. When microvascular function is measured immediately post primary PCI, reversible oedema may contribute more to microvascular injury than on CMR 2-7 days later, where irreversible microvascular injury (including myocardial haemorrhage) may persist.
A more robust way to validate TRT could be a comparison with positron emission tomography, or an experimental model with perivascular flow probes or microspheres, enabling calculation of coronary flow and myocardial resistance. Further research is warranted to validate the findings reported in this paper.
Conclusions
TRT predicts MVO and prognosis, independent of established predictors. TRT represents a novel diagnostic advance for detecting failed microvascular reperfusion invasively. TRT has potential to refine risk stratification after primary PCI. Further research is needed to evaluate the potential clinical utility of TRT-guided selection of patients for adjunctive treatments during primary PCI.
Impact on daily practice
IMR is a validated invasive coronary physiology test for evaluating the immediate efficacy of microcirculatory reperfusion; however, it has some limitations for clinical translation. We describe and validate a novel physiology parameter, the thermodilution-derived temperature recovery time (TRT), which predicts MVO and prognosis, independent of IMR >32 and other established predictors. TRT is a novel diagnostic advance for detecting failed microcirculatory reperfusion, which has potential to refine risk stratification and selection of patients for adjunctive treatments after primary PCI.
Supplementary data
Eligibility criteria for the T-TIME clinical trial.
Invasive coronary physiology acquisition and analysis methods.
Angiogram acquisition and analysis methods.
Statistical methods.
Study design and patients included for retrospective derivation and prospective validation of TRT.
Derivation of the optimal definition of TRT.
From the derivation population, distribution of TRT.
Examples of clinical cases.
Bland-Altman plot of differences plotted against the averages of paired TRT measurements after primary PCI.
From the derivation population, summary of logistic and linear regression analyses, showing univariable and multivariable associations (with IMR >40 in multivariable models) between TRT and MVO, all-cause death/heart failure hospitalisations, or major adverse cardiac events.
Summary of logistic and linear regression analyses, showing univariable and multivariable associations (with IMR >32 in multivariable models) between TRT and angiogram parameters at the end of PCI.
Summary of logistic and linear regression analyses, showing univariable and multivariable associations (with IMR >40 in multivariable models) between TRT and angiogram parameters at the end of PCI.
Characteristics of the validation population.
From the validation population, electrocardiogram, angiogram, and coronary physiology parameters on admission and CMR findings at 2-7 days after PCI for STEMI.
Visual summary.
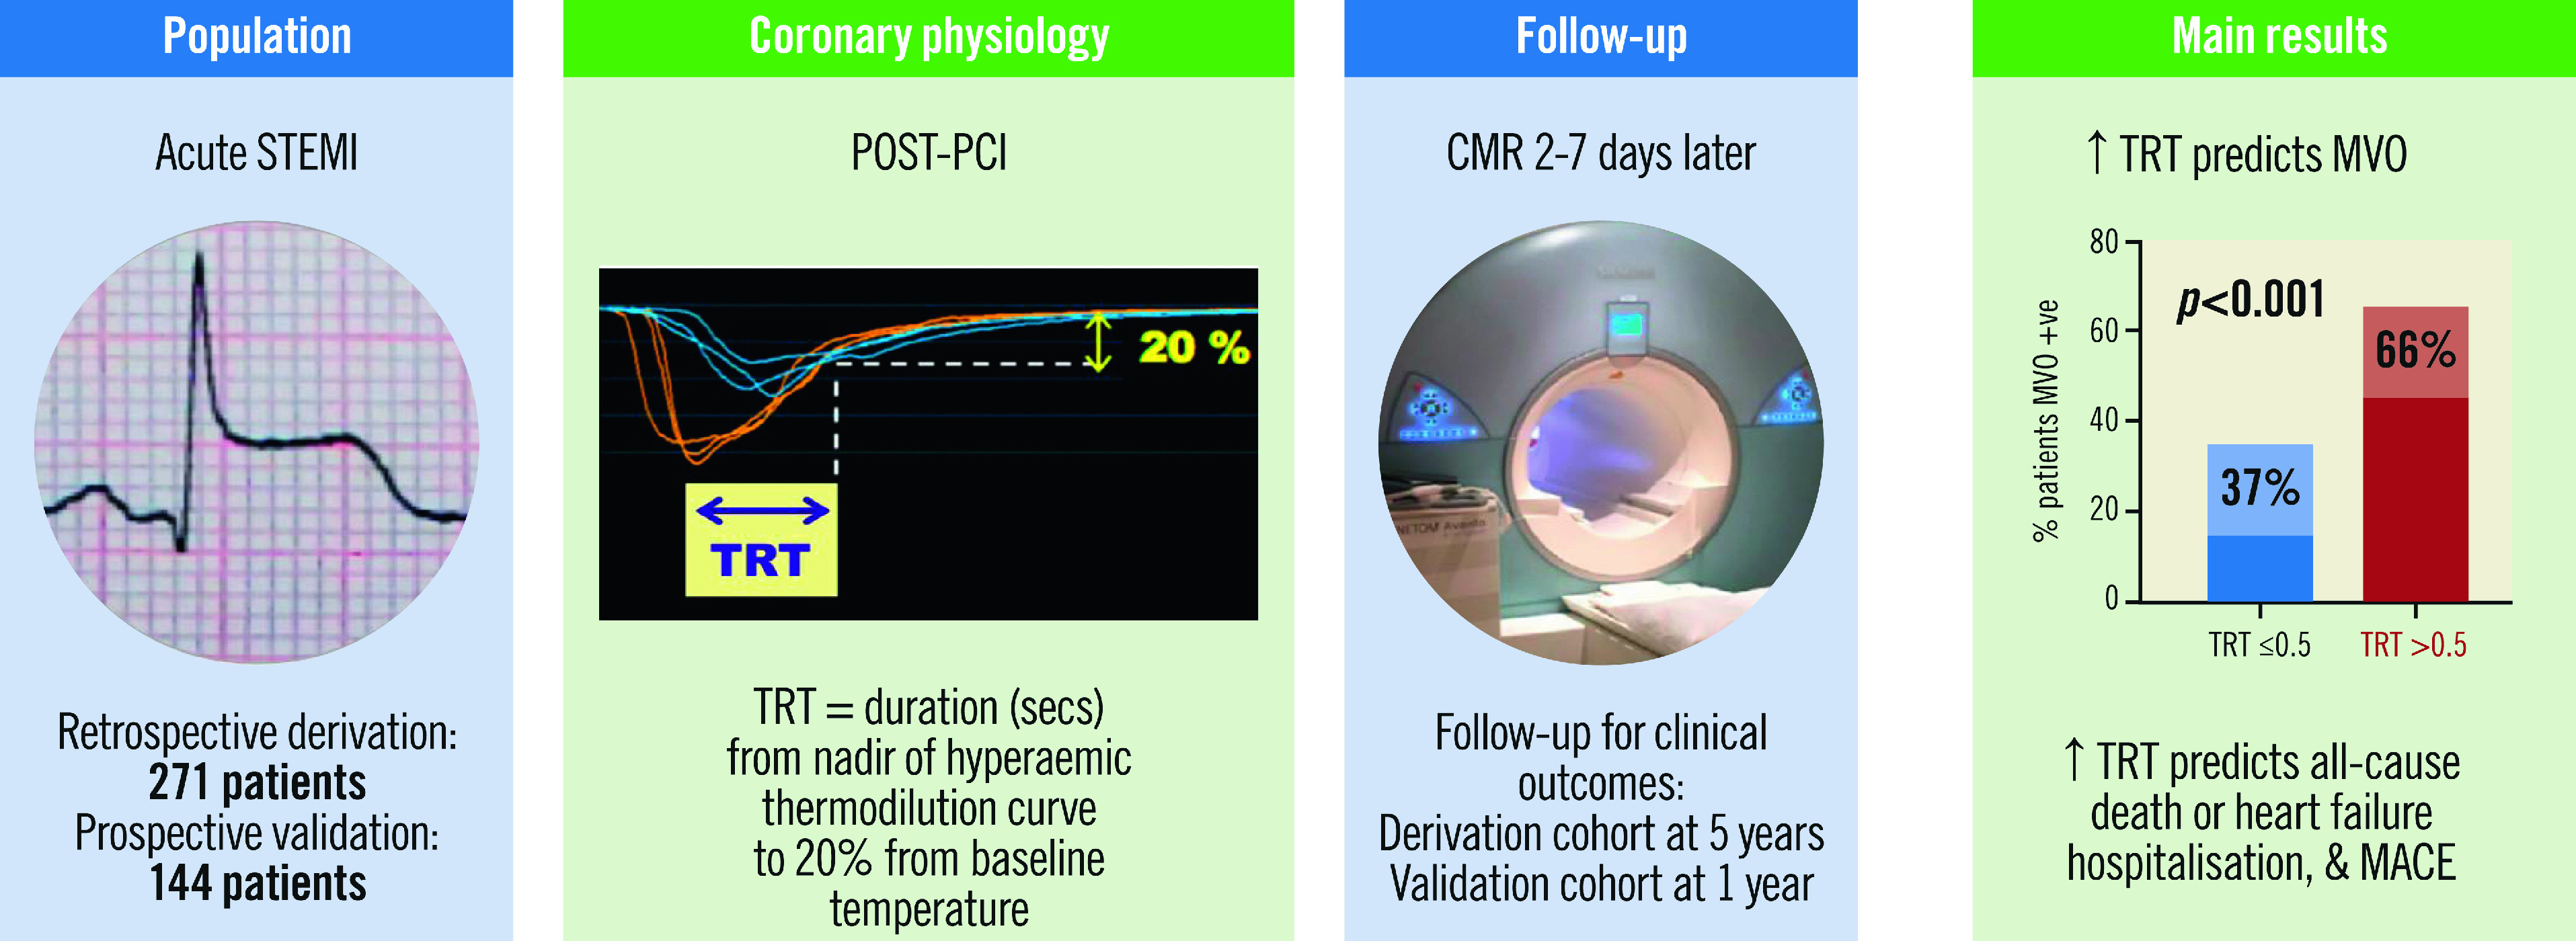
Thermodilution-derived temperature recovery time (TRT): a novel predictor of microvascular reperfusion & prognosis after STEMI. CMR: cardiovascular magnetic resonance; MACE: major adverse cardiac events; MVO: microvascular obstruction; PCI: percutaneous coronary intervention; STEMI: ST-segment elevation myocardial infarction
Acknowledgments
Acknowledgements
We thank the patients, investigators and staff who participated in and supported this study.
Funding
The British Heart Foundation (BHF) supported A.M. Maznyczka (FS/16/74/32573) and C. Berry (RE/18/6134217; FS/16/74/32573). The derivation cohort was supported by the BHF (PG/11/2/2874; RE/13/5/30177). T-TIME was supported by grant 12/170/4 from the NIHR-EME. Boehringer-Ingelheim U.K. Ltd provided the study drugs (alteplase 10 mg, 20 mg), matched placebo, and sterile water for injection. These organisations had no other involvement in the conduct of the study or the manuscript.
Conflict of interest statement
C. Berry is supported by a BHF Centre of Research Excellence award (RE/18/6134217; FS/16/74/32573) and grant 12/170/4 from the NIHR-EME. C. Berry is named on institutional research and/or consultancy agreements between Glasgow University and Abbott Vascular, AstraZeneca, Boehringer Ingelheim, Coroventis, Corstem, GSK, HeartFlow, Novartis, Philips, and Siemens Healthcare. These companies had no involvement in the manuscript. K.G. Oldroyd has served as a consultant and speaker for Abbott Vascular and Boston Scientific. A. Maznyczka reports grants and non-financial support from the British Heart Foundation during the conduct of the study. The other authors have no conflicts of interest to declare.
Abbreviations
- AUC
area under the curve
- CFR
coronary flow reserve
- CI
confidence interval
- CMR
cardiovascular magnetic resonance
- IMR
index of microcirculatory resistance
- IQR
interquartile range
- LV
left ventricular
- OR
odds ratio
- Pa
aortic pressure
- PCI
percutaneous coronary intervention
- Pd
distal coronary pressure
- ROC
receiver operating characteristic
- SD
standard deviation
- STEMI
ST-segment elevation myocardial infarction
- Tmn
mean transit time
- TRT
temperature recovery time
Contributor Information
Annette Maznyczka, BHF Glasgow Cardiovascular Research Centre, Institute of Cardiovascular and Medical Sciences, University of Glasgow, United Kingdom; West of Scotland Heart and Lung Centre, Golden Jubilee National Hospital, Glasgow, United Kingdom; Portsmouth University Hospitals NHS Trust, Portsmouth, United Kingdom.
David Carrick, West of Scotland Heart and Lung Centre, Golden Jubilee National Hospital, Glasgow, United Kingdom.
Keith G. Oldroyd, BHF Glasgow Cardiovascular Research Centre, Institute of Cardiovascular and Medical Sciences, University of Glasgow, United Kingdom; West of Scotland Heart and Lung Centre, Golden Jubilee National Hospital, Glasgow, United Kingdom.
Greg James-Rae, Robertson Centre for Biostatistics, University of Glasgow, Glasgow, United Kingdom.
Peter McCartney, BHF Glasgow Cardiovascular Research Centre, Institute of Cardiovascular and Medical Sciences, University of Glasgow, United Kingdom; West of Scotland Heart and Lung Centre, Golden Jubilee National Hospital, Glasgow, United Kingdom.
John Greenwood, Leeds University and Leeds Teaching Hospital NHS Trust, Leeds, United Kingdom.
Richard Good, West of Scotland Heart and Lung Centre, Golden Jubilee National Hospital, Glasgow, United Kingdom.
Margaret B. McEntegart, West of Scotland Heart and Lung Centre, Golden Jubilee National Hospital, Glasgow, United Kingdom.
Hany Eteiba, West of Scotland Heart and Lung Centre, Golden Jubilee National Hospital, Glasgow, United Kingdom.
Mitchell Lindsay, West of Scotland Heart and Lung Centre, Golden Jubilee National Hospital, Glasgow, United Kingdom.
James Cotton, Wolverhampton University Hospital NHS Trust, Wolverhampton, United Kingdom.
Mark Petrie, BHF Glasgow Cardiovascular Research Centre, Institute of Cardiovascular and Medical Sciences, University of Glasgow, United Kingdom; West of Scotland Heart and Lung Centre, Golden Jubilee National Hospital, Glasgow, United Kingdom.
Colin Berry, BHF Glasgow Cardiovascular Research Centre, Institute of Cardiovascular and Medical Sciences, University of Glasgow, United Kingdom; West of Scotland Heart and Lung Centre, Golden Jubilee National Hospital, Glasgow, United Kingdom.
References
- de Waha S, Patel MR, Granger CB, Ohman EM, Maehara A, Eitel I, Ben-Yehuda O, Jenkins P, Thiele H, Stone GW. Relationship between microvascular obstruction and adverse events following primary percutaneous coronary intervention for ST-segment elevation myocardial infarction: an individual patient data pooled analysis from seven randomized trials. Eur Heart J. 2017;38:3502–10. doi: 10.1093/eurheartj/ehx414. [DOI] [PubMed] [Google Scholar]
- Maznyczka AM, Oldroyd KG, McCartney P, McEntegart M, Berry C. The Potential Use of the Index of Microcirculatory Resistance to Guide Stratification of Patients for Adjunctive Therapy in Acute Myocardial Infarction. JACC Cardiovasc Interv. 2019;12:951–66. doi: 10.1016/j.jcin.2019.01.246. [DOI] [PubMed] [Google Scholar]
- Ng MKC, Yeung AC, Fearon WF. Invasive assessment of the coronary microcirculation: superior reproducibility and less hemodynamic dependence of index of microcirculatory resistance compared with coronary flow reserve. Circulation. 2006;113:2054–61. doi: 10.1161/CIRCULATIONAHA.105.603522. [DOI] [PubMed] [Google Scholar]
- Fearon WF, Low AF, Yong AS, McGeoch R, Berry C, Shah MG, Ho MY, Kim HS, Loh JP, Oldroyd KG. Prognostic value of the Index of Microcirculatory Resistance measured after primary percutaneous coronary intervention. Circulation. 2013;127:2436–41. doi: 10.1161/CIRCULATIONAHA.112.000298. [DOI] [PMC free article] [PubMed] [Google Scholar]
- Fearon WF, Shah M, Ng M, Brinton T, Wilson A, Tremmel JA, Schnittger I, Lee DP, Vagelos RH, Fitzgerald PJ, Yock PG, Yeung AC. Predictive value of the index of microcirculatory resistance in patients with ST-segment elevation myocardial infarction. J Am Coll Cardiol. 2008;51:560–5. doi: 10.1016/j.jacc.2007.08.062. [DOI] [PubMed] [Google Scholar]
- Xaplanteris P, Fournier S, Keulards DCJ, Adjedj J, Ciccarelli G, Milkas A, Pellicano M, Veer M, Barbato E, Pijls NHJ, Bruyne BD. Catheter-based measurements of absolute coronary blood flow and microvascular resistance. Circ Cardiovasc Interv. 2018;11:e006194. doi: 10.1161/CIRCINTERVENTIONS.117.006194. [DOI] [PubMed] [Google Scholar]
- Van Herck PL, Paelinck BP, Haine SE, Claeys MJ, Miljoen H, Bosmans JM, Parizel PM, Vrints CJ. Impaired coronary flow reserve after a recent myocardial infarction: correlation with infarct size and extent of microvascular obstruction. Int J Cardiol. 2013;167:351–6. doi: 10.1016/j.ijcard.2011.12.099. [DOI] [PubMed] [Google Scholar]
- Fukunaga M, Fujii K, Kawasaki D, Sawada H, Miki K, Tamaru H, Imanaka T, Iwsaku T, Nakata T, Shibuya M, Akahori H, Masutani M, Kobayashi K, Ohyanagi M, Masuyama T. Thermodilution-derived coronary blood flow pattern immediately after coronary intervention as a predictor of microcirculatory damage and midterm clinical outcomes in patients with ST-segment-elevation myocardial infarction. Circ Cardiovasc Interv. 2014;7:149–55. doi: 10.1161/CIRCINTERVENTIONS.113.000505. [DOI] [PubMed] [Google Scholar]
- Carrick D, Haig C, Ahmed N, Carberry J, Yue May VT, McEntegart M, Petrie MC, Eteiba H, Lindsay M, Hood S, Watkins S, Davie A, Mahrous A, Mordi I, Ford I, Radjenovic A, Oldroyd KG, Berry C. Comparative Prognostic Utility of Indexes of Microvascular Function Alone or in Combination in Patients With an Acute ST-Segment-Elevation Myocardial Infarction. Circulation. 2016;134:1833–47. doi: 10.1161/CIRCULATIONAHA.116.022603. [DOI] [PMC free article] [PubMed] [Google Scholar]
- McCartney PJ, Eteiba H, Maznyczka AM, McEntegart M, Greenwood JP, Muir DF, Chowdhary S, Gershlick AH, Appleby C, Cotton JM, Wragg A, Curzen N, Oldroyd KG, Lindsay M, Rocchiccioli JP, Shaukat A, Good R, Watkins S, Robertson K, Malkin C, Martin L, Gillespie L, Ford TJ, Petrie MC, Macfarlane PW, Tait RC, Welsh P, Sattar N, Weir RA, Fox KA, Ford I, McConnachie A, Berry C T-TIME Group. Effect of Low-Dose Intracoronary Alteplase During Primary Percutaneous Coronary Intervention on Microvascular Obstruction in Patients With Acute Myocardial Infarction: A Randomized Clinical Trial. JAMA. 2019;321:56–68. doi: 10.1001/jama.2018.19802. [DOI] [PMC free article] [PubMed] [Google Scholar]
- Fahrni G, Wolfrum M, De Maria GL, Cuculi F, Dawkins S, Alkhalil M, Patel N, Forfar JC, Prendergast BD, Choudhury RP, Channon KM, Banning AP, Kharbanda RK. Index of Microcirculatory Resistance at the Time of Primary Percutaneous Coronary Intervention Predicts Early Cardiac Complications: Insights From the OxAMI (Oxford Study in Acute Myocardial Infarction) Cohort. J Am Heart Assoc. 2017;6:e005409. doi: 10.1161/JAHA.116.005409. [DOI] [PMC free article] [PubMed] [Google Scholar]
- Everaars H, de Waard GA, Driessen RS, Danad I, van de Ven PM, Raijmakers PG, Lammertsma AA, van Rossum AC, Knaapen P, van Royen N. Doppler flow velocity and thermodilution to assess coronary flow reserve: a head-to-head comparison with [(15)O]H2O PET. JACC Cardiovasc Interv. 2018;11:2044–54. doi: 10.1016/j.jcin.2018.07.011. [DOI] [PubMed] [Google Scholar]
Associated Data
This section collects any data citations, data availability statements, or supplementary materials included in this article.
Supplementary Materials
Eligibility criteria for the T-TIME clinical trial.
Invasive coronary physiology acquisition and analysis methods.
Angiogram acquisition and analysis methods.
Statistical methods.
Study design and patients included for retrospective derivation and prospective validation of TRT.
Derivation of the optimal definition of TRT.
From the derivation population, distribution of TRT.
Examples of clinical cases.
Bland-Altman plot of differences plotted against the averages of paired TRT measurements after primary PCI.
From the derivation population, summary of logistic and linear regression analyses, showing univariable and multivariable associations (with IMR >40 in multivariable models) between TRT and MVO, all-cause death/heart failure hospitalisations, or major adverse cardiac events.
Summary of logistic and linear regression analyses, showing univariable and multivariable associations (with IMR >32 in multivariable models) between TRT and angiogram parameters at the end of PCI.
Summary of logistic and linear regression analyses, showing univariable and multivariable associations (with IMR >40 in multivariable models) between TRT and angiogram parameters at the end of PCI.
Characteristics of the validation population.
From the validation population, electrocardiogram, angiogram, and coronary physiology parameters on admission and CMR findings at 2-7 days after PCI for STEMI.