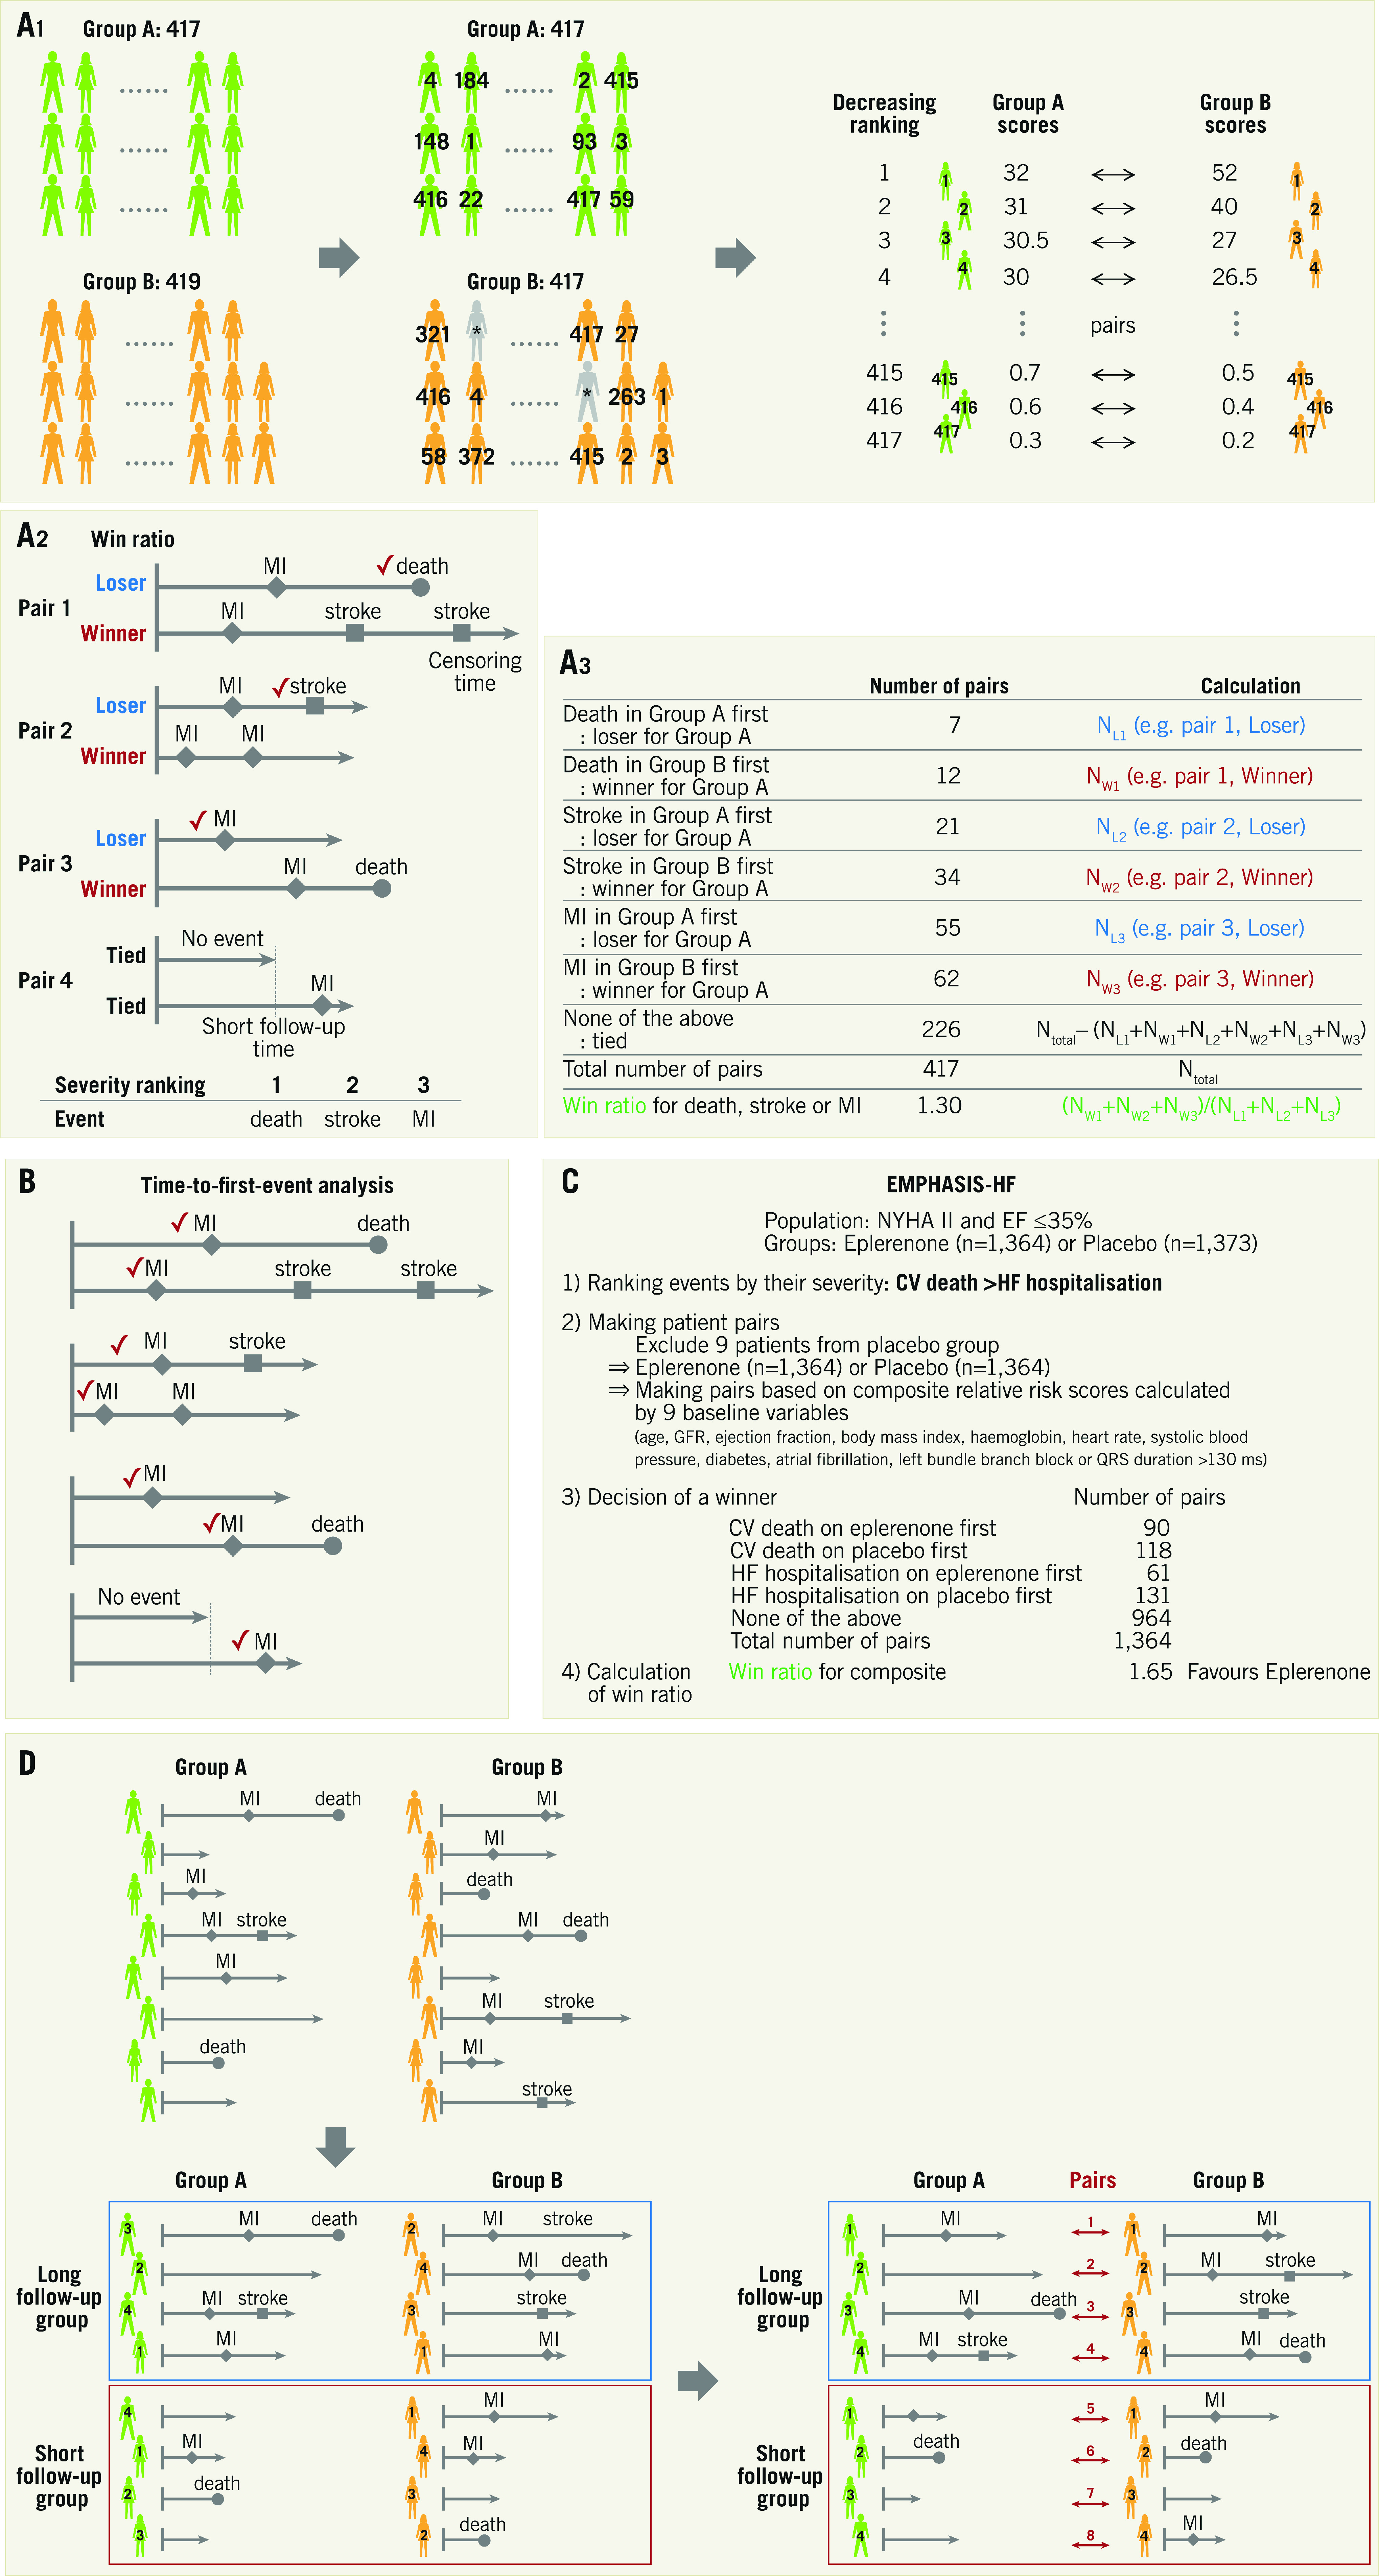
Figure 2.

Win ratio. A) Flow chart for analysis. A1. Adjustment of each group. When there are slightly unequal sample sizes in groups A (n=417) and B (n=419), respectively, two patients (*) are randomly excluded from Group B to equalise the number of patients. The patients are arranged and tabulated based on the decreasing ranking of their relative risk scores. A2. Patient level assessment. Winners and losers are decided based on event severity within the censoring period. Provided that the decreasing ranking of event severity is death, stroke and myocardial infarction (MI), decisions in each pair are as follows. (Pair 1) Death is the most severe event, so the patient figuring in the upper line is a loser. (Pair 2) A death does not occur in either patient. The event of stroke should be evaluated because stroke is more severe than MI but less severe than death, and the patient figuring in the upper line is a loser. (Pair 3) A death occurs after the others’ follow-up time, so the times to MI in the absence of death or stroke occurrence should be compared. The upper line patient is a loser. (Pair 4) An MI occurs after the others’ follow-up time, and there are no events until censoring. Therefore, a winner and a loser are not established, and we have a tie. A3. Group assessment. The win ratio is provided by (total number of winners)/(total number of losers). See example: 1.30 (= (12+34+62) / (7+21+55)). Win ratio. B) The events used are different between the win ratio and traditional time-to-first-event analyses. C) The application of win ratio analysis in the EMPHASIS-HF study. D) Time-stratified approach. Whenever patient follow-up durations vary greatly, patients can be stratified into some follow-up duration categories (e.g., long follow-up group and short follow-up group) and pairs are matched in each category based on the decreasing ranking of each patient’s relative risk score. CV: cerebrovascular; EF: ejection fraction; HF: heart failure; NYHA: New York Heart Association
