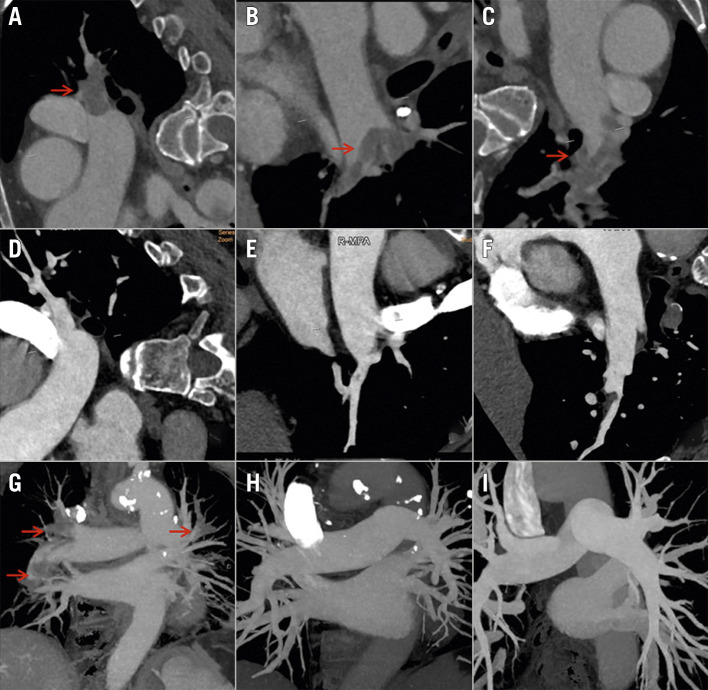
Figure 3.
Computed tomography pulmonary angiography (CTPA) before the procedure (A, B, C) and one week after the procedure (D, E, F) in the same patient as in Figure 1. The image shows the post-procedural angiographic results in the same locations of superior (A, D), middle (B, E) and inferior (C, F) lobar arteries of the right lung. CT reconstruction images are shown before the procedure (G), one week post procedure (H), and six months post procedure (I). Thrombus with filling defects is indicated by red arrows.

