

Abstract
Excitatory amino acid transporters (EAATs) are glutamate transporters that belong to the solute carrier 1A (SLC1A) family. They couple glutamate transport to the cotransport of three sodium (Na+) ions and one proton (H+) and the counter-transport of one potassium (K+) ion. In addition to this coupled transport, binding of cotransported species to EAATs activates a thermodynamically uncoupled chloride (Cl−) conductance. Structures of SLC1A family members have revealed that these transporters use a twisting elevator mechanism of transport, where a mobile transport domain carries substrate and coupled ions across the membrane, while a static scaffold domain anchors the transporter in the membrane. We recently demonstrated that the uncoupled Cl− conductance is activated by the formation of an aqueous pore at the domain interface during the transport cycle in archaeal GltPh. However, a pathway for the uncoupled Cl− conductance has not been reported for the EAATs, and it is unclear if such a pathway is conserved. Here, we employ all-atom molecular dynamics (MD) simulations combined with enhanced sampling, free-energy calculations, and experimental mutagenesis to approximate large-scale conformational changes during the transport process and identified a Cl−-conducting conformation in human EAAT1 (hEAAT1). Sampling the large-scale structural transitions in hEAAT1 allowed us to capture an intermediate conformation formed during the transport cycle with a continuous aqueous pore at the domain interface. The free-energy calculations performed for the conduction of Cl− and Na+ ions through the captured conformation highlight the presence of two hydrophobic gates that control low-barrier movement of Cl− through the aqueous pathway. Overall, our findings provide insights into the mechanism by which a human neurotransmitter transporter supports functional duality of active transport and passive Cl− permeation and confirm the commonality of this mechanism in different members of the SLC1A family.
Keywords: excitatory amino acid transporter (EAAT), glutamate transporter, chloride channel, molecular dynamics, electrophysiology, structural transition
Graphical Abstract

INTRODUCTION
Transporters and channels are regularly classified into distinct classes of membrane transport proteins. Transporters generally follow the “alternating-access model” where conformational transitions between the outward-facing state (OFS) and the inward-facing state (IFS) alternatively expose the substrate binding site from one side of the membrane to the other,1–5 while, in channels, usually the opening of a single gate creates a pathway for passive translocation of the permeant species across the membrane.6 Interestingly, there is a growing number of membrane transporters that exhibit additional (ion-)channel-like activity. For example, the excitatory amino acid transporters (EAATs) function as both glutamate transporters and chloride (Cl−) channels,7–11 seemingly challenging the conventional distinction between the transporters and channels. EAATs regulate the concentration of glutamate, the predominant excitatory neurotransmitter in the human brain, thereby playing a crucial role in maintaining normal brain function and preventing excitotoxicity.12,13 The transport cycle of EAATs is fueled by the symport of three sodium (Na+) ions and a proton (H+) followed by the counter-transport of a potassium (K+) ion.14–16 In addition to this ion-coupled transport cycle, binding of cotransported species to the EAATs activates a thermodynamically uncoupled Cl− conductance.11,17,18 Disruption of the Cl− conductance of EAAT1 has been linked to pathophysiological conditions including episodic ataxia, migraine, and epilepsy.19–22
Previous structural studies have revealed multiple conformational states of several members of the glutamate transporter family. Structures of human EAAT1 (hEAAT1),23 EAAT3,24 and archaeal homologues GltPh11,25–29 and GltTk30 highlight that these transporters exist as homotrimers, where each monomer comprises a dynamic transport domain and a relatively static scaffold domain. The sequential transition from the OFS to the IFS (OFS ⇌ IFS), through an intermediate Cl−-conducting state (ClCS), is achieved via an elevator-like mechanism of transport.26,31–33 Our recent study combining cryoEM with all-atom MD simulations described a pathway for the uncoupled Cl− movement and underscored its molecular determinants in GltPh.11 Furthermore, previous functional studies have hinted at multiple residues in hEAAT1 that likely line such an ion-conducting aqueous pore in EAATs.34–36 Analogous residues in GltPh were also observed at the domain interface in the “so-called” intermediate OF (iOF) conformation,29 leading to the assumption that the interface might be a part of the Cl−-conducting pathway. However, the localization of an anion-selective pathway in hEAAT1, the underlying protein conformation supporting it, and the mechanisms of Cl− permeation have not been characterized.
Here, we investigate the elevator movement of the transport domain in hEAAT1 to explore its relationship to the formation of a Cl− channel within the transporter and, thus, the interplay between the dual functions of hEAAT1. By utilizing MD simulations employing enhanced sampling techniques, we captured a putative ion-conducting intermediate of hEAAT1 with two hydrophobic gates and describe the molecular determinants of Cl− permeation. The calculated free-energy profiles for the permeation of Cl− and Na+ ions through this pathway support the preference for anions and provide detailed understanding for the translocation of ions and their interaction with hydrophobic residues forming gates both at the extracellular and intracellular openings. To further explore the functional relevance of the captured pathway, we tested the effects of hydrophobicity and dynamics of lining side chains in the gating region using voltage-clamp electrophysiology and all-atom MD simulations on mutant species of hEAAT1. We found that mutants increasing hydrophobicity in these regions exhibit reduced Cl− permeation, validating the importance of the identified hydrophobic gates in hEAAT1 Cl− conductance.
RESULTS AND DISCUSSION
The conformational dynamics of EAATs are complex and involve coupling of the substrate translocation to symport of three Na+ and one H+ and the counter transport of one K+ ion in each transport cycle.37 In addition to this ion-coupled transport cycle, where each protomer undergoes a twisting elevator-like motion, the transport cycle activates a thermodynamically uncoupled Cl− conductance.9,17 It has been argued that the physiological role of this Cl− conduction is to harmonize the charge imbalance caused by electrogenic transport of glutamate and its cotransported ions.38 Here, we employ metadynamics simulations employing system-specific CVs to sample structural transitions between the OFS and IFS conformations of a human glutamate transporter, capturing the formation of ClCS conformations in hEAAT1. The free-energy profiles of ion permeation through the identified ClCS show favorable permeation of Cl− over Na+ through the captured pathway, which is flanked by hydrophobic residues, forming gate-like structures on both the intracellular and extracellular openings. The captured pathway was validated by performing both the experimental and in silico mutagenesis. These are discussed in detail in the following sections.
Capturing Anion-Conducting Conformations of hEAAT1.
To sample the structural changes during the elevator-like motion of the transport domain in hEAAT1, we employed a WT-MetaD simulation, starting from a fully bound OFS conformation of hEAAT123 (ready for transition), including three Na+, one H+, and a substrate (Figure 1A). A history-dependent bias was deposited along a two-dimensional CV space (see the Methods section) representing the translation (ζ) and orientational (θ) change of the transport domain (relative to the scaffold domain), guiding the protein to transition to the IFS (Figure 1B). The efficacy of the WT-MetaD simulation was gauged by monitoring the two CVs (ζ, θ) and how the conformational space formed by them is sampled. The 200 ns WT-MetaD simulation sampled the two extreme conformations (OFS and IFS), along with the transition pathway connecting them (Figure 1C). The goal of the WT-MetaD simulation was to approximate the structural transitions between the OFS and IFS of hEAAT1, which we suspected to involve the unknown ClCS conformations.
Figure 1.
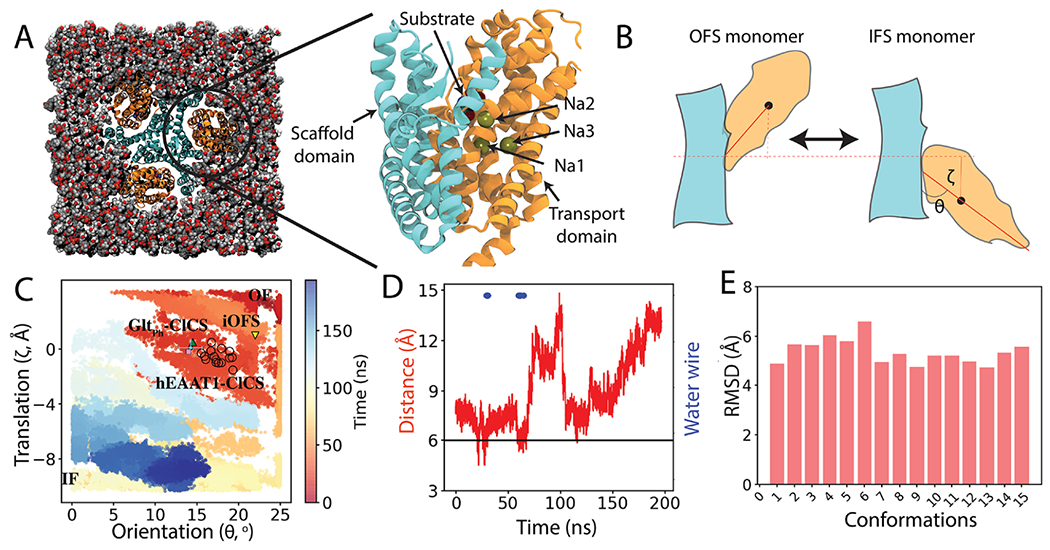
Capturing a Cl−-conducting state (ClCS) in hEAAT1: (A) Initially the fully bound OFS of hEAAT1 was embedded into a cholesterol/POPC (50:50) lipid bilayer. Closeup side view of one of the promoters highlights the bound Na+ ions and the substrate (aspartate). The transport and scaffold domains are colored in orange and cyan, respectively. (B) Schematic representation of the transition between the OFS and the target IFS, and translation (ζ) and orientation (θ) change of the transport domain (orange) with respect to the scaffold domain (cyan). (C) Conformational sampling of the phase space defined by ζ and θ during the WT-MetaD simulation. The time evolution of the simulation is indicated in color. Multiple hEAAT1 ClCS conformations captured during the metadynamics simulation are highlighted in black open circles. The position of the recent ClCS conformation of GltPh11 is shown as a green triangle. The average value of these coordinates derived from a 100 ns trajectory (averaged over the last 50 ns) of a representative ClCS conformation is shown by a cyan circle, along with its error bars. The ClCS conformation used in the subsequent US simulations is shown as a pink box. The position of the previously published intermediate outward-facing state (iOFS)29 of GltPh is marked with a yellow triangle. (D) Cα distance between L244 and G439 during the structural transition between the two end states indicating capturing of water-conducting intermediate states of hEAAT1. The horizontal black line indicates the cross-link distance between respective residues in GltPh to trap the ClCS structure.11 Blue dots indicate trajectory frames with water permeation pathways connecting the extracellular and intracellular bulk solutions. (E) Root-mean-square deviation (RMSD) of water-permeating ClCS of hEAAT1 was calculated by aligning Cα atoms (in total 15 conformations) with respect to the OFS. The captured ClCS conformations are localized close to each other in the RMSD space. Here, RMSD of the transport domain was calculated with respect to the OFS, after aligning the scaffold domain.
To extract putative ClCS conformations from the ensemble of structures generated by the WT-MetaD simulation of the OFS ⇌ IFS transition, we monitored the formation of water permeation pathways. Such water permeation pathways were clearly absent in the two end states (IFS and OFS), indicating that none of these states can be conducting ions (Figure 1D and Figure S2). In contrast, multiple (15 in total) intermediate conformations could be identified in the simulation trajectory that displayed a continuous water pathway at the interface of the transport and scaffold domains (Figure 1C,D and Figures S1 and S2). During the metadynamics simulations, the substrate remained stably bound to its binding site (Figure S3). The Cα distance between L224 and G439 (corresponding to residues cross-linked experimentally to trap the ClCS in GltPh11) in the captured water-permeating conformations is 6 Å, that is, within the cross-linking distance39 (Figure 1D). The comparison of the MD-relaxed representative conformation of the water permeating state obtained from the simulations (cyan and pink marks in Figure 1C) and the OFS hEAAT1 suggested that the transport domain has shifted toward the IFS by ~5 Å translation and ~13° of rotation, which are in close agreement with the recently published cryoEM structure of the ClCS in GltPh.11 The water-permeating conformations of hEAAT1 captured by the simulations and the reported experimental intermediate ClCS of GltPh29 highlight the need for an additional orientational and translational change of the transport domain toward the intracellular side for the formation of a putative Cl− conduction pathway. This conclusion is in contrast with a previous study attributing the channel formation in GltPh to only the translational movement of the transport domain.39
To differentiate further between the captured water permeating conformations (15 in total) and the end states, we calculated the RMSD of the conformations with respect to the OFS (Figure 1E). The RMSD analysis also shows that all the captured water permeating conformations lie close to each other in RMSD space (4–6 Å RMSD with respect to OFS) (Figure 1E), highlighting the consistency of the applied approach to capture putative ClCS conformations.
Ion Conduction through hEAAT1.
To explore the functional relevance of the water-conducting conformations and gauge their ion permeation capacity, a representative conformation was isolated from the WT-MetaD simulation for free-energy calculations of explicit ion permeations. This state was first further simulated (100 ns) in a POPC and Chol containing membrane (see the Methods section) (Figure 2A), with only a distance restraint between the Cα atoms of L244 and G439, mimicking the cross-link used in a recent experimental setup to trap GltPh in a ClCS conformation.11 During this equilibrium simulation, water permeation events through the interface of scaffold and transport domains were observed (Figure 2B). There is a higher solvent accessible surface area (SASA) of residues lining the water permeation pathway than that of those in the OFS (Figure 2F), which supports the involvement of the interface in the conduction pathway. We then performed 1.2 μs of US simulations to sample movements of either Cl− or Na+ through the pathway, from which the potentials mean force (PMF) for these processes was calculated.
Figure 2.

Water permeation and movement of Cl− through ClCS-hEAAT1. (A) ClCS-hEAAT1 conformation captured from the WT-MetaD simulation was embedded into the lipid bilayer and equilibrated for 100 ns with experimentally derived restraints on L244 and G439, in its fully bound state. (B) Permeation of water molecules (blue surface) through the interface of the scaffold and transport domains, connecting extracellular and intracellular media. The water positions obtained from these simulations were used to seed the initial position of Cl− or Na+ ions for US simulations used to calculate the potential of mean force (PMF) profiles. (C) Free energy of Cl− conduction along the conduction pathway obtained from US simulations, showing favorable interactions of the permeating Cl− ion with R477/Q445 and energy barriers formed by two clusters of hydrophobic residues (maximum barrier: 1.8 kcal/mol). The error bars are calculated using the WHAM bootstrapping method and are shown in red shading (very small).(D) Free energy of Na+ permeation along the conduction pathway. Compared to Cl−, we observe a higher barrier of 2.9 kcal/mol against Na+ permeation. R477 along the pore contributes to a barrier against Na+, while this region corresponds to an energy minimum for Cl−. The error bars are calculated using the WHAM bootstrapping method and are shown in red shading (very small). (E) Structure of a ClCS-hEAAT1 protomer showing residues lining the Cl− pathway in green (polar residues), white (hydrophobic residues), and blue (basic residues). The occupancy of Cl− calculated from US simulations is shown in light pink isosurface. (F) Residues lining the Cl− pathway have a higher solvent accessible surface area (SASA) in ClCS-hEAAT1 than in the OFS. (G) Residues interacting with the permeating Cl− ion.
The underlying free-energy profile for Cl− permeation through the hydrated pathway reveals two clusters of hydrophobic residues, one in the extracellular (TM2, L88 and M89; TM5, L296) and another in the intracellular (TM1, F50 and T54; TM5, M286 and A289) regions of the conduction pathway, which provided free-energy barriers against the movement of the ion (Figure 2C and Figure S4A). The hydrophobic residues that form the extracellular gate were previously suggested as pore-lining residues;39 however, to best of our knowledge, this study is the first to reveal atomic-level details on the involvement of these residues in the intracellular gate of the ion conduction pathway in hEAAT1. Similar dual hydrophobic gating behaviors have also been observed in other ion channels.40 The hydrophobic nature of the residues that form the two gates in hEAAT1 seems to be conserved in the SLC1A family members, including the neutral amino acid exchangers, which also behave as dual transporter/channel proteins.14,41 Therefore, it is likely that anion permeation is enabled by common molecular determinants in the SLC1A family.
Close examination of the simulation trajectories indicated that the free-energy barrier at the intracellular end of the pathway is mainly attributed to hydrophobicity and reorientation of M286 (Figure S5A). The free-energy profile also revealed energy minima corresponding to the interaction of permeating Cl− with Q445 (HP2) and R477 (TM8) (Figure 2C), consistent with the importance of R477 (R276 in GltPh) for anion selectivity in Cl− conduction.39,42,43 US simulations also allowed us to probe the residues that line the conduction pathway and interact with the permeating Cl− ion (Figure 2G, Figure S5B, and Movie S1). These include S103, the mutation of which to valine significantly reduces the permeation of anions in both hEAAT1 and GltPh with little effect on substrate transport17 and R477 (Figure S5C), which determines the anion selectivity of the ion conductance.39,42 In all the windows of the US simulations, the substrate remained stably bound to its binding site (Figure S6).
Additionally, to explore the preference of the captured pathway for ions of opposite charges, we performed 1.2 μs of US simulations for the permeation of a Na+ ion (see the Methods section). The obtained free-energy profile yielded a small difference in the overall energetic barrier (2.9 ± 0.07 kcal/mol for Na+, compared to 1.8 ± 0.05 kcal/mol for Cl−; Figure 2D and Figure S4). While approximations involved in the classical force field used for these calculations and in the model representation prevent one from obtaining closely comparable energy values to experiments, the trend of the difference supports the preference of the pathway for anions. In particular, the permeating Na+ ion forms unfavorable interactions with R477, which is known to determine selectivity of the channel.42
Mutations Alter Permeation Activity of hEAAT1.
The presence of uncoupled Cl− conduction and the conservation of the molecular determinants that control Cl− permeation, e.g., conservation of residues S103 and R477, have been reported in different EAAT isoforms as well as in GltPh.17,34,44,45 To further investigate the effect of some of these molecular determinants on the newly identified permeation pathway in hEAAT1, we designed and performed electrophysiology experiments on hEAAT1 after mutating some of these residues. Our recent study found the reduction of the hydrophobicity of the intracellular gate (TM1, F50 and T54; TM5, M286 and A289) by mutating these residues to alanine aids in Cl− permeation.11
We assessed the effect of increasing hydrophobicity and steric bulk at position 289 (A289F) and the reduction in the side chain flexibility at position 286 (M286 V). Electrophysiology experiments highlight the reduction in Cl− contribution to the overall substrate-elicited currents. Since substrate transport of hEAAT1 is ion-coupled, glutamate or aspartate transport can be quantified by measuring the substrate-elicited inward currents. The reversal potential (Erev) is the equilibrium point where no flux occurs, and it can be obtained by measuring the current amplitude at a range of membrane potentials. In oocytes from Xenpous leavis, this equilibrium point for a pure Cl− current has been reported to be at about −20 mV (ECl−).46 The reversal potential (Erev) of the substrate-activated conductance of both A289F and M286V shifted to a more positive potential as compared to WT-hEAAT1 (Figure 3A), indicating a reduction in the Cl− contribution to the overall l-aspartate-elicited currents. Furthermore, since substrate transport results in a net flux of two positive charges per cycle, currents obtained from positive membrane potentials at +60 mV (I+60mV) are mostly carried by Cl− ions. I+60mV for both M286V and A289F displayed a significant reduction, highlighting the critical role of these residues in Cl− permeation pathway (Figure 3B). Such modifications of the channel do not affect the ability of hEAAT1 to transport aspartate, as measured by the apparent affinity of the substrate for the transporter, which is unchanged by the mutations (Figure 3C). This agrees with previous studies that show mutations at the interface of the scaffold and transport domains can impact Cl− channel function without affecting transport properties.43
Figure 3.

Impact of site-directed mutagenesis on water and ion permeation through ClCS-hEAAT1 mutants. Currents at +60 mV (I+60mV) and reversal potentials (Erev) measured from oocytes expressing hEAAT1 mutants with modifications on side chain hydrophobicity are shown. (A) Currents determining Erev were elicited by 30 μM l-aspartate. (B) Maximum Cl− current at +60 mV was achieved by the application of 300 μM l-aspartate. (C) l-Aspartate transport via hEAAT1 wild-type and mutants is dose-dependent, with similar apparent affinities. Significance was determined by one-way ANOVA followed by Bonferroni post hoc test (GraphPad Prism 8.0), and exact p values are indicated in black for statistically significant difference as compared to responses from hEAAT1-WT. Experiments were conducted across two batches of oocytes. (D–F) Snapshots of the hydrated Cl− pathway at the end of the 100 ns simulations of WT-ClCS and the two mutants. (G) Histogram for the total number of water molecules near the constriction region (defined by F50, T54, M286, and A289) of the protein in WT simulations. (E) Snapshot of water occupancy at the end of the 100 ns simulation of A289F-ClCS. (H) Histogram for the total number of water molecules near the constriction region of A289F-ClCS. (F) Snapshot of water occupancy at the end of the 100 ns simulation of M286 V-ClCS. (I) Histogram for the total number of water molecules near the constricted region of M286 V-ClCS. On average, we observed less water molecules occupying the constriction region in mutant systems. (J) Comparison of pore radius profiles of all the simulated systems. The extracellular side corresponds to z ≤ 0, and the intracellular to z ≥ 0.
To gain atomic-level insight into the effect of A289F and M286V on permeation pathway, we performed MD simulations on these species. The introduction of a phenylalanine at position 289 resulted in a reduction (compared to WT (Movie S2)) in the level of hydration at the intracellular gate of A289F-ClCS (Figure 3D,E and Movie S3), corroborating the findings in our functional assays. The observed effect is attributed to the energy barrier introduced by increased hydrophobicity in this region, which makes the water and probably Cl− movement more difficult. Our results also suggest that M286 might be involved in another narrow point of the Cl− conduction pathway of hEAAT1-ClCS (Figure 2). The interface of the scaffold and transport domains is directly lined by M286 and sealed on both ends in the OFS and IFS but open in ClCS, in which the side chain of M286 moves away from the pathway (Figure S5), suggesting that reorientation of this residue might be critical for Cl− permeation. This methionine was mutated to a valine (M286V), which has side-chain bifurcation closer to the α-carbon and therefore predicated to have reduced flexibility to reorient. Consistent with this prediction, in our M286V-ClCS simulation system, we observed a reduction in the hydration of the intracellular gate (Figure 3F and Movie S4). These results are in agreement with the functional assays where significant reduction in I+60mV was observed. Furthermore, the size of the conduction pore in the A289F and M286V systems is decreased when compared to in WT-hEAAT1 (Figure 3F), corroborating our previous observation of decreased water density and reduction in the Cl− contribution to the overall l-aspartate-elicited currents in the mutant conformations.
METHODS
Simulation System.
We constructed the simulation system by embedding the trimeric hEAAT1 in the OF conformation, adopted from the crystal structure (PDB:5LLU),23 into a lipid bilayer. The coordinates of the hydrogen atoms and missing side chains were added by the PSFGEN plugin of VMD (Visual Molecular Dynamics).47 Water molecules were added to the internal cavities of the protein using the DOWSER program.48 The missing Na+ ions were modeled on the basis of the previous structural and simulation studies.49,50 E406 (residue numbering in PDB ID 5LLU is shifted at certain regions of due to unresolved protein segments; in this study, residue numbering refers to the original EAAT1 wild-type sequence) was modeled in its protonated form to mimic the H+ binding to the transporter, which is an additional necessary element for the transport cycle in EAATs.24,51 All the simulations were performed in the presence of three Na+ ions, H+, and the substrate (aspartate), a state referred to as the fully bound state of the transporter. hEAAT1 is mostly present in the neurons and glial cells where the membrane is rich in cholesterol.52 We embedded the crystal structure in a lipid bilayer containing 1-palmitoyl-2-oleoyl-sn-glycero-3-phosphocholine (POPC) and cholesterol (Chol) in a 1:1 ratio (Figure 1A) to take into account the potential impact of cholesterol. It is noted that the neuronal membranes are more complex, and the lipid composition used here is merely an approximate representation of the biological system. Nevertheless, as the focus of this study is on capturing and characterizing the Cl−-conducting state in hEAAT1, this representation should be adequate. The protein–membrane system was then fully hydrated and ionized with NaCl to a 150 mM concentration.
Simulation Protocol.
All the simulations were performed under periodic boundary conditions using NAMD2,53,54 the CHARMM36m force-field parameters for protein and lipids,55,56 and the TIP3P water model. During the initial equilibration, protein backbone heavy atoms were harmonically restrained with a force constant of 1 kcal/mol/Å2; these were then released at the start of the production run. All the nonbonded forces were calculated with a cutoff distance of 12 Å and a switching distance of 10 Å. A Langevin thermostat using γ = 1 ps−1 was used to maintain the system temperature at 310 K. Long-range electrostatic forces were calculated using the particle mesh Ewald (PME) method.57 The pressure of the system was maintained at 1 bar along the membrane normal using a Nosé–Hoover Langevin piston.58 An integration time step of 2 fs was used in all the simulations.
Capturing Cl−-Conducting Conformation in hEAAT1.
To sample the conformational transitions and to capture an intermediate that might best represent the Cl−-conducting state (ClCS) in hEAAT1, we employed well-tempered metadynamics (WT-MetaD).59 These simulations induce the desired conformational transitions (OFS ⇌ IFS) along specified reaction coordinates and sample the underlying conformational space within the simulated time scales. A comparison of the hEAAT1 structure in the OFS (PDB: 5LLU)23 and the inward-occluded (IFS) crystal structure of GltPh (PDB:4X2S),28 a structurally close homologue of hEAAT1, indicated that the complete structural transition involved a combination of a translation (ζ) and reorientation (θ) of the transport domain with respect to the scaffold domain (Figure 1B). Thus, a two-dimensional, 200 ns WT-MetaD simulation was performed using these specific reaction coordinates (also referred to as collective variables, CVs): translation (ζ) of the transport domain along the membrane normal and orientation (θ) of the transport domain with respect to the scaffold domain. Cα atoms of the scaffold domain (residues 50–110 and 191–281) and the transport domain (residues 113–147 and 291–439) were used to define the CVs. ζ was defined as the distance (Z-component calculated using the distanceZ CV as defined in the COLVAR module60 of NAMD53,54) between the center of mass of the scaffold and transport domain. Similarly, θ was defined between the scaffold and transport domains using the orientationAngle CV in the COLVAR module60 of NAMD.53,54 The WT-MetaD simulation was performed with an initial Gaussian hill-height of 0.5 kcal/mol, a bias factor of 11, and a Gaussian hill deposition rate of 2 ps. To maintain the fully bound state of the transporter during the simulations, Na2, which is known to have a low affinity30 but plays an important role in the dynamics of HP2,49 was restrained to its binding pocket with a weak harmonic potential.
To identify putative ClCSs from the ensemble of structures generated during the WT-MetaD simulation, we monitored the formation of water-filled pathways connecting the two sides of the membrane and examined the distance between L244 (L224 in PDB 5LLU) and G439 (G419 in PDB 5LLU), the residue pair analogous to the ones cross-linked in a recent study to trap the ClCS of GltPh.11 Assessed by the hydration profile, the WT-MetaD simulation was able to visit putative ClCS conformations multiple times. A representative ClCS was then subjected to a 100 ns MD simulation with a distance restraint on the Cα atoms of L244 and G439 and then used in subsequent calculations.
Free-Energy Calculations of Cl− and Na+ Permeation.
In order to calculate the energetics associated with the permeation of Cl− and Na+ ions through the identified interfacial hydrated pathway, we performed umbrella sampling (US) simulations,61 seeded using the water molecules along the pathway captured during the 100 ns equilibrium simulation described above. US calculations were performed with distance (Z-component) between the Cl−/Na+ ion and the membrane midplane as the CV. During the US simulations, the fully bound state of hEAAT1 was maintained by a weak harmonic restraint between Na2 and its binding pocket (described above). In total, 60 windows were generated at 1 Å spacing, and each window was simulated for 20 ns with an accumulated sampling of 1.2 μs. US simulations were performed in the fully bound state of hEAAT1 with experimentally based distance restraints between the Cα atoms of L244 and G439 (used for trapping the ClCS in GltPh11). Free-energy profiles were calculated with WHAM (weighted histogram analysis method)62 and used the entire trajectory of each window.
Simulations of Pathway Mutants.
On the basis of our recent study in GltPh11 and the captured free-energy profiles for the permeation of Cl− in hEAAT1, we designed two mutant constructs, A289F-hEAAT1 and M286 V-hEAAT1, which were used in additional simulations of the ClCS. After introduction of the mutations in the ClCS of hEAAT1, an initial equilibration of 10 ns was performed with the protein backbone atoms harmonically restrained with a force constant of 1 kcal/mol/ Å2. Then, these restraints were removed and a 100 ns production run was performed. In all the simulations, we continued to maintain the distance between the Cα atoms of L244 and G439 through a distance restraint, as described above.
Analysis of the Simulations.
All the computational analyses were performed in VMD using in-house scripts. The root-mean square displacement (RMSD) calculations were performed using the protein backbone heavy atoms. The RMSD of the transport domain was calculated after aligning the entire structure on the scaffold domain. The cross-link distance between L224 and G439 was calculated by measuring the distance between the Cα atoms of the two residues. A 5 Å heavy-atom distance was used to tag the protein residues that interacted with the permeating Cl− ions. Solvent accessible surface area (SASA) calculations were performed using VMD.47 The water occupancy in the WT and mutant proteins was measured by calculating the number of water molecules within 5 Å of the constriction region, defined by F50, T54, M286, and A289. Lastly, the pore-radius profiles of the simulated systems were calculated using Hole.63
Water Wire Calculation.
The water pathway connecting the extracellular and intracellular milieu was searched using a breadth-first algorithm. A hydrogen bond was defined on the basis of a distance of ≤2.5 Å64 between an oxygen and a hydrogen to determine water connectivity to neighboring water molecules. The first water molecule in each water pathway was searched using a distance of ≤4 Å between a water oxygen atom and the protein surface. Next, the water pathway with the least number of O–H bonds in each frame was considered as the shortest hydrogen-bonded path. The water pathway was considered to be in the intracellular region once the newly found water molecule was at z ≤ – 15 Å (membrane centered at z = 0).
Substrate Stability.
To monitor the stability of the substrate in its binding pocket during the metadynamics and US simulations, we calculated the distance between the centers of masses of the substrate’s heavy atoms and its binding pocket (residues 363, 364, 365, 402, 441, 476, 479, 480, and 483).
Harvesting and Preparing Oocytes.
Female Xenopus laevis frogs were obtained from NASCO International (Fort Atkinson, WI). Stage V oocytes were harvested following anesthesia with 6.5 mM tricaine in 7.14 mM sodium bicarbonate, pH 7.5 and stored in OR-2 buffer (82.5 mM NaCl, 2 mM KCl, 1 mM MgCl2, 5 mM hemisodium HEPES, pH 7.5). All surgical procedures were approved by the University of Sydney Animal Ethics under the Australian Code of Practice for the Care and Use of Animals for Scientific Purposes. Oocytes were defolliculated by agitation with 2 mg/mL collagenase for 1 h. Following digestion, oocytes were injected with 4.6 ng of cRNA and stored with shaking at 16–18 °C in standard frog Ringer’s solution (96 mM NaCl, 2 mM KCl, 1 mM MgCl2, 1.8 mM CaCl2, 5 mM hemisodium HEPES, pH 7.5) supplemented with 50 μg/mL gentamycin, 50 μg/mL tetracycline, 2.5 mM sodium pyruvate, and 0.5 mM theophylline.
Electrophysiology.
Two to four days after injections, currents were recorded using the two-electrode voltage clamp technique with a Geneclamp 500 amplifier (Axon Instruments, Foster City, CA) interfaced with a PowerLab 2/20 chart recorder (ADInstruments, Sydney, Australia) and a Digidata 1322A (Axon Instruments), which was used in conjunction with the Chart software (ADInstuments; Axon Instruments). All recordings were made with a bath grounded via a 3 M KCl/1% agar bridge linking to a 3 M KCl reservoir containing an Ag/AgCl2 ground electrode to minimize offset potentials. Current–voltage relationships (IV) for substrate-elicited conductance were determined by measuring substrate-elicited currents during 245 ms voltage pulses between −100 mV and +60 mV at 10 mV steps. Background currents were eliminated by subtracting currents in the absence of substrate from substrate-elicited currents at corresponding membrane potentials. For experiments determining the apparent affinity (Km) of aspartate for wild-type and mutant hEAAT1 transporters, IVs were measured with a range of substrate concentrations in standard frog Ringer’s solution. Substrate-elicited currents (I) at −60 mV were fitted to the Michaelis–Menten equation by least-squares:
| (1) |
where Km is the substrate concentration required to reach half-maximum response, Imax is the maximum response, and [S] is the substrate concentration. In addition to the ion-coupled substrate transport current, hEAAT1 also possesses a thermodynamically uncoupled substrate-activated uncoupled Cl− conductance. Currents obtained at +60 mV (I+60mV) and the reversal potential (Erev) of the overall aspartate-elicited currents can be used to indicate the presence and the properties of the Cl− current component. I+60mV vaues were normalized to the maximal current elicited (using 300 μM l-aspartate) at −100 mV of the corresponding cell, representing the proportion of the Cl− current to the overall aspartate-elicited current; Erev values were measured using 30 μM l-aspartate in standard frog Ringer’s solution.
CONCLUDING REMARKS
As a multidomain protein, the EAATs display complex conformational changes mediated by an elevator-like movement during their ion-coupled substrate transport cycle. These conformational changes are mediated by ions and are necessary to couple their binding and translocation to vectorial movement of the substrate. In addition to this complex, coupled transport mechanism, the EAATs are also known to permit thermodynamically uncoupled Cl− movement, a process that is thought to reconcile charge balance disrupted by the neurotransmitter transport process. By combining MD simulations with an advanced sampling technique, our study sheds light on the complex conformational rearrangements required for the elevator movement and activation of the Cl− channel in hEAAT1, providing key information to map the complete transport cycle shared by SLC1A transporter family (Figure 4). MD simulations revealed that the open channel conformation proceeds through a twisting, lateral movement of the transport domain with respect to the scaffold domain during the transport cycle. This study was able to capture an uninterrupted aqueous pore at the interface of the scaffold and transport domains, which allows for the permeation of Cl− ions from either side of the membrane. The free-energy calculations for the permeation of Cl− and Na+ ions indicate the preference of the conduction pathway for anions and the location of gate-like structures formed by hydrophobic residues at extracellular and intracellular openings.
Figure 4.

Formation of an ion-permeating intermediate in EAATs during their substrate transport cycle. A single protomer is shown with the scaffold domain in cyan, transport domain in orange, water in blue, and permeating Cl− ions in magenta. The headgroups of the surrounding lipid bilayer are shown in green spheres, and cholesterol molecules are shown in black sticks. hEAAT1 utilizes a twisting elevator mechanism of transport, in which the transport domain moves along the translocation pathway away from the OFS to the IFS. During the transition, a continuous aqueous pore is formed at the domain interface, which permits solvent and/or ion accessibility from either side of the membrane.
Supplementary Material
ACKNOWLEDGMENTS
The authors acknowledge computing resources provided by Blue Waters at National Center for Supercomputing Applications (E.T.), Extreme Science and Engineering Discovery Environment (Grant MCA06N060 to E.T.), and Microsoft Azure (E.T.). The authors thank C. Handford and those that support the X. laevis colony at the University of Sydney.
Funding
Research reported in this publication was supported by the National Institutes of Health under Grant P41-GM104601 (E.T.) and by the Australian National Health and Medical Research Council under Grant APP1164494 (R.R.).
Footnotes
Supporting Information
The Supporting Information is available free of charge at https://pubs.acs.org/doi/10.1021/acschemneuro.1c00769.
Figures of captured ClCS conformations, snapshots highlighting discontinuity of the inter-domain water in OFS and IFS, stability of the substrate in metadynamics simulations, convergence of the free-energy profiles, PMF profiles, χ1 dihedral angle profile, and stability of the substrate during the US simulations (PDF)
Movie of conduction of a Cl− ion through the its Cl−-conducting state (ClCS) of hEAAT1 (MOV)
Movie of WT ClCS-hEAAT1 allows for the formation of fully connected hydration at the interface of scaffold and transport domains (MOV)
Movie of A289F mutation results in the disruption of the connection between the cytoplasmic and extracellular water compartments within the interface between the transport and scaffold domains (MOV)
Movie of M286V results in the disruption of the connection between the cytoplasmic and extracellular water compartments within the interface between the transport and scaffold domains (MOV)
The authors declare the following competing financial interest(s): S.P. is currently an employee of Loxo Oncology @ Lilly and is a shareholder of stock in Eli Lilly and Co.
Complete contact information is available at: https://pubs.acs.org/10.1021/acschemneuro.1c00769
Contributor Information
Shashank Pant, Theoretical and Computational Biophysics Group, NIH Center for Macromolecular Modeling and Bioinformatics, Beckman Institute for Advanced Science and Technology, Department of Biochemistry, and Center for Biophysics and Quantitative Biology, University of Illinois at Urbana–Champaign, Urbana, Illinois 61801, United States; Present Address: Loxo Oncology @ Lilly, Louisville, CO 80027, USA.
Qianyi Wu, School of Medical Sciences, Faculty of Medicine and Health, University of Sydney, Camperdown, New South Wales 2006, Australia; Present Address: Department of Physiology and Biophysics, Weill Cornell Medicine, 1300 York Avenue, New York, NY 10065, USA.
Renae Ryan, School of Medical Sciences, Faculty of Medicine and Health, University of Sydney, Camperdown, New South Wales 2006, Australia.
Emad Tajkhorshid, Theoretical and Computational Biophysics Group, NIH Center for Macromolecular Modeling and Bioinformatics, Beckman Institute for Advanced Science and Technology, Department of Biochemistry, and Center for Biophysics and Quantitative Biology, University of Illinois at Urbana–Champaign, Urbana, Illinois 61801, United States.
REFERENCES
- (1).Mitchell P A general theory of membrane transport from studies of bacteria. Nature 1957, 180, 134–136. [DOI] [PubMed] [Google Scholar]
- (2).DeFelice LJ Transporter structure and mechanism. Trends in Neurosciences 2004, 27, 352–359. [DOI] [PubMed] [Google Scholar]
- (3).Jardetzky O Simple allosteric model for membrane pumps. Nature 1966, 211, 969–970. [DOI] [PubMed] [Google Scholar]
- (4).Forrest LR; Krämer R; Ziegler C The structural basis of secondary active transport mechanisms. Biochimica et Biophysica Acta - Bioenergetics 2011, 1807, 167–188. [DOI] [PubMed] [Google Scholar]
- (5).Jiang T; Wen P-C; Trebesch N; Zhao Z; Pant S; Kapoor K; Shekhar M; Tajkhorshid E Computational Dissection of Membrane Transport at a Microscopic Level. Trends Biochem. Sci 2020, 45, 202–216. [DOI] [PMC free article] [PubMed] [Google Scholar]
- (6).Gadsby DC Ion channels versus ion pumps: the principal difference, in principle. Nat. Rev. Mol. Cell Biol 2009, 10, 344–352. [DOI] [PMC free article] [PubMed] [Google Scholar]
- (7).Fairman W; Vandenberg R; Arriza J; Kavanaught M; Amara S An excitatory amino-acid transporter with properties of a ligand-gated chloride channel. Nature 1995, 375, 599–603. [DOI] [PubMed] [Google Scholar]
- (8).Mager S; Min C; Henry DJ; Chavkintt C; Hoffman BJ; Davidson N; Lester HA Conducting states of a mammalian serotonin transporter. Neuron 1994, 12, 845–859. [DOI] [PubMed] [Google Scholar]
- (9).Wadiche JI; Amara SG; Kavanaugh MP Ion fluxes associated with excitatory amino acid transport. Neuron 1995, 15, 721–728. [DOI] [PubMed] [Google Scholar]
- (10).Li J; Shaikh SA; Enkavi G; Wen P-C; Huang Z; Tajkhorshid E Transient formation of water-conducting states in membrane transporters. Proceedings of the National Academy of Sciences, USA 2013, 110, 7696–7701. [DOI] [PMC free article] [PubMed] [Google Scholar]
- (11).Chen I; Pant S; Wu Q; Cater R; Sobti M; Vandenberg R; Stewart AG; Tajkhorshid E; Font J; Ryan R Glutamate transporters have a chloride channel with two hydrophobic gates. Nature 2021, 591, 327–331. [DOI] [PMC free article] [PubMed] [Google Scholar]
- (12).Danbolt NC Glutamate uptake. Progress in Neurobiology 2001, 65, 1–105. [DOI] [PubMed] [Google Scholar]
- (13).Vandenberg RJ; Ryan RM Mechanisms of glutamate transport. Physiol. Rev 2013, 93, 1621–1657. [DOI] [PubMed] [Google Scholar]
- (14).Zerangue N; Kavanaugh MP Flux coupling in a neuronal glutamate transporter. Nature 1996, 383, 634–637. [DOI] [PubMed] [Google Scholar]
- (15).Levy LM; Warr O; Attwell D Stoichiometry of the glial glutamate transporter GLT-1 expressed inducibly in a Chinese hamster ovary cell line selected for low endogenous Na+-dependent glutamate uptake. J. Neurosci 1998, 18, 9620–9628. [DOI] [PMC free article] [PubMed] [Google Scholar]
- (16).Kanai Y; Stelzner M; Nussberger S; Khawaja S; Hebert SC; Smith CP; Hediger MA The neuronal and epithelial human high affinity glutamate transporter. Insights into structure and mechanism of transport. J. Biol. Chem 1994, 269, 20599–20606. [PubMed] [Google Scholar]
- (17).Ryan RM; Mindell JA The uncoupled chloride conductance of a bacterial glutamate transporter homolog. Nature Structural & Molecular Biology 2007, 14, 365–371. [DOI] [PubMed] [Google Scholar]
- (18).Ryan RM; Mitrovic AD; Vandenberg RJ The chloride permeation pathway of a glutamate transporter and its proximity to the glutamate translocation pathway. J. Biol. Chem 2004, 279, 20742–20751. [DOI] [PubMed] [Google Scholar]
- (19).Jen JC Hereditary episodic ataxias. Ann. N.Y. Acad. Sci 2008, 1142, 250–253. [DOI] [PubMed] [Google Scholar]
- (20).Winter N; Kovermann P; Fahlke C A point mutation associated with episodic ataxia 6 increases glutamate transporter anion currents. Brain 2012, 135, 3416–3425. [DOI] [PubMed] [Google Scholar]
- (21).Chivukula AS; Suslova M; Kortzak D; Kovermann P; Fahlke C Functional consequences of SLC1A3 mutations associated with episodic ataxia 6. Human mutation 2020, 41, 1892–1905. [DOI] [PubMed] [Google Scholar]
- (22).Wu Q; Akhter A; Pant S; Cho E; Zhu JX; Garner A; Ohyama T; Tajkhorshid E; van Meyel D; Ryan RM Ataxia-linked SLC1A3 mutations alter EAAT1 chloride channel activity and glial regulation of CNS function. J. Clin. Inv, in press, 2022. DOI: 10.1172/JCI154891 [DOI] [PMC free article] [PubMed] [Google Scholar]
- (23).Canul-Tec JC; Assal R; Cirri E; Legrand P; Brier S; Chamot-Rooke J; Reyes N Structure and allosteric inhibition of excitatory amino acid transporter 1. Nature 2017, 544, 446–451. [DOI] [PMC free article] [PubMed] [Google Scholar]
- (24).Qiu B; Matthies D; Fortea E; Yu Z; Boudker O Cryo-EM structures of excitatory amino acid transporter 3 visualize coupled substrate, sodium, and proton binding and transport. Sci. Adv 20217eabf5814. [DOI] [PMC free article] [PubMed] [Google Scholar]
- (25).Yernool D; Boudker O; Jin Y; Gouaux E Structure of a glutamate transporter homologue from. Pyrococcus horikoshii. Nature 2004, 431, 811–818. [DOI] [PubMed] [Google Scholar]
- (26).Reyes N; Ginter C; Boudker O Transport mechanism of a bacterial homologue of glutamate transporters. Nature 2009, 462, 880–885. [DOI] [PMC free article] [PubMed] [Google Scholar]
- (27).Reyes N; Oh S; Boudker O Binding thermodynamics of a glutamate transporter homolog. Nature Structural & Molecular Biology 2013, 20, 634–640. [DOI] [PMC free article] [PubMed] [Google Scholar]
- (28).Akyuz N; Georgieva ER; Zhou Z; Stolzenberg S; Cuendet MA; Khelashvili G; Altman RB; Terry DS; Freed JH; Weinstein H; Boudker O; Blanchard SC Transport domain unlocking sets the uptake rate of an aspartate transporter. Nature 2015, 518, 68–73. [DOI] [PMC free article] [PubMed] [Google Scholar]
- (29).Verdon G; Boudker O Crystal structure of an asymmetric trimer of a bacterial glutamate transporter homolog. Nature Structural & Molecular Biology 2012, 19, 355–357. [DOI] [PMC free article] [PubMed] [Google Scholar]
- (30).Guskov A; Jensen S; Faustino I; Marrink SJ; Slotboom DJ Coupled binding mechanism of three sodium ions and aspartate in the glutamate transporter homologue Glttk. Nat. Commun 2016, 7, 13420. [DOI] [PMC free article] [PubMed] [Google Scholar]
- (31).Ryan RM; Vandenberg RJ Elevating the alternating-access model. Nature Structural & Molecular Biology 2016, 23, 187–189. [DOI] [PubMed] [Google Scholar]
- (32).Ryan GL; Rutenberg AD Clocking out: modeling phage-induced lysis of Escherichia coli. J. Bacteriol 2007, 189, 4749–4755. [DOI] [PMC free article] [PubMed] [Google Scholar]
- (33).Mim C; Balani P; Rauen T; Grewer C The glutamate transporter subtypes EAAT4 and EAATs 1–3 transport glutamate with dramatically different kinetics and voltage dependent but share a common uptake mechanism. J. Gen. Physiol 2005, 126, 571–589. [DOI] [PMC free article] [PubMed] [Google Scholar]
- (34).Kovermann P; Machtens J-P; Ewers D; Fahlke C A conserved aspartate determines pore properties of anion channels associated with excitatory amino acid transporter 4 (EAAT4). J. Biol. Chem 2010, 285, 23676–23686. [DOI] [PMC free article] [PubMed] [Google Scholar]
- (35).Huang S; Vandenberg RJ Mutations in transmembrane domains 5 and 7 of the human excitatory amino acid transporter 1 affect the substrate-activated anion channel. Biochemistry 2007, 46, 9685–9692. [DOI] [PubMed] [Google Scholar]
- (36).Hotzy J; Schneider N; Kovermann P; Fahlke C Mutating a conserved proline residue within the trimerization domain modifies Na+ binding to excitatory amino acid transporters and associated conformational changes. J. Biol. Chem 2013, 288, 36492–36501. [DOI] [PMC free article] [PubMed] [Google Scholar]
- (37).Owe SG; Marcaggi P; Attwell D The ionic stoichiometry of the GLAST glutamate transporter in salamander retinal glia. Journal of Physiology 2006, 577, 591–599. [DOI] [PMC free article] [PubMed] [Google Scholar]
- (38).van der Kamp MW; Mulholland AJ Combined quantum mechanics/molecular mechanics (QM/MM) methods in computational enzymology. Biochemistry 2013, 52, 2708–2728. [DOI] [PubMed] [Google Scholar]
- (39).Machtens JP; Kortzak D; Lansche C; Leinenweber A; Kilian P; Begemann B; Zachariae U; Ewers D; de Groot BL; Briones R; Fahlke C Mechanisms of anion conduction by coupled glutamate transporters. Cell 2015, 160, 542–553. [DOI] [PubMed] [Google Scholar]
- (40).Tsunenari T; Sun H; Williams J; Cahill H; Smallwood P; Yau K-W; Nathans J Structure-function analysis of the bestrophin family of anion channels. J. Biol. Chem 2003, 278, 41114–41125. [DOI] [PMC free article] [PubMed] [Google Scholar]
- (41).Scopelliti AJ; Heinzelmann G; Kuyucak S; Ryan RM; Vandenberg RJ Na+ interactions with the neutral amino acid transporter ASCT1. J. Biol. Chem 2014, 289, 17468–17479. [DOI] [PMC free article] [PubMed] [Google Scholar]
- (42).Cater RJ; Ryan RM; Vandenberg RJ The Split Personality of Glutamate Transporters: A Chloride Channel and a Transporter. Neurochem. Res 2016, 41, 593–599. [DOI] [PubMed] [Google Scholar]
- (43).Cheng MH; Torres-Salazar D; Gonzalez-Suarez AD; Amara SG; Bahar I Substrate transport and anion permeation proceed through distinct pathways in glutamate transporters. eLife 2017, 6, No. e25850. [DOI] [PMC free article] [PubMed] [Google Scholar]
- (44).Hotzy J; Machtens J-P; Fahlke C Neutralizing aspartate 83 modifies substrate translocation of excitatory amino acid transporter 3 (EAAT3) glutamate transporters. J. Biol. Chem 2012, 287, 20016–20026. [DOI] [PMC free article] [PubMed] [Google Scholar]
- (45).Schneider N; Cordeiro S; Machtens J-P; Braams S; Rauen T; Fahlke C Functional properties of the retinal glutamate transporters GLT-1c and EAAT5. J. Biol. Chem 2014, 289, 1815–1824. [DOI] [PMC free article] [PubMed] [Google Scholar]
- (46).Barish ME A transient calcium-dependent chloride current in the immature Xenopus oocyte. Journal of Physiology 1983, 342, 309–325. [DOI] [PMC free article] [PubMed] [Google Scholar]
- (47).Humphrey W; Dalke A; Schulten K VMD - Visual Molecular Dynamics. J. Mol. Graphics 1996, 14, 33–38. [DOI] [PubMed] [Google Scholar]
- (48).Zhang L; Hermans J Hydrophobicity of cavities in proteins. PROTEINS: Structure, Function, and Genetics 1996, 24, 433–438. [DOI] [PubMed] [Google Scholar]
- (49).Boudker O; Ryan RM; Yernool D; Shimamoto K; Gouaux E Coupling substrate and ion binding to extracellular gate of a sodium-dependent aspartate transporter. Nature 2007, 445, 387–393. [DOI] [PubMed] [Google Scholar]
- (50).Huang Z; Tajkhorshid E Dynamics of the Extracellular Gate and Ion-Substrate Coupling in the Glutamate Transporter. Biophys. J 2008, 95, 2292–2300. [DOI] [PMC free article] [PubMed] [Google Scholar]
- (51).Canul-Tec JC; Kumar A; Dhenin J; Assal R; Legrand P; Rey M; Chamot-Rooke J; Reyes N The ion-coupling mechanism of human excitatory amino acid transporters. EMBO Journal 2022, 41, No. e108341. [DOI] [PMC free article] [PubMed] [Google Scholar]
- (52).Raunser S; Haase W; Franke C; Eckert GP; Muller WE; Kuhlbrandt W Heterologously Expressed GLT-1 Associates in 200-nm Protein-Lipid Islands. Biophys. J 2006, 91, 3718–3726. [DOI] [PMC free article] [PubMed] [Google Scholar]
- (53).Phillips JC; Braun R; Wang W; Gumbart J; Tajkhorshid E; Villa E; Chipot C; Skeel RD; Kale L; Schulten K Scalable molecular dynamics with NAMD. J. Comput. Chem 2005, 26, 1781–1802. [DOI] [PMC free article] [PubMed] [Google Scholar]
- (54).Phillips JC; Hardy DJ; Maia JDC; Stone JE; Ribeiro JV; Bernardi RC; Buch R; Fiorin G; Hénin J; Jiang W; McGreevy R; Melo MCR; Radak B; Skeel RD; Singharoy A; et al. Scalable molecular dynamics on CPU and GPU architectures with NAMD. J. Chem. Phys 2020, 153, 044130. [DOI] [PMC free article] [PubMed] [Google Scholar]
- (55).Best RB; Zhu X; Shim J; Lopes PEM; Mittal J; Feig M; MacKerell AD Optimization of the additive CHARMM all-atom protein force field targeting improved sampling of the backbone ϕ, ψ and side-chain χ1 and χ2 dihedral angles. J. Chem. Theory Comput 2012, 8, 3257–3273. [DOI] [PMC free article] [PubMed] [Google Scholar]
- (56).Klauda JB; Venable RM; Freites JA; O’Connor JW; Tobias DJ; Mondragon-Ramirez C; Vorobyov I; MacKerell AD Jr.; Pastor RW Update of the CHARMM all-atom additive force field for lipids: validation on six lipid types. J. Phys. Chem. B 2010, 114, 7830–7843. [DOI] [PMC free article] [PubMed] [Google Scholar]
- (57).Essmann U; Perera L; Berkowitz ML; Darden T; Lee H; Pedersen LG A smooth particle mesh Ewald method. J. Chem. Phys 1995, 103, 8577–8593. [Google Scholar]
- (58).Martyna GJ; Tobias DJ; Klein ML Constant pressure molecular dynamics algorithms. J. Chem. Phys 1994, 101, 4177–4189. [Google Scholar]
- (59).Barducci A; Bussi G; Parrinello M Well-Tempered Metadynamics: A Smoothly Converging and Tunable Free-Energy Method. Phys. Rev. Lett 2008, 100, 020603. [DOI] [PubMed] [Google Scholar]
- (60).Fiorin G; Klein ML; Hénin J Using collective variables to drive molecular dynamics simulations. Mol. Phys 2013, 111, 3345–3362. [Google Scholar]
- (61).Kästner J Umbrella sampling. Wiley Interdisciplinary Reviews: Computational Molecular Science 2011, 1, 932–942. [Google Scholar]
- (62).Grossfield A WHAM: the weighted histogram analysis method, version 2.0.9, 2013.
- (63).Smart OS; Neduvelil JG; Wang X; Wallace BA; Sansom MSP HOLE: A Program for the Analysis of the Pore Dimensions of Ion Channel Structural Models. J. Mol. Graphics 1996, 14, 354–360. [DOI] [PubMed] [Google Scholar]
- (64).Matsumoto M Relevance of hydrogen bond definitions in liquid water. J. Chem. Phys 2007, 126, 054503. [DOI] [PubMed] [Google Scholar]
Associated Data
This section collects any data citations, data availability statements, or supplementary materials included in this article.