Abstract
1. Cyclic phenones are chemicals of interest to the USEPA and international community due to their potential for endocrine disrupting activity.
2. Prior to this report, there was very limited information addressing metabolism of cyclic phenones by fish species and the potential for Estrogen Receptor (ER) binding and Vitellogenin (Vtg) gene activation by their metabolites.
3. The main objectives of the current research were to characterize rainbow trout (rt) liver slice-mediated in vitro metabolism of model parent cyclic phenones exhibiting disparity between ER binding and ER-mediated Vtg gene induction, and to assess the metabolic competency of fish liver in vitro tests to help determine the chemical form (parent and/or metabolite) associated with the observed biological response.
4. Biochemical strategies and high-throughput analytical methods (GC-MS, HPLC and LC-MS/MS) were applied to investigate the in vitro biotransformation of cyclobutyl phenyl ketone (CBP), benzophenone (DPK), cyclohexyl phenyl ketone (CPK) mostly in the absence of standards for metabolite characterization.
5. It was concluded that estrogenic effects of the studied cyclic phenones are mediated by the parent chemical structure for DPK, but by active metabolites for CPK. A definitive interpretation was not possible for CBP and CBPOH (alcohol), although a contribution of both structures to gene induction is suspected.
Keywords: Fish metabolism, in vitro, precision-cut liver slices, estrogen receptor, vitellogenin gene expression, endocrine disruption
Introduction
Advanced analytical technologies used for chemical characterization or structure elucidation such as liquid and gas chromatography-mass spectrometry (LC-/GC-MS; Liu et al. 2017; Li et al., 2015; Serrano et al., 2010), when applied with molecular and cellular effects-based approaches used to predict toxicity of large chemical inventories (Schmieder et al., 2014), can enhance the mechanistic understanding of toxicant impact to aquatic organisms. Including analytical chemical measurements in in vitro assays leads to better evidence and understanding of the structural properties of chemicals that may lead to hormone receptor binding, e.g., estrogen receptor (ER) binding, and subsequent initiation of ER-mediated adverse outcome pathways (AOP; Schmieder et al., 2004; Hornung et al., 2014).
Biotransformation events that affect chemical form and resulting effects or toxicity are as important to characterize for in vitro assays as they are with whole organism studies. The capability of an in vitro system to metabolize xenobiotics is important to characterize when the results of these assays are used for chemical prioritization, elucidating biotransformation pathways, predicting potential in vivo toxicity, or understanding differential responses between in vitro and in vivo systems. As part of a toxicity testing paradigm shift that focuses on molecular and cellular mechanisms and the development of toxicity pathways (Boekelheide and Andersen, 2011), further investigation into the metabolic competency of in vitro systems is required to interpret findings and advance research (Yamane et al., 2015).
Much effort has been committed to the development of in vitro models to assess aspects of hepatic metabolism and xenobiotic toxicity, including the isolated perfused liver, hepatocyte cultures, cell lines, liver slices, subcellular fractions (microsomes), expressed enzymes and in silico models (Lake and Price, 2013; Pedersen and Hill, 2000). Among these models, precision-cut liver slices remain an excellent tool to study xenobiotic metabolism and toxicity in human and other mammalian models as well as in lower vertebrates such as fish and anurans (Viviani, et al., 2017; Lake and Price, 2013; Wu et al., 2013; Olinga and Schuppan, 2013). Liver slices retain tissue architecture and all pathways of phase I and II metabolism (Schmieder et al., 2000; Martignoni et al., 2004; Starokozhko et al., 2017). They can also be used to generate toxicokinetic data, predict in vivo pathways, evaluate species response differences, facilitate species extrapolation and assess metabolic capability and ER-mediated response in the same test (Schmieder et al., 2000 and 2004). Chemical toxicity can be assessed in liver slices by various techniques including gene and protein expression, morphological examination and multiple biochemical endpoints. Recently, Tapper et al., (2018a) demonstrated the value of a fish liver slice system to assess the metabolism of a model pesticide (diazinon), using a mass balance approach including measures of chemical absorption, distribution, metabolism and elimination.
The benefits of linking rainbow trout estrogen receptor (rtER) binding and liver slice vitellogenin (Vtg) mRNA expression in vitro assays data in the perspective of AOPs has been demonstrated (Schmieder et al. 2004; Hornung et al. 2014). There are cases when exposure of slices to parent chemical results in Vtg induction even when no activity was observed in the cell-free rtER binding assay (Tapper et al., 2018b). In these instances, incorporating sensitive analytical methods can be used to monitor parent chemical disposition and identify potentially active metabolites. This information provides confirmation of the chemical identity (parent and/or metabolite), and concentrations that can activate ER-dependent pathways. The chemical structure and activity evidence obtained is important for developing predictive approaches for chemical prioritization of large chemical inventories to be assessed for further testing in assays at higher levels of biological organization, and when the chemicals are of very diverse structures but not specifically designed to interact with biological targets.
Cyclic phenones are a class of chemicals that include benzophenones and are suspected endocrine disruptors (Kunisue et al., 2010, Wang et al. 2016). Prior to the current report, there was little information available addressing the main parent chemical exposure pathway, metabolic biotransformation of these chemicals and potential for ER binding and gene activation by their metabolites in fish species. Additionally, the lack of suitable standards (Stds) has made metabolite characterization and identification a challenge. An initial study by our group (Tapper et al., 2018b), reported rtER competitive binding and gene induction (Vtg mRNA) activity for three model cyclic phenones, cyclobutyl phenyl ketone (CBP), benzophenone (DPK), cyclohexyl phenyl ketone (CPK), and their hydroxylated metabolites using available Stds. As a furtherance of this effort, the current report specifically addresses rt liver slice-mediated metabolic transformation of CBP, DPK, CPK and conjugative pathways for their primary metabolites. The metabolism-based investigation described here was essential to understand an apparent disparity observed between rtER binding activity and Vtg mRNA expression in rt liver slices in response to CBP, DPK and CPK exposure. The specific objectives of the research were to: 1) develop suitable analytical methods in the absence of Stds for metabolite characterization needed to investigate the in vitro slice-mediated metabolic conversion of model cyclic phenones with differential biological responses in the rtER binding and slice Vtg mRNA induction assays; 2) combine information from in vitro assays to elucidate the chemical forms, i.e. parent and/or metabolic products, responsible for ER binding leading to Vtg mRNA induction and, 3) propose a plausible metabolic pathway for a model cyclic phenone in trout liver slices. The application of fish liver in vitro assays incorporating metabolism information to improve prioritization of potential endocrine disrupting chemicals for further testing is also addressed. Elucidation of the mass-spectrometric profile and identity of cyclic phenone metabolites is reported in an additional manuscript by Serrano et al., (2018) titled Mass-spectrometric identification of cyclic phenone metabolites produced by rainbow trout liver slices.
Materials and Methods
Chemicals and reagents
All reagents were of the highest purity and grade available. Acetonitrile (ACN) and hexane were procured from Fisher Scientific (Pittsburg, PA). Ethanol (EtOH) was obtained from Aaper Alcohol and Chemical Co. (Shelbyville, KT). 4-Methylphenol (p-Cresol) was purchased from Supelco Technologies, (Bellefonte, PA). Cyclohexyl phenyl methanol (CPKOH; CAS 945-49-3; 97%) was purchased from Atlantic Chemicals, Stratton, United Kingdom. The remaining test chemicals and metabolite standards were obtained from Sigma-Aldrich (St. Louis, MO) with reported purities of 98–99%, including: cyclobutyl phenyl ketone (CBP; CAS 5407-98-7), cyclohexyl phenyl ketone (CPK; CAS 712-50-5), cyclohexyl (2,4-dihydroxyphenyl) ketone (opCPK; CAS 97231-21-5), benzophenone or diphenylketone (DPK; CAS 119-61-9), benzhydrol (BADPK; CAS 91-01-0) and 4-hydroxybenzophenone (OHDPK; CAS 1137-42-4). TEDG buffer components (Tris, EDTA, DTT, glycerol) and slice exposure media were also obtained from Sigma-Aldrich and used as previously described (Schmieder et al., 2004). Reagents for conjugate hydrolysis and chemicals for derivatizations obtained from Sigma-Aldrich were: Sulfatase, β-Glucuronidase, 1,4-lactone-D-saccharic acid, N,O-bis(trimethylsilyl)trifluoro acetamide (BSTFA), and N-methyl-trimethylsilyltrifluoroacetamide (MSTFA). All physical-chemical parameters for test chemicals and metabolites were obtained from EPI Suite v4.11 (USEPA) with the exception of log hexane/water partition coefficients and experimental GC-MS retention times.
Fish
Immature rainbow trout (Oncorhynchus mykiss, 500–1000 g, Erwin strain) were obtained from the US Geological Survey Midwest Environmental Science Center (LaCrosse, WI), acclimated, and held as reported by Tapper et al., 2018a,b.
HPLC
Analyses of TEDG buffer, binding cytosol, and slice exposure media for aqueous soluble parent or hydroxylated metabolites and conjugates were performed on a Beckman System Gold HPLC (Beckman, Fullerton, CA). The instrument consisted of a 508 model refrigerated autosampler, 126 model programmable solvent module and 168 model diode array detector. Acetonitrile (ACN) extract injections consisting of 100μL of 1:1 or 1:10 dilutions with 10% ACN were made onto a 2.5 μm, 50 X 2.0 mm Synergi C18 RP-HPLC column (Phenomenex, Germany) kept at 20°C. Isocratic mobile phase (1.2 mL/min) consisting of 10% ACN and 0.1 M sodium acetate was used for all sample runs (30 min). Qualitative analysis of metabolites was done by comparison of retention times, peak integrity, and absorbance properties to available Stds. When possible, quantitative analyses were performed with calibration curves.
GC-MS
Hexane extracts of TEDG buffer, binding cytosols, and slice exposure media were analyzed by GC-MS for parent chemicals and metabolites with adequate volatility, sensitivity and thermal stability. Extracts were analyzed on an Agilent 6890N gas chromatograph connected to either an Agilent 5975 Inert XL or Agilent 5973 mass selective detector (Agilent Technologies, Santa Clara, CA, USA) using the conditions reported by Tapper et al., 2018b and reproduced in Supplemental Table 1. Electron and chemical ionization approaches were used for qualitative analyses. Selected- or total-ion methods were used for quantitative studies (see Data analysis section). Due to the limited quantity of metabolites formed, chemical derivatization with BSTFA or MSTFA was performed in some 24 h slice-incubated CPK samples prior to GC-MS as described by Segura et al. (1998) to confirm the presence, relative yield and thermal stability of hydroxylated CPK metabolites in reaction mixtures (see Serrano et al., 2018).
Chemical analyses in binding cytosol
Hexane extraction efficiencies of CBP, DPK, CPK, and available putative metabolites BADPK, OHDPK, opCPK and CPKOH were verified by recovery of Std aliquots (2 to 20 μL) added to TEDG buffer (final volume 257 μL) to achieve concentrations ranging between −5.7 to −3 log M (2.5–1000 μM) and GC-MS with calibration curves as described by Tapper et al., 2018b. Chemical stocks used for spikes were prepared in EtOH and dilutions for calibration Stds were done with hexane. Concentrations used varied with chemical and were chosen to overlap anticipated sample concentrations.
Cell-free binding assays utilizing homogenized trout liver cytosol fractions may contain, in addition to rtER protein, metabolizing enzymes that can affect exposure chemical concentrations (Schmieder et al., 2004). To monitor for potential decrease in parent chemical due to metabolism and to search for active metabolites, CBP and DPK were tested in the ER binding assay cytosol at −4 log M (100 μM) and −3 log M (1000 μM), equivalent to 20 and 200 nmoles per incubation tube, respectively. Samples for chemical analysis were taken at 0 (~10 min), 4 and 20 h (4°C). The same CPK exposure concentrations (100 and 1000 μM) were measured but at 0 and 20 h. Trout liver cytosolic fractions were prepared in TEDG buffer as described by Schmieder et al., 2004. Aliquots from the 1000 μM nominal sample were diluted to 200 μM (−3.7 log M) with TEDG prior to sample processing, and 100 μM nominal samples were processed without further dilution. GC-MS chemical measurements of cytosol hexane extracts were done as reported for TEDG samples (Tapper et al., 2018b). GC-MS analyses were simultaneously performed for parent compounds and metabolites, resulting in detection of CBP, DPK and CPK and the metabolites CBPOH and BADPK.
Test chemical and metabolites in the aqueous fractions of TEDG (for spike recovery determinations) or binding cytosols samples were determined as follows: 257 μL ACN was added to 257 μL samples, vortexed and centrifuged at 4°C. Aliquots of 170 μL were diluted 1:1 with 10% ACN/water mobile phase, and p-cresol was added as internal standard (IStd) at 25 μM final concentration (9 μL) for a final volume/sample of 349 μL. Samples were analyzed by HPLC as described above to also look for unknown late eluting metabolites.
Chemical analyses in trout liver slice exposures
The hexane extraction efficiencies of parent chemicals and available metabolites were measured in exposure media at a concentration range of −6 to −3.3 log M (1–500 μM). Briefly, the chemical stock in EtOH (1–10 μL) was added to exposure media to a final volume of 450 μL, and samples were processed for GC-MS as described by Tapper et al., 2018b. To measure changes in CBP, DPK and CPK parent chemical concentration in media over time and detect metabolites potentially associated with ER-mediated effects (especially for the ER non-binder CPK which induced Vtg in slices), slice exposures were conducted at concentrations where significant Vtg mRNA induction had been previously observed (Tapper et al., 2018b). DPK was tested at 100 and 200 μM, and CPK at 200 μM. Due to lower ER activation efficacy (Tapper et al., 2018b), CBP was tested at −3.53 log M (300 μM). All experiments were performed at least twice, and all measurements were done at least in duplicate for each concentration and sampling time (0, 4, 8, 24 and 48 h). Chemical concentrations in the media and within the slices were analyzed, and chemical mass balances calculated. Aliquots from slice exposure wells containing media controls (Cont), media and chemical only without slice (MC), or media with chemical and liver slice (MCS) were analyzed as follows: 450 μL of hexane was added to 450 μL exposure media, and the mixture was vortexed (20 sec), and centrifuged @14000 X g for 18 min; then, 9 μL IS in hexane was added to a 350 μL hexane extract subsample (Dilution Factor [DF]=1.026) and analyzed by GC-MS with calibration curves. To measure chemical concentration within a slice, a control (ContS) or exposed slice (S) was removed from media, blotted dry, hydrated in 450 μL of water (3 min), sonicated to produce a lysate, and analyzed as above for media samples. GC-MS analyses were simultaneously performed for parent compounds and potential metabolites, this time resulting in detection of parent chemicals, CBPOH, BADPK and multiple unidentified CPK metabolites.
To monitor for the potential formation of sulfate and glucuronide conjugates of hydroxylated metabolites, additional 450 μL exposure media samples (Cont, MC, MCS, ContS, and S) at each exposure time were hydrolyzed in vials at each exposure time with Sulfatase (40 units in 100 mM ammonium acetate buffer, pH 5.0 plus 5 mM D-saccharic acid-1,4-lactone) or β-Glucuronidase (48 units in 100 mM potassium phosphate buffer pH 6.8) for 12 h at 37°C. Reactions were stopped with the addition of an equal volume of hexane. Concentrations of CPK, DPK, CBP and detected metabolites were measured by GC-MS as previously described for non-hydrolyzed exposure media and slices but using an additional DF of 1.26 (total DF=1.29) corresponding to the addition of hydrolysis reagents. Experimental confirmation of Sulfatase and β-Glucuronidase enzyme activity is described in the Appendices.
Aqueous fractions of exposure media or slice lysates were also analyzed for parent chemicals and metabolites as follows: 340 μL exposure media or lysate were extracted with equal volume of ACN at each exposure time (0–48h). Extract aliquots (170 μL) were diluted with 10% ACN/water, and analyzed by HPLC. For aqueous fraction analysis of CBPOH and various CPK metabolites lacking Stds, 100 μL (of 10% dilutions) of CBP and CPK ACN extracts at 0, 8 and 24 h samples were first analyzed by HPLC and re-analyzed by LC-MS (see Appendices and Serrano et al., 2018).
Chemical evaporation studies
Experiments were done to assess the potential chemical loss of CBP, DPK, CPK and the putative metabolites CPKOH and BADPK (boiling points: 261, 305, 287, 300 and 312°C, respectively) due to evaporation at room and exposure temperatures. Briefly, media spiked with these chemicals at −4.3 and −3.3 log M (50 and 500 μM) was incubated in wells at 11, 25 and 37°C. Samples were collected at T=0 (20 min) and 24 h and analyzed by GC-MS to compare chemical recovery at each temperature. In absence of Stds, a modified approach was applied to assess the effect of incubation temperature on the recovery of CBPOH and CPK metabolites detected after slice incubations. In these experiments, sufficient metabolites were obtained for quantification after parent chemical incubation with slices in multiple wells at 11°C for 6 (CBPOH; bp 254 °C; log Kow 2.87) or 48 h (CPK metabolites; bp 286–313°C), and further combining of samples for each chemical. Combined exposure media contained remaining parent compounds and CBPOH or CPK metabolites. Reference Controls were prepared by taking 450 μL aliquots of combined samples, extracting with 450 μL of hexane and analyzing by GC-MS as previously described, or drying the hexane extract with N2 gas and resuspending in solvent for LC-MS (Serrano et al., 2018). Replicate exposure media samples (450 μL) for each chemical were further incubated without slice at 11, 25 (open vials) and 37°C (capped vials) overnight and analyzed by GC-MS and LC-MS as done for the Reference Controls. Evaporative loss of individual metabolites was estimated by comparing overnight incubation recoveries to those calculated for Reference Controls.
Data analyses
GraphPad Prism for Windows (V5.02; GraphPad software, San Diego, CA) was used for curve plotting. Data were reported as the mean ± standard deviation (SD). Enhanced MSD Chemstation (E-MSDChem for Windows; Rev E.02.01.1177, Agilent Technologies, Santa Clara, CA, USA) was used for data acquisition, peak integration and S/N determination, external standard curve generation, parent chemical and standard concentration calculation in TEDG, binding cytosol, or slice exposure media and for statistical analyses. Response factors (RF) were used for both quantitative and semi-quantitative approaches. Specifically, RF-based linear regressions were used for all quantitative measurements. Precision and accuracy of analytical methods were evaluated by replicate analysis of chemicals and metabolites at test concentrations. Precision was reported as SD or percentage relative SD (%RSD). Accuracy was determined by assessing the % difference between nominal and measured chemical concentrations. Intra-day variability was measured by analysis of at least three Std replicate samples of three different concentrations at beginning and end of day. Inter-day reproducibility was assessed by measuring these samples every day for the duration of experiment. LOD for GC-MS analyses, was established as the analyte concentration corresponding to a S/N ratio method in E-MSDChem of at least 3:1. LLOQ was measured at a S/N of at least 10:1 for each chemical. Limit of Reporting (LOR) was obtained with check Stds that were within 40% of lowest calibration Std that could be quantified with S/N>10 as described by EPA method 8270D (rev2010).
Parent chemicals and metabolite detection and quantification by GC-MS was done where Stds were available. In addition, structure elucidation studies by LC-MS and LC-ToF-MS techniques were performed to identify metabolites in binding cytosol or slice exposures for which Stds were not available (Serrano et al., 2018). Amounts of CBP, DPK, BADPK, OHDPK, CPK, CPKOH, opCPK and p-cresol were measured with Stds by selected ion quantification from full scan total ion current (TIC) data and RF as follows: m/z 105 for CBP/DPK/CPK/OHDPK, m/z 107 for BADPK/CPKOH/p-cresol and m/z 137 for opCPK. Full scan TIC provided sufficient sensitivity as well as more qualitative information than selected ion monitoring (SIM) for assessment of parent chemicals and all metabolites investigated. Full scan analysis was used also because most cyclic phenones and metabolites tested share the same main fragmentation ions. Because of the lack of Stds for absolute quantification, the amounts of CBPOH and CPK metabolites detected after slice exposures were determined using semi-quantitative approaches that correlated either: a) selected ion quantification from full scan and RF for CBP/CBPOH (m/z 105 and 107, respectively) or, b) full scan TIC peak area and RF for CPK and CPK metabolites (Footnote 1). CBPOH and CPK metabolite relative amounts were reported only if both of the following conditions were met: 1) clearly distinct peaks were observed and, 2) S/N determined from E-MSDChem was > 5. Mass balance calculations and corresponding plots for parent chemicals were also generated from either selected ion quantification- (DPK, CBP), or TIC area- (CPK) data. Mass balance for CBP, DPK and CPK in cytosol was calculated by comparing the total amount of parent chemicals and metabolites at 0 and 20 h exposures (Footnote 2). Mass balance for CBP, DPK and CPK in exposure media was calculated by comparing the amount of parent chemicals and metabolite amounts measured in presence of slices to corresponding parent chemical quantities measured in absence of slices at each exposure time (Footnote 3). For all analytes, a linear relationship (correlation coefficient >0.999) was obtained between response and concentration over the calibration range selected (0.9–200 μM) using IStd. Experimental approaches showed excellent precision and accuracy. Intra- and inter-day variability/reproducibility were <3% for all tests. LOR, LLOQ and LOD and were 0.55, 1.10 and 0.33 nmole/mL, respectively.
Results
Analytical recoveries of chemicals from TEDG and exposure media
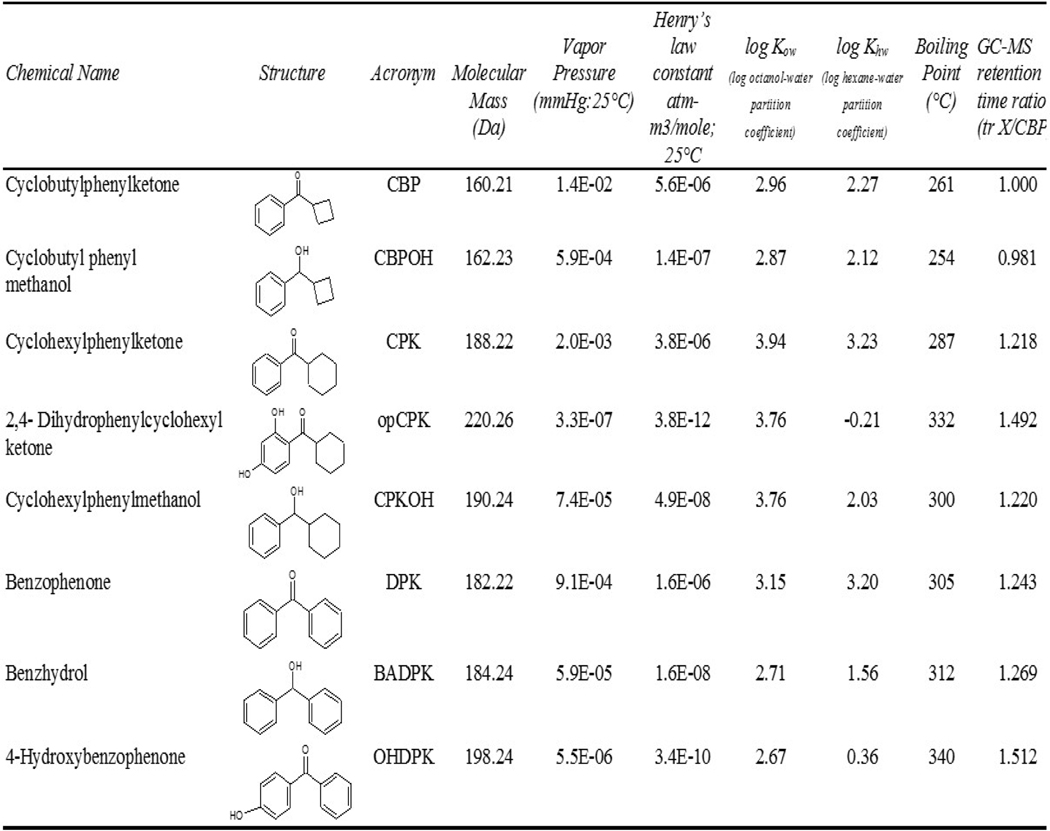
Chemical names, structures, abbreviations used in the manuscript and calculated physical-chemical parameters of parent chemicals and hypothesized metabolites tested in this study are listed in Table 1. Analyses of chemicals in rtER binding assay exposure buffer and the liver slice exposure media were done using hexane extractions with GC-MS separation and detection. Hexane extraction efficiencies in TEDG buffer and slice media that were achieved by adding Stds at various concentrations are shown in Table 2. Results showed high recovery values (>90%) for DPK, CPK and all putative metabolites from both TEDG buffer used in ER binding cytosol preparations and exposure media used in liver slice experiments over a broad range of chemical concentrations. A lower but consistent recovery was obtained for CBP (83 and 82% from TEDG and slice media, respectively), most likely due to the higher evaporation potential of this chemical at room temperature (vapor pressure= 1.4X10⁻² mm Hg). The buffer and media aqueous phases were also analyzed for water soluble metabolites by HPLC, showing no evidence of parent chemicals or putative metabolites.
Table 1.
Chemical names, structures, acronyms, physical-chemical properties and experimental GC-MS retention time ratios (tR) of parent cyclic phenones, and hypothesized metabolites (as compared to CBP) used for analytical standards, recovery tests, pilot studies or metabolism assays. Properties were calculated using EPIWEBv4.1 except for log hexane:water partitioning coefficient calculated using SPARC (ARChem), and GC-MS tR determined in this study.
|
Table 2.
Hexane (Hex) extraction efficiencies (%) for Stds of parent chemicals and putative metabolites added to TEDG buffer used in cyto rtER binding assays or slice exposure media used for Vitellogenin (Vtg) mRNA induction assays (25°C). Data are Mean ± SD from 6 to 14 experiments. The concentration ranges of added Stds are displayed.
| Chemical | Recovery in Hex from TEDG buffer (%) | SD | Concentration Range Tested (μM) (M) | N | Recovery in Hex from Exposure media (%) | SD | Concentration Range Tested (μM) |
|---|---|---|---|---|---|---|---|
| CBP | 83.1 | 0.72 | 75–1000 | 10 | 81.5 | 0.93 | 1–500 |
| CPK | 97.2 | 0.95 | 2.5–1000 | 14 | 100.6 | 0.25 | 1–300 |
| opCPK | 92.6 | 1.01 | 5–100 | 6 | 95.2 | 0.91 | 1–100 |
| CPKOH | 90.3 | 0.43 | 2.5–50 | 10 | 92.1 | 0.81 | 1–100 |
| DPK | 98.5 | 0.92 | 100–1000 | 6 | 100.3 | 1.20 | 1–300 |
| BADPK | 95.6 | 0.74 | 10–200 | 6 | 99.7 | 1.13 | 1–100 |
| OHDPK | 94.4 | 0.94 | 5–100 | 6 | 95.8 | 0.68 | 1–100 |
Thermal sensitivity of cyclic phenones
Chemicals showing higher potential for thermal instability include alcohols, aldehydes, furans, ketones, pyrroles and terpenes (Mills and Walker, 2001). Our experiments showed no evidence of thermal degradation for any parent chemical or metabolite analyzed. Chemical volatility assessments in exposure media at test concentrations indicated that neither DPK or BADPK were affected by evaporative loss at 11, 25 or 37°C, a result consistent with their lower calculated vapor pressure at 25°C (~10−5 mm Hg). Results showed that CPKOH (vapor pressure= 10−5 mm Hg) was recovered at 25°C in TEDG, but evaporated at 37°C, suggesting a potential for loss in conjugate hydrolysis experiments. However, CPKOH was not detected in cytosol (4°C), or slice exposures experiments (11°C). Conversely, significant evaporative loss (>20% by 48h) was observed for CBP and CPK in slice media at both 11 and 37°C consistent with their relatively higher vapor pressure (10−2 and 10−3 mm Hg, respectively). Evaporative loss of CBP and CPK was supported by measured chemical in condensates on exposure well covers and chemical concentrations decreasing in media over 48 h even in the absence of slice. Quantitative amounts for CBP and CPK on well covers could not be accurately determined due to variability, but ranged from 10–45 nmoles. Evaporative loss was confirmed for CBPOH (vapor pressure =10−4 mm Hg) by detection on well covers at 11, 25 and 37°C, but not for any of the metabolites M1-M9 (vapor pressure between 10−510−10 mm Hg). CBPOH has the lowest calculated boiling point among test cyclic phenones, a seemingly more influential factor than vapor pressure to explain its significant evaporation (>15% by 48 h) in exposure media. Attempts to minimize chemical evaporation in wells by the use of semi-permeable membranes, rigorous temperature control in incubators and alternative approaches (e.g. closed containers) was unsuccessful.
Cyclic phenone and alcohol metabolites measurement in ER binding assay cytosols
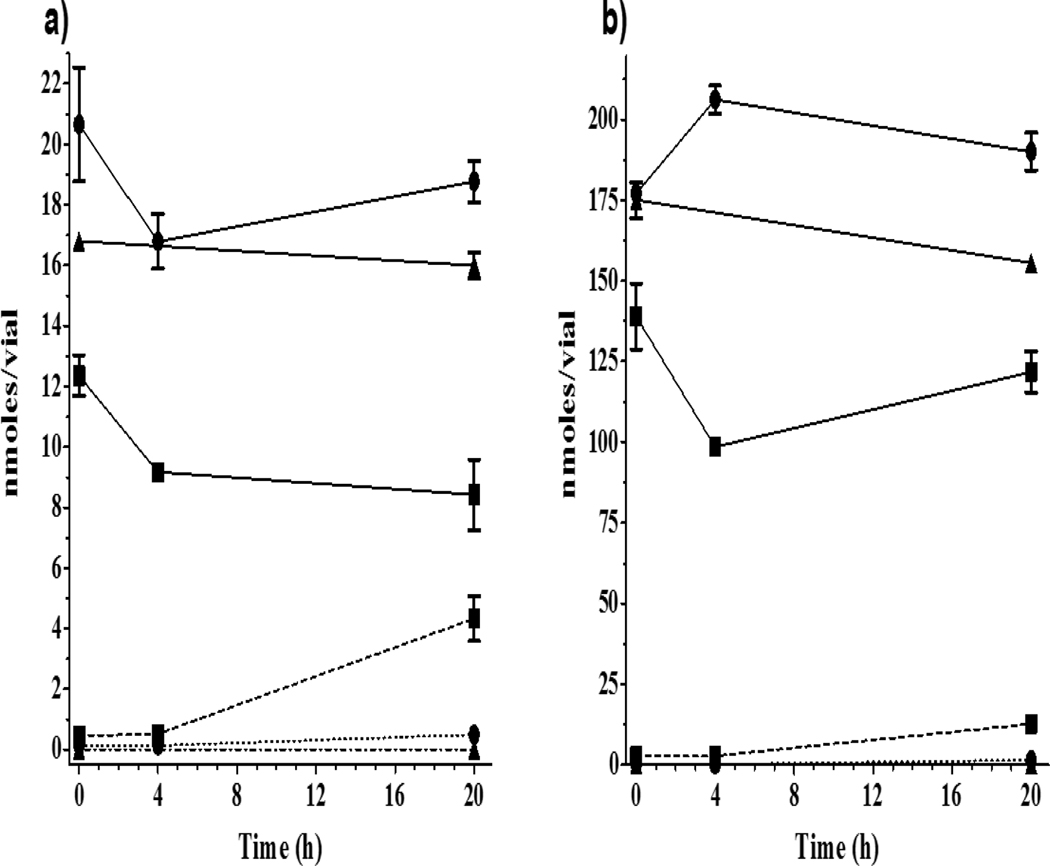
Conversion of CBP, DPK and CPK to alcohol metabolites in trout liver cytosol preparations used in rtER binding assays in 0, 4, and 20 h (4°C) samples from 100 μM (20 nmole/vial) and 1000 μM (200 nmole/vial) exposures are summarized in Figure 1a,b and Supplemental Table 2. Consistent with a greater loss of CBP than DPK or CPK noted in TEDG buffer, there was an appreciably less CBP amount measured in the liver cell cytosolic fractions at 0 h (~20 min) in both the 20 and 200 nmole exposures with only 64±3.6% and 69+2.1%, respectively of the nominal CBP found. In contrast, the 0 h amounts of DPK measured were 103±9.4% and 89±1.4% in 20 and 200 nmole exposures, while CPK was 84±1.4% and 88±2.8% of the nominal, respectively.
Figure 1.
Time course of CBP, DPK and CPK loss and appearance of respective alcohol metabolites CBPOH, BADPK and CPKOH in rt binding cytosols exposed for 20 h (4°C) to 20 nmole (−4 log M; 100μM) or 200 nmole (−3 log M;1000μM) of the chemical per vial. Results are displayed in nmole/vial of parent and metabolite in a) 20 nmole exposure, and b) 200 nmole exposures. In absence of a Std, CBPOH measurements were semi-quantitative. Symbols represent the mean ± SD of two technical replicates from a single experiment. Symbols: CBP (∎, solid line), CBPOH (∎, dashed line); DPK (●, solid line), BADPK (●, dotted line); CPK (▲, solid line), CPKOH (▲, dash-dot line).
The only metabolites detected in liver cytosols were CBPOH and BADPK with no measurable CPKOH found at any time. Both CBPOH and BADPK (0.45 and 0.1 nmole/vial, respectively) were detectable in the 0 h low exposure sample, while CBPOH (2.6 nmole/vial) was the only alcohol metabolite detected in any of the 0 h high exposure samples. There was only a slight increase in the amount of CBPOH detected from 0 to 4 h in both exposures, however, by 20 h the measured CBPOH had increased by 10X to 4.3 nmole/vial (~32% of the 0h CBP+CBPOH nmole/vial amounts; Figure 1a). The maximum amount of CBPOH produced was 12.6 nmole/vial found at 20 h in the high exposure, but it only represented 9% of 20 h CBP + CBPOH nmoles/vial amounts (Figure 1b). The amounts per vial of BADPK found at 20 h in low and high exposures were much smaller representing only 2.5 and 0.7% respectively, of the initial 20 and 200 nmole/vial DPK exposures (Figure 1a,b).
A mass balance was calculated comparing the measured nmoles at 20 h of (parent chemical + alcohol metabolite) to the 0 h parent chemical resulting in 93–108% mass recovery in all three chemical exposures. Examination of aqueous fractions of cytosol preparations by HPLC showed no evidence of parent chemicals or any metabolites. Overall, the data suggested that: 1) oxidoreductase-mediated alcohol formation is a preferred metabolic pathway in liver cell cytosols used in ER binding assay for CBP and DPK but not for CPK; and 2) CBP constitutes a much better substrate than DPK or CPK for cytosolic enzymes, averaging 13-fold more conversion into the corresponding alcohol than DPK.
Cyclic phenones and metabolites measurement in trout liver slices and exposure media
The uptake of chemicals into liver slices, Phase I (unconjugated) and Phase II (conjugated) metabolites formed in slices, and the appearance of metabolites in the exposure media were measured in trout liver slice exposures over 48 h at 11°C. Differences in parent chemical media concentrations measured in the presence and absence of rt liver slices at each exposure time were used as an indicator of the relative extent of CBP, DPK and CPK biotransformation.
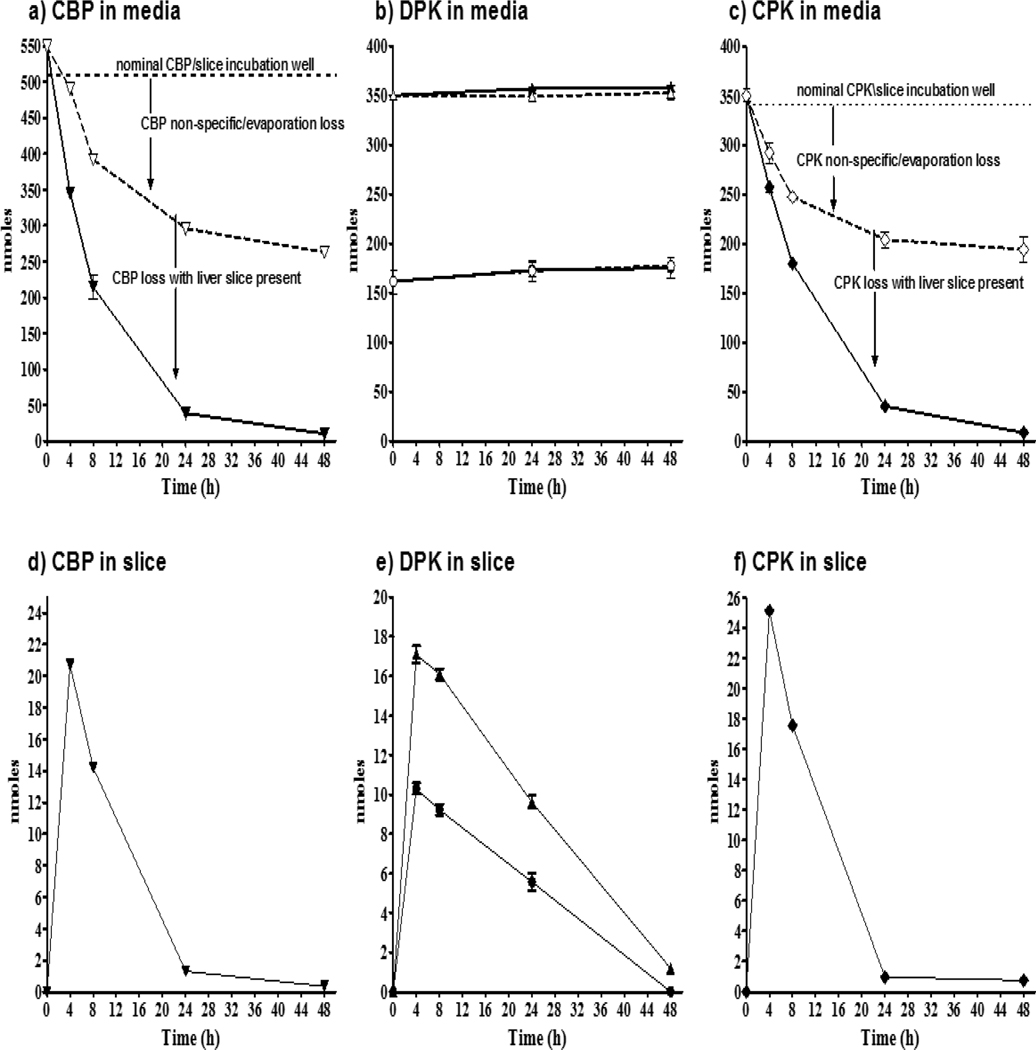
The amounts of both CBP and CPK in exposure media without slice dropped rapidly through 8 h, then at a slower rate through 48 h (Figure 2a,c). For example, the 510 nmole/well nominal CBP exposure started at 550± 9.4 nmole/well, then dropped to 491±1.2 nmole/well CBP in exposure media without a slice at 4 h, declined further to 392+3.3 (or 77% of initial) at 8 h, and to 58% (296+0.3 nmole/well) at 24 h, with only a slight further decrease to 263+7.2 nmole/well (or 52% of initial) by 48 h (Figure 2a). The lower initial 350 nmole/well CPK exposure without slice declined from 348±5 nmole/well CPK at 0 h to 292±9.3 at 4 h, then similar to CBP continued to decline to ~ 50% (188±9.1 nmole/well CPK of the initial value by 48 h (Figure 2c). Losses of both chemicals were likely due to chemical evaporation and non-specific binding.
Figure 2.
Cyclic phenone amounts (nmole/well) measured in slice exposure media with/without slices (top panels), and chemical uptake in trout liver slices (bottom panels). Top panel: amounts of CBP (a), DPK (b), and CPK (c) in media when a liver slice is absent (open symbols) and when a slice is present (filled symbols). The initial nominal media concentration (dashed lines) for CBP was −3.53 log M (300μM), equivalent to 510 nmole/exposure well. DPK was tested at two concentrations (−3.7 and −4 log M; 200 and 100μM respectively) equivalent to 340 and 170 nmole/well respectively. CPK was tested at −3.7 log M (200μM). Bottom panel: CBP (d), DPK (e) and CPK (f) intraslice amounts were measured as nmoles/well with one slice/well.
When a slice was present in the exposure, the decline in the corresponding amount of both CBP and CPK in media was at a much greater rate and to a much greater extent than without a slice. Both CBP and CPK dropped to ~40% at 8 h, then to <10% remaining by 24 h, and to very low but detectable 10±1.4 and 5±0.6 nmole/well, respectively, at 48 h. In contrast, the amount of DPK in media did not measurably change during the 48 h exposures for either the 170 or 340 nmole/well (100 and 200 μM, respectively) exposures, regardless of whether a liver slice was present or absent (Figure 2b).
All three chemicals showed similar uptake into liver slices (Figure 2d,e,f), reaching between 17–25 nmole/well by the earliest time point measured. The slice CBP and CPK amounts both declined rapidly at 24 h to ~1 nmole/well. However, the decrease in the intra-slice amount of DPK was more gradual for both the 340 and 170 nmole exposures with about 60% present at 24 h, then declining to near total excretion into media by 48 h (Figure 2e). The constant amount of DPK in media with or without slice (Figure 2b), and the slower decrease in DPK within the slice (Figure 2e), compared to greater changes in amounts of CBP (Figure 2a,d) and CPK (Figure 2c,f) in media and slices, indicated that both CBP and CPK are likely metabolized by trout liver to a greater extent than DPK. Further studies were performed to confirm these indirect indications.
DPK metabolism
Consistent with the amount of DPK (nmole/vial) measured in ER binding cytosols (Figure 1a,b) and in slice exposures (Figure 2b,e), there appeared to be a small amount (<2 nmole/slice) BADPK accumulated in slices, and less than 7 nmoles/slice detected in media with slice by 48h. There were no glucuronide or sulfate conjugates found for BADPK, and no other DPK metabolites were detected over the duration of the experiment. Thus, the conservation of the initial DPK throughout the exposure (Figure 2b) was consistent with the lack of substantial measurable metabolic conversion of DPK.
CBP metabolism
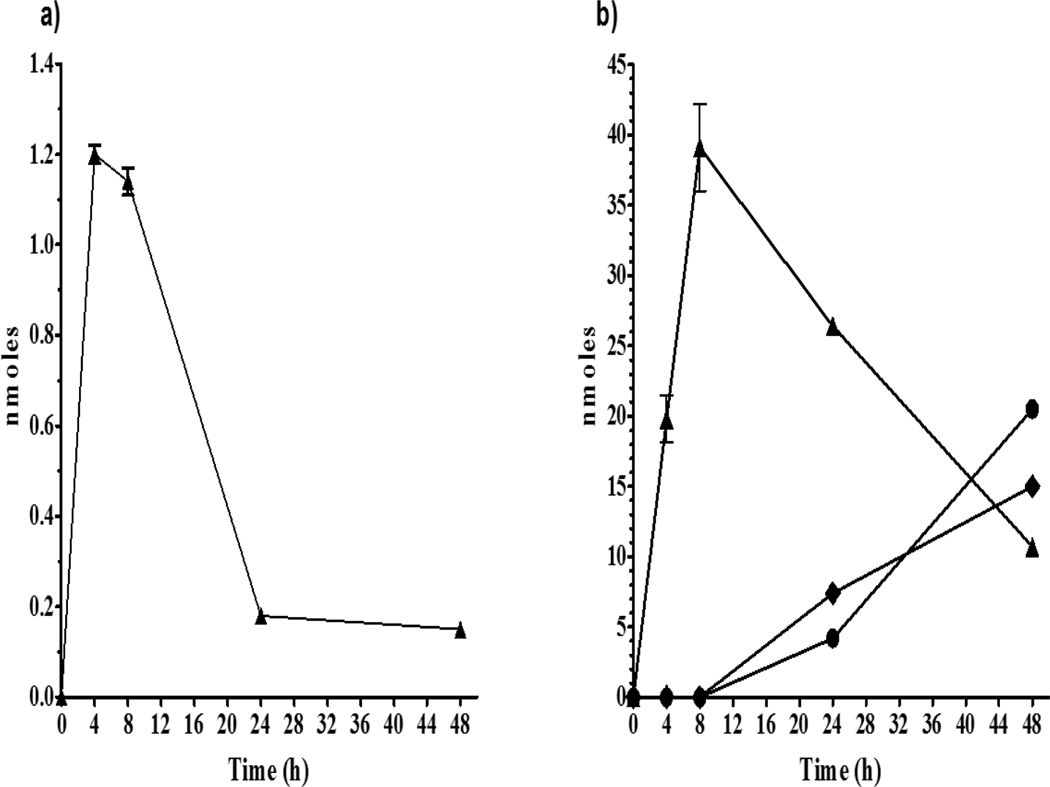
The only metabolite detected during slice exposures to CBP was CBPOH, the metabolite that was also found in ER binding cytosols (Figure 1). To better assess the metabolism of CBP, exposure media and slices were analyzed for amounts of CBPOH and conjugates (Figure 3). In the liver slice CBPOH was > 1 nmole/slice at 4 and 8 h, followed by ~85% decline in intra-slice CBPOH by 24 h. In media, 20 nmoles/well CBPOH were detected by 4 h, with a maximum 39 nmoles/well CBPOH measured at 8 h and declining by 75% at 48 h. Sulfate and glucuronide conjugates of CBPOH were detected in media at 24h and 48h, but not in the slice above LOD. As might be expected due to the greater affinity but lower capacity of sulfation reactions compared to the lower affinity but higher capacity of glucuronosyl transferases, the amount of CBPO-Sulfate measured was > CBPO-Glucuronide at 24 h in media (7 and 5 nmoles/well, respectively), but < CBPO-Glucuronide by 48 h (21 and 15 nmoles/well, respectively). Although the slice decline in CBPOH after 8 h is consistent with an increase in Phase II metabolism, much smaller amounts of CBPOH-conjugates than expected were found in slice and media samples after enzymatic hydrolysis to cleave conjugates. This is likely due to extensive loss of CBPOH by evaporation at 37°C, making it difficult to quantify this metabolite after recovery.
Figure 3.
Amounts (nmole/well) of liver slice CBPOH and CBPOH and conjugates measured in slice media upon exposure to −3.53 log M (300μM) CBP equivalent to 510 nmole/well of the chemical for 48h at 11°C; a) Intraslice CBPOH (one slice/well), and, b) CBPOH (▲), CBPO-Sulfate (◆), and CBPO-Glucuronide (●) in exposure media (1.7 mL /well). Glucuronide and sulfate metabolites conjugation results were plotted as the mathematical difference between amounts of unconjugated and conjugated metabolites quantified at each exposure time. Symbols represent the Mean ± SD of two technical replicates from a single experiment, with all slices obtained from one fish.
CPK metabolism
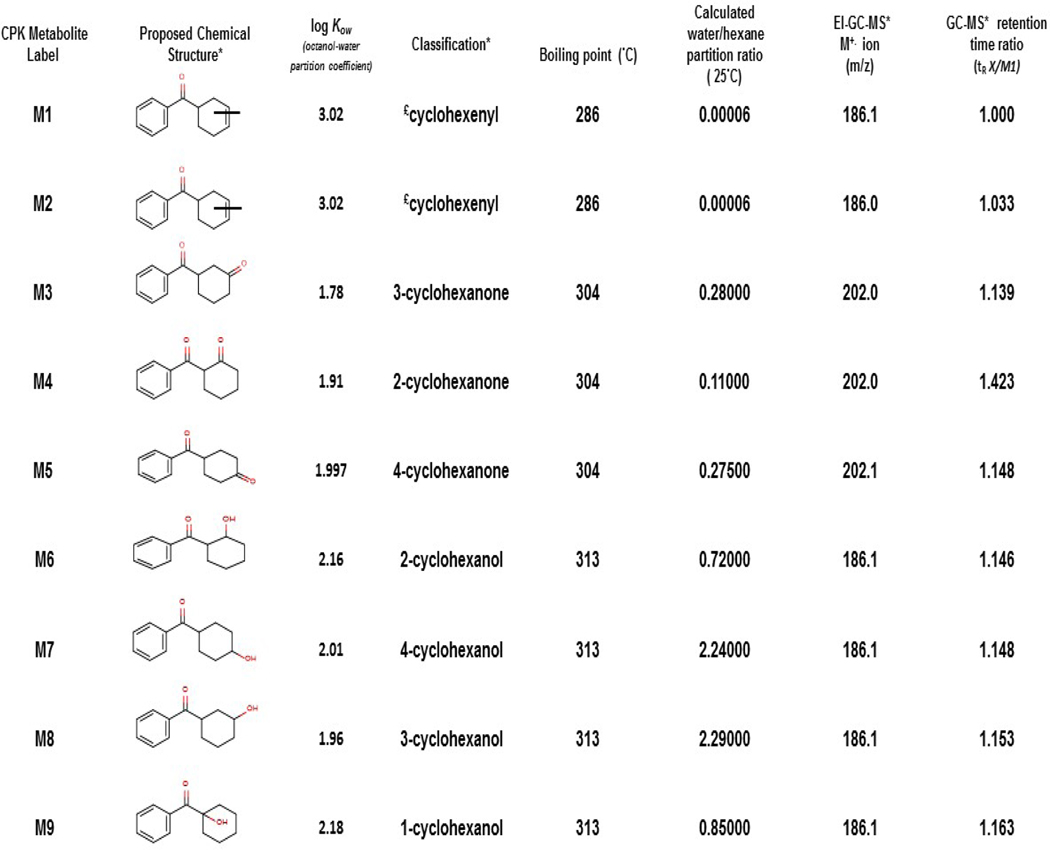
Efforts were made to search for metabolites of CPK in trout liver slice exposures. Despite the lack of metabolites detected for CPK in binding cytosols, the rapid decline in the amount of CPK/well in the presence of slices (Figure 2c), and the slice Vtg induction noted by Tapper et al. (2018b), indicated that metabolites were likely present. In fact, CPK yielded over 13 potential metabolites by 4 h of slice exposures, with none identified as CPKOH or opCPK for which Stds were available. Therefore, additional methods were necessary to identify CPK metabolite structures as reported at length in Serrano et al., (2018). Nine of 13 possible metabolic products (labeled CPK M1-M9; cyclohexenyl-, cyclohexanone- and cyclohexanol-derivatives of CPK), could be readily characterized and measured in slice media above LOD. The low abundance of the other products prevented further characterization. The labels, structures, general classification and physical/experimental properties for the CPK metabolites identified in slice exposures are summarized in Table 3. Surprisingly, structural evidence supported an apparent preference for metabolic modification of the cyclohexyl ring for all CPK metabolites identified instead of a phenyl ring modification as predicted by metabolism models (Kolanczyk et al., 2012). Furthermore, chemical derivatization with silylation reagents supported that M6-M9 contained a hydroxyl group. As previously stated, there were no Stds available for M1-M9, therefore it was not possible to directly quantify their concentrations in the slice or media. Thus, alternative strategies for semi-quantitation of M1-M9 in hexane extracts were applied (see Data analysis). Additional efforts were performed to measure the potential appearance of hydrophilic metabolites in aqueous fractions (see Appendices). No evidence of any parent chemicals or metabolites was found in aqueous fractions of media or slice lysate analyzed by HPLC or LC-MS.
Table 3.
Label, structures, classification and physical/experimental properties for metabolites resulting from the biotransformation of CPK by rt liver slices in exposure media at 11°C. Properties were calculated using EPI WEBv4.1 except for water:hexane partitioning ratios (SPARC; ARChem), log Kow values (SciFinder) and GC-MS molecular ions and retention time ratios. Structural isomers are M1 and M2, M3-M5 and M6-M9. Data was reproduced from Serrano et al., 2018.
|
unknown unsaturation position
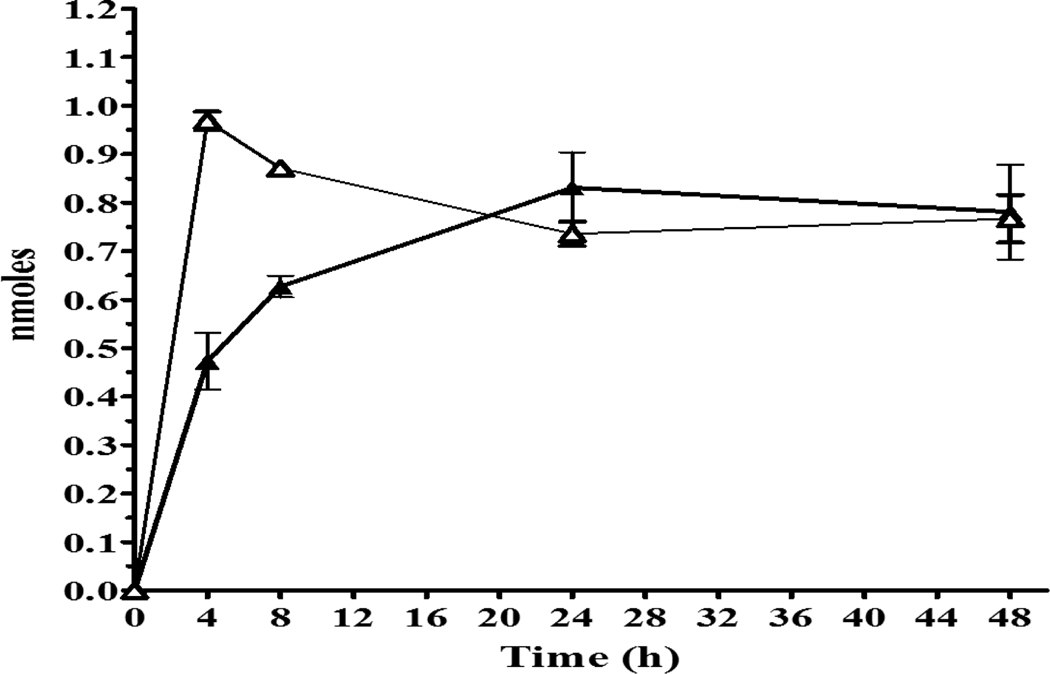
In slices, all CPK metabolites showed distinct peaks, but S/N was < 3 resulting in calculated amounts below LOD. However, it was possible to quantify CPK metabolites M1-M9 and their Phase II sulfate and glucuronide conjugates in exposure media. The metabolites M1 and M2 measured in media are shown in Figure 4. Small but detectable quantities (0.46 and 0.98 nmole/well, respectively) of each metabolite were seen by 4h, with M2 amounts staying fairly constant through 48 h while M1 increased to levels equal to M2 at 24 and 48 h. Although proposed as cyclohexenyl-derivatives of CPK, these metabolites were not detected by LC-MS and could not be fractionated for further high-resolution mass analyses. Thus, GC-MS data alone could not be used to distinguish between the 1- or 2-cyclohexenyl phenyl ketone structures. Phase II products of M1 and M2 were not detected at any sample time, an observation consistent with the structure of CPK cyclohexenyl-isomers lacking an active site for conjugation.
Figure 4.
Appearance of CPK cyclohexenyl-derivative metabolites M1 (▲) and M2 (△) in media following rt liver slice exposure to −3.7 log M (200 μM) CPK equivalent to 340 nmole/well of the chemical for 48 h at 11°C.
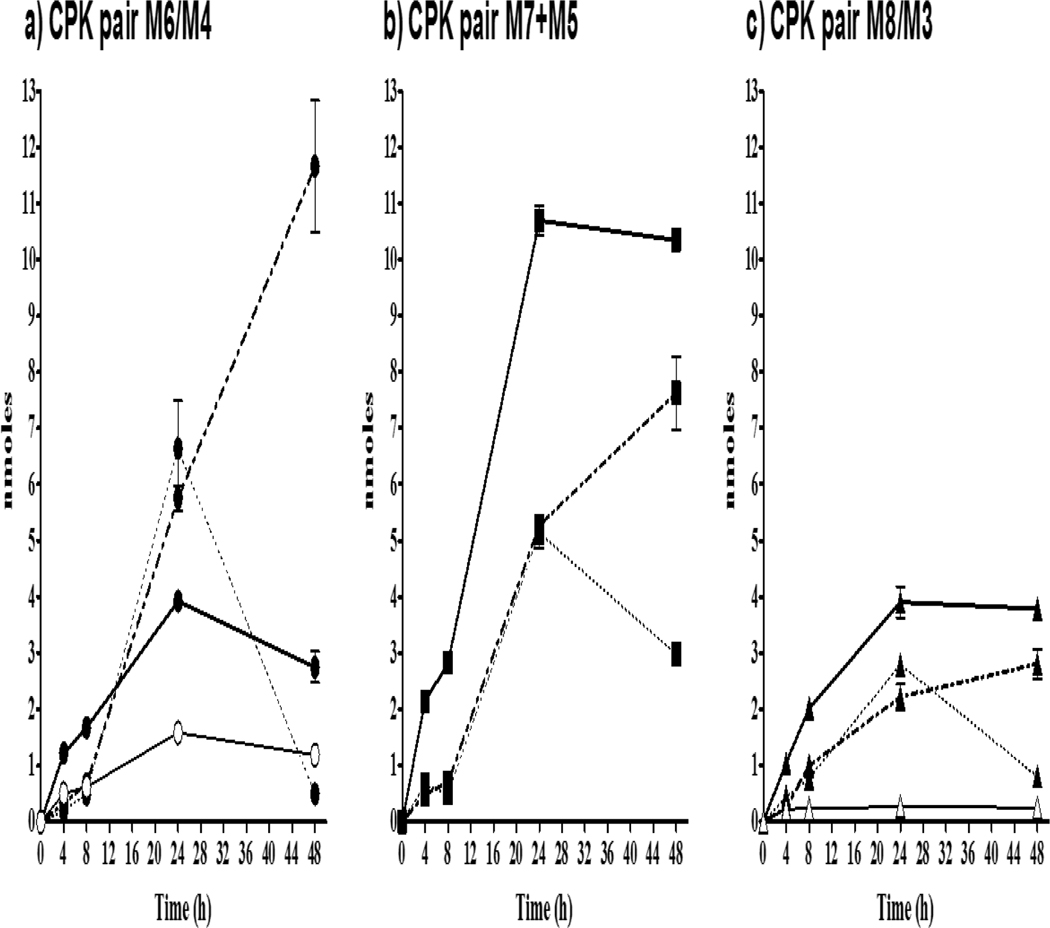
Supporting structure identification studies confirmed that M6, M7 and M8 were hydroxylated metabolites of CPK (cyclohexanol-derivatives), capable of oxidizing under experimental conditions to small amounts of their cyclohexanone-pair products M4, M5, and M3, respectively. Metabolite stability was sufficient to allow isolation of both the cyclohexanone- and cyclohexanol-derivatives for relative quantification. The GC-MS analyses of slice exposure samples performed prior to metabolite identification studies showed a distinct peak at 18.16 min (tR X/M1=1.148; Table 3) suspected to be a CPK metabolite. Further optimization of analytical methods and use of LC-TOF-MS resulted in the characterization of this peak as two additional metabolites forming the CPK redox pair labeled M5 and M7 (4-cyclohexanone- and 4-cyclohexanol-derivatives respectively). However, because additional samples were not available for re-analysis and semi-quantification, the relative amounts of M5 and M7 were reported as the sum of both products (M5+M7). For the remaining pairs M6/M4 and M8/M3, the amount of each product was measured, as well as any sulfate and glucuronide conjugates of the hydroxyl- forms of the metabolites.
Amounts of individual metabolites in CPK redox pairs M6/M4 and M8/M3 and the combined pair M7+M5, along with conjugates of M6, M8 and M7 (identified as CPK 2-, 3- and 4-cyclohexanol-derivatives, respectively), are shown in Figure 5. The highest CPK metabolite amount in slice exposure media was found for M7, although reported as the combined M7+M5 (Figure 5b), with >10 nmole/well. The M7-Sulfate was detectable at ~0.5 nmole/well at 4 and 8 h, increased to a maximum of 5 nmole/well at 24 h and dropped to 3 nmole/well by 48 h. The amount of M7-Glucuronide matched that of M7-Sulfate at 24h, then increased to 7.6 nmole/well at 48 h.
Figure 5.
CPK metabolites measured in exposure media following rt liver slice exposure to −3.7 log M (200μM) CPK, equivalent to 340 nmole/well of the chemical for 48 h at 11°C. a) M6 (2-cyclohexanol-derivative; ●, solid line) and M4 (2-cyclohexanone-derivative; ○, solid line) plus M6-Sulfate (●, dotted line) and M6-Glucuronide (●, dash-dot line); b) combined M7+M5 (4-cyclohexanol-/4-cyclohexanone-derivatives; ■, solid line), M7-Sulfate (■, dotted line), and M7-Glucuronide ■, dash-dot line); and, c) M8 (3-cyclohexanol-derivative; ▲, solid line) and M3 (3-cyclohexanone-derivative; △, solid line), plus M8-Sulfate (▲, dotted line), and M8-Glucuronide (▲, dash-dot line).
Similar maximum amounts of M6 (2-OH-) and M8 (3-OH-) of ~4nmole/well were detected. Also, although more of the M4 (2-C=O) redox partner of M6 was found than the respective M3 (3-C=O) partner of M8, the summing of M6 and M4 resulted in a maximum amount/well that was less than half of the M7+M5 (4-OH/4-C=O) pair measured at both 24 and 48 h. Further, while the amounts/well of M6 and M8 are similar throughout the exposure, there is an appreciable difference in their conjugates, with M6-Sulfate and M6-Glucuronide of ~7 nmole/well found in media at 24 h and M6-Glucuronide increasing to ~12.7 nmole/well by 48 h while production of the sulfates ended. Across all these CPK metabolites that are being formed simultaneously in the slices it is interesting to note that the rates of glucuronosyl transferases appear highest for the 2-OH-M6 followed by 4-OH-M7 and 3-OH-M8, and that the amounts detected for both M6-Sulfate and M6-Glucuronide are greater than the unconjugated M6 by 24 h.
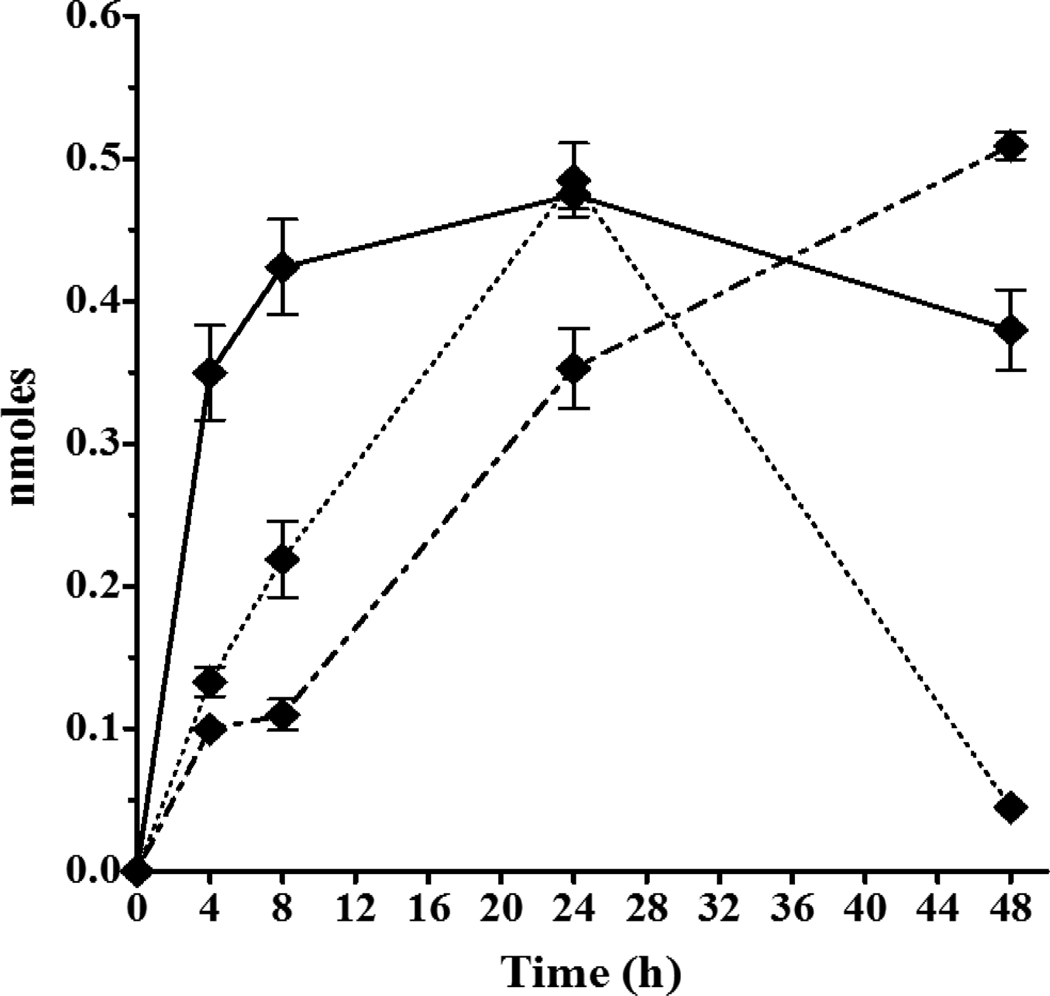
The 1-cyclohexanol-derivative metabolite M9 was also quantified in exposure media at a maximum of < 0.5nmole/well by 24 h (Figure 6), which was only a fraction of the concentration of the other CPK hydroxylated metabolites (M6, M7, M8) and also less than M1 and M2. Conjugates were again found for 1-OH-M9 metabolite with M9-Sulfate increasing to 24 h, and then declining as M9-Glucuronide continued to increase to a maximum of 0.55 nmole/well by 48 h. The lack of redox conversion observed for M9 is consistent with the constrained structure proposed for a 1-OH-CPK metabolite.
Figure 6.
CPK metabolite M9 (1-cyclohexanol-derivative) and conjugates measured in exposure media following rt liver slice exposure to −3.7 log M (200μM) CPK, equivalent to 340 nmole/well of the chemical for 48h at 11°C. Symbols: M9 (◆, solid line), M9-Sulfate (◆, dotted line), M9-Glucuronide (◆, dash-dot line).
Cyclic Phenone Metabolites and Mass Balance
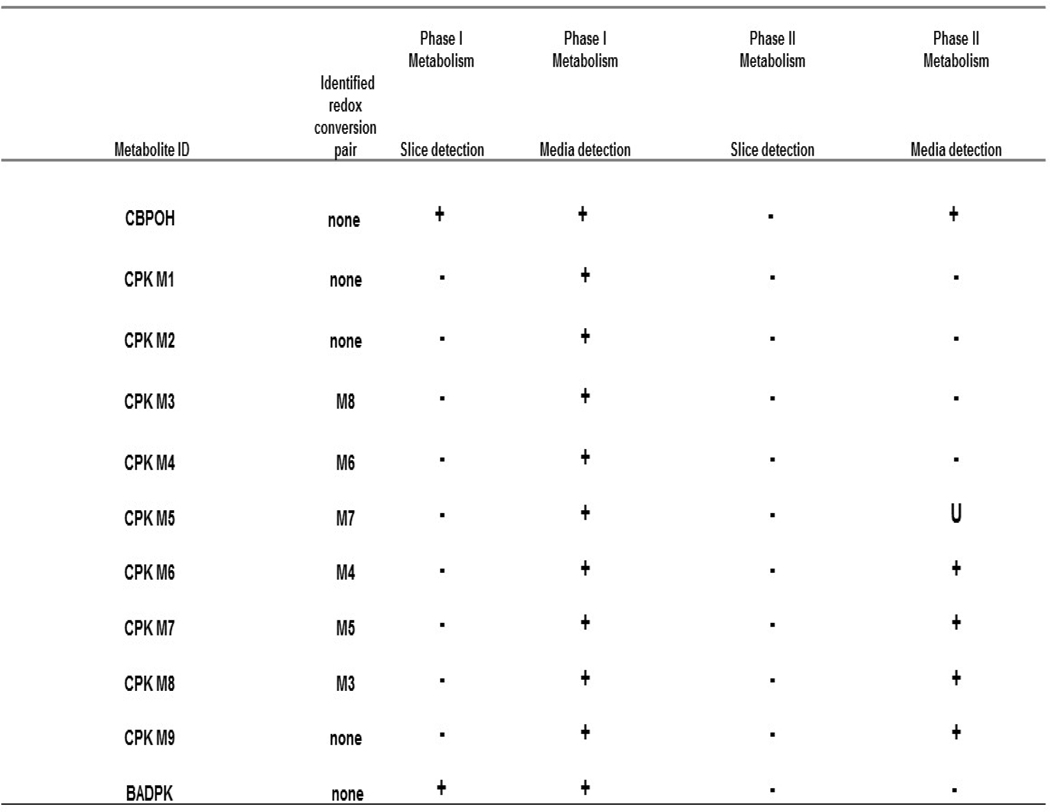
A summary of CBP, DPK and CPK metabolites detected after Phase I metabolism, and specific metabolites undergoing further Phase II conjugation is shown in Table 4. The sample matrix analyzed (slice lysate or exposure media), and CPK metabolite pairs showing evidence of cyclohexanol-cyclohexanone enzymatic redox conversion are presented. Data showed that: 1) all metabolites underwent redox or oxidative Phase I metabolism, but the CBP and DPK alcohol metabolites CBPOH and BADPK were the only metabolites quantifiable in slices; 2) CBPOH conjugates were also found in the media; 3) BADPK showed no evidence of conjugative metabolism, and neither did CPK M1 and CPK M2 metabolites for which it would not be expected and, 4) both sulfation and glucuronidation conjugative pathways were active for CBPOH and all CPK hydroxylated metabolites in trout slices.
Table 4.
Summary of CBP, DPK and CPK metabolites detected in exposure media and/or slice. All metabolites were detected as the unconjugated Phase I metabolite in media. Conjugates were only detected in media. CPK cyclohexanol-cyclohexanone redox conversion pairs are also identified.
|
U=undetermined
CPK and CBP Mass Balance
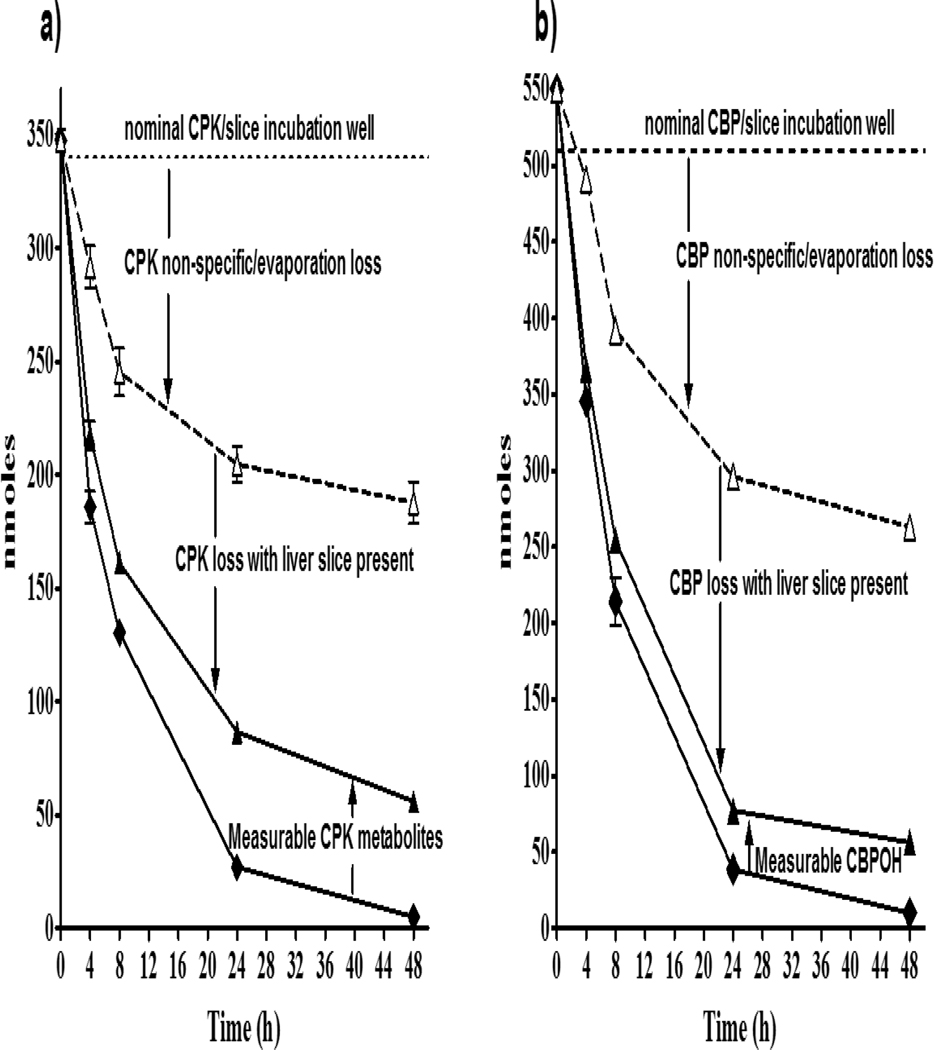
As previously described for DPK, the quantities of CPK metabolites and CBPOH were measured, added to the amounts of CPK and CBP in media with slice and then compared to CPK and CBP measured in media without slices present at each exposure time (Figure 7) to obtain an experimental mass balance. Overall, the combined amounts of parent chemicals and corresponding metabolites in media and slices did not account for a large portion of difference between CBP and CPK with and without a slice in exposure wells. Nevertheless, the existence of such discrepancies in chemical mass recovery was not surprising due to the known volatility of CBP, CPK and the metabolite CBPOH at exposure and enzymatic hydrolysis temperatures needed for recovery of conjugates, and the potential contribution of additional experimental factors (see Discussion section).
Figure 7.
Media CPK and CBP amounts (nmoles/well) in exposures to 340 nmole/well CPK and 510 nmole/well CBP for 48 h (11°C), showing change in concentrations with/wout slice, and with metabolite quantities added to parent with slices present. a) CPK in absence of slice (△), CPK in presence of slice (◆), and CPK + M1-M9 Phase I & II metabolites (▲). b) CBP in absence of slice (△), CBP in presence of slice (◆), and CBP+ CBPOH + CBPO-Sulfate+ CBPO-Glucuronide (▲). Symbols represent the mean ± SD of two technical replicates from a single experiment, with all slices obtained from one fish.
Discussion
A main objective of our previous investigation (Tapper et al., 2018b) was to determine the estrogenic activity of a series of available model cyclic phenones and their hypothesized metabolites using rtER binding and rtER-mediated gene expression in vitro assays. However, conflictive responses between the two assays obtained for the parent chemicals CBP, DPK and CPK suggested that for some of the chemicals the estrogenic response could be due to a metabolite and not the parent chemical structure. The current research was undertaken to characterize the metabolites formed following rt slice-mediated in vitro biotransformation of parent cyclic phenones. This investigation also provided insight into the metabolic competency of these fish liver in vitro tests to assist in determining the chemical concentration and free form (parent and/or metabolite) associated with the observed biological response (ER binding modulation leading to Vtg gene induction). Specifically, information obtained from the competitive rt ER binding, liver slice estrogen-responsive Vtg mRNA, and liver slice metabolism in vitro assays for cyclic phenones was used to determine the identity of chemical species mediating estrogenic activity in fish liver slices and the conjugative potential of metabolic products. The metabolic pathway of CPK was also elucidated using mass spectra profiles obtained with a complementary metabolite identification study. Ultimately, we sought to collect distinctive metabolism-associated mechanistic data needed to enhance understanding of chemical endocrine disruption pathways in aquatic organisms, and to demonstrate the advantage of using metabolically-competent fish liver in vitro tests to help describe toxicant-induced mode of action.
Our studies using cytosol rtER binding and liver slice Vtg mRNA induction assays suggested a lack of CPK binding the rtER, but the potential for a CPK metabolite to bind and induce an ER-mediated Vtg response in rt liver slices. To address this uncertainty, biochemical and high-throughput analytical methods were applied to quantify parent chemicals and metabolism products in ER binding cytosols and rt liver slices. Metabolites were hypothesized and used as Stds where possible, but were lacking for the majority of metabolites encountered particularly for CPK. Data obtained from the rtER cytosolic binding assay and the trout slice Vtg gene expression with metabolically-competent liver slices was used to further understand the role of chemical structure in fish liver estrogenicity. This information is summarized below for the ER binders DPK and CBP and the non-binder CPK:
DPK: confirmed ER binding and Vtg mRNA induction responses were complemented with DPK slice metabolism data showing small conversion into the non-binder metabolite BADPK, absence of additional DPK conversion products and high chemical recovery in both binding cytosol and slice exposure media. Combined ER binding, Vtg induction, and analyses of parent chemicals and metabolites led to the confirmation of DPK as the main species responsible for the ER-mediated Vtg induction in slices, a finding consistent with the suspected estrogenic potential of this chemical. Data indicated that that a minimum of 10.4 and 17.3 nmoles of intra-slice parent DPK are required to induce a measurable biological response by 4 h at 100 and 200 μM exposures respectively, an assessment not possible for CPK or CBP due to the more significant metabolism observed for these chemicals.
-
CPK: Vtg induction observed in liver slices in the absence of CPK ER binding suggested the formation of at least one CPK metabolite capable of binding to the rtER and inducing a biological response. Slice metabolism studies then demonstrated the conversion of CPK into various metabolite structures (cyclohexenyl-, cyclohexanone- and cyclohexanol-derivatives). Further, the primary oxidative pathway for CPK metabolite formation was identified as a mono-oxidation.
To address the uncertainty regarding the estrogenic potential of CPK metabolites formed in slices in comparison to the parent chemical, we relied upon findings reported in other chemical estrogenicity studies. Sievers et al., (2013) reported the preferential estrogenic activity of polycyclic aromatic hydrocarbon (PAHs) metabolites as compared to parent chemicals in human in vitro cell culture models. Similarly, DPK hydroxylated metabolites have shown greater estrogenic activity than the parent chemical in vertebrates (Kunisue et al., 2010). Although ER binding of both hydroxylated- and keto-metabolites in both human and fish in vitro models has been demonstrated (Hornung et al., 2014; Schmieder et al., 2014), the lack of availability of CPK Stds in this study did not allow assessment of rtER binding for CPK metabolite(s), or independent evaluation of their estrogenic potential. Alternatively, we used recently reported 17-beta-estradiol (β-E2; hydroxylated-form) and estrone (E1; ketone-form) estrogenic potency data (Ankley et al., 2017) to estimate the relative rtER binding affinity potential of hydroxylated- and keto- metabolites of CPK in fish slices. Briefly, Ankley’s findings supported the higher estrogenic potency of E2 in comparison to E1 observed in vertebrates and in fish vitro systems, but emphasized the importance of E1 conversion into E2 as the basis for equivalent potential ecological adverse effects. Their observations are also consistent with the higher cyto rtER relative binding affinity values reported for hypothesized hydroxylated CPK and DPK metabolites as detailed by Tapper et al., (2018b). Ultimately, the obtained information was used to predict a greater ER binding affinity potential for the CPK cyclohexanol- metabolites (M6-M9) in comparison with the cyclohexanone-isomers (M3-M5). Conversely, a binding affinity potential assessment for the CPK cyclohexenyl-metabolites (M1 and M2) in comparison with M6-M9 was not possible with the data available. For this purpose, we briefly explored the potential role of CPK metabolite structure when interacting with the ER ligand-binding domain. Molecular recognition studies of dichlorodiphenyltrichloroethane (DDT) analogs by the human alpha and gamma ER (Zhuang et al., 2012), indicated that the only chemical capable of attaching by hydrogen bonding is the ring-hydroxylated p,p’-hydroxy-DDT (HPTE). Because CPK metabolites M6-M9 contain a hydroxylated ring and show a greater ER binding affinity potential than M3-M6, it can be hypothesized that hydrogen bonding is most likely a primary binding mechanism for these metabolites. The opposite argument applies to the metabolites M1 and M2, which lack hydrogen-bonding ring groups. In this case, a weaker or stronger binding might occur through van der Waals forces or by site domain direct interaction with the metabolite aromatic and/or cyclohexenyl groups such as those proposed in aromatic-aromatic stacking (Zhuang et al., 2012), respectively.
Thus, it is hypothesized that all CPK metabolites could potentially bind to the rtER, with preferential binding most likely for the hydroxylated-CPK metabolites M6-M9. Vtg gene induction was observed despite lack of CPK metabolite intra-slice detection at exposure times. Potential explanations include: 1) cumulative binding of small amounts of metabolites below LOD, 2) binding of small amounts of metabolite(s) showing higher affinity for the ER receptor and, 3) loss of metabolites during slice analytical processing.
CBP showed weaker ER binding than DPK, but significant Vtg mRNA induction that could be attributed to either CBP or CBP and any metabolite(s). Data showed that as for DPK, the CBP alcohol metabolite (CBPOH) was the only conversion product detected in cytosol and slices. The existence of similar phase II conjugative pathways was demonstrated for CBPOH and CPK hydroxylated metabolites, but not for BADPK. Elucidation of the chemical form leading to potential estrogenicity between CBP and CBPOH was prevented by metabolite Std availability, but binding studies using a recombinant rtER (in absence of metabolic machinery) confirmed CBP affinity for the ER (Tapper et al., 2018b).
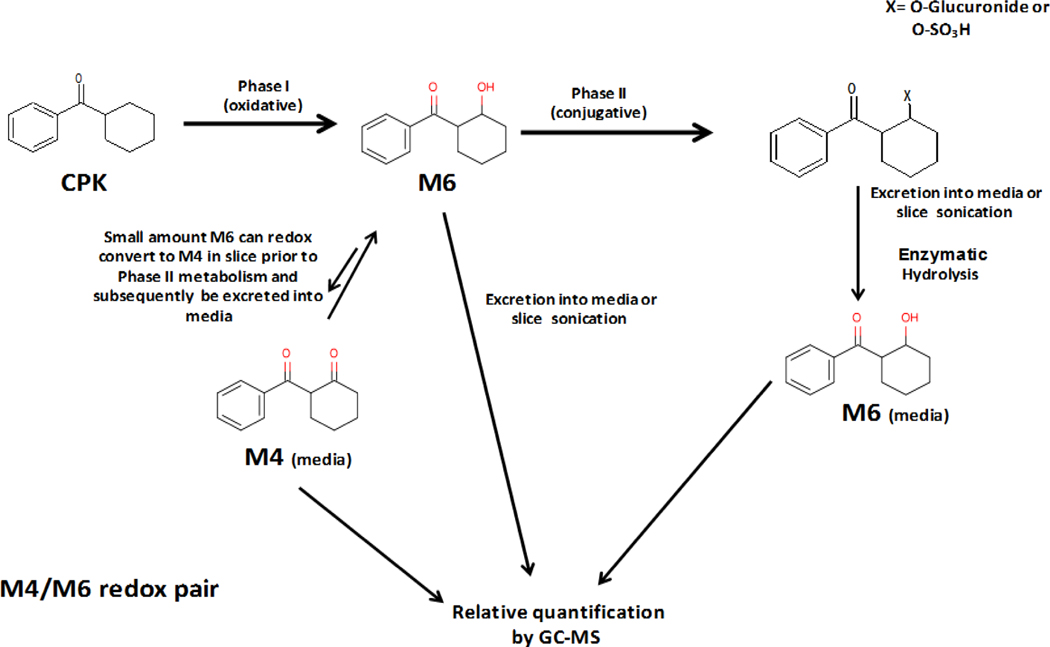
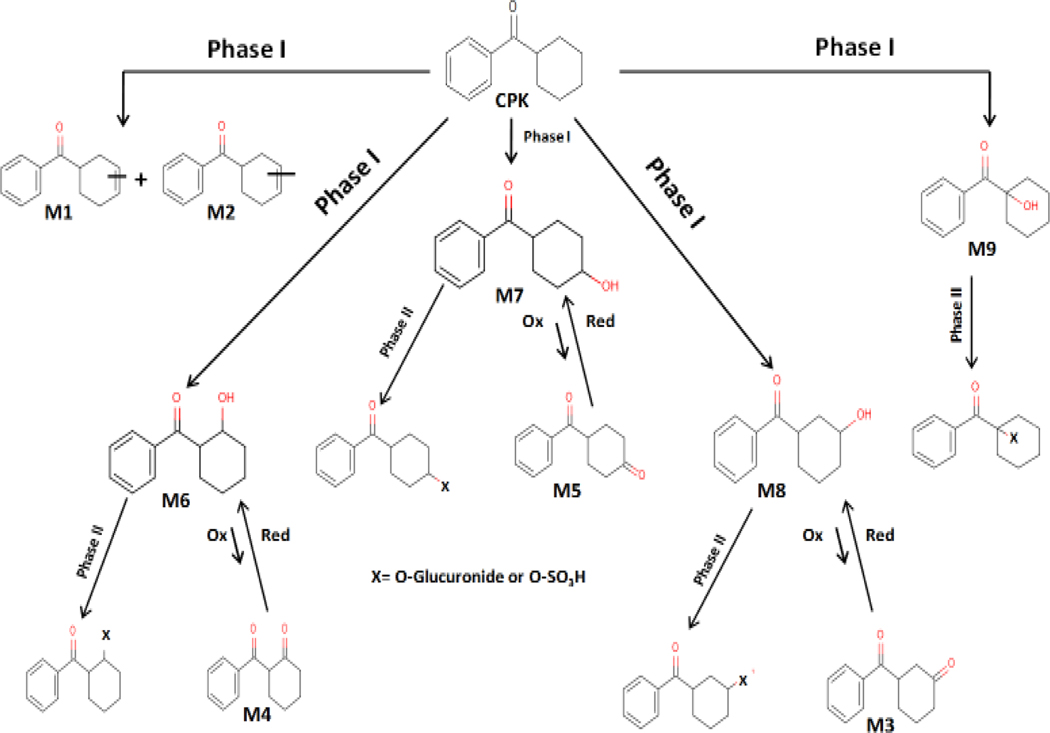
A scheme illustrating the formation of CPK metabolites capable of further conjugation or hydroxy-keto redox interconversion is illustrated for the pair M6/M4 (Scheme 1). Results suggested that while the oxidized Phase I metabolites can also undergo very limited redox interconversion, the process highly favors the hydroxylated metabolite M6 (Figure 5). The same conversion pathway is proposed for CPK metabolite pairs M8/M3 and M7/M5.
Scheme 1.
Rationale proposed for the formation and measurement of Phase I (unconjugated) and Phase II sulfate and glucuronide metabolites (measured indirectly as the unconjugated moiety) in slices, media or enzymatic lysates for the CPK cyclohexanol-cyclohexanone redox pair M6/M4.
Although not a main objective of this research, a mass balance was attempted for parent cyclic phenones in binding cytosol and slice media exposures. Overall, mass balance was achieved for CBP, DPK and CPK in cytosol, a result most likely favored by the limited metabolism and evaporative loss of chemicals in closed containers at 4°C, and absence of fetal bovine serum (FBS). Consistent with its lower potential for evaporation and lack of metabolic conversion by rt liver slices, the nmole/well amount of DPK in slice exposure media with a liver slice was the same as the DPK amount in media without a slice, with both holding constant over 48 h. However, the decrease in media quantities of CPK and CBP with exposure time could not be explained by metabolic conversion alone (for metabolites identified in this study) or non-specific binding. Further, the high precision/accuracy of results, negligible chemical toxicity observed at exposure concentrations and insignificant analyte loss to aqueous phase or container walls did not support the high chemical losses measured throughout the experiments. We suspect that losses of CPK and CBP were due to a variety of factors including chemical evaporation, undetected conjugatives, and the potential formation of reactive moieties capable of binding to matrix components. Evaluation of these factors for CPK and CBP was performed within experimental limitations. The methods applied provided evidence for both phase I and phase II sulfation and glucuronidation pathways for CPK and CBP, but did not allow assessment of other phase II metabolism reactions such as acetylation, reductive methylation/demethylation or glutathione conjugation. Results also supported the significant evaporation of CPK, CBP and CBPOH in wells in 11°C exposures and 37°C enzymatic incubations, with data indicating metabolism of CBP to CBPOH and subsequent evaporative loss of CBPOH as a likely significant contributor to decreasing CBP quantities. The potential loss of CPK, CBP or their metabolites to selective binding was briefly evaluated. Results suggested a potential but very limited (< 7%) slice-mediated binding of CPK and CBP reactive moieties to lipids used as biological building blocks and present in serum added to media for slice viability (Appendices). Despite the amount unaccounted for CPK in the mass balance, the characterization of metabolites formed in slice exposures with the use of analytical tools provided sufficient information to allow inference of a suitable metabolic pathway for CPK by rt liver slices at 11°C. The proposed pathway for CPK conversion into M1-M9 metabolites is presented in Scheme 2.
Scheme 2.
Proposed metabolic pathway for the model cyclic phenone CPK in rt liver slices at 11°C. Both phase I (oxidative) and phase II (conjugative as sulfation and glucuronidation) pathways were observed during CPK biotransformation studies. CPK active metabolites were identified as cyclohexyl- (M1, M2), cyclohexanone- (M3, M4, M5) and cyclohexanol- (M6, M7, M8, M9) phenyl ketone derivatives (Table 3). All cyclohexanone- products were the result of further redox conversion of their hydroxylated metabolite pairs by oxidoreductases.
Understanding the linkages between early molecular events such as chemical binding to the ER and potential organismal-level adverse effects is essential for developing short term assays as diagnostic tools in predictive toxicology. The present research contributed to an overall effort to develop a comprehensive program to evaluate the potential adverse effects of chemicals on vertebrate endocrine systems by further exploring the role of metabolism in estrogenic activity modulation with the use of in vitro fish assays. It is expected that biotransformation data correlated to chemical exposure and potential adverse outcomes like the one presented in this report will facilitate development of additional in vitro and short-term in vivo assays needed to better prioritize chemicals for testing and support risk assessment at the USEPA. This information could also be used to: 1. update and optimize metabolism simulators with validated mechanistic data, 2. further populate MetaPath (Kolanczyk et al., 2012), a knowledge base created to archive, exchange and analyze xenobiotic metabolism information for better comparison and evaluation and, 3. provide insight into the differential sensitivity of species to chemical exposure (Kolanczyk et al., 2017). Finally, assessing the role of metabolites in cellular responses associated with endocrine disruption will provide USEPA with a means to advance methods for species extrapolation and improve understanding of interspecies homology and comparative toxicity.
Conclusions
This study demonstrated the advantages of applying advanced analytical strategies and tools to investigate the in vitro rt slice-mediated biotransformation of cyclic phenones in absence of Stds, and to assess the chemical structures responsible for ER-mediated Vtg mRNA induction. Differences in biotransformation of structurally related cyclic phenones DPK, CPK and CBP by rt liver slices was demonstrated, and a plausible metabolic pathway for a model chemical (CPK) was proposed.
Data suggested that the estrogenic effects of cyclic phenones are mediated by the parent chemical structure for DPK but the metabolic products of CPK. Absence of a CBPOH Std did not allow a definitive conclusion for CBP and CBPOH, although a contribution of both structures to Vtg gene induction is highly suspected. Further evaluation is also necessary to understand CBPOH role in estrogenic activity and potential adverse biological responses in fish species. The lack of Stds as well as low metabolite accumulation in media and slices did not allow determination of the specific CPK metabolites or the intra-slice amounts responsible for the observed Vtg gene activation. Nevertheless, the small concentrations of CPK metabolites detected combined with the Vtg mRNA induction response observed, suggested that CPK metabolites binding to the ER can potentially induce a stronger biological response than CPK and DPK. Although the use of ER binding and gene reporter assays in fish estrogenicity studies is not a novel approach, incorporation of chemical quantification and metabolism in in vitro assays provides important complementary information in instances where receptor binding and Vtg gene induction data do not provide definitive results. To our knowledge, this is the first report of the effective use of a suite of complementary in vitro assays to identify the chemical structure (parent and/or metabolite), responsible for ER-mediated gene expression in fish species. Ultimately, the combination of in vitro screening assays incorporating ligand binding, gene activation and mechanistic metabolic information with in silico methods like QSARs (quantitative structure-activity relationships) and QSMRs (quantitative structure-metabolism relationships; Athersuch et al., 2013) would result in a more effective approach to prioritize potential endocrine disrupting chemicals for further testing.
Supplementary Material
Acknowledgments
The authors thank Dr. John Kenneke for the review of this paper and insightful comments, Dr. Michael Hornung and Patricia Kosian for helpful suggestions, as well as Grace Overend and Katie Challis for technical assistance.
Appendices
Experimental confirmation of Sulfatase and beta-Glucuronidase enzymatic preparations activity.
Sulfatase and β-Glucuronidase activity was validated by HPLC prior to conjugate hydrolysis studies as follows: media (450 μL) containing 4-Nitrophenyl sulfate or Phenyl β-d Glucuronide Stds at 150 μM were incubated with Sulfatase and β-Glucuronidase respectively as described for cyclic phenone samples and extracted with 1 volume of ACN (see Materials and Methods). Quantitative analyses of extracts were used to assess complete conversion of Stds into 4-Nitrophenol and phenol respectively, or to adjust the amount of enzyme necessary to achieve completion when required.
Assessment of CBPOH and CPK metabolites loss to aqueous fractions of TEDG, incubation media and slice lysates.
Hexane extraction efficiency analyses of CBPOH or CPK metabolites M1-M9 from TEDG buffer or incubation media were not feasible due to Std availability. Alternatively, calculated octanol-water and hexane-water partition coefficients were used to assess the potential loss of these metabolites to aqueous fractions of exposure media and slice lysates during extraction procedures. Specifically, similarity of log Kow and log Khw between CBP and CBPOH (2.96/2.87 and 2.27/2.12 respectively; Table 1), allowed to predict a comparable CBPOH hexane recovery from media or TEDG (i.e., 81–84%). In addition, calculated water:hexane partition ratio values for CPK metabolites (Table 3), pointed at M7 and M8 (4- and 3-hydroxylated isomers) as the products most likely to exhibit limited favorable extraction with hexane (highest partition ratio). Metabolite losses were ultimately validated by monitoring for their presence in aqueous fractions of samples extracted with ACN by HPLC and LC-MS. Results showed no evidence of CBPOH or any CPK metabolite in extracts of exposure media or slice lysates above LOD.
Potential slice-mediated binding of cyclic phenone reactive moieties to lipid components in media containing Fetal bovine serum (FBS).
GC-MS chromatograms of CPK and CBP exposures in media containing a slice displayed a late–eluting peak showing increased RF with exposure time. This peak was absent in DPK samples, Blanks, Controls and at T=0 h for all exposures, and was not formed in media samples lacking FBS or affected by enzymatic hydrolysis with Sulfatase or β-Glucuronidase. Peak quantification between 4–48 h accounted for < 7% of the CPK and CBP amounts measured in exposure media without slices in comparison with media with slices. Peak identity analysis provided high probability matches for cholesteryl-type cyclic phenone derivatives in media containing 10% FBS, specifically the non-natural compounds 26, 27-dinorergost-5-en-3-ol benzoate and 5-cholesten-3-yl benzoate (Supplemental Figure 1). Stds were not available at purity necessary for peak identity confirmation or determination of the specific cyclophenone structure (parent or metabolites) presumably interacting with lipid components. Overall, this finding suggested a potential but limited slice-mediated binding of CPK and CBP reactive moieties to cholesteryl-type lipids present in exposure media. It also suggested a greater stability for DPK in exposure media containing slices and FBS. Supporting evidence for potential chemical interaction with lipid matrix has also been recently obtained by our group (data not shown), by demonstrating the loss of 4-tert-butyl-cyclohexanone (TBC) and 4-tert-pentylcyclohexanone (TPCH) to exposure media containing FBS in absence of slices.
Footnotes
Declaration of Interest
All research reported in this manuscript was funded by the US Environmental Protection Agency (USEPA), and conducted by or under the supervision of USEPA employees in additional non-financial collaboration with the University of North Dakota. Manuscript review was performed following provisions of the USEPA Office of Research and Development. Mention of trade names or commercial products does not constitute endorsement or recommendation for use. Views presented in the text are those of the authors and not necessarily the opinion of the USEPA. The authors report no conflict of interest.
Footnote 1
Semi-quantitative mathematical correlation used to calculate the concentration of CPK metabolites in exposure media in absence of putative Stds:
[CPK Metabolite] Estimated = ([CPK Std] * Metabolite Avg RF) / CPK Avg RF
where:
[ ] = concentration (μM)
CPK Std = CPK concentration selected as reference (μM)
RF (response factor) = full scan TIC peak area of CPK or Metabolite / full scan TIC peak area of IStd
Metabolite Avg RF= average of RF calculated for N replicates
CPK Avg RF= average of RF calculated at selected reference concentration for N replicates
Footnote 2
Mathematical correlation applied to determine the mass balance for model cyclic phenones in binding cytosol supernatants; X= measured amount of CBP, DPK or CPK (nmoles); Y= measured amount of CBPOH or BADPK (nmoles); CPKOH does not contribute to mass balance. Incubation times were 0 and 20h at 4°C:
Mass Balance for X in cytosol = [(X20h + Y20h) /X0h]
Footnote 3
Mathematical correlation applied to estimate mass balance for parent cyclic phenones in exposure media at each incubation time. All values are in nmoles; MC= media and chemical only; MCS= media, chemical and liver slices; S= exposed slices; bh= amount of unconjugated metabolite before enzymatic hydrolysis with β-Glucuronidase and Sulfatase; net= mathematical difference between amounts of unconjugated metabolites before and after enzymatic hydrolysis. CPKOH does not contribute to mass balance and therefore is not included.
DPK (MC at time X) = DPK (MCS + S) + BADPK
CPK (MC at time X) = CPK (MCS + S) + CPK Metabolites (Sbh + Snet + MSbh + MSnet)
CBP (MC at time X) = CBP (MCS + S) + CBPOH (Sbh + Snet + MSbh + MSnet)
References
- Ankley GT, Bennett RS, Erickson RJ, et al. (2010). Adverse outcomes pathways: a conceptual framework to support ecotoxicology research and risk assessment. Environ Toxicol Chem 29:730–741. [DOI] [PubMed] [Google Scholar]
- Ankley GT, Feifarek D, Blackwell B, et al. (2017). Re-evaluating the significance of estrone as an environmental estrogen. Environ Sci Technol 51:4705–4713. [DOI] [PMC free article] [PubMed] [Google Scholar]
- Athersuch TJ, Wilson DI, Keun HC, et al. (2013). Development of quantitative structure-metabolism (QSMR) relationships for substituted anilines based on computational chemistry. Xenobiotica 43:792–802. [DOI] [PubMed] [Google Scholar]
- Atsrikua C, Hoffmanna M, Moghaddamb M, et al. (2015). In vitro metabolism of a novel JNK inhibitor tanzisertib: interspecies differences in oxidoreduction and characterization of enzymes involved in metabolism. Xenobiotica 45:465–480. [DOI] [PubMed] [Google Scholar]
- Boekelheide K, Andersen M. (2011). A mechanistic redefinition of adverse effects: a key step in the toxicity testing paradigm shift. ALTEX Workshop report. 27:243–252 [DOI] [PubMed] [Google Scholar]
- Hornung MW, Tapper MA, Denny JS, et al. (2014). Effects-based chemical category approach for prioritization of low affinity estrogenic chemicals. SAR QSAR Environ Res 25:132–154. [DOI] [PubMed] [Google Scholar]
- Kolanczyk RC, Schmieder PK, Jones WJ, et al. (2012). MetaPath: an electronic knowledge base for collating, exchanging and analyzing case studies of xenobiotic metabolism. Reg Toxicol Pharmacol 63:84–96. [DOI] [PubMed] [Google Scholar]
- Kolanczyk RC, Serrano J, Tapper MA, et al. (2017). Comparison of pesticide metabolic pathways across 3 species. Reg Toxicol Pharmacol 94:124–143. [DOI] [PMC free article] [PubMed] [Google Scholar]
- Kunisue T, Wu Q, Tanabe S, et al. (2010). Analysis of five benzophenone-type UV filters in human urine by liquid chromatography-tandem mass spectrometry. Anal Methods 2:707–713. [Google Scholar]
- Lake BG, Price RG. (2013). Evaluation of the metabolism and hepatotoxicity of xenobiotics utilizing precision-cut slices. Xenobiotica 43:41–53. [DOI] [PubMed] [Google Scholar]
- Li Y, Wang H, Sia N. (2015). Metabolic profiling analysis of berberine, palmatine, jatrorrhizine, coptisine and epiberberine in zebrafishby ultra-high performance liquid chromatography coupled with LTQ Orbitrap mass spectrometer. Xenobiotica 45:302–311. [DOI] [PubMed] [Google Scholar]
- Liu Z, Hou P. (2017). Characterization of metabolites of larotaxel in rat by LC chromatography coupled with Q exactive high resolution benchtop quadrupole orbitrap mass spectrometer. Xenobiotica, In press. [DOI] [PubMed] [Google Scholar]
- Mills GA, Walker V. (2001). Headspace solid-phase microextraction profiling of volatile compounds in urine: Application to metabolic investigations. J Chromatogr B Biomed Sci Appl 753:259–268. [DOI] [PubMed] [Google Scholar]
- Martignoni M, Monshouwer M, de Kanter R, et al. (2004). Phase I and phase II metabolic activities are retained in liver slices from mouse, rat, dog, monkey and human after cryopreservation. Toxicol In Vitro. 18(1):121–128. [DOI] [PubMed] [Google Scholar]
- Morcos PN, Yu L. (2017). Absorption, distribution, metabolism and excretion (ADME) of the ALK inhibitor alectinib: results from an absolute bioavailability and mass balance study in healthy subjects. Xenobiotica 47:217–229. [DOI] [PubMed] [Google Scholar]
- Olinga P, Schuppan D. (2013). Precision-cut liver slices: a tool to model the liver ex vivo. J Hepatol 58:1252–1253. [DOI] [PubMed] [Google Scholar]
- Pedersen RT, Hill EM. (2000). Identification of novel metabolites of the xenoestrogen 4-tert-octylphenol in primary rat hepatocytes. Chem Biol Interact 128:189–209. [DOI] [PubMed] [Google Scholar]
- Schmieder PK, Tapper MA, Denny JS, et al. (2000). Optimization of a precision-cut trout liver tissue slice assay as a screen for vitellogenin induction: comparison of slice incubation techniques. Aquatic Toxicol 49:251–268. [DOI] [PubMed] [Google Scholar]
- Schmieder PK, Tapper MA, Denny JS, et al. (2004). Use of trout liver slices to enhance mechanistic interpretation of estrogen receptor binding for cost-effective prioritization of chemicals within large inventories. Environ Sci Technol 38:6333–6342. [DOI] [PubMed] [Google Scholar]
- Schmieder PK, Kolanczyk RC, Hornung MW, et al. (2014). A rule-based expert system for chemical prioritization using effects based chemical categories. SARQSAR Environ Res 25:253–286. [DOI] [PubMed] [Google Scholar]
- Serrano J, Higgins L, Witthuhn BA, et al. (2010). In vivo assessment and potential diagnosis of xenobiotics that perturb the thyroid pathway: proteomic analysis of xenopus laevis brain tissue following exposure to model T4 inhibitors. Comp Biochem Physiol 5:138–150. [DOI] [PubMed] [Google Scholar]
- Serrano J, Kolanczyk RC, Tapper MA, et al. (2018). Mass-spectrometric identification of cyclic phenone metabolites produced by rainbow trout liver slices. Submitted to Xenobiotica. [Google Scholar]
- Segura J, Ventura R, Jurado C. (1998). Derivatization procedures for gas chromatography-mass spectrometric determination of xenobiotics in biological samples, with special attention to drugs of abuse and doping agents. J Chromatogr B 713:61–90. [DOI] [PubMed] [Google Scholar]
- Sievers CK, Shanle EK, Bradfield CA. (2013). Differential action of monohydroxylated polycyclic aromatic hydrocarbons with estrogen receptors α and β. Toxicological Sci. 132:359–367. [DOI] [PMC free article] [PubMed] [Google Scholar]
- Starokozhko V, Vatakuti S, Schievink B, et al. (2017). Maintenance of drug metabolism and transport functions in human precision-cut liver slices during prolonged incubation for 5 days. Arch Toxicol. 91(5): 2079–2092. [DOI] [PMC free article] [PubMed] [Google Scholar]
- Tapper MA, Serrano J, Schmieder PK, et al. (2018a). Metabolism of diazinon in rainbow trout slices. App in Vitro Toxicol 4(1):13–18. [DOI] [PMC free article] [PubMed] [Google Scholar]
- Tapper MA, Denny JS, Serrano J, et al. (2018b). Phenone, hydroxybenzophenone and branched phenone ER binding and vitellogenin agonism in rainbow trout in vitro models. App in Vitro Toxicol, In Press. [DOI] [PMC free article] [PubMed] [Google Scholar]
- Uchea U, Sarda S, Schulz T, et al. (2013). In vitro models of xenobiotic metabolism in trout for use in environmental bioaccumulation studies. Xenobiotica 43:421–431. [DOI] [PubMed] [Google Scholar]
- Viviani P, Lifschitz AL, Garcia P, et al. (2017). Assessment of liver slices for research on metabolic drug-drug interactions in cattle. Xenobiotica 47:933–942. [DOI] [PubMed] [Google Scholar]
- Wang J, Pan L, Wu S, et al. (2016). Recent advances on endocrine disrupting effects of UV filters. Int J Environ Res Public Health 13:782–793. [DOI] [PMC free article] [PubMed] [Google Scholar]
- Wu X, Kania-Korwel I, Chen H, et al. (2013). Metabolism of 2,2’,3,3’,6,6’-hexachlorobiphenyl (PCB 136) atropisomers in tissue slices from phenobarbital or dexamethasone-induced rats is sex dependent. Xenobiotica 43:933–947. [DOI] [PMC free article] [PubMed] [Google Scholar]
- Yamane M, Kawashima K, Yamaguchi K, et al. (2015). In vitro profiling of the metabolism and drug–drug interaction oftofogliflozin, a potent and highly specific sodium-glucose co-transporter 2 inhibitor, using human liver microsomes, human hepatocytes, and recombinant human CYP. Xenobiotica 45:230–238. [DOI] [PubMed] [Google Scholar]
- Zhuang S, Zhang J, Wen Y, et al. (2012). Distinct mechanisms of endocrine disruption of DDT-related pesticides toward estrogen receptor alpha and estrogen-related receptor gamma. Environ Tox Chem 31(11): 2597–2605. [DOI] [PubMed] [Google Scholar]
Associated Data
This section collects any data citations, data availability statements, or supplementary materials included in this article.


