

Abstract
Articular fracture malreduction increases post-traumatic osteoarthritis (PTOA) risk by elevating joint contact stress. A new Biomechanical Guidance System (BGS) that provides intra-operative assessment of articular fracture reduction and joint contact stress based solely on a pre-operative CT and intra-operative fluoroscopy may facilitate better fracture reduction. The objective of this proof-of-concept cadaveric study was to test this premise while characterizing BGS performance. Articular tibia plafond fractures were created in 5 cadaveric ankles. CT scans were obtained to provide digital models. Indirect reduction was performed in a simulated operating room once with and once without BGS guidance. CT scans after fixation provided models of the reduced ankles for assessing reduction accuracy, joint contact stresses, and BGS accuracy. BGS was utilized 4.8±1.3 (mean±SD) times per procedure, increasing operative time by 10 minutes (39%), and the number of fluoroscopy images by 31 (17%). Errors in BGS reduction assessment compared to CT-derived models were 0.45±0.57 mm in translation and 2.0±2.5° in rotation. For the 4 ankles that were successfully reduced and fixed, associated absolute errors in computed mean and maximum contact stress were 0.40±0.40 MPa and 0.96±1.12 MPa, respectively. BGS reduced mean and maximum contact stress by 1.1 and 2.6 MPa, respectively. BGS thus improved the accuracy of articular fracture reduction and significantly reduced contact stress.
Keywords: Post-Traumatic Osteoarthritis (PTOA), Arthritis, Ankle, Intra-Articular Fracture, Pilon Fracture, Plafond Fracture, Biomechanical Guidance, Computer Assisted Surgery
Statement of Clinical Relevance:
Malreduction of articular fractures is known to lead to PTOA. The BGS described in this work has potential to improve quality of articular fracture reduction and clinical outcomes for patients with a tibia plafond fracture.
Introduction
The goal of articular fracture reduction is to restore articular congruity and joint stability. Whether the reduction is visualized directly, with an arthrotomy or arthroscopically, or indirectly with fluoroscopy, accurate reduction requires an understanding of joint morphology and refined visuospatial skills.1 Indirect approaches can limit soft tissue damage and wound complications compared to extensile techniques required for direct visualization,2 but the interpretation of 3D anatomy from 2D fluoroscopic images necessary for this technique is challenging.
Accurate articular fracture reduction is an important factor to optimize long-term outcomes and to prevent post-traumatic osteoarthritis (PTOA).3,4 Reducing the displaced articular surface minimizes deleterious elevated joint contact stress. However, it is difficult to reliably assess articular congruity during surgery based solely upon 2D fluoroscopy.5–9 Intra-operative 2D – 3D imaging (O-arm) and fluoroscopy systems that produce 3D images have been developed, but they are expensive and require separate imaging processes to produce 3D and multiplanar images. In addition, estimates of contact stress based on the position of articular fracture fragment reduction can only be made based on post-operative CT scans. There is an important need to develop more advanced techniques to intra-operatively assess articular fracture reduction and the associated contact stress, ideally while minimally disrupting the flow of the operation.
To that end, we developed a biomechanical guidance system (BGS) to provide enhanced intra-operative visual and biomechanical assessment during articular fracture reduction. The BGS provides a continuously updated intra-operative 3D model to both visualize fracture reduction and to assess contact stress. The BGS relies upon a conventional pre-operative CT, a calibration object, and intra-operative fluoroscopy to track fracture fragments during reduction and to computationally estimate joint contact stress.10 When used sequentially throughout the fracture reduction process, this system provides the surgeon with visual and biomechanical feedback about quality of articular reduction. The BGS is unique in that it does not require additional imaging systems, can compute 3D fragment positioning using only two fluoroscopy images, and provides estimated contact stress to the surgeon. The goal of this study was to use the BGS in a realistic fracture reduction and fixation simulation and to compare BGS-guided fracture reduction to a non-guided reduction for accuracy and post-reduction joint contact stress. In addition, we sought to determine the accuracy of the BGS system by validating the post-reduction data produced by the BGS with that derived from post-operative CT scans of the final reduction.
Materials and Methods
Biomechanical Guidance System
The BGS is a computer-assisted surgery tool that provides near real-time images of 3D fracture geometry and contact stress distributions. This is performed with minimal disruption to ongoing clinical workflow and without requiring surgeon use of additional intra-operative hardware. The only additional hardware required within the surgical field is a small calibration object consisting of a radiolucent acrylic frame containing 26 radio opaque stainless steel ball bearings (beads) with precise dimensions (3.175±0.0127 mm). Twelve of the beads are inset into the acrylic frame in the shape of an ‘X’ on one plane, and the remaining 14 beads are inset in the shape of a circle on a separate orthogonal plane (Figure 1). A C-arm (Siemens, Cios Fusion) with network communication capabilities, computer workstation with BGS software, and a large screen display for presentation of results is also required in the operating room (Figure 2).
Figure 1:

Physical calibration object used with the BGS (left) and appearance of the calibration objects in anterior-posterior (AP – middle) and lateral (right) fluoroscopic views of a fractured cadaveric ankle specimen. The calibration object was made using a computer numerical controlled mill (Haas Automation, Oxnard, CA) and the bead spacing was confirmed to be accurate within ±25μm using a laser scanner (FARO Scan Arm® HD, FARO Technologies, UK). The angled position of the acrylic pieces containing the X and circle were chosen to be visible in these imaging planes and to surround the ankle in the surgical field without interfering with the operation.
Figure 2:

Layout of the operating room including the necessary BGS components. For this simulated surgery, the ankle was mounted to a holding device and the calibration object was placed under the blue surgical drape. The specimen was imaged with the C-arm and a computer workstation (not pictured) was used to compute BGS results and display the 3D geometry and contact stress results on a large screen display.
Two fluoroscopy views at least 30° apart from one another with the calibration object in the view are used during the execution of the 2D-3D registration step of the BGS.11 Standard anterior-posterior(AP) and lateral views of the ankle have proven to be the most practical. The image pair is transferred to the computer workstation, and the BGS software computes the 3D positioning of individual fracture fragments. First, a RANSAC algorithm is used to locate the line and ellipse shapes created by oblique views of the ‘X’ and circle calibration objects within the fluoroscopic images. For each view, a projective transform P is calculated by automatically registering the beads in the calibration object from their position in the 2D image to the laser scanned, physical 3D positioning of the beads in the calibration object through a direct linear transform. Using QR decomposition and known parameters specific to the fluoroscopic unit (source-intensifier distance, size/aspect ratio of pixels), P is decomposed to identify rotation and translation of the virtual camera relative to the calibration object. With this calibration, the algorithm can generate digitally reconstructed radiographs (DRRs) from the pre-operative CT scan data that match the properties of the image generated by the C-arm intra-operatively.
The automated alignment algorithm functions by correlating these DRR images with the fluoroscopic images acquired intra-operatively.10 First, an image similarity metric consisting of the product of the normalized cross correlation (NCC) of image intensity and the average NCC of the image gradient in the x and y image directions is determined between the DRR and the fluoroscopic image with the same view (AP or lateral). Similarity is computed for each of the two input fluoroscopy images, and the values multiplied to provide a single value to be optimized. For computational speed and convergence properties,12–14 the overall automated optimization strategy uses three separate alignment processes. The first two alignment steps utilize a multi-start bound-optimization by quadratic approximation (BOBYQA) optimization method on two progressively less-smoothed versions of the DRR/fluoroscopic image pair. The third optimization step is a downhill simplex method applied to a non-smoothed image DRR/fluoroscopic image pair. This method brings the virtual fragment into registration with the fluoroscopic views.10 The 3D model of these aligned fragments is then displayed to the surgeon.
A subsequent biomechanical analysis using a computational stress analysis method called discrete element analysis (DEA) can then be performed to estimate articular contact stress associated with the current 3D configuration. DEA treats bones as rigid and cartilage as a deformable overlying elastic material that can be modeled as a bed of springs. The stiffness of each spring is derived from cartilage material properties and local thickness. As it cannot be segmented directly from CT, a cartilage surface must be extrapolated from the subchondral bone surface. Pre-operatively, subchondral bone regions were identified on each fracture fragment using Geomagic Studio software (3D Systems, Rock Hill, SC, USA), and the uniform offset tool was used to project this selection by 1.4 mm to simulate the articular cartilage thickness in the human ankle joint. This is similar to the DEA procedure validated by Kern and Anderson for use in the intact ankle.15 For intra-operative speed, contact stress is computed in a single static pose, with a primary load of 1000N applied down the long axis of the tibia. A second load of 100N is applied in the lateral direction on the tibia to approximate joint stabilization by the fibula. The talus is constrained against superior-inferior translation, medial-lateral translation, and flexion-extension, but otherwise allowed to equilibrate in the AP direction and all other rotations. DEA calculations were performed utilizing a custom Newton’s method solver previously developed in MATLAB,15 and the computed contact stress is presented to the surgeon (Figure 3).
Figure 3:
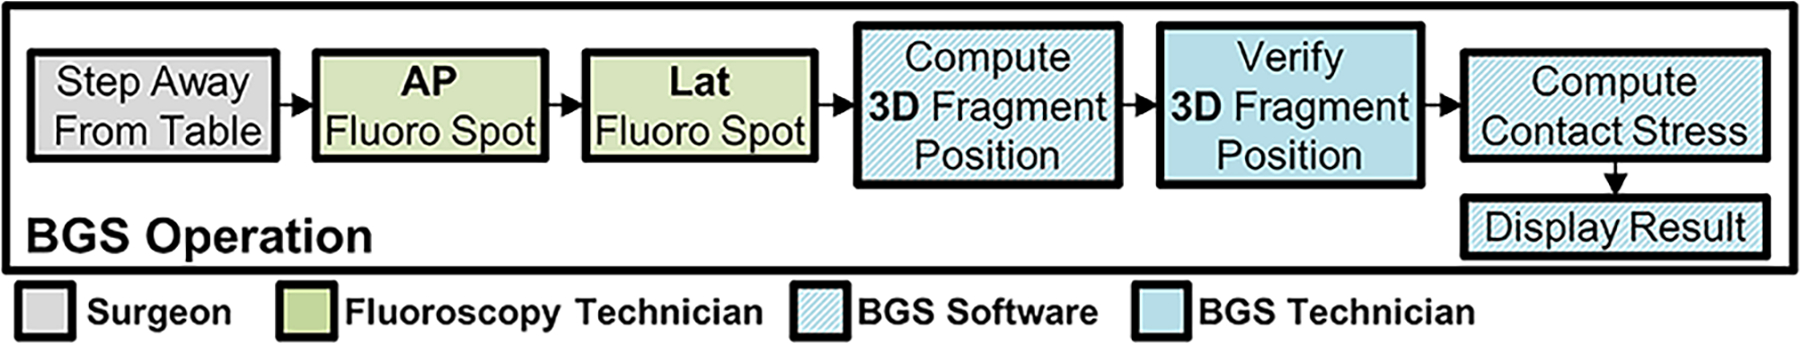
Sequence of events when BGS is run. The operating surgeon requests additional data and steps back from the patient to ensure no motion occurs between AP and lateral fluoroscopy images. Once the bi-plane images are acquired, the BGS technician proceeds with automated alignment of 3D fragment positions. This is verified manually, and semi-automated corrections are performed by the technician. Contact stress is then computed automatically by the BGS software, and results are displayed to the surgeon.
Cadaveric Trial Validation
Five human cadaver ankles were selected with good to fair bone quality and absence of radiographic ankle joint arthritis. The proximal end of the tibia was debrided and potted in poly methyl methacrylate bone cement for stabilization during the procedure. Simulated fractures were created by an investigator that did not perform the surgical reduction and fixation (A. M. K.). The surgeon provided clinical case examples of typical patterns seen with tibia plafond fractures to use a reference when creating the fractures. The surgeon reviewed a CT scan of the ankle collected after the simulated fracture but was otherwise blinded to the fracture pattern. The distal tibia was exposed by performing anteromedial (2 ankles) or posterolateral (3 ankles) surgical approaches. A mallet and osteotome were used to create 2-, 3-, or 4-fragment intra-articular fractures (Figure 4), and the incisions were closed with running skin suture. Of the simulated partial articular fractures, Ankle 1 had a small anterolateral fragment and large posterior fragment with impacted articular fragment medially, Ankle 2 had medial and posterolateral fracture fragments, Ankle 3 had large medial and small posterolateral fracture fragments, and Ankle 5 had large anterolateral and medial fracture fragments. Ankle 4 had a simulated complete articular fracture with oblique superior medial to inferior lateral metaphyseal fracture and a posterolateral articular fracture fragment. Pre-operative CT scans (Siemens SOMATOM Force) were acquired for each ankle with in-plane resolution of 0.23×0.23mm and slice spacing of 0.75 mm. Segmentations of each fractured distal tibia were performed, and triangulated surface models of the 3D bone morphology were created from these segmentations. CT Hounsfield units were converted into linear attenuation coefficients for later processing.16
Figure 4:

CT volumetric renderings of the five fractured cadaver ankles reconstructed in this work. Two-, three-, and four-fragment fractures were created with an osteotome and mallet. Case four had complete separation of the articular surface from the diaphysis of the tibia.
Indirect reductions using percutaneous incisions on the five fractured ankles were performed by a board-certified orthopaedic trauma surgeon (M. C. W.) using standard fluoroscopy and surgical fixation hardware (1.575 mm diameter Kirschner wires for provisional fixation and partially threaded 4.0mm cancellous screws for definitive fixation). The goal of the procedure was to achieve anatomic reduction without gaps or step-offs at the articular surface fracture lines. Two surgical trials were performed with each ankle specimen, one with BGS information displayed to the surgeon, and one without. These trials were separated by at least 48 hours, between which fixation was removed and soft tissue incisions sutured. The ordering of display/no display trials was randomized to mitigate training effects from reducing the fracture twice. The BGS system data were calculated during both trials, regardless of whether the output was shown to the surgeon. In all cases, the system was run once prior to the surgery to provide pre-operative information. Throughout the course of the reduction in a BGS trial, when the surgeon requested, the BGS system was run to display both 3D geometry and contact stress (Figure 5). In the non-BGS trials, the surgeon utilized standard fluoroscopy to judge progress toward reduction. Following completion of provisional reduction and fixation with Kirschner wires, the fracture was definitively fixed with screws, and the BGS system was run a final time to obtain post-operative results.
Figure 5:

General procedure and workflow of BGS. In surgical preparation, the BGS technician initializes the system and loads pre-op CT data. Immediately prior to reduction, the BGS is run once to provide 3D data to the clinician. The clinician then proceeds with the operation as normal. If at any point additional information is desired, the BGS is run (Steps 1–3) and displayed to the surgeon. Upon definitive fixation, the BGS is run to verify reduction quality.
Post-operative CT scans were performed following all fracture reductions to evaluate the accuracy of BGS-computed fragment positioning and contact stress distributions. Post-operative CT scans were segmented in the same manner as the pre-operative scans to identify individual fracture fragments. Geomagic Studio was used to align post-operative CT segmentations to the post-operative BGS results. To bring CT and BGS data into a common reference frame, a rigid transformation aligning the CT diaphyseal fragment to the BGS diaphyseal fragment was applied to all CT-derived bone fragments. Each post-operative CT fragment was then aligned to its corresponding BGS fragment. The translations and rotations needed to bring these two geometries into alignment were recorded. In addition, contact stress distributions were computed using the DEA model generated from post-operative CT data, and these contact stresses were compared to the BGS data in terms of mean stress, maximum stress, and contact area. The BGS system geometrical and contact stress results for all reduced fractures, whether the surgeon used the system or not, were compared with CT scan model-generated results.
To determine spatial correspondence between gold standard CT and BGS contact stress distributions, the articular surface of each case was parameterized. A 10×10 cell grid lying in the transverse plane (orthogonal to the long axis of the tibia), was fit to the articular surface of each specimen. Contact stress distributions were projected to this parametric grid and the mean value within each cell was recorded and shown in Figure 6. Differences between corresponding cells within the grid were compared between gold standard CT and BGS. Pearson correlation was used to compare contact stress values within each of these parameterized grids, where a correlation was computed for each of the ten surgical trials. The two trials were also compared in terms of number of fluoroscopy shots acquired and total surgical time.
Figure 6:

Gold standard (from CT) and navigation based (from BGS) contact stress distributions were compared by parameterizing the articular surface. Contact stress was projected to a 10×10 grid and mean stress within the cell is recorded. For display purposes stress values are illustrative only.
Results
In nine of the ten trials, the fractures were successfully reduced and internally stabilized. The one trial failure was for case 4, the only complete articular fracture OTA/AO 43C.17 While the articular block (three distal fragments) was securely reduced and fixed, it was not secured to the tibial shaft allowing for motion prior to the post-operative CT scan. The BGS system was used on average 4.8±1.3 (mean±SD) times per procedure. Trials using the BGS had a longer operative time by an average of 10 minutes (39% increase) and increased the mean number of fluoroscopy shots by 31.2 (17% increase).
When compared to the post-op CT segmentations, it was found that alignment error of the BGS was 0.45±0.57 mm in translation and 2.0±2.5° in rotation. For the 4 ankles that were successfully reduced and fixed in both trials, the absolute difference between post-op BGS and CT gold standard global mean and maximum contact stress were 0.40±0.40 MPa and 0.97±1.12 MPa, respectively. Post-operative BGS-based and gold standard CT-based contact stress distributions compared well visually (Figure 7). Comparison of spatial contact stress distributions found that 89.1% and 96.1% of the grid cells had a contact stress difference <1.0 MPa and <2.0 MPa, respectively. Correlation between grid cells ranged from 0.61 to 0.97 (all correlations have p <0.001) with a median correlation of 0.84.
Figure 7:

Illustrative agreement between contact stress distributions generated from the post-operative CT (gold standard) and the final BGS results following definitive fixation. Example BGS trials shown include both those resulting from when the BGS data was and was not displayed to the surgeon. Visually, contact stress results compare well between the BGS-derived and post-operative CT scan-derived gold standard contact stress distributions.
The mean and maximum contact stress values for fracture reduction trials performed using the BGS were 1.1 MPa less (p=0.05) and 2.6 MPa less (p=0.04), respectively, than those that did not use the BGS (Figure 7 and Figure 8). The contact stress area-engagement histogram presented in Figure 9 shows that trials using the BGS had consistently less contact area exposed to higher-magnitude contact stress.
Figure 8:

Final contact stress metrics with and without use of BGS guidance; mean and maximum contact stress were reduced with the BGS in all four ankles that were successfully reduced and fixed.
Figure 9:

Contact area engagement of all cases with BGS display versus without. Cases which received display have lower contact area at contact stress magnitudes known to be deleterious.
Discussion
The BGS performed well in this proof-of-concept simulated articular fracture reduction experiment. The surgical workflow was only modestly altered. Mean operative time was greater in cases that utilized BGS (10 min longer). This was due to the surgeon processing additional information from the 3D images with contact stress assessments, and altering the reduction based on this additional information. For example, a reduction that appears acceptable on fluoroscopy may appear problematic with 3D visualization and contact stress data, causing the surgeon to extend operative time to correct the malreduction. This is supported by the increased number of fluoroscopy images taken in the cases that utilized BGS. This study describes two novel concepts that have potential to improve articular fracture surgery. First, reducing contact stress is one of the fundamental motives for accurate articular fracture reduction. The ability to monitor this variable in real-time during fracture reduction is novel. Second, using only 2D fluoroscopic images intra-operatively to create a 3D reconstruction of current articular fracture reduction has significant potential to provide orthopedic surgeons with usable data to improve patient outcomes related to reduction quality. This study confirms the accuracy and feasibility of this technique.
The performance of the BGS compares favorably with that of other computer-assisted surgery techniques aimed at guiding articular fracture reduction. Murphy et al., who to the best of our knowledge coined the term “Biomechanical Guidance System,” demonstrated their system in a series of 19 periacetabular osteotomy cases.18 While it presented both biomechanical and geometric results, their system relied upon placement of optical fiducial markers, necessitating a significant alteration of current practice. The authors did not report surgical times. Dagnino et al., used a robotic system for fracture reduction in a series of simple distal femur fractures. They reported surgical times on the order of 100 minutes (~40 minutes longer than our longest surgery), and their system required anchoring of a large metallic implant in each fragment for a hybrid of optical tracking with 2D-3D registration to inform fragment positioning.19 Such an approach would scale poorly with large numbers of fragments or small fragment size typical of articular fractures. Furthermore, their use of robotic manipulation of fragments alters the role of the orthopaedic surgeon.
Intra-operative registration accuracy of fracture fragments using our system compared favorably to post-operative CT. Accuracy of the system is likely negatively impacted by the presence of surgical hardware, image noise and accumulation of error due to small motions of the fracture (between bi-plane shots).20,21 There was also time between fixation of the fracture and acquisition of post-operative CT, during which the positioning of bone fragments may have shifted slightly. In general, guidance systems defined for pure “research” use report better accuracy than the BGS system (on the order of 0.2 mm and 0.5°).22,23 However, such systems typically have the luxury of using a more controlled setup, with carefully selected view angles and long registration times (sometimes >1 hour per registration). This is prohibitive for intra-operative implementation. When compared to other systems used in a clinical “intra-operative” scenario, the BGS compares quite well. Dagnino et al. reported registration accuracy on the order of 1.0±0.5 mm with their robotic surgical system,19 though this reported value represents surface target registration error, which measures surface deviations instead of rigid body motion, and is not directly comparable to our accuracy values. It is also worth noting that their system required between 26 and 52 minutes to perform one image-based registration intra-operatively. Murphy et al, reported registration accuracy on the order of 1.4mm and 1.0° using their optical-tracking-based biomechanical system.18
When using the BGS, it is important to understand not only the registration accuracy of fragments, but the impact that registration error has on biomechanical results. The DEA algorithm used to compute articular contact stress has been previously validated in the human ankle, however the impact of subtle differences in articular surface congruity are unknown.15 Comparison of the CT-based gold standard with the BGS contact stress distributions is favorable.
On average, trials where BGS information was displayed to the surgeon showed a decrease in global contact stress versus cases without BGS information. This trend was consistent across all trials. Trials in which guidance was used also showed reduced contact area engaged at high levels of contact stress previously shown to be deleterious (>4.5 MPa).24 Overall contact area above this level was shown to be reduced by 60% compared to trials without guidance (p=0.02). This evidence suggests that the BGS system improved articular fracture reduction. The surgeon commonly adjusted the articular reduction based on feedback from the BGS. Indirect reduction was optimized based on fluoroscopy, and the BGS identified subtle malreduction that were not evident on 2D fluoroscopy. This resulted in longer operative times due to added attempts at reduction but improved articular alignment and joint contact stress.
The current test was intended to be a proof-of-concept exploration of the BGS system to provide motivation for further work and insight to potential improvements. During use of the BGS, many observations were made about potential improvements and limitations of the BGS. Since two fluoroscopy images are required for 2D-3D registration, a single C-arm must be manually adjusted to obtain these images. Within this interval any motion of the surgical field must be avoided to maintain registration accuracy. In practice this requires a ~10 second delay as the C-arm is rotated to obtain a second image. In the future, a second C-arm could be utilized to obtain truly bi-plane images to mitigate a portion of this limitation.
While registration of individual bone-fragments is largely automated, the chance of registration failure persists, particularly when bone fragments are faintly present or occluded by reduction instruments and fixation implants. Currently, detection and remediation of failed registration is dependent on the vigilance of the technician operating the BGS software. This process, while not particularly time-consuming, is likely subject to the skill and experience of the given software operator. Several recent publications have shown promising results with automating registration verification.25,26
Biomechanical results computed with this system assume that all the fracture fragments are rigidly fixed in space. Currently, there are no plans to address this limitation, as ultimately the success of a reduction relies on the surgeon achieving stable definitive fixation. Contact stress in the BGS is currently computed in a single static pose. Contact stress-time exposure through the stance phase of the gait cycle reported in previous studies is unable to be computed.15,27–29 This is primarily a constraint of computation time, and future optimization of the DEA algorithm may allow simulation of the full stance phase in the gait cycle in the operating room.
An additional limitation is that simulated fractures were used that may not perfectly represent patterns seen with axial loading injuries typical of tibia plafond fractures. The investigator that created the simulated fractures modeled the patterns based on actual clinical cases to improve the relevance of the trial. Also, the BGS used for this trial predicted joint contact stress patterns in a single static pose. Future iterations of the BGS could use ankle position and loading matched throughout the stance phase gait cycle to possibly provide more clinically relevant feedback.
Direct visualization with arthroscopy can be used to effectively judge articular surface proximity,30,31 but angulation of the articular surface is more difficult to assess, and fluoroscopy is still required to assess alignment of the joint and fixation. Additionally, not all surgeons that perform articular fracture fixation regularly use arthroscopic techniques, but recognition of 2D and 3D models may be more broadly accessible in clinical practice.
3D fluoroscopy is commercially available and has been used to assess syndesmosis alignment after rotational ankle fractures.32 This tool uses a motorized, automated C-arm rotation which takes about 90 seconds. The output is reformatted axial, coronal, and sagittal images. In contrast to the BGS, 3D fluoroscopy does not currently include joint contact stress feedback to the surgeon and requires more radiation exposure, as BGS only requires 2 fluoroscopic images. The BGS does require a calibration object to be visualized on both fluoroscopic images that is not required for 3D fluoroscopy.
These ten simulated articular fracture reduction surgeries represent the initial use of this system in a clinically realistic scenario. Operation of the BGS software and hardware in such a scenario requires proficiency from the technician. As additional experience is gained and the BGS system is modified to improve usability, it is expected that results will likely improve as well. A significant learning curve is also expected for the orthopaedic surgeon where surgical time, fluoroscopy usage, and biomechanical results would be expected to further improve. Only one orthopaedic surgeon performed the fracture reductions in this study; further exploration is required to determine how additional surgeons perform with the BGS.
Conclusion
The BGS addresses a significant shortcoming in surgical reduction of intra-articular fractures: accurate indirect assessment of reduction of the articular surface. Currently, assessment is performed by evaluating articular step-off through direct visualization (with arthrotomy or arthroscopy) or fluoroscopic imaging. The accuracy and reliability of these methods, particularly fluoroscopic imaging, have been drawn into question. Failure to achieve a high-quality fracture reduction places the joint at increased risk for development of post-traumatic osteoarthritis, persistent disability, and subsequent joint arthroplasty or arthrodesis. This study used a novel BGS to assess metrics of articular fracture reduction quality in a cadaveric fracture simulation. This was a first step in establishing the usability and efficacy of this new system.
Acknowledgements:
Research reported in this publication was supported by the National Institute of Arthritis and Musculoskeletal and Skin Diseases of the National Institutes of Health under award numbers R21AR054015 and P50AR055533. The content is solely the responsibility of the authors and does not necessarily represent the official views of the National Institutes of Health.
References
- 1.Graves ML. The value of preoperative planning. J Orthop Trauma Oct 2013;27 Suppl 1:S30–4. doi: 10.1097/BOT.0b013e3182a52626 [DOI] [PubMed] [Google Scholar]
- 2.Marsh JL, Weigel DP, Dirschl DR. Tibial plafond fractures. How do these ankles function over time? J Bone Joint Surg Am Feb 2003;85-A(2):287–95. [PubMed] [Google Scholar]
- 3.Yablon IG, Segal D, Leach RE. Ankle injuries Churchill Livingstone; 1983:ix, 268 p. [Google Scholar]
- 4.Stufkens SAS, van den Bekerom MPJ, Kerkhoffs GMMJ, Hintermann B, van Dijk CN. Long-term outcome after 1822 operatively treated ankle fractures: A systematic review of the literature. Injury-International Journal of the Care of the Injured Feb 2011;42(2):119–127. doi: 10.1016/j.injury.2010.04.006 [DOI] [PubMed] [Google Scholar]
- 5.Capo JT, Kinchelow T, Orillaza NS, Rossy W. Accuracy of fluoroscopy in closed reduction and percutaneous fixation of simulated Bennett’s fracture. Comparative Study. J H and Surg Am Apr 2009;34(4):637–41. doi: 10.1016/j.jhsa.2008.12.023 [DOI] [PubMed] [Google Scholar]
- 6.Garner MR, Fabricant PD, Schottel PC, et al. Standard perioperative imaging modalities are unreliable in assessing articular congruity of ankle fractures. J Orthop Trauma Apr 2015;29(4):e161–5. doi: 10.1097/BOT.0000000000000219 [DOI] [PubMed] [Google Scholar]
- 7.Marmor M, Hansen E, Han HK, Buckley J, Matityahu A. Limitations of standard fluoroscopy in detecting rotational malreduction of the syndesmosis in an ankle fracture model. Foot Ankle Int Jun 2011;32(6):616–22. doi: 10.3113/FAI.2011.0616 [DOI] [PubMed] [Google Scholar]
- 8.Buchler L, Tannast M, Bonel HM, Weber M. Reliability of radiologic assessment of the fracture anatomy at the posterior tibial plafond in malleolar fractures. J Orthop Trauma. Mar 2009;23(3):208–12. doi: 10.1097/BOT.0b013e31819b0b23 00005131–200903000-00009 [pii] [DOI] [PubMed] [Google Scholar]
- 9.Borrelli J Jr., Goldfarb C, Catalano L, Evanoff BA. Assessment of articular fragment displacement in acetabular fractures: a comparison of computerized tomography and plain radiographs. Comparative Study. J Orthop Trauma Aug 2002;16(7):449–56; discussion 456–7. [DOI] [PubMed] [Google Scholar]
- 10.Kern AM. Intra-operative biomechanical analysis for improvement of intra-articular fracture reduction University of Iowa; 2017. [Google Scholar]
- 11.Uneri A, Otake Y, Wang AS, et al. 3D-2D registration for surgical guidance: effect of projection view angles on registration accuracy. Research Support, Non-U.S. Gov’t. Phys Med Biol Jan 20 2014;59(2):271–87. doi: 10.1088/0031-9155/59/2/271 [DOI] [PMC free article] [PubMed] [Google Scholar]
- 12.Powell MJ. The BOBYQA algorithm for bound constrained optimization without derivatives. Cambridge NA Report NA2009/06, University of Cambridge, Cambridge. 2009;26 [Google Scholar]
- 13.Otake Y, Armand M, Armiger RS, et al. Intraoperative Image-based Multiview 2D/3D Registration for Image-Guided Orthopaedic Surgery: Incorporation of Fiducial-Based C-Arm Tracking and GPU-Acceleration. TMI 2012;31(4):948–962. doi: 10.1109/TMI.2011.2176555 [DOI] [PMC free article] [PubMed] [Google Scholar]
- 14.Nelder JA, Mead R. A Simplex Method for Function Minimization. Computer journal 1965;7(4):308–313. doi: 10.1093/comjnl/7.4.308 [DOI] [Google Scholar]
- 15.Kern AM, Anderson DD. Expedited patient-specific assessment of contact stress exposure in the ankle joint following definitive articular fracture reduction. J Biomech Sep 18 2015;48(12):3427–32. doi: 10.1016/j.jbiomech.2015.05.030 [DOI] [PMC free article] [PubMed] [Google Scholar]
- 16.Brown S, Bailey DL, Willowson K, Baldock C. Investigation of the relationship between linear attenuation coefficients and CT Hounsfield units using radionuclides for SPECT. Appl Radiat Isotopes Sep 2008;66(9):1206–1212. doi: 10.1016/j.apradiso.2008.01.002 [DOI] [PubMed] [Google Scholar]
- 17.Marsh JL. OTA fracture classification. J Orthop Trauma Sep 2009;23(8):551. doi: 10.1097/BOT.0b013e3181ad5e92 [DOI] [PubMed] [Google Scholar]
- 18.Murphy RJ, Armiger RS, Lepisto J, Mears SC, Taylor RH, Armand M. Development of a biomechanical guidance system for periacetabular osteotomy. Research Support, N.I.H., Extramural Research Support, Non-U.S. Gov’t. Int J Comput Assist Radiol Surg Apr 2015;10(4):497–508. doi: 10.1007/s11548-014-1116-7 [DOI] [PMC free article] [PubMed] [Google Scholar]
- 19.Dagnino G, Georgilas I, Morad S, et al. Intra-operative fiducial-based CT/fluoroscope image registration framework for image-guided robot-assisted joint fracture surgery. Int J Comput Assist Radiol Surg May 04 2017;doi: 10.1007/s11548-017-1602-9 [DOI] [PMC free article] [PubMed] [Google Scholar]
- 20.Tomazevic D, Likar B, Pernus F. “Gold standard” data for evaluation and comparison of 3D/2D registration methods. Evaluation Studies Research Support, Non-U.S. Gov’t. Comput Aided Surg 2004;9(4):137–44. doi: 10.3109/10929080500097687 [DOI] [PubMed] [Google Scholar]
- 21.Tomazevic D, Likar B, Slivnik T, Pernus F. 3-D/2-D registration of CT and MR to X-ray images. Comparative Study Evaluation Studies Research Support, Non-U.S. Gov’t Validation Studies. IEEE Trans Med Imaging Nov 2003;22(11):1407–16. doi: 10.1109/TMI.2003.819277 [DOI] [PubMed] [Google Scholar]
- 22.Markelj P, Tomazevic D, Likar B, Pernus F. A review of 3D/2D registration methods for image-guided interventions. Med Image Anal Apr 13 2010;doi:S1361–8415(10)00036–8 [pii] 10.1016/j.media.2010.03.005 [DOI] [PubMed] [Google Scholar]
- 23.Markelj P, Tomazevic D, Pernus F, Likar BT. Robust gradient-based 3-D/2-D registration of CT and MR to X-ray images. IEEE Trans Med Imaging Dec 2008;27(12):1704–14. doi: 10.1109/TMI.2008.923984 [DOI] [PubMed] [Google Scholar]
- 24.Anderson DD, Van Hofwegen C, Marsh JL, Brown TD. Is elevated contact stress predictive of post-traumatic osteoarthritis for imprecisely reduced tibial plafond fractures? J Orthop Res Jul 6 2010;doi: 10.1002/jor.21202 [DOI] [PMC free article] [PubMed] [Google Scholar]
- 25.Varnavas A, Carrell T, Penney G. Fully automated 2D-3D registration and verification. Evaluation Studies Research Support, Non-U.S. Gov’t Validation Studies. Med Image Anal Dec 2015;26(1):108–19. doi: 10.1016/j.media.2015.08.005 [DOI] [PubMed] [Google Scholar]
- 26.Varnavas A, Carrell T, Penney G. Increasing the automation of a 2D-3D registration system. Research Support, Non-U.S. Gov’t. IEEE Trans Med Imaging Feb 2013;32(2):387–99. doi: 10.1109/TMI.2012.2227337 [DOI] [PubMed] [Google Scholar]
- 27.Anderson DD, Chubinskaya S, Guilak F, et al. Post-traumatic osteoarthritis: improved understanding and opportunities for early intervention. J Orthop Res Jun 2011;29(6):802–9. doi: 10.1002/jor.21359 [DOI] [PMC free article] [PubMed] [Google Scholar]
- 28.Anderson DD, Van Hofwegen C, Marsh JL, Brown TD. Is elevated contact stress predictive of post-traumatic osteoarthritis for imprecisely reduced tibial plafond fractures? J Orthop Res Jan 2011;29(1):33–9. doi: 10.1002/jor.21202 [DOI] [PMC free article] [PubMed] [Google Scholar]
- 29.Li W, Anderson DD, Goldsworthy JK, Marsh JL, Brown TD. Patient-specific finite element analysis of chronic contact stress exposure after intraarticular fracture of the tibial plafond. J Orthop Res Aug 2008;26(8):1039–45. doi: 10.1002/jor.20642 [DOI] [PMC free article] [PubMed] [Google Scholar]
- 30.Martin KD, Tripp CT, Huh J. Outcomes of Posterior Arthroscopic Reduction and Internal Fixation (PARIF) for the Posterior Malleolar Fragment in Trimalleolar Ankle Fractures. Foot Ankle Int Feb 2021;42(2):157–165. doi: 10.1177/1071100720955149 [DOI] [PubMed] [Google Scholar]
- 31.Martin KD. Posterior Arthroscopic Reduction and Internal Fixation for Treatment of Posterior Malleolus Fractures. Foot Ankle Int Jan 2020;41(1):115–120. doi: 10.1177/1071100719891978 [DOI] [PubMed] [Google Scholar]
- 32.Cunningham BA, Warner S, Berkes M, et al. Effect of Intraoperative Multidimensional Fluoroscopy Versus Conventional Fluoroscopy on Syndesmotic Reduction. Foot Ankle Int Feb 2021;42(2):132–136. doi: 10.1177/1071100720959025 [DOI] [PubMed] [Google Scholar]