Abstract
Background
The N7-methylguanosine modification (m7G) of the 5′ cap structure in the mRNA plays a crucial role in gene expression. However, the relation between m7G and tumor immune remains unclear. Hence, we intended to perform a pan-cancer analysis of m7G which can help explore the underlying mechanism and contribute to predictive, preventive, and personalized medicine (PPPM / 3PM).
Methods
The gene expression, genetic variation, clinical information, methylation, and digital pathological section from 33 cancer types were downloaded from the TCGA database. Immunohistochemistry (IHC) was used to validate the expression of the m7G regulator genes (m7RGs) hub-gene. The m7G score was calculated by single-sample gene-set enrichment analysis. The association of m7RGs with copy number variation, clinical features, immune-related genes, TMB, MSI, and tumor immune dysfunction and exclusion (TIDE) was comprehensively assessed. CellProfiler was used to extract pathological section characteristics. XGBoost and random forest were used to construct the m7G score prediction model. Single-cell transcriptome sequencing (scRNA-seq) was used to assess the activation state of the m7G in the tumor microenvironment.
Results
The m7RGs were highly expressed in tumors and most of the m7RGs are risk factors for prognosis. Moreover, the cellular pathway enrichment analysis suggested that m7G score was closely associated with invasion, cell cycle, DNA damage, and repair. In several cancers, m7G score was significantly negatively correlated with MSI and TMB and positively correlated with TIDE, suggesting an ICB marker potential. XGBoost-based pathomics model accurately predicts m7G scores with an area under the ROC curve (AUC) of 0.97. Analysis of scRNA-seq suggests that m7G differs significantly among cells of the tumor microenvironment. IHC confirmed high expression of EIF4E in breast cancer. The m7G prognostic model can accurately assess the prognosis of tumor patients with an AUC of 0.81, which was publicly hosted at https://pan-cancer-m7g.shinyapps.io/Panca-m7g/.
Conclusion
The current study explored for the first time the m7G in pan-cancer and identified m7G as an innovative marker in predicting clinical outcomes and immunotherapeutic efficacy, with the potential for deeper integration with PPPM. Combining m7G within the framework of PPPM will provide a unique opportunity for clinical intelligence and new approaches.
Supplementary Information
The online version contains supplementary material available at 10.1007/s13167-022-00305-1.
Keywords: Predictive preventive personalized medicine (PPPM / 3PM), N7-methylguanosine modification, Pan-cancer analysis, Tumor microenvironment, Immune regulation, Immunotherapy, Multi-omics, Single-cell transcriptome sequencing, Machine learning, Protein-protein interaction analysis
Introduction
The current critical situation of cancer prevention and control
The growing global economy and changing lifestyles of people have made humans susceptible to chronic diseases such as cancer. Chronic diseases have replaced infectious diseases as a major threat to human health worldwide. Currently, cancer is the second leading cause of death universally, with approximately one-sixth of global deaths caused by cancer [1]. In 2020, 19.29 million new cancer cases occurred, resulting in 10 million deaths. Of these, 1.8 million deaths were caused due to lung cancer, which ranks first in cancer deaths. The number of surging cancer patients poses a major economic and health policy challenge. Thus, improving early detection techniques for cancer to carry out treatments with a refined prognosis could increase the chances of cure, reduce the harm of tumors, and prolong cancer patient survival period. Therefore, in-depth research is needed to identify basic molecular mechanisms of specific cancer-causing genes [2] to find cancer diagnostic targets and drugs with a good prognosis.
The role of pan-cancer analysis in context of predictive, preventive, and personalized medicine
Since the concept of predictive, preventive, and personalized medicine (PPPM) was introduced in malignancy, the prevention, drug resistance monitoring, and genomic-guided therapy have all improved considerably. Genomic-guided therapies have made great strides in cancer treatment. Cancer screening methods and genomic sequencing-based prediction of therapeutic targets have provided reliable evidence for early diagnosis and individualized medicine [3]. In the past 5 years, “personalized medicine” has advanced from the era of targeting specific mutations in specific cancers to the era of targeting specific genes in pan-cancer. Keytruda became the world’s first pan-cancer immune drug [4] and larotrectinib is the world’s first targeted drug that does not discriminate the origin of the tumor for initial treatment [5], bringing new hope and choice to both doctors and patients in the global oncology community.
The pan-cancer analysis aims to examine varied genomic and cellular changes found in different tumor types. The method could indicate shared characteristics and heterogeneity in multiple malignant tumors. Previous single-gene pan-cancer studies have revealed that aberrant expression of PXN and HSF1 genes is associated with poor prognosis in many tumor types [6], whereas CD161 and GIMAP7 expression are associated with the clinical treatment of tumors and may be therapeutic targets for tumor immunization and acts as protective factors [7].The increased dataset of tumor samples analyzed across various tumor types has improved the ability to detect and analyze several molecular defects, and aberrations in tumor genomes [8] and phenotype for better identification immunodetection and treatment sites for a variety of cancers. In this case, patients will be classified according to their genetic and biological background and differences. Tailored preventive and/or therapeutic strategies are carried out, rather than generic ones [9].
The important role of m7G in physiological functions and tumors
N7-methylguanosine modification (m7G) is one of the most abundant modifications in the mRNA 5′ cap structure [10]. The m7G methylation compounds include METTL1 (methyltransferase-like 1) and WDR4 (WD repeat domain 4) [11] and mutations in WDR4 can cause primitive dwarfism. Further, it is observed that overexpression of WDR4 can affect learning and memory in patients with Down’s syndrome. It is worth paying attention to that aberrant expression of METTL1 has been associated with a range of cancers and the potential role of m7G modification catalyzed by it in different tumors is different. It acts as a tumor suppressor in colon cancer by stimulating the m7G-regulated let-7e miRNA/HMGA2 axis. Mature let-7e with m7G modification downward adjusts the stability and translational efficiency of target HMGA2 mRNA, inhibiting the migration and proliferation of lung cancer cells by reducing HMGA2 levels [12]. The let-7e miRNA inhibits a variety of cancers, such as the bladder [13], breast [14], and colon [15]. In opposite, METTL1 also can be associated with poor prognosis in neuroblastomat [16], lung adenocarcinoma [17], and hepatocellular carcinoma [17]. This effect may be achieved by reducing the expression of NBL oncogenes, inhibiting AKT/mTORC1 pathway and PTEN signaling by reducing m7G tRNA modification and selectivity, respectively. In addition to m7G methylation compounds, m7G-regulated LncRNAs have also shown a surprising correlation with the prognosis of hepatocellular carcinoma [18]. Current studies have shown that m7G can be used as a classification index of KIRC, and the group with high m7G score has better immune activation, lower tumor purity, and immunotherapy prognosis than others [19]. All these indicate that the m7G score has a strong potential to become a universal prognostic indicator of immunotherapy.
Accurate prognostic models are of great significance in tumor immunotherapy. However, there is no prognostic model based on m7G regulatory genes and their scores. Therefore, it is essential to explore the effect of m7G on the tumor immune microenvironment and the prognosis of tumor immunotherapy at the tumor cell and molecular levels.
Working hypothesis in the framework of PPPM
We hypothesized that m7G is significantly associated with tumor internal characteristics and microenvironment, and high expression of m7G is associated with poor tumor prognosis. It is a potential prognostic and treatment marker that can be used for stratification, prognosis prediction, and individualized management of cancer patients. To further improve the clinical utility of the m7G score, we will construct a predictive model for the m7G score using clinically easily accessible H-E-stained pathological sections and construct a prognostic model for pan-cancer based on the m7G score. It will promote the application of the m7G score in the framework of PPPM.
Study design
The gene expression, genetic variation, clinical information, methylation, and digital pathological section from 33 cancer types were downloaded from the TCGA database (https://www.cancer.gov/about-nci/organization/ccg/research/structural-genomics/tcga). We first analyzed the interactions of m7G regulatory genes (m7RGs) and correlations with copy number variation, clinical features, and methylation. We then constructed the m7G score and analyzed the m7G score in relation to clinical features, TMB, MSI, tumor immune dysfunction and exclusion (TIDE) score, immune-related genes, immune checkpoints, and tumor-specific total mRNA expression (TmS). To facilitate the acquisition of m7G scores, we further constructed a predictive model for m7G scores based on digital pathology sections. Considering the importance of the m7G score to the PPPM model and for the clinical dissemination of the m7G score, a clinical prognostic model based on the m7G score was constructed and developed as an online tool. Finally, we used IHC and single-cell transcriptome sequencing (scRNA-Seq) to validate the m7G regulatory key genes and m7G scores.
Expected impacts in the framework of PPPM
How to accurately assess the prognosis of cancer patients and benefit from immunotherapy has attracted great attention in the field of cancer therapy. Under the traditional reactive cancer treatment model, the exploration of novel immunotherapy strategies has not achieved the expected clinical benefits. In addition, in the absence of effective markers, the application of immunotherapy may not only be ineffective, but also increase the side effects and economic burden of patients. Therefore, this study aims to evaluate the correlation of m7G regulatory genes and m7G score with tumor molecular and clinical characteristics in different tumors, evaluate their correlation with tumor immune tumor response, and finally construct a prognostic model based on m7G score. The results of this study can achieve prognostic stratification and immunotherapy sensitivity prediction of cancer patients. This will optimize patient-specific treatment strategies, improve the efficiency of immunotherapy, and reduce the cost of treatment. These findings have improved strategies for targeted prevention and personalized treatment of tumors and facilitated a paradigm shift from passive care to PPPM.
Methods
Single-cell transcriptome sequencing data analysis
The preparation and data analysis of scRNA-Seq was performed as previously described [20]. The single-cell sequencing datasets was stored in GEO database (https://www.ncbi.nlm.nih.gov/geo/) (GSE152938). In brief, fresh tumor samples were obtained from the operating room to the laboratory in cold Hank’s balanced salt solution. After the samples were washed and were cut into 2–4-mm pieces. The tissue species were digested for 30 min at 37 °C with gentle agitation in a digestion solution in HBSS. Samples were washed and filtered, erythrocytes were removed, and cell viability was assayed before single-cell sequencing. Two kidney renal clear cell carcinoma (KIRC) samples were collected from patients undergoing radical nephrectomy. The patients were not receiving any anti-tumor treatment therapy prior to sampling, including chemotherapy, radiotherapy, immunotherapy, and Chinese medicine. All samples were sequenced using the Hiseq X10 (Illumina, San Diego, CA) with standard parameters. Preliminary sequencing files (.bcl) were converted to FASTQ files on CellRanger (version 3.0.2). R (version 3.5.2) and Seurat R package (version 3.1.1) were used for quality control (QC) and secondary analysis.
Paraffin-embedded tissue collection
Paired cancers and paracancerous tissues were derived from 35 breast cancer patients from the Affiliated Cancer Hospital of Guangxi Medical University, respectively. All patients were diagnosed with breast cancer and had not received chemotherapy or radiotherapy before tissue collection. Written informed consent was acquired from all patients. The study was approved by the Ethics and Anthropology Committee of the Affiliated Cancer Hospital of Guangxi Medical University. All experiments and methods were performed in accordance with relevant guidelines and regulations.
Immunohistochemical staining
All cancer specimens were immersed in formalin. Before staining, tissues were cut to 5-μm thickness and placed on glass slides. Endogenous peroxidase activity was inhibited and blocked by de-paraffinizing, rehydrating, and using 5% bovine serum albumin at 37 °C for 30 min. The treated sections were incubated with anti-EIF4E (Abmart T58863M) at 4 °C overnight and washed three times with PBS. After that, incubation with secondary anti-peroxidation sunflower at 37 °C for 30 min is required. After washing three times again with PBS, the sections were developed in diaminobenzidine and microscopic images were made by light microscopy.
Dataset acquisition and preprocessing
The gene expression in normal tissue from healthy individuals was analyzed using the genotype-tissue expression (GTEx) dataset (V7.0) (https://commonfund.nih.gov/GTEx/) [21]. The tumor-associated data including cope number variation (CNV), single nucleotide variation (SNV), mRNA Seq, and clinical and methylation data were collected from The Cancer Genome Atlas (https://portal.gdc.cancer.gov/) [22, 23]. Further, the Genomics of Drug Sensitivity in Cancer (GDSC) database (www.cancerrxgene.org) was used to investigate the correlation between m7G methylation and drug sensitivity [24]. The 33 solid cancer types were studied, including adrenocortical carcinoma (ACC), bladder urothelial carcinoma (BLCA), breast invasive carcinoma (BRCA), cervical squamous cell carcinoma and endocervical adenocarcinoma (CESC), endocervical carcinoma (CHOL), colon adenocarcinoma (COAD), lymphoid neoplasm diffuse large B cell lymphoma (DLBC), esophageal carcinoma (ESCA), glioblastoma multiforme (GBM), head and neck squamous cell carcinoma (HNSC), kidney chromophobe (KICH), kidney renal clear cell carcinoma (KIRC), kidney renal papillary cell carcinoma (KIRP), acute myeloid leukemia, brain low-grade glioma (LGG), liver hepatocellular carcinoma (LIHC), lung adenocarcinoma (LUAD), lung squamous cell carcinoma (LUSC), mesothelioma (MESO), ovarian serous cystadenocarcinoma (OV), pancreatic adenocarcinoma (PAAD), pheochromocytoma and par glioma (PCPG), prostate adenocarcinoma (PRAD), rectum adenocarcinoma (READ), sarcoma (SARC), skin cutaneous melanoma (SKCM), stomach adenocarcinoma (STAD), testicular germ cell tumors (TGCT), thyroid carcinoma (THCA), thymoma (THYM), uterine corpus endometrial carcinoma (UCEC), uterine carcinosarcoma (UCS), and uveal melanoma (UVM) (Supplementary Table 1).
Pathological image acquisition and feature extraction
Hematoxylin and eosin–stained histopathology slides were obtained through TCGA via the Genomic Data Commons Data Portal (https://portal.gdc.cancer.gov/), which included 10,452 patients from 28 cancer types. We cropped the entire slide into a 512 pixel × 512 pixel tile with a 50 pixel overlap and a magnification of 20 × [25]. Features of those tiles were extracted with a free open-source tool called CellProfiler [26]. CellProfiler is a high-throughput biomedical image analysis software that can quantify a wide range of biological problems, including basic analysis (e.g., cell counts, cell size, intracellular protein levels) and complex morphological analysis (e.g., cell or organelle shape, subcellular patterns of DNA or protein coloring). Compared with deep learning algorithms [25], the features extracted by CellProfiler are more interpretable. CellProfiler performed pre-processing operations such as correction on each digital pathology image; secondly, it uses the Watershed algorithm to segment and identify cells in the digital pathology images; and finally, it measures various metric features such as counting the number of nuclei, measuring the size of nuclei, extracting nuclei and cytoplasmic textures, and calculating their distribution.
Machine learning–based pathomics model construction
Two machine learning methods, random forest (RF) and extreme gradient boosting tree (XGBoost), were used to construct pathomics-based prediction models respectively. Regression models are now commonly used to screen for risk factors, but covariance between independent variables and a dramatic increase in the dimensionality of the data can lead to biased or invalid model estimates. XGBoost (https://xgboost.ai/) is an integrated learning method based on Boosting trees, in which weak classifiers are iteratively computed so that the algorithm’s loss function decreases in the direction of its gradient to achieve accurate classification results. XGBoost and Random Forest can handle complex data variable interactions and co-linear problems, avoiding overfitting of the model and calculating the contribution of each variable to the model to determine the degree of influence of the variable. Applying the Python Scikit-learn (https://scikit-learn.org/stable/; v.0.18) toolkit to build and evaluate models. The top 20 variables were selected for model building using “SelectKBest” to rank the importance of the variables. Application of fivefold cross-validation and random search (RandomizedSearchCV, scoring = “accuracy”) to select the best parameters for the model. Evaluation of model accuracy using ROC curves.
Survival curves analysis
Kaplan–Meier survival curves were generated based on differences in m7G expression in various cancers using the R package “Survival” (https://www.rdocumentation.org/packages/survival) to investigate the relationship between m7G scores and overall survival (OS), progression-free survival interval (PFI), and disease-specific survival (DSS) [27]. p values were calculated for the log-rank test, and the values less than 0.05 were considered statistically significant.
Methylation and CNV analysis
The tumor and non-tumor samples from 33 cancer types were analyzed for methylation pattern. The mRNA expression and methylation data were coalesced by the TCGA barcode (https://docs.gdc.cancer.gov/Encyclopedia/pages/TCGA_Barcode) [23]. Next, the correlation between m7G gene methylation and mRNA expression level in each cancer type was analyzed according to Pearson’s product-moment correlation coefficient (https://statistics.laerd.com/features-overview.php). CNV raw data were collected from 33 cancer types and processed by GISTIC 2.0 (www.genepattern.org/modules/docs/GISTIC_2.0) [28]. Further, depending on the occurrence of CNV on one or two chromosomes, the CNV was divided into heterozygous and homozygous CNV subtypes. Meanwhile, the percentages of homozygous or heterozygous CNV were shown in the CNV profile, containing CNV amplification and deletion percentages of each gene. Next, the correlations of CNV with mRNA expression were detected based on Pearson’s product-moment correlation coefficient. We used GSCALite to analyze and present the data [29].
Evaluation of m7G score
The m7G score was calculated based on the single-sample gene-set enrichment analysis (ssGSEA) [30] using the m7G regulator gene list downloaded from the GSEA database (https://www.gsea-msigdb.org/gsea/datasets.jsp) to quantify the levels of m7RGs for each cancer (Supplementary Table 2) [19, 31, 32]. ssGSEA, an extension of GSEA, calculates separate enrichment scores for each pairing of a sample and gene set. Each ssGSEA enrichment score represents the degree to which the genes in a particular gene set are coordinately up- or downregulated within a sample. ssGSEA is now widely used in tumor research [33, 34]. Thus, the m7G score was a proxy for the expression of the m7G regulator gene in a single tumor sample.
Correlation analysis between m7G and tumor immune invasion
The TIMER (https://cistrome.shinyapps.io/timer/) and GEPIA (gepia.cancer-pku.cn) database provided a crucial assessment and integration of immune cells for RNA sequencing samples from TCGA [35, 36]. The correlation between m7G scores and the abundance of B cells, CD4+ T cells, CD8+ T cells, neutrophils, macrophages, and dendritic cells (DCs) were analyzed using Pearson correlation coefficients.
Pathway exploration for m7G in pan-cancer
Numerous databases were searched to explore the functions and pathways of m7G in pan-cancer. To avoid the limitation of tumor heterogeneity, CancerSEA (https://ngdc.cncb.ac.cn/databasecommons/database/id/6092) database was used to search distinct functional states of specific genes in varied cancer types of the single-cell level. [37]. Meanwhile, we performed the CancerSEA database to explore the correlation between the m7G and functional states in various cancers.
TIDE analysis
Potential ICB response was predicted using the TIDE algorithm (tide.dfci.harvard.edu) [38]. TIDE estimates two distinct mechanism of tumor immune evasion, including the dysfunction of tumor infiltration cytotoxic T lymphocytes (CTL) and exclusion of CTL by immunosuppressive factors. A high TIDE score means that patients have a higher chance of immune escape from tumors and thus exhibit a lower rate of ICB response.
Measurement of Tumor-specific total mRNA expression
DeMixT (version 1.2.2) is a freely available R package developed by Cao et al. [39], which is a model-based quantification of total mRNA expression in bulk tissue. We used it for estimating tumor-specific mRNA expression (TmS), following the officially recommended parameters.
Feature Selection and m7G Nomogram construction
Features included in the nomogram were selected in two steps. First, univariate Cox regression analyses were conducted to screen for features significantly related to OS. Features with a p-value < 0.05 in the univariate analysis were selected. The selected features were then used in the least absolute shrinkage and selection operator (LASSO) regression algorithm. Dummy variables were created for categorical variables. Cross-validation was used to confirm suitable tuning parameters (λ) for LASSO logistic regression. Finally, the most significant features were selected by LASSO. Variables with non-zero regression coefficients under the minimum penalty coefficient of the lasso regression were entered into a multivariate COX regression [40]. Independent prognostic factors in the multivariate COX regression model were used for COX prognostic model construction, and the prognostic model was presented using nomogram and deployed as an online pan-cancer prognostic tool (https://pan-cancer-m7g.shinyapps.io/Panca-m7g/).
Statistical analyses
Spearman’s correlation test (https://www.statisticssolutions.com/free-resources/directory-of-statistical-analyses/correlation-pearson-kendall-spearman/) was used to evaluate the correlation between m7G- related gene expression [41]. The prognostic indicators were assessed by Kaplan–Meier survival curves and compared by a log-rank test [42]. The hazard ratio was calculated using the Cox proportional hazards model [43], and the R (version 3.4.4) was used to perform all statistical analyses and the p-value < 0.05 was considered statistically significant.
Construction of m7G regulation network and protein–protein interaction analysis
The m7RGs were imported into the STRING database (https://string-db.org/) for protein–protein interaction (PPI) analysis, the txt file was downloaded and copied to Excel for annotation, and then imported into Cytoscape (https://cytoscape.org) software to draw the hub-genes PPI network diagram. The network analysis function of Cytoscape is used to analyze the linkage between genes, and a gene is defined as a hub gene when its degree exceeds that of other genes. The sources of multi-omics data are shown in Supplementary Table 3.
Results
Differential expression of m7G regulator genes in cancers and paracancer and its impact on prognosis
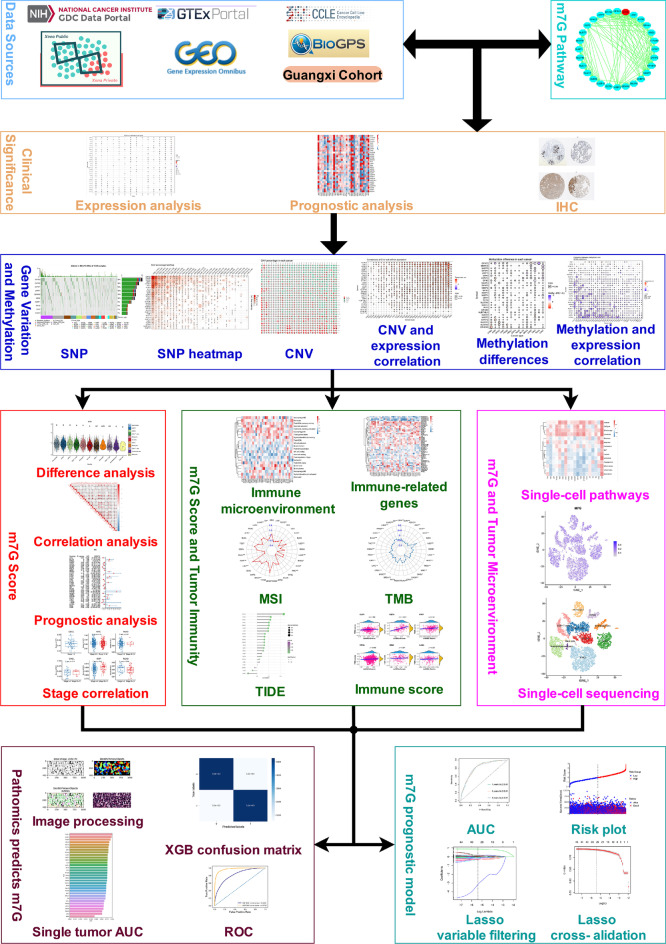
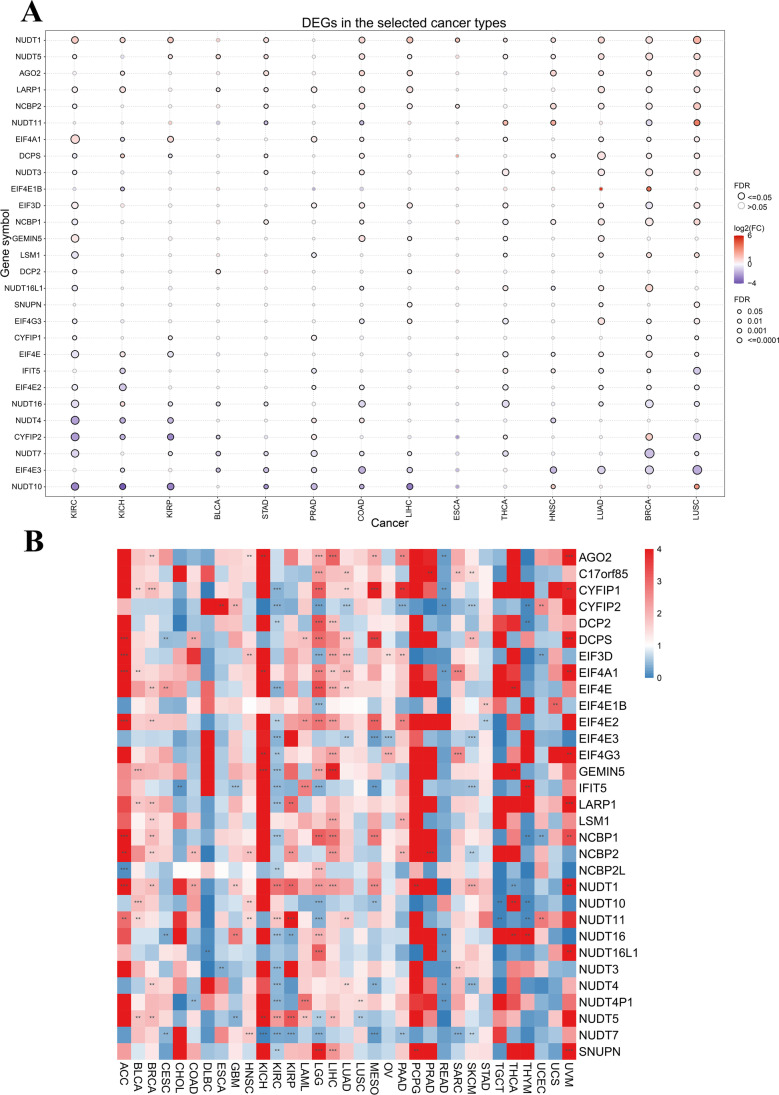
The data sources and the main structure of the article are shown in the flow chart (Fig. 1). Overall, NUDT11 and NUDT10 were significantly lowly expressed in most tumors, while most genes were significantly highly expressed in LGG and PAAD. Meanwhile, EIF4E1B was significantly overexpressed in GBM, and GEMIN5 was significantly overexpressed in DLBC and THYM whereas NUDT4P1 expression was significantly repressed in LGG and GBM (Fig. 2A). Further, the relationship between multiple gene expression and tumor prognosis was analyzed, and found that the expression of EIF4E2 and NUDT11 genes may be a risk factor and expression of CYFIP2 and IFIT5 genes may be a protective factor (Fig. 2B).
Fig. 1.
Flow chart of this study. The sources of data and the main article structure are shown here
Fig. 2.
Differential expression of m7G regulator genes in pan-cancer and the impact on prognosis. A Differential expression of m7RGs. The blue dots indicate low gene expression in the tumor and the red dots represent high gene expression in tumors. B Heat map of m7RGs expression in different cancers. *p < 0.05, **p < 0.01, ***p < 0.001
CNV and SNP of m7G regulator genes
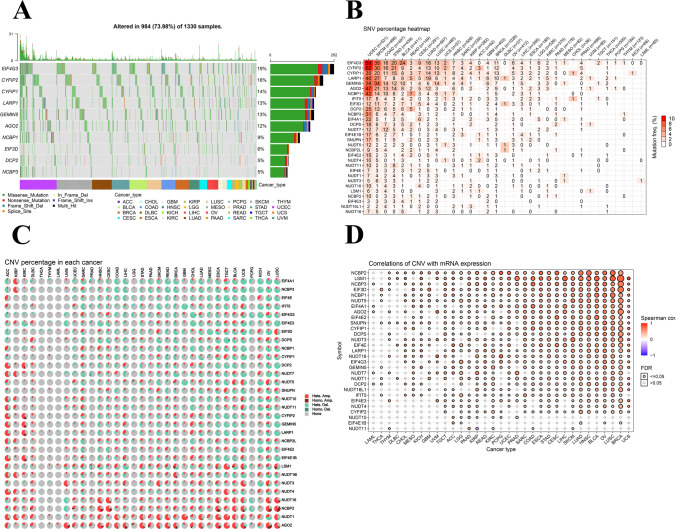
m7RG SNP data were analyzed to detect the frequency of each cancer subtype and the variation type. Analysis of 1330 tumors revealed that the SNV frequency of regulatory factors was 73.98% (984 cases) with SNV frequencies of 19%, 16%, and 5%, for EIF4G3, CYFIP2, and CYFIP1, respectively. The seven major SNP variants of regulatory factors identified in different cancer subtypes were missense mutation, nonsense mutation, frame shift del, splice site, in frame del, frame shift ins, and multi hit. In UCEC, MESO LUAD, and STAD, the modulation factor SNV frequency increases (Fig. 3A). The SNV percentage graph analysis demonstrated that EIF4G3 and CYFIP2 were 53% and 52% in UCEC, respectively (Fig. 3B). Next, the CNV variation of m7G at the chromosome arm level was determined based on the CNV data of m7G in the TCGA database. It was observed that most genes underwent CNV amplification or deletion in 33 tumors. Meanwhile, ELF4A1 had 60% heterozygous amplification in KIRP and > 50% heterozygous deletion in COAD, and LUSC. Similarly, NUDT16 had > 50% heterozygous deletion in UVM and PCPG, and nearly 50% heterozygous amplification in HNSC, and LUSC. Thus, it was concluded that CNV of m7G mediates cancer-related gene aberrant expression and may play an important role in most cancers (Fig. 3C). Correlation studies comparing mRNA expression with CNV explained that mRNA expression of each regulator was positively correlated with the CNV in most cancers (p < 0.05), while the expression of NUDT11 in KIRP, DCPS in THYM, NUDT10 in LGG, KIRP, and PCPG was negatively correlated with CNV (p < 0.05) (Fig. 3D).
Fig. 3.
CNV and SNP of m7G regulator genes. A SNV oncoplot. The cancer map shows the distribution of m7G mutations and the classification of SNV types (e.g., missense mutations, frame-shift loss, and nonsense mutations). Selected cancer samples are displayed together with a side and top bars showing the number of variations in each sample or gene. B The SNV frequency of genes in cancers. The darker the color, the higher the mutation frequency. Numbers represent the percentage of samples that have the corresponding mutated gene for a given cancer. 0 indicates that there was no mutation in the gene coding region, and no number indicates that there was no mutation in any region of the gene. C CNV pie charts in 33 cancers. The combined heterozygous or homozygous CNVs for each gene in different cancer types are shown in the CNV pie chart. D CNV correlation with mRNA expression. The association between paired mRNA expression and CNV percentage in samples was based on a Pearson product-moment correlation coefficient. The size of the point represents the statistical significance, the bigger the dot size, the higher the statistical significance
Methylation of m7G regulator genes and their correlation with expression
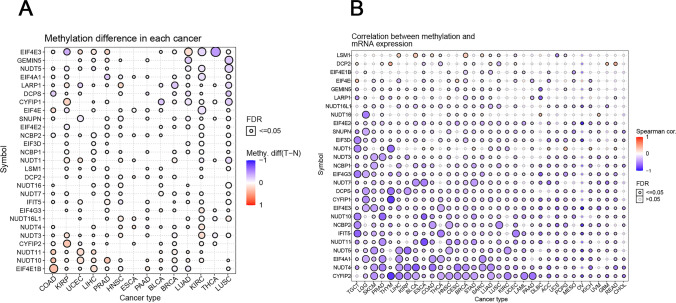
The methylation status of m7RGs was investigated to demonstrate the corresponding epigenetic methylation levels of m7RGs. EIF4E3 in KIRP, and EIF4E in KIRP, and KIRC were hypermethylated (p < 0.05). However, the EIF4E1B in COAD, LIHC, and PAAD was significantly hypermethylated (p < 0.05) (Fig. 4A). Further, correlation analysis between methylation levels and mRNA showed that most genes were negatively correlated with methylation in tumors (p < 0.05). For example, the expression of CYFIP2 and CYFIP1 in THYM had a significant negative correlation with methylation. While NUDT1 in PCPG and DCP2 in THYM showed a positive correlation with methylation (p < 0.05) (Fig. 4B).
Fig. 4.
Methylation of m7G regulator genes and their correlation with expression. A Methylation difference of m7RGs in pan-cancer. Blue dots represent hypomethylation and red dots represent hypermethylation. The solid circles represent FDR < 0.05, namely p < 0.05, significant correlation. B Correlation between mRNA expression and methylation. Negative correlation is indicated by blue dots and positive correlation is indicated by red dots. The bluer the color, the stronger the negative correlation, and the redder the color, the stronger the positive correlation
Drug sensitivity analysis
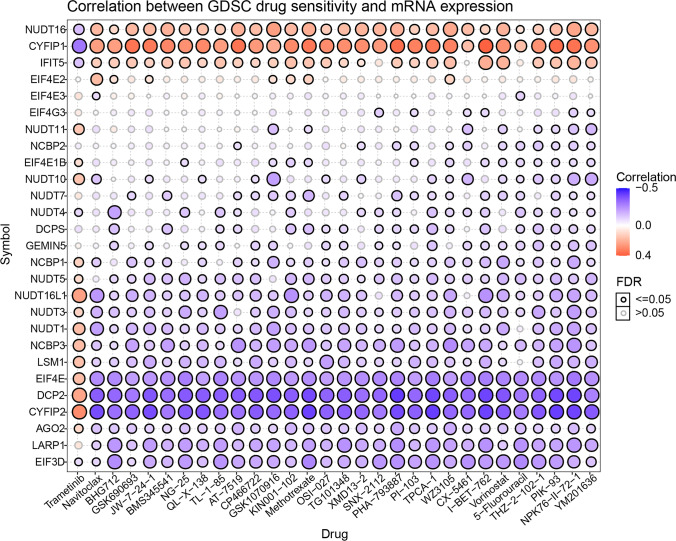
The drug sensitivity and mRNA expression profile data from GDSC were collated to understand the role of m7G in chemotherapy or targeted therapy. Correlation analysis revealed that the drug trametinib was resistant to NUDT11 and EIF4E1B. The drugs PIK-93, NPK76-II-72–1, and YM201636 were sensitive to most genes, except NUDT16, CYFIP1, and IFIT5. Thus, it was concluded that m7G aberrant expression may mediate sensitivity to targeted drug therapy and chemotherapy (Fig. 5).
Fig. 5.
Correlation between GDSC drug sensitivity and mRNA expression. Blue represents a negative correlation, suggesting higher the gene expression, the lower the drug amount required, and the higher the sensitivity
Differential expression of m7G score and the correlation with staging
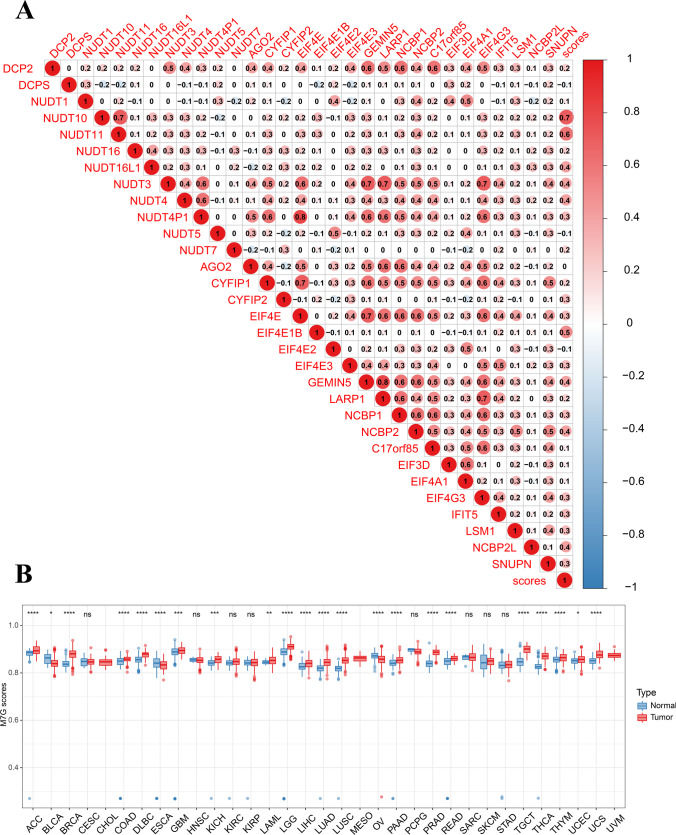
Correlation analysis of 32 genes revealed that m7G scores were positively correlated with gene expression and could represent the expression mechanism and m7G scores for subsequent analysis. Moreover, DCP2 positively correlated with NUDT3, GEMIN5, and LARP1 (Fig. 6A). Meanwhile, m7G showed higher expression in ACC, BRCA, and COAD (Fig. 6B). Further, the expression level analysis of 27 tumors demonstrated a decrease in m7G expression of READ (p = 0.045) in tumor stages III and IV. Similarly, we observed an increase in m7G expression for BRCA (p = 0.042), OV (p = 0.043), KIRP (p = 0.01), and UCS (p = 0.013) in tumor stage III and IV. However, no data was available for CESC and DLBC tumor stages III and IV (Supplementary Fig. 1).
Fig. 6.
Differential expression of m7G score and the correlation with staging. A Correlation between m7RGs and m7G score. Red is positive, blue is negative, and the darker the color, the stronger the correlation. B m7G score was analyzed by combining GTEX and TCGA databases. The box line represents the average value. The box line of the red box block is higher than that of the blue box block, indicating a positive correlation and vice versa
Effect of m7G score on prognosis
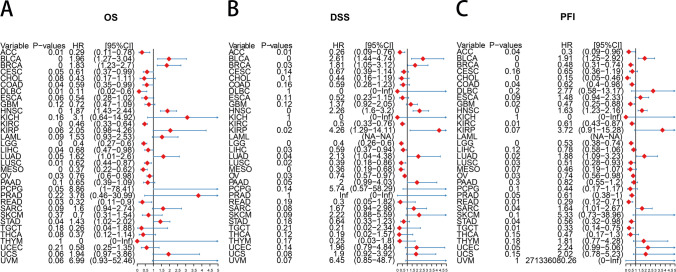
Analysis of m7G scores for OS showed that m7G was found to be a risk factor in BLCA (p = 0.003), BRCA (p = 0.003), HNSC (p < 0.001), LUAD (p = 0.047), and STAD (p = 0.04) (Supplementary Fig. 2). For DSS, m7G was considered a risk factor in BLCA (p = 0.002), BRCA (p = 0.034), HNSC (p < 0.001), LUAD (p = 0.039), and KIRP (p = 0.018) (Supplementary Fig. 3). Similarly, m7G was considered a risk factor for PFI in BLCA (p = 0.003), HNSC (p = 0.001), LUAD (p = 0.023), and SARC (p = 0.045) (Supplementary Fig. 4). Moreover, the prognostic value of m7G from OS was assessed and found that m7G was significantly associated with poor prognosis in BLCA (p = 0), BRCA (p = 0), HNSC (p = 0), and STAD (p = 0.04) (Fig. 7A). Meanwhile, for DSS, higher m7G expression was significantly associated with poor prognosis in 5 of 33 tumors (Fig. 7B). Similarly, the results for PFI showed that high m7G expression in 4 of 33 tumors was significantly associated with worse PFI. These results suggest that m7G may be an independent prognostic marker for various tumors (Fig. 7C).
Fig. 7.
Effect of m7G scores on prognosis. A OS forest map of m7G score. B DSS forest map of m7G score. C PFI forest map of m7G score
The function of m7G score was analyzed at a single-cell level
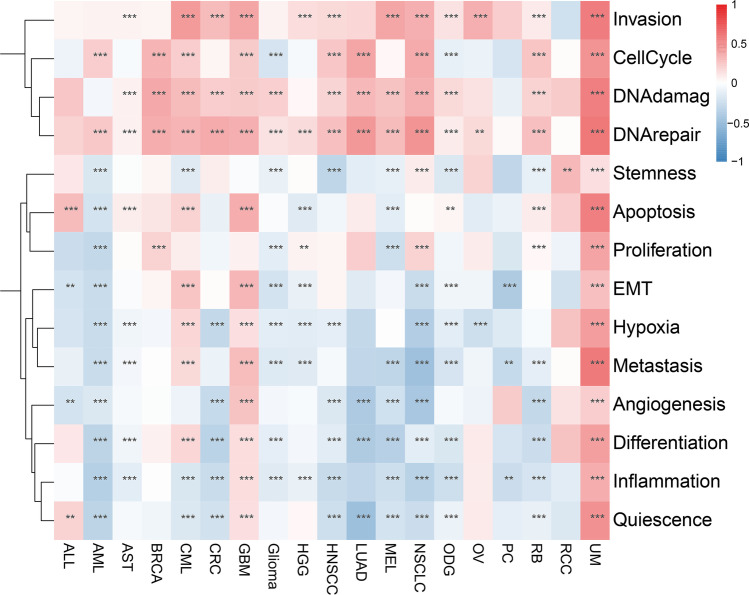
In most tumors, m7G scores were observed to be associated with invasion, cell cycle, DNA damage, and DNA repair, especially in UM, suggesting m7G methylation scores may be an important factor for tumor invasion and metastasis. It has been observed that genomic invasion, cell cycle, DNA damage, DNA repair, stemness, apoptosis, proliferation, EMT, hypoxia, metastasis, angiogenesis, differentiation inflammation, quiescence promoted m7G function in UM tumors, genomic invasion, cell cycle, DNA damage, DNA repair, apoptosis, EMT, hypoxia, metastasis, angiogenesis differentiation, inflammation, and quiescence may promote m7G function in GBM tumors, while genomic stemness, apoptosis, proliferation, EMT, hypoxia, metastasis, angiogenesis differentiation, inflammation, and quiescence inhibited m7G function in AML tumors (Fig. 8).
Fig. 8.
Single cell level functional analysis of m7G. The darker the color, the stronger the correlation. *p < 0.05, **p < 0.01, ***p < 0.001
Relationship between m7G score and tumor immune microenvironment
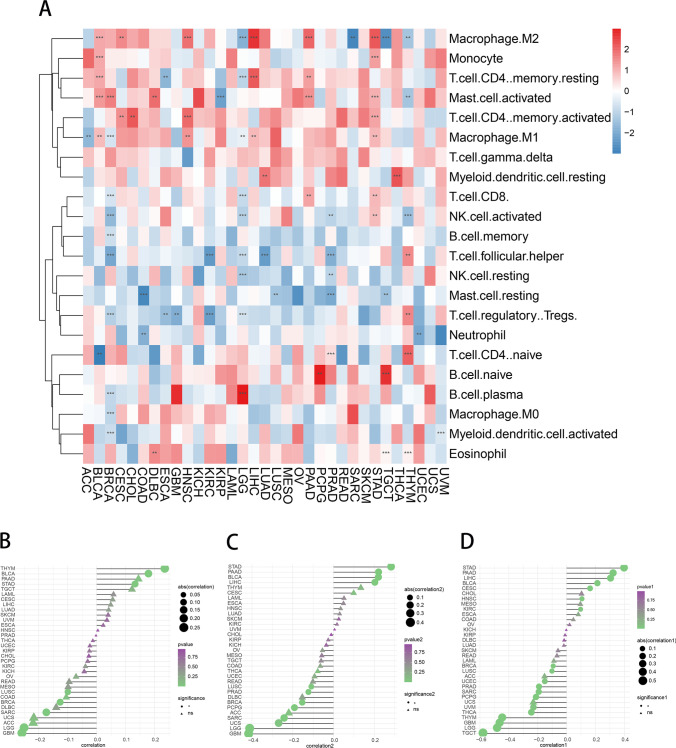
To investigate the relationship between m7G and tumor immune cells, the abundance of 22 immune cells was counted and m7G was found to be significantly positively correlated with macrophage M2, monocyte, T cell CD4 memory resting, activated mast cell, memory activated T cell CD4, and macrophage M1. In addition, m7G was significantly negatively correlated with activated NK cell, memory B cell, T cell follicular helper, NK cell resting, mast cell resting, and T cell regulatory Tregs. Similarly, m7G was significantly negatively correlated with neutrophils. (Fig. 9A). However, the m7G scores were significantly positively correlated with immune scores in THYM, BLCA, and STAD and significantly negatively correlated in LUSC and BRCA (Fig. 9B). Similarly, the m7G score was significantly positively correlated with tumor microenvironment score in STAD and PAAD and negatively correlated with tumor microenvironment score in LUSC and PRAD (Fig. 9C). Moreover, the m7G scores of patients with KIRC, HNSC, and STAD were negatively correlated with tumor microenvironment scores, and the m7G scores of patients with TGCT, LGG, and BRCA were significantly positively correlated with interstitial scores. These results suggest that m7G expression is associated with the tumor immune microenvironment and may be a potential marker for immune therapy (Fig. 9D).
Fig. 9.
Relationship between m7G score and tumor immune microenvironment. A Correlation analysis of m7G tumor-infiltrating immune cells. *p < 0.05, **p < 0.01, ***p < 0.001. B–D Immune score, microenvironment score, and stroma score of m7G. The triangle indicates no statistical significance, while the circle indicates statistical significance. The greater the absolute value of the score, the higher the correlation
Relationship between m7G score and immune-related gene
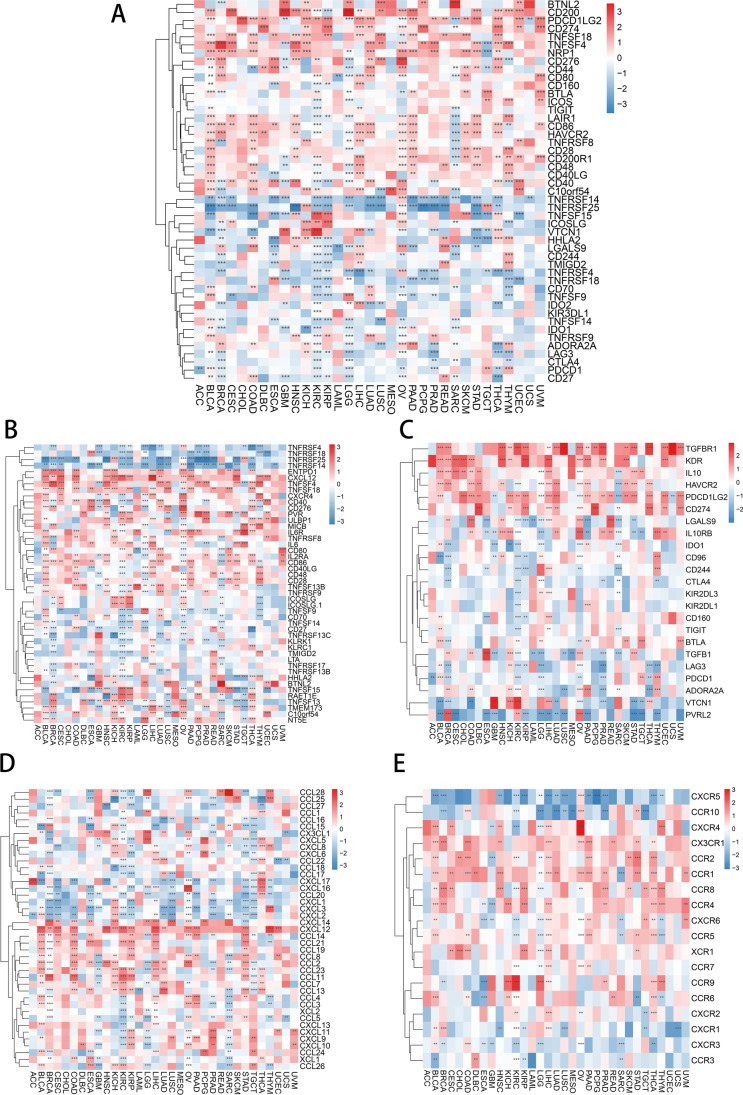
Next, the correlation studies between m7G scores and checkpoints revealed that m7G expression was significantly positively correlated with CD200 and PDCD1LG2, and negatively correlated with TNFRSF14 and TNFRSF25. The negative correlation between m7G and TNFRSF14 was present in most tumors except OV (p < 0.05) (Fig. 10A). The correlation analysis between m7G scores and immune activation gene expression found that m7G expression was positively correlated with ENTPD1 and CXCL12 in most tumors and negatively correlated with TNFRSF25 and TNFRSF14 in LUAD (p < 0.05) (Fig. 10B). For immunosuppressive genes, m7G expression was found to be positively correlated with TGFBR1 and KDR and negatively correlated with PVRL2 in most tumors (p < 0.05) (Fig. 10C). Further investigation demonstrated the specificity of m7G expression in pan-cancer and chemokines and their receptors and showed that chemokines CXCL14 and CXCL12 were positively correlated with m7G expression in most cancers (p < 0.05) (Fig. 10D). In addition, the chemokine receptors CX3CR1, CCR2, and CCR1 showed a positive correlation to m7G expression (p < 0.05) (Fig. 10E).
Fig. 10.
Relationship between m7G score and immune regulator gene. A Correlation analysis of m7G scores with immune checkpoints gene expression. B Correlation analysis of m7G score and immune activation gene expression. C Correlation analysis of m7G scores and immunosuppressive gene expression. D Correlation analysis of m7G scores with chemokines. E Correlation analysis of m7G scores with chemokine receptors. The colors range from blue to red, indicating the degree of correlation between tumor and related factors. The number of * indicates the degree of correlation
Correlation between m7G score and markers of immunotherapy response
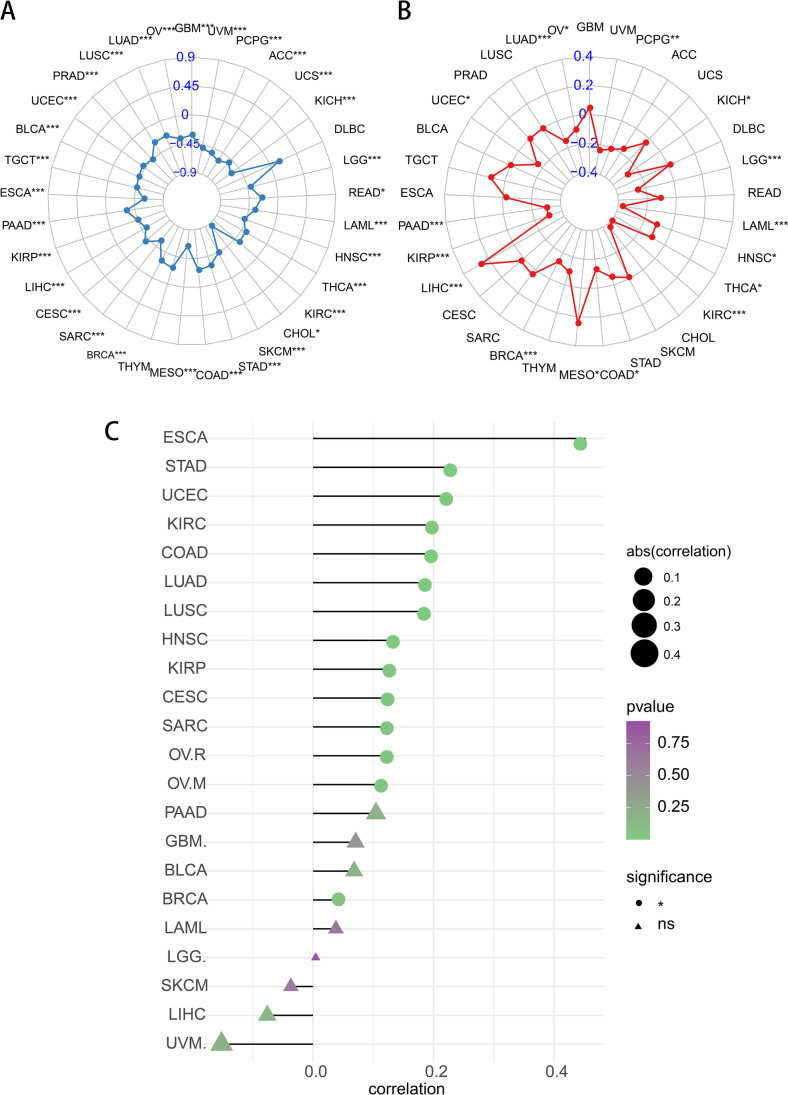
m7G expression was significantly positively correlated with high TMB in DLBC only and negatively correlated in most tumors (Fig. 11A). Meanwhile, the m7G expression was significantly positively correlated with MSI in LIHC, MESO, and a weak positive correlation was observed in TGCT, CESC, and GBM (Fig. 11B). For TIDE scores, m7G expression was significantly positively correlated with high TIDE in ESCA and STAD (Fig. 11C). TIDE correlation analysis showed that m7G score was significantly positively correlated with TIDE scores in BLCA and ESCA, while m7G expression was significantly negatively correlated with TIDE scores in UVM, LIHC, and SKCM (Supplementary Fig. 5).
Fig. 11.
Correlation between m7G score and markers of immunotherapy response. A, B Correlation between m7G score and TMB (A) and MSI (B). The more outward spread of the dots and lines, the higher the correlation score of related tumors. C Correlation between m7G score and TIDE score. The triangle indicates no statistical significance, while the circle indicates statistical significance. The greater the absolute value of the score, the higher the correlation
Correlation between m7G score and Tumor-specific total mRNA expression
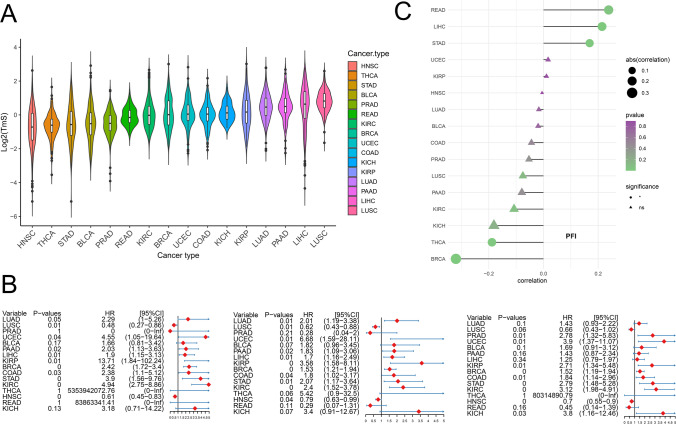
The total mRNA content in cancer cells is closely related to the biological characteristics of tumor [39]. To further analyze the correlation between m7G score and TmS, we first calculated the TmS of tumor samples in TCGA dataset. The results showed that the abundance of TmS was lowest in HNSC and highest in LUSC (Fig. 12A), which was similar to the original paper [39]. Survival analysis showed that elevated TmS was associated with poor prognosis in most tumors. We evaluated the prognostic value of m7G scores from OS and found that m7G scores were significantly associated with poor prognosis for LUAD (p = 0.01), PAAD (p = 0.02), and LIHC (p = 0.01). Meanwhile, for DSS, high m7G scores were associated with poorer DSS in 7 of 33 tumors. Additionally, the results for PFI showed that high m7G scores in 8 of 33 tumors were significantly associated with worse PFI (Fig. 12B). Correlation analysis showed that m7G scores was positively correlated with TmS in READ, LIHC, and STAD, and negatively correlated with THCA and BRCA (Fig. 12A, Supplementary Fig. 6). These results suggest that there was an interaction between m7G score and TmS in some tumors, and the full evaluation of these two indicators was conducive to prognosis and treatment decision.
Fig. 12.
Correlation between m7G score and Tumor-specific total mRNA expression (TmS). A Comparison of TmS abundance in different tumors. B OS forest map of m7G score. C DSS forest map of m7G score. D PFI forest map of m7G score. E The relationship between m7G score and TmS
Single-cell transcriptional analysis of m7G in the KIRC tumor microenvironment
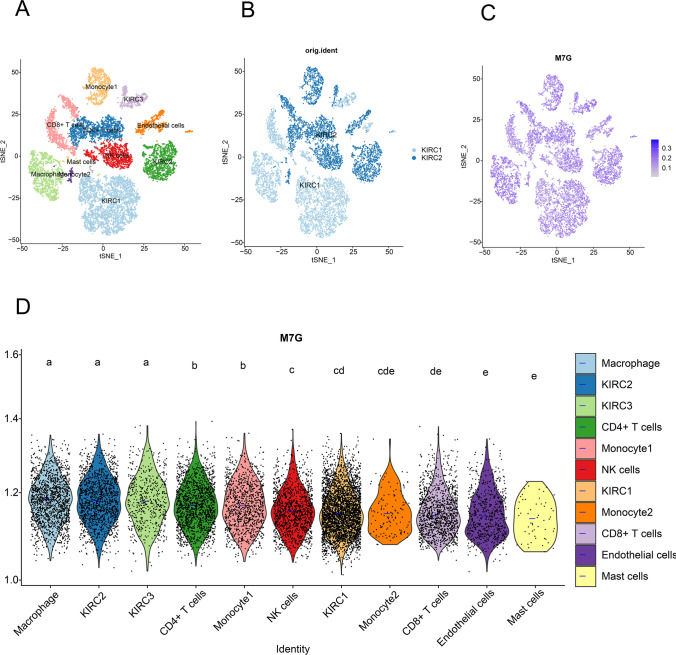
ScRNA-seq was performed on 2 KIRC samples. Subsequently, 13,124 high-quality single-cell transcriptome information was used for analysis after conducting QC using Seurat. Cell clustering analysis based on the tSNE algorithm showed that the cells could be classified into 11 clusters, namely KIRC1, KIRC2, KIRC3, monocyte1, monocyte2, macrophage, mast cells, endothelial cells, NK cells, CD4+ T cells, and CD8+ T cells (Fig. 13A). It was observed that marker genes were significantly differentially expressed in different cell clusters (Supplementary Fig. 7). In addition, it was observed that tumor cells from two different sources of KIRC samples had the same cluster (KIRC3) and unique clusters (KIRC1 and KIRC2) (Fig. 13B). Thus, the results suggested heterogeneity of KIRC cell types. We used ssGSEA to impute m7G scores for KIRC tumor microenvironment cells and compared the differences in m7G scores across cell types (Fig. 13C). Interestingly, we found a significant difference in the m7G scores of the above 11 types of cells (Fig. 13D). Moreover, m7G score was significantly elevated in macrophages inside KIRC2 and KIRC3 and decreased in mast cells m7G scores varied significantly within different KIRC cell clusters, suggesting m7G scores reflect an intrinsic feature of KIRC. These results suggest that m7G are significantly different in different cells of the KIRC tumor microenvironment and that targeting m7G may be a novel breakthrough in regulating the tumor microenvironment.
Fig. 13.
Single-cell transcriptomic atlas of KIRC. A tSEN plot representation of KIRC samples with 11 distinct cell types. B tSEN plot representation of KIRC from two different samples. C tSEN plot representation of m7G scores in different cell types. D Comparison of m7G scores in different KIRC tumor microenvironment cells. The blue horizontal line on the violin plot indicates the median m7G score. The letters at the top indicate a statistical difference between cells for two comparisons. Different letters indicate that the difference is statistically significant
Hub-gene definition and immunohistochemical validation
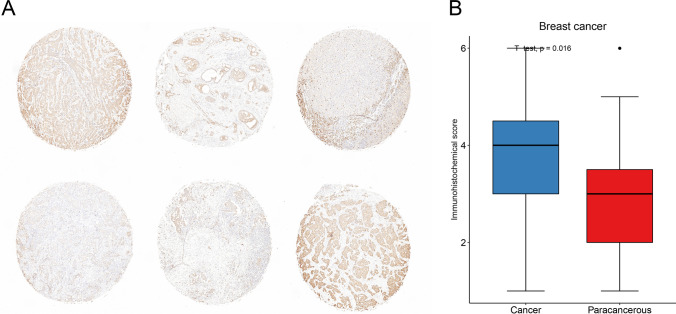
The m7G-related genes were input into Cytoscape software, and the PPI network diagram was obtained (Supplementary Fig. 8A). The nodes represent proteins, and the links represent the degree of association between proteins. It can be seen that the PPI network had a total of 28 nodes and 131 connections. The EIF4E, which has the highest m7G degree, is defined as the hub gene. We examined the expression of EIF4E in 35 pairs of breast cancers versus normal tissues using immunohistochemistry and showed that EIF4E was significantly more highly expressed in breast cancer tissues (Fig. 14A, B, p = 0.016). Data from The Human Protein Atlas also indicated that EIF4E was high expression in BRCA and LUSC (Supplementary Fig. 8B-E), which was consistent with our expression analysis.
Fig. 14.
Immunohistochemical staining results and statistical graphs of EIF4E in breast cancers. A Immunohistochemical image of breast cancer. B Statistical results of EIF4E expression in thirty-five pairs of breast cancer and normal samples
Pathomics-based machine learning model construction
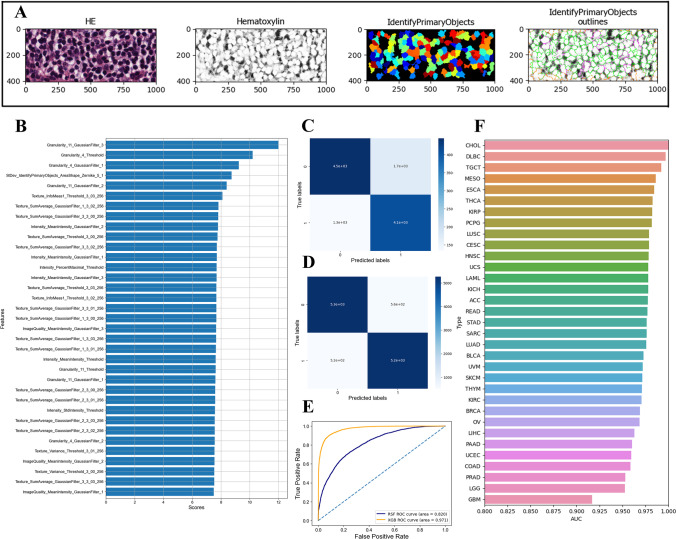
Considering that the m7G score can only be obtained by RNA sequencing, we constructed a pathomics-based m7G score prediction model based on H-E-stained pathological sections in order to facilitate clinical application. Representative image of the CellProfiler processing and extraction of image features is shown in Fig. 15A. In this study, 1673 image features were extracted from each pathology image. We first evaluated the importance of variables and used the top 20 features for model construction (Fig. 15B). The m7G score prediction model based on random forest (RF) had high accuracy. The number of true positives (TPs) and true negatives (TNs) indicated by the confusion matrix was significantly higher than that of false positives (FPs) and false negatives (FN) (Fig. 15C), and the AUC of ROC curve was 0.82 (Fig. 15E). Compared with the RF model, the m7G score prediction model based on XGBoost had higher accuracy. The number of TP and TN indicated by the confusion matrix was significantly higher than that of FP and FN (Fig. 15D), and the AUC of the ROC curve was 0.97 (Fig. 15E). To evaluate the accuracy of XGBoost model in predicting m7G score in different tumors, ROC curves were constructed for different tumors (Supplementary Fig. 9). The XGBoost model had the highest accuracy in CHOL with an AUC of 1.00, and the lowest accuracy in GBM with an AUC of 0.917 (Fig. 15F).
Fig. 15.
Pathomics-based machine learning model to predict m7G scores. A Representative images for image processing and feature extraction using CellProfiler. B Ranking the importance of variables for predicting m7G scores. C Confusion matrix for the random forest model. D Confusion matrix for the XGBoost model. E AUC of XGBoost model in predicting m7G score in pan-cancer. F AUC of XGBoost model in predicting m7G score in different tumors
Tumor staging is an important factor affecting treatment decision and prognosis. In order to determine whether pathomics can accurately predict tumor staging, we constructed a tumor staging prediction model. We first evaluated the importance of variables and used the top 20 features for model construction (Supplementary Fig. 10A). The RF model was poor in predicting staging accuracy, with the confusion matrix suggesting a high number of FP cases and an AUC of 0.66 (Supplementary Fig. 10B). Compared with the RF model, the stage prediction model based on XGBoost had higher accuracy. The number of TP and TN indicated by the confusion matrix was significantly higher than that of FP and FN, and the AUC of ROC curve was 0.99 (Supplementary Fig. 10C-D). To evaluate the accuracy of XGBoost model in predicting stage in different tumors, ROC curves were constructed for different tumors (Supplementary Fig. 10E). The XGBoost model had the highest accuracy in BLCA with an AUC of 1.00, and the lowest accuracy in KICH with an AUC of 0.98.
TMB is an important factor in determining the efficacy of immune checkpoint inhibitors. To assess the predictive value of pathomics for TMB, a TMB prediction model was constructed. We first evaluated the importance of variables and used the top 20 features for model construction (Supplementary Fig. 11A). The RF model was poor in predicting TMB accuracy, with the confusion matrix suggesting a high number of FP cases and an AUC of 0.90 (Supplementary Fig. 11B). Compared with the RF model, the TMB prediction model based on XGBoost had higher accuracy. The number of TP and TN indicated by the confusion matrix was significantly higher than that of FP and FN, and the AUC of ROC curve was 0.99 (Supplementary Fig. 11C-D). To evaluate the accuracy of XGBoost model in predicting TMB in different tumors, ROC curves were constructed for different tumors (Supplementary Fig. 11E). The XGBoost model had the highest accuracy in DLBC with an AUC of 1.00, and the lowest accuracy in PAAD with an AUC of 0.98.
Data integration analysis and m7G prognostic model construction
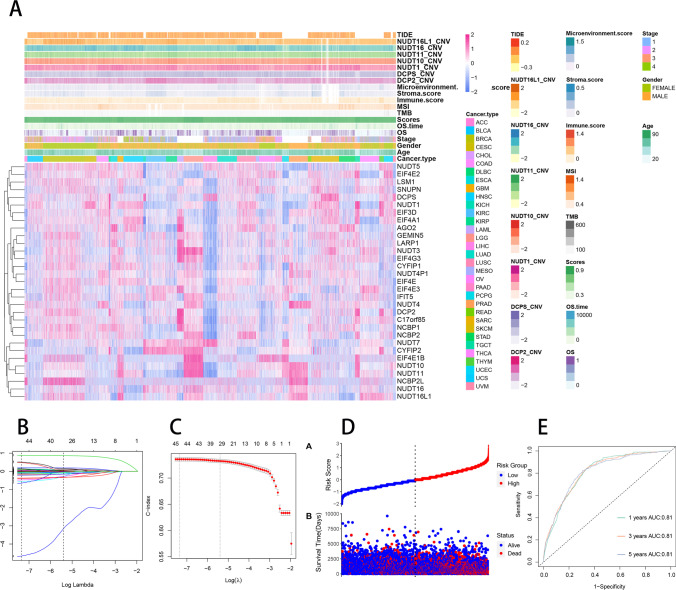
Integrative analysis can clarify the importance of different variables (clinical features and molecular characteristics) in disease progression [44]. Correlation of m7RGs expression with m7G score, tumor type, tumor stage, gender, age, overall survival, TMB, MSI, immune microenvironment score, CNV, and TIDE score was shown in Fig. 16A. To further investigate the relationship between the different variables, an integrated analysis was carried out. We first used univariate COX regression to analyze the correlation between multi-omics data, clinical data, and OS. SNV data were not included in this comprehensive analysis due to the low rate of non-consent mutations. Univariate COX regression analysis suggested that 51 variables were associated with OS, including tumor type, tumor stage, and m7G scores (Supplementary Table 4). We applied a LASSO COX regression algorithm for feature selection. The most appropriate tuning parameter λ for LASSO regression was 6.4 × 10⁻⁴ when the C-index reached its maximum value (Fig. 16B); 45 variables with nonzero coefficients were retained in the LASSO analysis (Fig. 16C). Then, these variables enter the multivariate COX regression model. Ultimately, 23 independent prognostic factors were selected for the construction of the prognostic model (Supplementary Table 4). To facilitate practical clinical use, we have deployed an online pan-cancer prognostic tool (https://pan-cancer-m7g.shinyapps.io/Panca-m7g/). Based on this online tool, we are able to extrapolate patient survival rate-time curves and obtain probabilities and confidence intervals for survival at a given time (e.g., 3 or 5 years) (Supplement Fig. 12). Figure 16E illustrates the relationship between risk scores and the survival status and survival time, showing that as the risk score increased, the number of patients who die gradually increased and the survival time gradually decreased. We used ROC curves to assess the accuracy of the prognostic model and the results showed that the AUC could reach 81% in predicting overall survival at 1, 3, and 5 years, suggesting a high accuracy rate (Fig. 16E).
Fig. 16.
Construction of m7G prognostic model. A Correlation of m7RGs with m7G scores, tumor type, tumor stage, gender, age, overall survival, TMB, MSI, immune microenvironment score, CNV and TIDE score. B Selection of tuning parameter (λ) in the LASSO regression using tenfold-cross-validation via minimum criteria. The C-index is plotted versus log (λ). At the optimal values log(λ), where features are selected, dotted vertical lines are set by using the minimum criteria and the 1 standard error of the minimum criteria. C LASSO coefficient profiles for features, each coefficient profile plot is produced versus log (λ) sequence. Dotted vertical line is set at the non-zero coefficients selected via tenfold cross-validation. D The relationship between risk scores and the survival status and survival time. E ROC curves for prognostic models predicting survival at 1, 3, and 5 years
Discussion
The significance of multi-omics analysis in PPPM
The analysis of gene mutations, gene expression, and DNA modifications enables clinicians to diagnose and treat diseases more accurately. Broadly speaking, the data used in precision medicine have been extended to other non-genomic data such as electronic medical records, medical imaging data, and laboratory results, which together with genomic data constitute the big data of precision medicine [45]. The most commonly used genomic data are germline mutations and somatic tumor mutations, such as prophylactic mastectomy to prevent breast cancer in healthy people with BRAC1 or BRAC2 mutations [46], and tyrosine kinase inhibitor therapy for lung cancer patients with EGFR mutations [47]. Despite the rapid development of genomic data, the clinical significance of many disease-associated variants cannot yet be clearly interpreted due to the large number of genes mutated in each tumor, and they have been categorized as variants of undetermined significance in general, which greatly limits the use of genomic information. To complicate matters further, DNA data is only one of many molecular data available within the cell, but there are also DNA modifications (CpG methylation), histone modifications, chromatin open regions, gene transcription (RNA or miRNA expression), and protein expression, all of which are equally important to precision medicine and are collectively referred to as multi-omics data [48]. Although many of these data are not yet clinically available, they have an important role to play in the interpretation of loci of unknown significance, the development of test packages for diagnosis, the development of new diagnostic and prognostic markers, and the identification of new therapeutic targets. We are now in the era of big biomedical data, comprising genomics, proteomics, metabolomics, imaging, and clinical diagnostic data. The understanding and use of biomedical data information will expand into a new model of disease management for tumor patients from diagnosis to prevention to personalized treatment at this stage. If used properly, big data will become a valuable resource for improving current healthcare services and reducing healthcare costs.
The m7G has potential as a prognostic marker in cancer
m7G is one of the modifications of RNA methylation, which plays an essential role in numerous biological functions. Several studies have revealed that RNA methylation dysregulation is closely associated with human cancer progression [49]. Meanwhile, m6A, m6Am, m1A, and m5C are also included in RNA methylation [50]. m6A modified proteins have been reported to be associated with a number of cancer cell lines and are potential therapeutic targets for cancer therapy [51]. The m5C RNA modification is associated with all types of human cancers [52]. Previous reports have observed that RNA methyltransferase (METTL1) depletion decreases the abundance of m7G-modified tRNA and attenuates oncogenicity [53]. Although m7G has been studied for a long time, a clear understanding of m7G role in tumor progression is still limited. More investigation is needed to understand the association of m7RGs with cancer and tumor immunity, which could be an excellent resource for the implication of a PPPM-based strategy to achieve a higher standard of treatment with improved level of life quality.
Our results demonstrated that m7G score was high in most tumors as well as in advanced stages of cancer. These findings showed that higher expression of m7RGs in most tumors is indicative of poor prognosis. Thus, m7G could help us to recognize high-risk groups in order to apply targeted prevention and further provide targeted therapeutic strategies by intervene m7G function. In addition, cellular pathway enrichment analysis based on single-cell level suggested that m7G score was closely associated with invasion, cell cycle, DNA damage, and DNA repair. Thus, it was presumed that m7G was a risk factor in most tumors, suggesting m7G-related pathways may play a facilitative role in tumor progression.
Correlation of m7G with the tumor microenvironment and immunotherapy
In the tumor immune cell correlation analysis, m7RGs were found to be significantly positively correlated with Tregs in THYM and negatively correlated with CD8+ T cells in BRCA and LGG. It was suggested that aberrant accumulation of regulatory T cells (Tregs) in certain tumors could suppress anti-tumor immunity and facilitate the establishment of an immunosuppressive microenvironment [54]. Moreover, several related studies have indicated that increased Tregs in the tumor microenvironment and a lower ratio of CD8+ T cells to Treg are associated with poor prognosis. It has been reported that Tregs have a suppressive effect on tumor antigen-specific T cell responses. Thus, promoting depletion of Tregs or controlling Tregs function may have a promising immunotherapeutic effect [55]. Therefore, m7G may promote the infiltration of Tregs in the tumor microenvironment and suppress the expression of CD8+ T cells thereby enhancing the immunosuppressive effects of the tumor immunosuppressive microenvironment. Therefore, m7G reflects the internal characteristics of the tumor and clarifying the state of m7g in the tumor microenvironment is important for PPPM of tumor.
Moreover, studies on m7G immune checkpoints and immune-related genes revealed that m7RGs were associated with immune cell markers and significantly positively correlated with TGFBR1, IL10, CD200, and CD274 (PD-L1) in most tumors, and inhibition of TGFBR1 was reported to inhibit the malignant progression of tumor suppressor (GATA4)–deficient lung cancer [56]. Meanwhile, the TGFBR1 inhibitor SB525334 was effective in inhibiting lung cancer cell growth in vitro [57]. Some studies have shown that IL-10 can limit the counteractivity of T cells by inducing unresponsiveness or non-responsiveness through APC or direct action on CD4 T cells [58]. Further, IL-10 production by tumor cells is associated with the immunosuppression of tumors [59]. CD200 was found to correlate with the immunosuppressive effects of the pancreatic tumor microenvironment [60], and a significant positive correlation was observed between m7G and CD200 expression in PAAD in our correlation studies. The upregulation of immune checkpoint, programmed death ligand 1 (PD-L1) expression, allows evasion of cancer cells from immune surveillance that facilitates metastasis and survival of cancer cells [61]. Therefore, m7G expression may contribute to immunosuppression of tumors affecting the function of certain immune checkpoints and immune-related genes, and promoting cancer cell infiltration. Therefore, targeting m7RGs may modify the tumor microenvironment and lay the foundation for the personalization of medical care for tumors.
Finally, our correlation analysis studies of m7G as a potential therapeutic marker for ICB showed that m7G was significantly negatively correlated with MSI, TMB, and positively correlated with TIDE for most cancers. MSI, TMB, and TIDE scores can be used as predictors of ICB treatment efficacy. MSI is microsatellite instability in colon cancer patients treated with immune checkpoint inhibitors, and tumor patients with high microsatellite instability have higher sensitivity [62]. TMB is the total number of mutations present in the tumor specimen and the mutations generate neoantigens on the surface of cancer cells. The higher the number of mutations, the more immunogenic the neoantigens that exist on the surface of cancer cells, thereby increasing the immunogenicity presented by the MHC protein, which helps T cells to recognize and destroy cancer cells [63]. TIDE is a tumor immune dysfunction and rejection score and is the best predictor of anti-PD1 and anti-CTLA4 immune checkpoint therapy. In addition, a higher tumor TIDE prediction score is associated with poor efficacy of suppressive immune checkpoint therapy as well as poor prognosis of anti-PD1 and anti-CTLA4 therapy [64]. Thus, low TIDE scores and high MSI and TMB expression favor ICB therapy. Therefore, our results demonstrated that high m7G expression may predict lower sensitivity to ICB therapy and serve as a prognostic marker for ICB immunotherapy. The m7G scores might improve the application of personalized management in cancer treatment from the perspectives of PPPM.
The expected impact of the current study on PPPM models for cancer prevention and treatment
PPPM model is a hot issue in oncology research and a key to break through tumor heterogeneity and achieve molecular tumor therapy. Precision medicine requires the diagnosis and treatment of disease throughout the entire medical process, including the “precise” prediction of risk, the “precise” classification of disease, the “precise” diagnosis of disease, the “precise” application of drugs, the “precise” assessment of efficacy, and the “precise” prediction of prognosis to capture the risk of recurrence [65]. To facilitate the clinical application of the m7G prognostic model, we used nomogram to visualize and develop the m7G prognostic model as an online prognostic tool. Nomograms have recently begun to attract increased attention as a user-friendly tool for predicting various events with strong clinical utility. Each nomogram is a graphical prediction model that combines several prediction factors and allows the user to assign scores for each factor using a scale, with the total score subsequently being used to predict the risk of a specific event. Since the first report in 1928 regarding the clinical application of a nomogram, nomograms have been developed to diagnose or predict the prognosis of various malignancies [66]. The m7G prognostic model we constructed combines multidimensional information on m7G score, tumor type, gene expression, and gene variants. Users can log on to the website and select the tumor type and corresponding characteristics to obtain the predicted survival curve and the probability of survival at a specific time for that patient. This prognostic model can play an important role directly in the assessment of tumor prognosis. In addition, accurate prognostic assessment is also important for the selection of treatment options and the determination of follow-up protocols. Particularly for high-risk patients, a more intense treatment regimen with a closer follow-up strategy may be selected under appropriate conditions, leading to early detection of disease progression and ultimately an improved prognosis. In addition, the model can be used at any time during the course of tumor treatment for prognostic assessment. This is because the action of drugs on the tumor may lead to changes in gene expression or variation, thus causing changes in risk scores and predicting the effect of treatment in advance.
Limitations
Despite the introduction of several approaches in the treatment of cancer based on m7G-PPPM perspective, there were few limitations which should be counted and considered during the interpretation of our finding. This study only provides preliminary findings that m7G are associated with tumor progression in a variety of tumors, and more experimental work is needed to determine the precise molecular function and mechanisms of m7G in tumorigenesis. Further studies at cellular and molecular levels should be performed to substantiate our results. We lack direct evidence that m7G are involved in immune infiltration to influence prognosis. Meanwhile, the mechanisms by which m7G are involved in regulating immunity remain unclear. Additionally, we lack specific and complete cases with data to identify the function of the drugs in inhibiting tumor growth.
Conclusions and expert recommendations in the framework of 3P medicine
In conclusion, we demonstrated the first comprehensive analysis of the role of m7G in pan-cancer. We found that m7RGs were highly expressed in tumors and most of them were prognostic risk factors. m7G scores were strongly correlated with invasive metastasis-related pathways in tumors. In a variety of cancer types, m7G scores were significantly negatively correlated with MSI and TMB and positively correlated with TIDE, suggesting that higher m7G scores may have poorer immunotherapeutic outcomes. The XGBoost-based pathomics model accurately predicted the m7G score with an area under the ROC curve (AUC) of 0.97. The m7G prognostic model we constructed accurately assessed the prognosis of tumor patients with an AUC of 0.81. These findings provided new insight into the understanding of the relationship between m7G and tumors and laid the foundation for future studies to identify the relevance of m7G on tumors. Most importantly, our findings suggest a scenario in which the m7G scores may be used in a PPPM paradigm, providing a novel and cutting-edge way of treating malignancies in general. For the further application of m7G in the context of PPPM in cancer management, we recommend the following:
Predictive diagnostics
The m7G score was significantly elevated in most tumors and is significantly associated with poor prognosis. It is suggested that m7G can be used for predictive diagnosis of tumors.
Targeted prevention
Abnormal elevation of m7G reduces response rates to immunotherapy. Inhibition of m7RGs may be a new target for targeted therapy and to improve the efficacy of immunotherapy. Conversely, low m7G scores may become a basis for tumor immunotherapy. Thus, m7G may help us to identify high-risk populations for targeted prevention and further provide targeted therapeutic strategies by interfering with m7G function.
Personalization of medical care
m7G status reflects the immunological and prognostic characteristics of the patient. By using next-generation sequencing (NGS) and multi-omics strategies to stratify patients into characteristic subgroups based on m7G status, this may improve the application of personalized management in pancreatic cancer treatment from a PPPM perspective.
Supplementary Information
Below is the link to the electronic supplementary material.
Author contribution
Xiaoliang Huang, Zuyuan Chen, Xiaoyun Xiang, Yanling Liu, Xingqing Long, Xianwei Mo, Weizhong Tang Jungang Liu, Kezhen Li, and Mingjian Qin: conceived and designed the experiments; Xiaoliang Huang, Zuyuan Chen, Xiaoyun Xiang, Yanling Liu, Xingqing Long, Xianwei Mo, Chenyan Long, Weizhong Tang: analyzed the data; Xiaoliang Huang, Zuyuan Chen, Xiaoyun Xiang, Yanling Liu, Xingqing Long, Xianwei Mo, Weizhong Tang, Jungang Liu, Kezhen Li and Mingjian Qin: helped with reagents/materials/analysis tools; Xiaoliang Huang, Zuyuan Chen, Xiaoyun Xiang, Yanling Liu, Xingqing Long, Xianwei Mo, Chenyan Long, Weizhong Tang, Jungang Liu, Kezhen Li and Mingjian Qin: contributed to the writing of the manuscript. All authors reviewed the manuscript.
Funding
This work received financial support from Guangxi Medical and Health Appropriate Technology Development and Promotion Application Project (S2021016); Guangxi Natural Science Foundation (2021JJA140081); and Basic Research Skills Enhancement Project for Young and Middle-aged Teachers in Universities in Guangxi (2021KY0087).
Data availability
The data supporting the findings of this study are deposited in TCGA and GEO databases. The single cell sequencing datasets can be found in online repositories of GEO (GSE152938).
Code availability
The analyses methods and used packages are illustrated in the “Materials and methods” section. All other R and Python code and analyses are available from the corresponding author upon request.
Declarations
Ethics approval and consent to participate
This study was approved by the Ethics and Human Subject Committee of Guangxi Medical University Cancer Hospital.
Consent for publication
Not applicable.
Conflict of interests
The authors declare no competing interests.
Footnotes
Publisher's Note
Springer Nature remains neutral with regard to jurisdictional claims in published maps and institutional affiliations.
Contributor Information
Xianwei Mo, Email: moxianwei888@163.com.
Weizhong Tang, Email: tangweizhong@gxmu.edu.cn.
Jungang Liu, Email: liujungang@gxmu.edu.cn.
References
- 1.Bray F, Laversanne M, Weiderpass E, Soerjomataram I. The ever-increasing importance of cancer as a leading cause of premature death worldwide. Cancer. 2021;127:3029–3030. doi: 10.1002/cncr.33587. [DOI] [PubMed] [Google Scholar]
- 2.Cheng X, et al. Systematic pan-cancer analysis of KLRB1 with prognostic value and immunological activity across human tumors. J Immunol Res. 2022;2022:5254911. doi: 10.1155/2022/5254911. [DOI] [PMC free article] [PubMed] [Google Scholar]
- 3.Grech G, et al. EPMA position paper in cancer: current overview and future perspectives. EPMA J. 2015;6:9. doi: 10.1186/s13167-015-0030-6. [DOI] [PMC free article] [PubMed] [Google Scholar]
- 4.Hamid O, et al. Safety and tumor responses with lambrolizumab (anti-PD-1) in melanoma. N Engl J Med. 2013;369:134–144. doi: 10.1056/NEJMoa1305133. [DOI] [PMC free article] [PubMed] [Google Scholar]
- 5.Doebele RC, et al. An oncogenic NTRK fusion in a patient with soft-tissue sarcoma with response to the tropomyosin-related kinase inhibitor LOXO-101. Cancer Discov. 2015;5:1049–1057. doi: 10.1158/2159-8290.Cd-15-0443. [DOI] [PMC free article] [PubMed] [Google Scholar]
- 6.Chen F, et al. Pan-cancer analysis of the prognostic and immunological role of HSF1: a potential target for survival and immunotherapy. Oxid Med Cell Longev. 2021;2021:5551036. doi: 10.1155/2021/5551036. [DOI] [PMC free article] [PubMed] [Google Scholar]
- 7.Zhou X, et al. A pan-cancer analysis of CD161, a potential new immune checkpoint. Front Immunol. 2021;12:688215. 10.3389/fimmu.2021.688215. [DOI] [PMC free article] [PubMed]
- 8.Weinstein JN, et al. The Cancer Genome Atlas Pan-Cancer analysis project. Nat Genet. 2013;45:1113–1120. doi: 10.1038/ng.2764. [DOI] [PMC free article] [PubMed] [Google Scholar]
- 9.Bodrova TA, et al. Introduction into PPPM as a new paradigm of public health service: an integrative view. EPMA J. 2012;3:16. doi: 10.1186/1878-5085-3-16. [DOI] [PMC free article] [PubMed] [Google Scholar]
- 10.Malbec L, et al. Dynamic methylome of internal mRNA N(7)-methylguanosine and its regulatory role in translation. Cell Res. 2019;29:927–941. doi: 10.1038/s41422-019-0230-z. [DOI] [PMC free article] [PubMed] [Google Scholar]
- 11.Lin S, et al. Mettl1/Wdr4-mediated m(7)G tRNA methylome is required for normal mRNA translation and embryonic stem cell self-renewal and differentiation. Mol Cell. 2018;71:244–255.e245. doi: 10.1016/j.molcel.2018.06.001. [DOI] [PMC free article] [PubMed] [Google Scholar]
- 12.Liu Y, Zhang Y, Chi Q, Wang Z, Sun B. Methyltransferase-like 1 (METTL1) served as a tumor suppressor in colon cancer by activating 7-methyguanosine (m7G) regulated let-7e miRNA/HMGA2 axis. Life Sci. 2020;249:117480. 10.1016/j.lfs.2020.117480. [DOI] [PubMed]
- 13.Qin MM, et al. let-7i inhibits proliferation and migration of bladder cancer cells by targeting HMGA1. BMC Urol. 2019;19:53. doi: 10.1186/s12894-019-0485-1. [DOI] [PMC free article] [PubMed] [Google Scholar]
- 14.Elghoroury EA, et al. Evaluation of miRNA-21 and miRNA Let-7 as prognostic markers in patients with breast cancer. Clin Breast Cancer. 2018;18:e721–e726. doi: 10.1016/j.clbc.2017.11.022. [DOI] [PubMed] [Google Scholar]
- 15.Ma L, Zhao Q, Chen W, Zhang Y. Oncogene Lin28B increases chemosensitivity of colon cancer cells in a let-7-independent manner. Oncol Lett. 2018;15:6975–6981. doi: 10.3892/ol.2018.8250. [DOI] [PMC free article] [PubMed] [Google Scholar]
- 16.Huang Y, et al. METTL1 promotes neuroblastoma development through m(7)G tRNA modification and selective oncogenic gene translation. Biomarker research. 2022;10:68. doi: 10.1186/s40364-022-00414-z. [DOI] [PMC free article] [PubMed] [Google Scholar]
- 17.Wang C, et al. Methyltransferase-like 1 regulates lung adenocarcinoma A549 cell proliferation and autophagy via the AKT/mTORC1 signaling pathway. Oncol Lett. 2021;21:330. doi: 10.3892/ol.2021.12591. [DOI] [PMC free article] [PubMed] [Google Scholar]
- 18.Wang T, et al. Comprehensive analysis of nine m7G-related lncRNAs as prognosis factors in tumor immune microenvironment of hepatocellular carcinoma and experimental validation. Front Genet. 2022;13:929035. doi: 10.3389/fgene.2022.929035. [DOI] [PMC free article] [PubMed] [Google Scholar]
- 19.Chen M, et al. m7G regulator-mediated molecular subtypes and tumor microenvironment in kidney renal clear cell carcinoma. Front Pharmacol. 2022;13:900006. doi: 10.3389/fphar.2022.900006. [DOI] [PMC free article] [PubMed] [Google Scholar]
- 20.Su C, et al. Single-cell RNA sequencing in multiple pathologic types of renal cell carcinoma revealed novel potential tumor-specific markers. Front Oncol. 2021;11:719564. 10.3389/fonc.2021.719564. [DOI] [PMC free article] [PubMed]
- 21.Human genomics The genotype-tissue expression (GTEx) pilot analysis. Science (New York, N.Y.) 2015;348:648–660. doi: 10.1126/science.1262110. [DOI] [PMC free article] [PubMed] [Google Scholar]
- 22.Linehan WM, Ricketts CJ. The Cancer Genome Atlas of renal cell carcinoma: findings and clinical implications. Nat Rev Urol. 2019;16:539–552. doi: 10.1038/s41585-019-0211-5. [DOI] [PubMed] [Google Scholar]
- 23.Blum A, Wang P, Zenklusen J. C. SnapShot: TCGA-analyzed tumors. Cell. 2018;173:530. doi: 10.1016/j.cell.2018.03.059. [DOI] [PubMed] [Google Scholar]
- 24.Yang W, et al. Genomics of drug sensitivity in cancer (GDSC): a resource for therapeutic biomarker discovery in cancer cells. Nucleic Acids Res. 2013;41:D955–961. doi: 10.1093/nar/gks1111. [DOI] [PMC free article] [PubMed] [Google Scholar]
- 25.Fu Y, et al. Pan-cancer computational histopathology reveals mutations, tumor composition and prognosis. Nature cancer. 2020;1:800–810. doi: 10.1038/s43018-020-0085-8. [DOI] [PubMed] [Google Scholar]
- 26.Carpenter AE, et al. Cell Profiler: image analysis software for identifying and quantifying cell phenotypes. Genome Biol. 2006;7:R100. doi: 10.1186/gb-2006-7-10-r100. [DOI] [PMC free article] [PubMed] [Google Scholar]
- 27.Rizvi AA, et al. gwasurvivr: an R package for genome-wide survival analysis. Bioinformatics (Oxford, England) 2019;35:1968–1970. doi: 10.1093/bioinformatics/bty920. [DOI] [PMC free article] [PubMed] [Google Scholar]
- 28.van Dyk E, Reinders MJ, Wessels LF. A scale-space method for detecting recurrent DNA copy number changes with analytical false discovery rate control. Nucleic Acids Res. 2013;41:e100. 10.1093/nar/gkt155. [DOI] [PMC free article] [PubMed]
- 29.Liu CJ, et al. GSCALite: a web server for gene set cancer analysis. Bioinformatics (Oxford, England) 2018;34:3771–3772. doi: 10.1093/bioinformatics/bty411. [DOI] [PubMed] [Google Scholar]
- 30.Zhuang W, et al. An immunogenomic signature for molecular classification in hepatocellular carcinoma. Molecular therapy Nucleic acids. 2021;25:105–115. doi: 10.1016/j.omtn.2021.06.024. [DOI] [PMC free article] [PubMed] [Google Scholar]
- 31.Wang G, et al. m7G-Associated subtypes, tumor microenvironment, and validation of prognostic signature in lung adenocarcinoma. Front Genet. 2022;13:954840. doi: 10.3389/fgene.2022.954840. [DOI] [PMC free article] [PubMed] [Google Scholar]
- 32.Xiao B, et al. Identification and verification of immune-related gene prognostic signature based on ssGSEA for osteosarcoma. Front Oncol. 2020;10:607622. doi: 10.3389/fonc.2020.607622. [DOI] [PMC free article] [PubMed] [Google Scholar]
- 33.Sherif S, et al. The immune landscape of solid pediatric tumors. J Exp Clin Cancer Res: CR. 2022;41:199. doi: 10.1186/s13046-022-02397-z. [DOI] [PMC free article] [PubMed] [Google Scholar]
- 34.Misund K, et al. Clonal evolution after treatment pressure in multiple myeloma: heterogenous genomic aberrations and transcriptomic convergence. Leukemia. 2022;36:1887–1897. doi: 10.1038/s41375-022-01597-y. [DOI] [PMC free article] [PubMed] [Google Scholar]
- 35.Li T, et al. TIMER: a web server for comprehensive analysis of tumor-infiltrating immune cells. Can Res. 2017;77:e108–e110. doi: 10.1158/0008-5472.Can-17-0307. [DOI] [PMC free article] [PubMed] [Google Scholar]
- 36.Tang Z, et al. GEPIA: a web server for cancer and normal gene expression profiling and interactive analyses. Nucleic Acids Res. 2017;45:W98–w102. doi: 10.1093/nar/gkx247. [DOI] [PMC free article] [PubMed] [Google Scholar]
- 37.Yuan H, et al. CancerSEA: a cancer single-cell state atlas. Nucleic Acids Res. 2019;47:D900–d908. doi: 10.1093/nar/gky939. [DOI] [PMC free article] [PubMed] [Google Scholar]
- 38.Patel SS, Lovko VJ, Lockey RF. Red Tide: overview and clinical manifestations. J Allergy Clin Immunol In practice. 2020;8:1219–1223. doi: 10.1016/j.jaip.2019.10.030. [DOI] [PubMed] [Google Scholar]
- 39.Cao S, et al. Estimation of tumor cell total mRNA expression in 15 cancer types predicts disease progression. Nat Biotechnol. 2022;40(11):1624-1633. 10.1038/s41587-022-01342-x. [DOI] [PMC free article] [PubMed]
- 40.Mo X, et al. Immune infiltration and immune gene signature predict the response to fluoropyrimidine-based chemotherapy in colorectal cancer patients. Oncoimmunology. 2020;9:1832347. doi: 10.1080/2162402x.2020.1832347. [DOI] [PMC free article] [PubMed] [Google Scholar]
- 41.Bishara AJ, Hittner JB. Testing the significance of a correlation with nonnormal data: comparison of Pearson, Spearman, transformation, and resampling approaches. Psychol Methods. 2012;17:399–417. doi: 10.1037/a0028087. [DOI] [PubMed] [Google Scholar]
- 42.Dantan E, et al. An original approach was used to better evaluate the capacity of a prognostic marker using published survival curves. J Clin Epidemiol. 2014;67:441–448. doi: 10.1016/j.jclinepi.2013.10.022. [DOI] [PubMed] [Google Scholar]
- 43.Fisher LD, Lin DY. Time-dependent covariates in the Cox proportional-hazards regression model. Annu Rev Public Health. 1999;20:145–157. doi: 10.1146/annurev.publhealth.20.1.145. [DOI] [PubMed] [Google Scholar]
- 44.Song M, Vogelstein B, Giovannucci EL, Willett WC, Tomasetti C. Cancer prevention: molecular and epidemiologic consensus. Science (New York, N.Y.) 2018;361:1317–1318. doi: 10.1126/science.aau3830. [DOI] [PMC free article] [PubMed] [Google Scholar]
- 45.Cirillo D, Valencia A. Big data analytics for personalized medicine. Curr Opin Biotechnol. 2019;58:161–167. doi: 10.1016/j.copbio.2019.03.004. [DOI] [PubMed] [Google Scholar]
- 46.Carbine NE, Lostumbo L, Wallace J, Ko H. Risk-reducing mastectomy for the prevention of primary breast cancer. Cochrane Database Syst Rev. 2018;4:CD002748. doi: 10.1002/14651858.CD002748.pub4. [DOI] [PMC free article] [PubMed] [Google Scholar]
- 47.He J, Huang Z, Han L, Gong Y, Xie C. Mechanisms and management of 3rd‑generation EGFR‑TKI resistance in advanced non‑small cell lung cancer (Review). Int J Oncol 2021; 59, 10.3892/ijo.2021.5270. [DOI] [PMC free article] [PubMed]
- 48.Argelaguet R, et al. Multi-omics factor analysis-a framework for unsupervised integration of multi-omics data sets. Mol Syst Biol. 2018;14:e8124. doi: 10.15252/msb.20178124. [DOI] [PMC free article] [PubMed] [Google Scholar]
- 49.Lakshminarasimhan R, Liang G. The role of DNA methylation in cancer. Adv Exp Med Biol. 2016;945:151–172. doi: 10.1007/978-3-319-43624-1_7. [DOI] [PMC free article] [PubMed] [Google Scholar]
- 50.Wiener D, Schwartz S. The epitranscriptome beyond m(6)A. Nat Rev Genet. 2021;22:119–131. doi: 10.1038/s41576-020-00295-8. [DOI] [PubMed] [Google Scholar]
- 51.Xie S, et al. Emerging roles of RNA methylation in gastrointestinal cancers. Cancer Cell Int. 2020;20:585. doi: 10.1186/s12935-020-01679-w. [DOI] [PMC free article] [PubMed] [Google Scholar]
- 52.Huang Y, et al. Exploration of potential roles of m5C-related regulators in colon adenocarcinoma prognosis. Front Genet. 2022;13:816173. doi: 10.3389/fgene.2022.816173. [DOI] [PMC free article] [PubMed] [Google Scholar]
- 53.Orellana EA, et al. METTL1-mediated m(7)G modification of Arg-TCT tRNA drives oncogenic transformation. Mol Cell. 2021;81:3323–3338.e3314. doi: 10.1016/j.molcel.2021.06.031. [DOI] [PMC free article] [PubMed] [Google Scholar]
- 54.Wang H, Franco F, Ho PC. Metabolic regulation of Tregs in cancer: opportunities for immunotherapy. Trends Cancer. 2017;3:583–592. doi: 10.1016/j.trecan.2017.06.005. [DOI] [PubMed] [Google Scholar]
- 55.Ohue Y, Nishikawa H. Regulatory T (Treg) cells in cancer: can Treg cells be a new therapeutic target? Cancer Sci. 2019;110:2080–2089. doi: 10.1111/cas.14069. [DOI] [PMC free article] [PubMed] [Google Scholar]
- 56.Gao L, et al. Lung cancer deficient in the tumor suppressor GATA4 is sensitive to TGFBR1 inhibition. Nat Commun. 2019;10:1665. doi: 10.1038/s41467-019-09295-7. [DOI] [PMC free article] [PubMed] [Google Scholar]
- 57.Grygielko ET, et al. Inhibition of gene markers of fibrosis with a novel inhibitor of transforming growth factor-beta type I receptor kinase in puromycin-induced nephritis. J Pharmacol Exp Ther. 2005;313:943–951. doi: 10.1124/jpet.104.082099. [DOI] [PubMed] [Google Scholar]
- 58.Saraiva M, Vieira P, O'Garra A. Biology and therapeutic potential of interleukin-10. J Exp Med 2020; 217, 10.1084/jem.20190418. [DOI] [PMC free article] [PubMed]
- 59.Itakura E, et al. IL-10 expression by primary tumor cells correlates with melanoma progression from radial to vertical growth phase and development of metastatic competence. Mod Pathol. 2011;24:801–809. doi: 10.1038/modpathol.2011.5. [DOI] [PMC free article] [PubMed] [Google Scholar]
- 60.Choueiry F et al. CD200 promotes immunosuppression in the pancreatic tumor microenvironment. J Immunother Cancer 2020; 8, 10.1136/jitc-2019-000189. [DOI] [PMC free article] [PubMed]
- 61.Cha JH, Chan LC, Li CW, Hsu JL, Hung MC. Mechanisms controlling PD-L1 expression in cancer. Mol Cell. 2019;76:359–370. doi: 10.1016/j.molcel.2019.09.030. [DOI] [PMC free article] [PubMed] [Google Scholar]
- 62.Lin A, Zhang J, Luo P. Crosstalk between the MSI status and tumor microenvironment in colorectal cancer. Front Immunol. 2020;11:2039. doi: 10.3389/fimmu.2020.02039. [DOI] [PMC free article] [PubMed] [Google Scholar]
- 63.Jardim DL, Goodman A, de Melo Gagliato D, Kurzrock R. The challenges of tumor mutational burden as an immunotherapy biomarker. Cancer Cell. 2021;39:154–173. doi: 10.1016/j.ccell.2020.10.001. [DOI] [PMC free article] [PubMed] [Google Scholar]
- 64.Jiang P, et al. Signatures of T cell dysfunction and exclusion predict cancer immunotherapy response. Nat Med. 2018;24:1550–1558. doi: 10.1038/s41591-018-0136-1. [DOI] [PMC free article] [PubMed] [Google Scholar]
- 65.König IR, Fuchs O, Hansen G, von Mutius E & Kopp MV. What is precision medicine? Eur Respir J 2017; 50, 10.1183/13993003.00391-2017. [DOI] [PubMed]
- 66.Han DS, et al. Nomogram predicting long-term survival after d2 gastrectomy for gastric cancer. J Clin Oncol: Off J Am Soc Clin Oncol. 2012;30:3834–3840. doi: 10.1200/jco.2012.41.8343. [DOI] [PubMed] [Google Scholar]
Associated Data
This section collects any data citations, data availability statements, or supplementary materials included in this article.
Supplementary Materials
Data Availability Statement
The data supporting the findings of this study are deposited in TCGA and GEO databases. The single cell sequencing datasets can be found in online repositories of GEO (GSE152938).
The analyses methods and used packages are illustrated in the “Materials and methods” section. All other R and Python code and analyses are available from the corresponding author upon request.


