Abstract
Acute aortic dissection (AAD) is a severe aortic injury disease, which is often life-threatening at the onset. However, its early prevention remains a challenge. Therefore, in the context of predictive, preventive, and personalized medicine (PPPM), it is particularly important to identify novel and powerful biomarkers. This study aimed to identify the key markers that may contribute to the predictive early risk of AAD and analyze their role in immune infiltration. Three datasets, including a total of 23 AAD and 20 healthy control aortic samples, were retrieved from the Gene Expression Omnibus (GEO) database, and a total of 519 differentially expressed genes (DEGs) were screened in the training set. Using the least absolute shrinkage and selection operator (LASSO) regression model and the random forest (RF) algorithm, FERMT1 (AUC = 0.886) and SGCD (AUC = 0.876) were identified as key markers of AAD. A novel AAD risk prediction model was constructed using an artificial neural network (ANN), and in the validation set, the AUC = 0.920. Immune infiltration analysis indicated differential gene expression in regulatory T cells, monocytes, γδ T cells, quiescent NK cells, and mast cells in the patients with AAD and the healthy controls. Correlation and ssGSEA analysis showed that two key markers’ expression in patients with AAD was correlated with many inflammatory mediators and pathways. In addition, the drug-gene interaction network identified motesanib and pyrazoloacridine as potential therapeutic agents for two key markers, which may provide personalized medical services for AAD patients. These findings highlight FERMT1 and SGCD as key biological targets for AAD and reveal the inflammation-related potential molecular mechanism of AAD, which is helpful for early risk prediction and targeted prevention of AAD. In conclusion, our study provides a new perspective for developing a PPPM method for managing AAD patients.
Supplementary Information
The online version contains supplementary material available at 10.1007/s13167-022-00302-4.
Keywords: Acute aortic dissection, Predictive preventive personalized medicine (PPPM), Machine learning, Key marker, Prediction model, Immune infiltration
Introduction
The challenge of AAD management under PPPM
Acute aortic dissection (AAD) presents as a separation of the aortic wall layers due to a tear in the intima or bleeding in the aortic wall and is a very aggressive illness [1]. It occurs at a rate of 3–4 cases per 100,000 people per year [2]. The typical clinical presentation of aortic dissection is the acute onset of severe chest and back pain. The most common causes of related death are aortic rupture and cardiac tamponade [3]. The mortality rate of untreated patients with AAD is 21% at 24 h and 37% at 48 h [4]. The most effective treatments for AAD are usually surgical artificial vascular replacement and intracavitary stent implantation [5], but both require a very high skill level, and even at experienced cardiovascular centers, the postoperative mortality rate of patients can be 10–35% [6]. Therefore, early prevention and timely treatment are crucial for reducing mortality and improving outcomes. The concept of predictive, preventive, and personalized medicine (PPPM) is widely used in oncology, which provides a theoretical basis for screening cancer biomarkers and treatment targets based on genome sequencing and complements the prevention and diagnosis of cancer under the concept of personalized medicine [7]. But when it comes to AAD, the early prediction and prevention efforts are obviously inadequate [8]. Some patients are not aware of the potential risk before symptoms develop and die before surgery [9], which is unsatisfactory from the perspective of PPPM [10]. In recent decades, many efforts have been made to find effective biomarkers playing an important role in the prevention, diagnosis, and prognosis of AAD. Some markers related to inflammation, thrombosis, and aortic wall pathophysiological changes have been identified, such as IL-6, D-dimer, and MMPs [11]. The combination of various markers and imaging provides help for the rapid diagnosis of AAD [12]. However, due to different results in the clinical management of PPPM in AAD [13], current international guidelines advocate early identification of risk before acute index events occur, that is, secondary prevention of AAD [14], which is still a great challenge for its complex biological and clinical characteristics [15]. Consequently, there is an urgent need to discover more characteristic biomarkers to further improve the PPPM system of AAD.
The role of immune-related mechanisms in AAD
The pathogenic mechanisms of AAD have recently become a popular research topic. Immune and inflammatory responses have been shown to play vital roles in the development of AAD [16]. When AAD occurs, many immune cells, such as the T and B cells and monocytes, and macrophages infiltrate aortic wall lesions [17]. The activated immune cells promote the secretion of various inflammatory factors, such as IL-6, MMPs, and osteopontin. The interaction between immune cells and immune factors promotes the remodeling of aortic vascular tissue, which eventually leads to the expansion and rupture of the dissection [18]. However, the pathogenesis of AAD is the result of multiple factors, and there are still many unknown pathological mechanisms that must be investigated. Therefore, the key markers and pathological mechanisms of AAD must be further investigated for the development and improvement of personalized therapeutic strategies.
Study assumptions
The rapid development of sequencing technologies has facilitated the identification of key markers related to multiple diseases, especially showing great potential under PPPM strategies for the prediction, diagnosis, and treatment of acute diseases [19]. Machine learning models have unique dimensionality reduction and classification algorithms to analyze high-dimensional sequencing data more effectively, which enables the identification of new disease diagnosis strategies [20]. Using bioinformatics and machine learning models, the study of molecular mechanisms has also become popular in disease research [21]. Especially in the field of oncology, it greatly enhances the ability to predict tumorigenesis and accurately predict the prognosis of tumor patients, which promotes the development of personalized medical intervention [22]. However, there have been few studies on AAD prediction models based on machine learning algorithms and biomarkers so far. Therefore, we speculate that a novel AAD pathogenesis prediction model can be established using bioinformatics and machine learning models from the perspective of macroscopic biological characteristics, and drug molecular screening based on key targets also can provide a new perspective for personalized medical treatment of AAD patients.
Study design
In this study, we constructed expression profiles of DEGs between AAD patients and control samples and then used the Lasso regression model and the RF algorithm to search for key markers involved in the pathogenesis of AAD. Two novel AAD biomarkers were identified, and an efficient AAD neural network risk prediction model was constructed. In addition, the results of the immune infiltration analysis and correlation analysis with key markers have provided valuable information on the molecular mechanisms of immunity in the development of AAD. Collectively, the results of this study will provide new evidence to guide the prediction, prevention, and treatment of AAD in the PPPM framework.
Materials and methods
Data collection
AAD datasets were downloaded from the Gene Expression Omnibus (GEO) database. Three mRNA expression datasets with AAD patient information, namely, GSE52093, GSE98770, and GSE153434, were included in this study. The platform for the GSE52093 dataset was GPL10558, which contains 7 AAD patients and 5 healthy controls. The GSE98770 dataset consists of gene expression profile data obtained using mRNA and miRNA microarrays. The mRNA microarray platform is GPL14550, and it contains gene expression data from acute type A aortic dissections (n = 6) and non-dissected ascending aortas obtained from transplant donors (n = 5). The normalized expression matrix of the microarray data can be downloaded directly from the dataset and annotated using the corresponding annotation file. In contrast, GSE153434 contains gene expression profile data obtained from high-throughput sequencing. The platform for this dataset was GPL20795 and has the gene expression data of dissected ascending aortas from AAD patients (n = 10) and healthy controls (n = 10). The datasets and sample information analyzed in this study are shown in Table 1. We combined the GSE52093 and GSE98770 datasets to form a training set and used the GSE153434 dataset as the validation set. The training set trained the parameters of each model, and the validation set was used to verify and compare the prediction accuracy of the genes.
Table 1.
Data download
Screening and bioinformatics analysis of the DEGs
The GSE52093 and GSE98770 datasets were merged after normalization using the “SVA” [23] and “Limma” [24] R packages, and batch effect correction of the merged data was performed using the ComBat tool. The results of the batch effect correction were verified using principal component analysis (PCA), and the merged data were used as the training set for this experiment. The “Limma” R package was used to calculate the differentially expressed genes (DEGs) between AAD and the healthy tissues (p < 0.05 and |log2 FC|> 1). Next, GO functional annotation and KEGG enrichment analysis of the DEGs were performed using the “org.Hs.eg.db” [25] and “clusterProfiler” [26] R packages to investigate the potential biological processes, cellular components, and molecular functions of the DEGs. Differences with p < 0.05 were considered statistically significant.
Machine learning identification and validation of characteristic genes
To reduce the risk of bias in the prediction process, we used two machine learning models to screen for key marker characteristics of AAD onset. LASSO is a dimensionality reduction algorithm suited for analyzing high-dimensional data. LASSO regression can be used to construct a penalty function to obtain a more refined model, thereby reducing the number of variables but still retaining those that are valuable to successfully prevent overfitting [27]. The “glmnet” software package was used to determine the penalty parameter λ by tenfold cross-validation and identify the optimal λ value corresponding to the minimum cross-validation error and list the gene names corresponding to that point. The RF algorithm is an integrated learning method consisting of several decision trees for sample training and prediction [28]. The “random Forest” software package [29] was used to construct the RF model and identify candidate genes based on their importance in relation to AAD. The optimal number of trees included in the RF was set to 1500, and the number of trees corresponding to the point with the slightest cross-validation error was 8. The Gini coefficient method was used to obtain the dimensional importance values of the RF model. The possible key markers in AAD development were screened from highest to lowest by ranking the importance values, and the importance graph was plotted. The “pheatmap” software package was used to create heat maps. The AAD genes screened from the two models were used for hierarchical clustering of the samples. The accuracy of the model results was validated by distinguishing the control group from the disease group by their expression levels. The intersection of the genes obtained from the two machine learning models was determined. The expression levels of the genes in the intersection were identified in the validation set, and genes with no significant differences in expression (p ≥ 0.05) were excluded. Finally, the remaining genes were used as the key markers in this study. The accuracy of the genes was assessed using ROC curves [30], and the area under the curve (AUC) values were used to indicate the accuracy and predictive value of the gene for AAD.
Construction of a disease classification neural network model
Use an artificial neural network to construct a disease classification model in the training set and predict its accuracy respectively in the training set and the validation set [31]. The expression data of the key markers finally screened out were first transformed into “gene scores” based on expression levels. In the training set, the expression values of the characteristic genes were compared with the median expression values of all subsets within the sample. Upregulated gene expression was recorded as 1 if greater than the median value and 0 if less than the median value. Downregulated gene expression was recorded as 0 if greater than the median value and 1 if less than the median value. Finally, we obtained a “gene score” table for each gene in each sample. ANN models of important variables were constructed using the “Neuralnet” and “NeuralNetTools” R packages [32]. The number of hidden nodes was set to 5, and a classification model of AAD was constructed from the obtained “gene score” information. In this model, the sum of the weight score products and the key marker expression level were used as the disease classification score. The obtained model was used to predict the grouping of samples. The predicted results were compared with the initial grouping to determine the accuracy of the neural network model in predicting AAD. The “pROC” R package was used to calculate the AUC to determine the classification performance.
Immune infiltration and correlation analysis
CIBERSORT is a bioinformatics tool that can discriminate and quantify 22 human immune cell phenotypes including plasma, B, and T cells, as well as their subpopulations using a deconvolution algorithm based on gene expression data [33]. It is widely used to assess immune cell types in the microenvironment of tumors and non-malignant diseases [34]. We uploaded the expression profiles of the training set to CIBERSORT and analyzed the samples with a filter of p < 0.05 to obtain an immune infiltration matrix. The “corrplot” package was used to plot a correlation heat map, and the correlation between each type of immune cell was subsequently visualized. The “ggplot2” package was used to draw violin plots to show the differences in immune infiltration. The “ggstatsplot” package was used to perform Spearman correlation analysis between key markers and infiltrating immune cells, and the “ggplot2” package was used to visualize the results. GSEA analysis for FERMT1 and SGCD was used GSEA software (Version 3.0). The samples were divided into high expression group (≥ 50%) and low expression group (< 50%) according to the expression level of FERMT1 and SGCD. And to evaluate the related pathways and molecular mechanisms, we downloaded “c2.cp.kegg.v7.4.symbols.gmt” collections from the Molecular Signatures Database [35]; grouping based on gene expression profile and phenotype, the minimum gene set is set as 5, and the maximum gene set is set as 5000, and a p value of < 0.05 was considered statistically significant. The hallmark gene set in the database MsigDB was used as a reference for ssGSEA. The scores of each sample in the gene set were calculated, and the differences were analyzed; the genomes with p < 0.05 were considered to be significantly enriched.
Real-time fluorescence quantitative PCR
Patients aged 18 years and older with AAD diagnosed by full aortic CTA were included in the AAD group, and age-matched healthy individuals without dissection were included in the healthy group. RNA was extracted from AAD (n = 5) and healthy (n = 3) tissues and AAD (n = 12) and healthy (n = 12) plasma using the Trizol reagent (Ambion) as per the manufacturer’s instructions. RNA was collected by diluting with DEPC-treated water and electrophoresed on denatured formaldehyde agarose gels to confirm overall sample quality. To determine RNA concentration and purity, 1 μg of total RNA from each sample was reverse transcribed using a cDNA synthesis kit (Takara TB Green Premix Ex Taq II), and real-time quantitative PCR (qPCR) reactions were performed using a CFX96 real-time fluorescent quantitative PCR system (Bio-Rad). BlazeTaq™ SYBR® Green qPCR Mix 2.0 (Takara) was used for qPCR reactions with GAPDH as an internal reference gene. Relative gene expression was calculated using the 2-ΔΔCT method [36], and reactions were performed in triplicate to ensure accuracy. Primer sequences are shown in Supplementary Table 1.
Analysis of protein subcellular localization and correlation with immune checkpoints
The Cell-PLoc 2.0 tool [37] was used to predict the protein subcellular localization of FERMT1 and SGCD. This is an online server for predicting the subcellular localization of proteins. The Pearson correlation between FERMT1, SGCD, and immune checkpoints HAVCR2, LAG3, CTLA4, CD274, and PDCD1 was calculated by R software.
Drug–gene interaction and molecular docking analysis
The molecular structures of ligands and target proteins were obtained from PubChem, PDB, cellminer, HERB, and other databases and visualized by Cytoscape software. Then, the docking energy is generated by the docking simulation by AutoDock Vina [38]. Finally, the docking complex is visualized by Discovery Studio software.
Statistical analysis
Statistical analyses were using GraphPad Prism 8.0.2 and R (version 4.1.1). The accuracy of the key markers prediction was assessed using receiver operating characteristic (ROC) curve analysis. The correlation between gene expression and the immune cells was analyzed using Pearson, and a significant difference was considered as p < 0.05 unless specified.
Results
DEGs screening and bioinformatic analysis
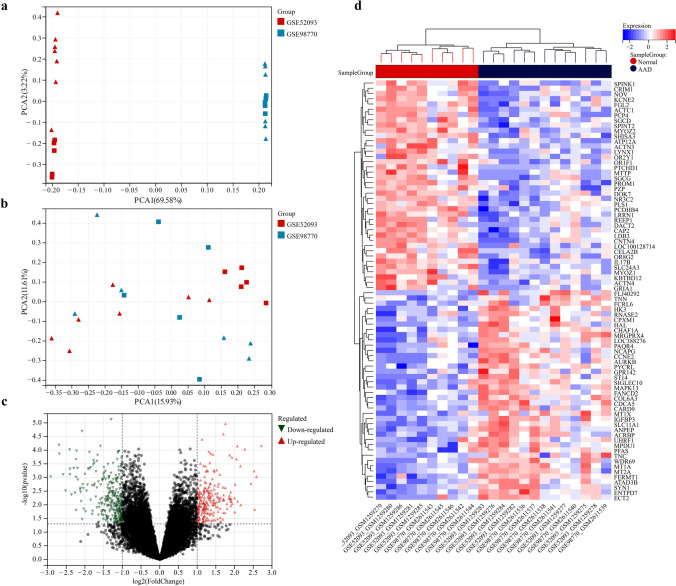
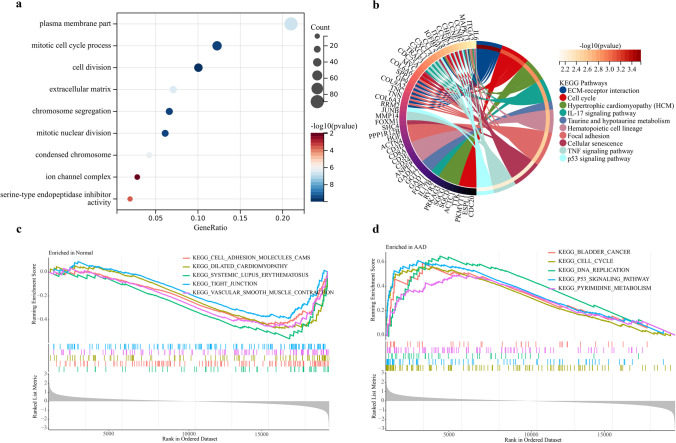
The GSE52093 and GSE98770 datasets were used as the training set, the GSE153434 dataset was used as the external validation set, and PCA was used to verify the results of batch effect correction (Fig. 1a, b). The results showed that the batch-to-batch differences were eliminated. Subsequently, we used R software to extract 519 DEGs from the training set gene expression matrix, of which 297 were significantly upregulated and 222 were significantly downregulated. The resulting DEGs are shown as a volcano plot (Fig. 1c) and a heatmap (Fig. 1d). GO analysis showed that the DEGs were significantly enriched in the biological processes of the extracellular matrix, ion channels, and cell division (Fig. 2a). KEGG pathway analysis showed that the DEGs were significantly enriched in extracellular matrix receptor interactions and the IL-17 and p53 signaling pathways (Fig. 2b). The GSEA pathway enrichment analysis indicated the significantly enriched biological pathways involved in the AAD and healthy groups; the results are shown in Fig. 2c, d. In summary, we found out that cell biological functions such as cell cycle, replication, and development, as well as immune-related signaling pathways are predominantly enriched among the DEGs.
Fig. 1.
GSE52093 and GSE98770 datasets were combined, and the batch effect correction results were verified by principal component analysis. a PCA plot before batch effect correction. b PCA plot after batch effect correction. The triangle represents the disease group sample, and the square represents the control group sample. c Volcano plot of DEGs in the training set. Red dots represent upregulated genes, green dots represent downregulated genes, and black dots represent genes with no differential expression. d Heatmap of the top 50 DEGs in the training set. Red and blue represent upregulated and downregulated DEGs respectively
Fig. 2.
Results of enrichment analysis. a GO analysis bubble plot showing the set of biological processes, cellular components, and molecular functions. b Venn diagram of KEGG enrichment analysis results. c–d GSEA analysis shows the biological functions enriched in the AAD and healthy groups
Screening and validation of key markers
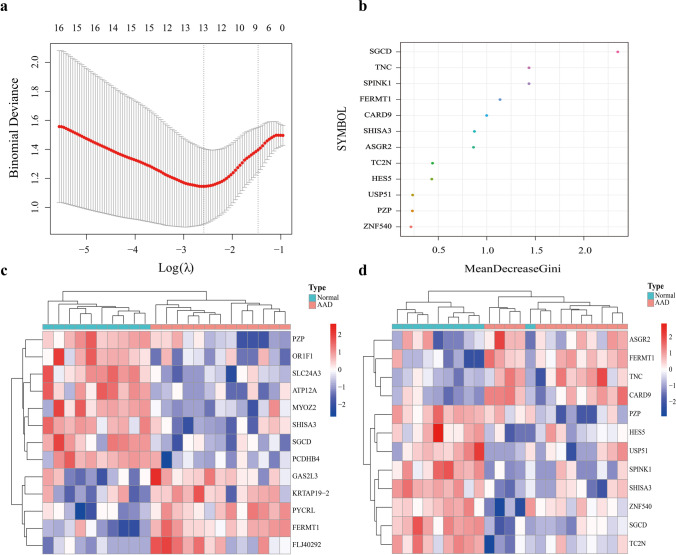
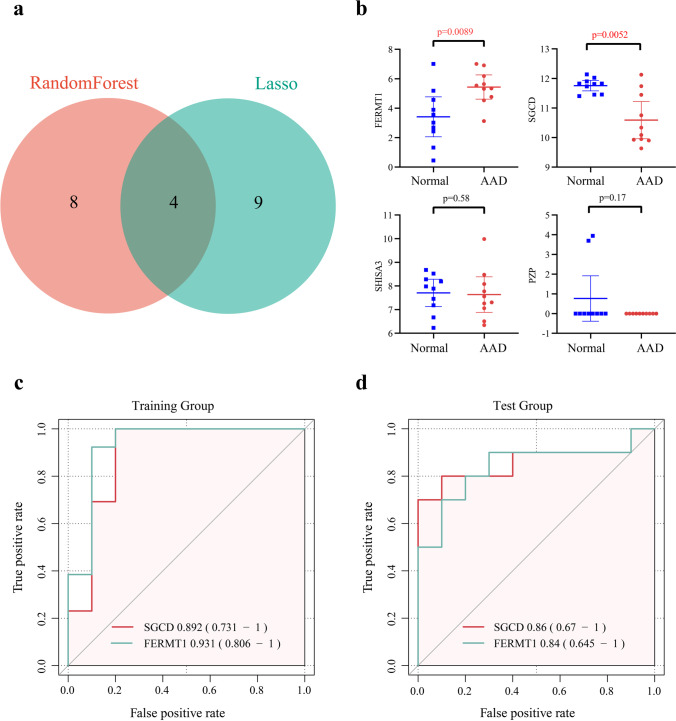
After inputting the 519 DEGs into the LASSO regression model and RF classifier, 13 and 12 candidate genes were respectively identified (Fig. 3a, b). The results of the two models were plotted against the clustering heatmap, and the results showed that the candidate genes identified by both models could distinguish the healthy and AAD samples in the training set, with the candidate genes screened from the LASSO analysis having a better clustering ability (Fig. 3c, d). The results obtained from the two algorithms were subsequently intersected to obtain four genes, namely, FERMT1, SGCD, SHISA3, and PZP (Fig. 4a). The expression levels of these four genes were identified in the validation set GSE1534345, where the expression of FERMT1 and SGCD were consistent with the training set and were thus identified as key AAD genes (Fig. 4b). Evaluating the accuracy of the two key markers using ROC curves in the training and validation sets showed that the AUC values of SGCD and FERMT1 in the training set were 0.89 and 0.93, respectively (Fig. 4c). Consistent with this, the AUC values of both genes in the validation set were also high (Fig. 4d), at 0.86 and 0.84, respectively. In summary, SGCD and FERMT1 were found to have high predictive values for AAD.
Fig. 3.
Key markers screened and heatmap. a Thirteen key markers were screened out using the Lasso regression model. b Results of 12 key markers screening using the random forest classifier Gini coefficient algorithm. c–d Sample clustering heatmap. Samples were clustered by the key markers screened from the two models. Red and blue indicate genes with high and low expression in the samples, respectively. Green and red bands on the upper edge of the heat map indicate healthy and AAD samples respectively
Fig. 4.
Screening and evaluation of key markers. a The results of the two machine learning models were intersected, and four candidate genes were obtained. b The four genes were validated in the validation set, and FERMT1 and SGCD were found to be differentially expressed. c–d AUC values of the two genes in the training set and validation set
Construction of a predictive model using an artificial neural network
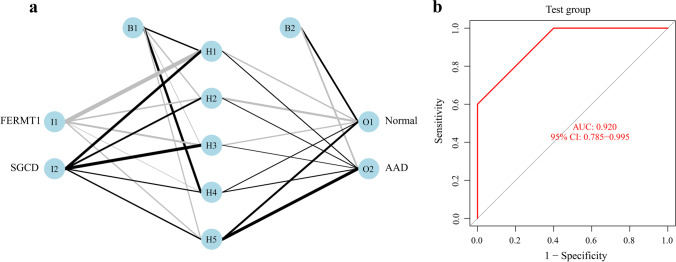
The expression data for the two key markers were converted into a “gene score table,” and the weights of each gene were optimized using a neural network algorithm (Fig. 5a). The gene scores and gene weights of the two key markers were multiplied to obtain disease classification scores. Next, we used the classification score values for the 22 samples in the training set as the predicted values and the clinical outcomes of AAD as the true values. The calculation was performed; for the training set, the AUC value of the prediction model obtained using the neural network was 0.950 (Supplementary Fig. 1). And for the validation set of 20 samples, the AUC value was 0.92 (Fig. 5b).
Fig. 5.
Neural network prediction model. a Visualization results in the validation set of 20 samples. b Model ROC curve validation results
Immune infiltration and correlation analysis
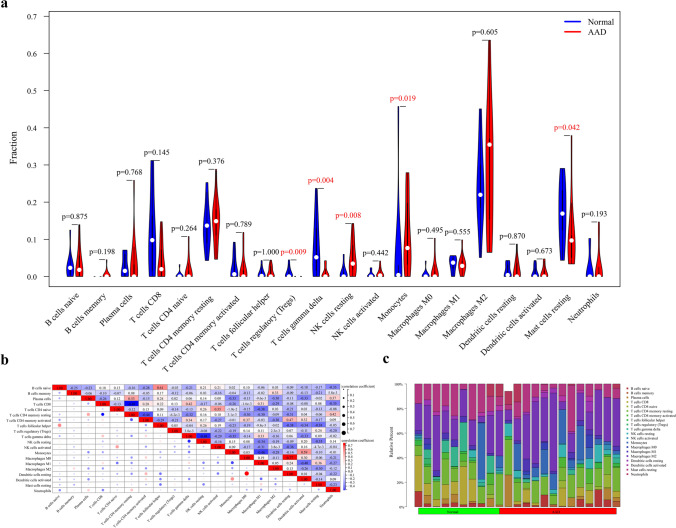
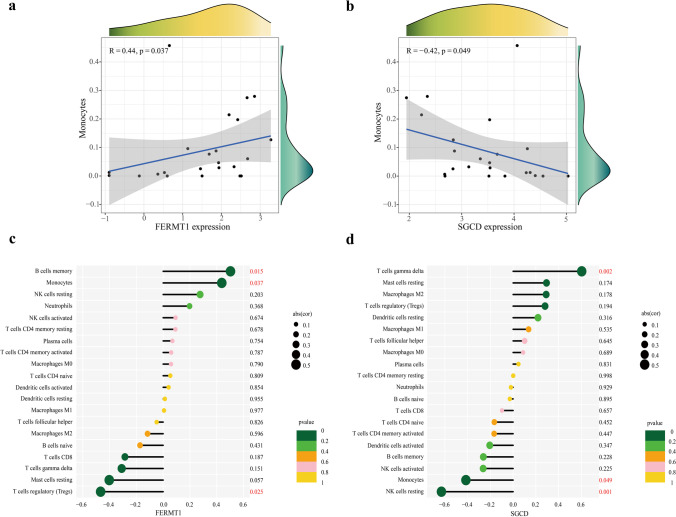
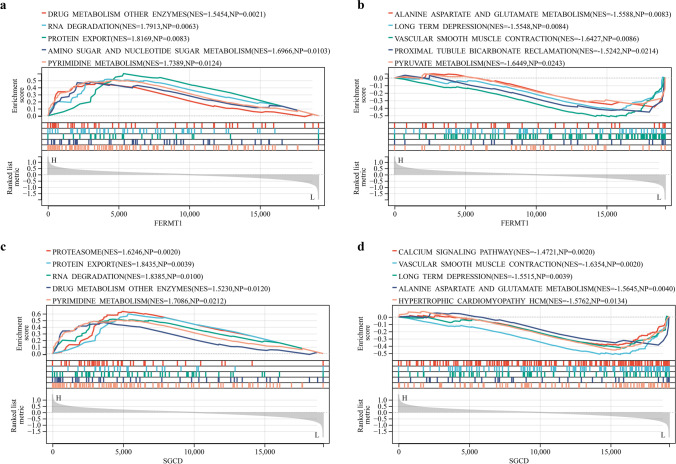
According to the results of immune cell composition abundance calculated by CIBERSORT algorithm, after excluding two types of cells that were not expressed in the samples, the expression results of the remaining 20 types of immune cells in the AAD and healthy human samples are shown in Fig. 6c. Compared to healthy individuals, the expression of the monocyte-macrophage system and quiescent NK cells was significantly increased in AAD tissues. In contrast, the expression of regulatory T cells, γδ T cells, and mast cells were decreased (Fig. 6a). Correlation analysis between immune cell types indicated a significant positive correlation between quiescent dendritic cells and M0 macrophages in patients with AAD (Fig. 6b). The results of the correlation analysis between the key markers and immune cells (Fig. 7) show that FERMT1 was positively correlated with monocytes (p = 0.037) and memory B cells (p = 0.015) and negatively correlated with regulatory T cells (p = 0.025) (Fig. 7c) and SGCD was positively correlated with γδ T cells (p = 0.002) and negatively correlated with monocytes (p = 0.049) and quiescent NK cells (p = 0.001) (Fig. 7d). Scatter plots showing the correlations between the two genes and the common monocytes are presented in Fig. 7a, b. And the results of the GSEA analysis of FERMT1 and SGCD are shown in Fig. 8.
Fig. 6.
Analysis of the immune infiltrating cells between AAD and healthy human tissues. a Violin plot showing the differentiation of the ratio of the 20 immune cell types between AAD samples and healthy human samples using the Wilcoxon rank-sum test. b Correlation analysis between each immune cell type. c Bar graph showing the ratio of the 20 immune cell types in the AAD samples in the training set, with each column representing one sample
Fig. 7.
Correlation analysis between FERMT1 and SGCD and immune infiltrating cells in the training set. a, b correlation between monocytes with FERMT1 and SGCD respectively. c, d correlation analysis of infiltration levels of the 20 immune cell types with FERMT1 and SGCD respectively
Fig. 8.
The GSEA of FERMT1 and SGCD. a Pathways are significantly related to high expression of FERMT1. b Pathways are significantly related to low expression of FERMT1. c Pathways significantly related to high expression of SGCD. d Pathways are significantly related to low expression of SGCD (p < 0.05)
Enrichment analysis of ssGSEA
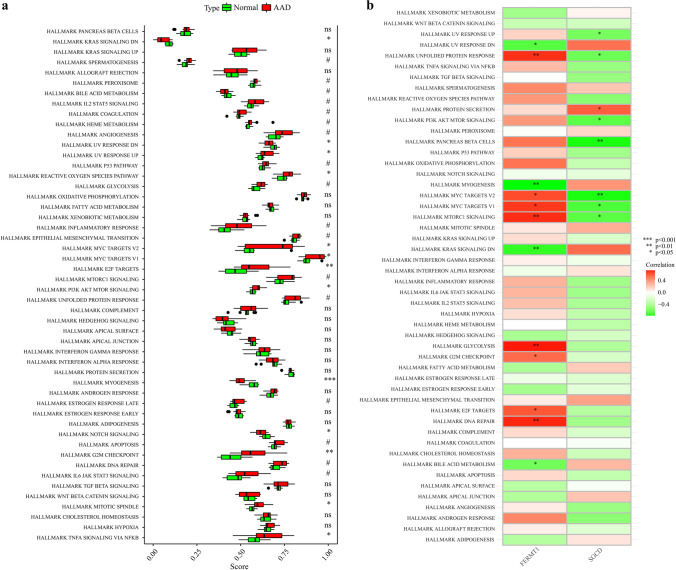
The hallmark gene set from the MsigDB database is used as a reference for ssGSEA to explore the further potential mechanisms of AAD in pathogenesis. A total of 13 genomes in 50 gene sets were significantly enriched (p < 0.05). These genomes are mainly enriched in KRAS signaling down (p < 0.05), UV response down (p < 0.05), UV response up (p < 0.05), reactive oxygen species pathway (p < 0.05), MYC targets v2 (p < 0.05), MYC targets v1 (p < 0.05), E2F targets (p < 0.01), PI3K AKT MTOR signaling (p < 0.05), myogenesis (p < 0.001), Notch signaling (p < 0.05), G2M checkpoint (p < 0.01), mitotic spindle (p < 0.05), and TNFA signaling via NFKB (p < 0.05). These results demonstrate the key role of hallmark gene set-related pathways in the occurrence and progression of AAD (Fig. 9a). The results of the correlation of FERMT1 and SGCD between hallmark gene set are shown in Fig. 9b.
Fig. 9.
The results of ssGSEA for AAD and 2 key markers. a The relative immune infiltration score between AAD and healthy group. b The relative immune infiltration with 2 key markers. Red represents positive correlation, and the green represents negative correlation (*p < 0.05, **p < 0.01, ***p < 0.001)
Validation in clinical tissues and plasma samples
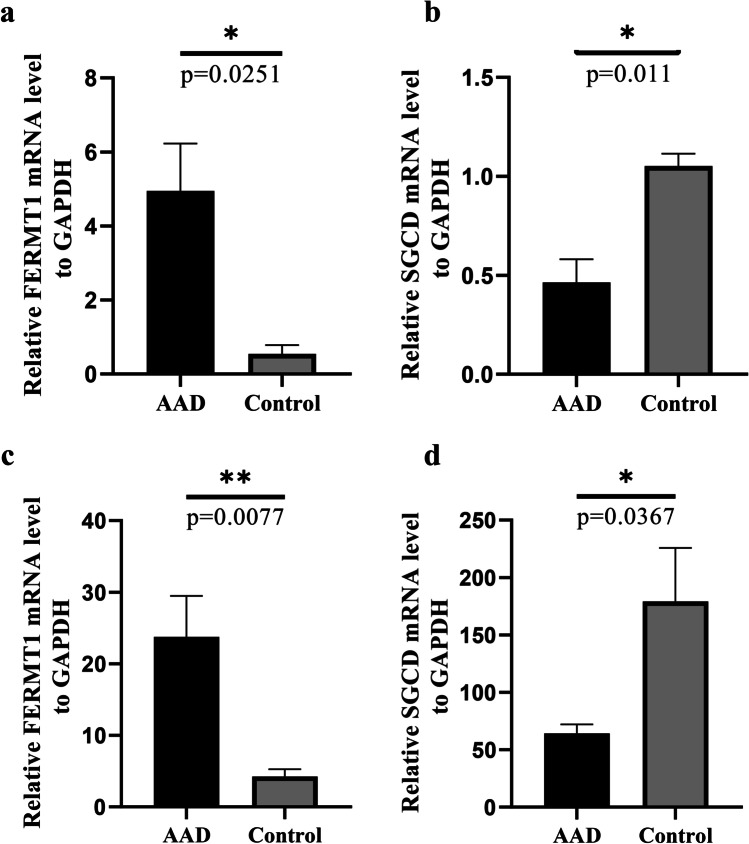
To further assess the value of SGCD and FERMT1 as biomarkers, the expression levels of SGCD and FERM1 were evaluated in the aortic tissues and plasma of patients with AAD and healthy controls. The expression of FERMT1 was significantly higher in the dissected tissues and plasma collected from patients with AAD (Fig. 10a, c), and SGCD was significantly lower (p < 0.05) when compared to the healthy controls (Fig. 10b, d), which was accordant with the results of our analysis. Overall, these results suggest that FERMT1 and SGCD could be key biomarkers for AAD.
Fig. 10.
Fluorescence quantitative PCR validation of the expression levels of key markers in AAD versus healthy controls. a mRNA expression of FERMT1 in aortic tissue. b mRNA expression of SGCD in aortic tissue. c mRNA expression of FERMT1 in plasma. d mRNA expression of SGCD in plasma. All experiments were performed in triplicate. Data are expressed as mean ± SEM (*p < 0.05, **p < 0.01)
Protein subcellular localization and correlation with immune checkpoint analyses of FERMT1 and SGCD
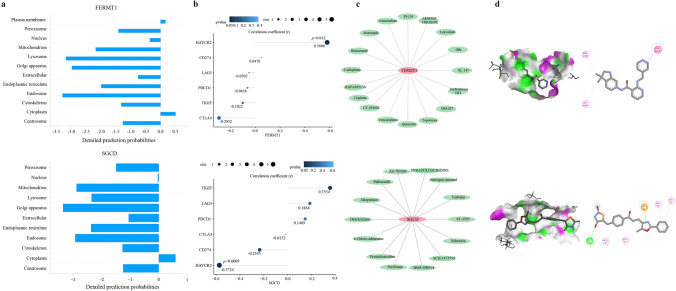
The protein subcellular localization of FERMT1 and SGCD predicted by Cell-PLOc 2.0 is in the cytoplasm (Fig. 11a). And FERMT1 was significantly positively correlated with the immune checkpoint HAVCR2 (p = 0.012), while SGCD was significantly negatively correlated with HAVCR2 (p = 0.0009) as shown in Fig. 11b, further indicating the important role of FERMT1 and SGCD in the immune response.
Fig. 11.
Integrated analyses of FERMT1 and SGCD. a Protein subcellular localization of FERMT1 and SGCD. b The correlation between immune checkpoints and FERMT1 and SGCD. c Drug–gene interaction network of FERMT1 and SGCD. d Molecular docking between 2 genes and 2 drugs
Drug–gene interaction and molecular docking analyses of FERMT1 and SGCD
Searching for targeted drugs for FERMT1 and SGCD provides a new strategy for potential drug therapy for AAD. The drug–gene interaction network of two genes is shown in Fig. 11c. We constructed the drug target network based on the drugs negatively correlated with the IC50 [39] coefficient. We selected motesanib and pyrazoloacridine, which have the strongest correlation, to bind to FERMT1 and SGCD respectively. The results showed that the binding of the two drugs to the two genes was stable (Fig. 11d), suggesting that they may be used as new drugs to guide the treatment of AAD.
Discussion
AAD is a catastrophic illness that remains a major challenge for global public health. Early detection, prevention, and intervention of potential risk factors for AAD are the key to reduce morbidity and mortality. Screening potential susceptibility genes and revealing their biological mechanisms in AAD are considered to be effective strategies for predicting diagnosis, targeted prevention, and personalized treatment of diseases [40]. Therefore, in the present study, SGCD and FERMT1 were identified as novel genetic markers that may be involved in the pathogenesis of AAD in the context of PPPM through the comprehensive mining of GEO databases combined with multiple machine learning models, and their roles in immune infiltration mechanisms were investigated to help elucidate new strategies for preventing and treating AAD.
Selection and construction of AAD prediction methods within the framework of PPPM
In the last decade, a large number of studies on aortic dissection and aneurysm disease have shown explosive growth worldwide, which undoubtedly shows that AAD is currently imposing a huge socioeconomic burden on primary, secondary, and tertiary healthcare systems [41]. The paradigm shift from responsiveness to predictability, preventive, and personalized medicine (PPPM) has been announced as an important shift in health care for patients with AAD. To this end, a specific combination of biomarkers helps to tailor personalized prevention and treatment strategies for AAD patients. Emerging algorithms, particularly machine learning algorithms such as LASSO, RF, and ANN, have contributed to discovering disease biomarkers, providing new methods for disease diagnosis or outcomes in many fields [42]. However, studies applying machine learning to screen for AAD-related markers are lacking. The present study highlights the innovative combination of two machine learning models, the Lasso regression model with excellent dimensionality reduction and RF, which has the best performance among classifiers with easy-to-implement and straightforward algorithms. Both have been demonstrated to have robust performance capacities in many real-world tasks. A study compared the classification performance of 179 classification algorithms on 121 UCI datasets through extensive experiments, and the results showed that RF achieved a maximum accuracy of 94.1% in 84.3% of the datasets [43]. In addition, disease prediction and diagnosis models constructed using ANN have enjoyed widespread application [44]. We validated the intersection of the results of the Lasso and RF algorithms in an independent external dataset, which significantly reduced the risk bias of our study, and found good AUC values for the two key markers identified, FERMT1 and SGCD. Subsequently, we determined the predictive weights of the two key markers in the training cohort using a neural network model. We used them to construct the NeuraAAD classification scoring model for AAD. Finally, the classification efficiency of the model was evaluated in an independent external sample dataset, and high AUC values were obtained, indicating that NeuraAAD has better classification efficiency than the two AAD key markers alone. Collectively, this pioneering study may provide new perspectives for identifying biomarkers that could assist in preventing AAD.
Biological characteristics and functions of two key markers in cardiovascular disease
SGCD and FERMT1 were identified in the present study as key markers in the pathogenesis of AAD, and they both have crucial roles in cardiovascular disease. FERMT1 is an adapter protein expressed by most epithelial cells and forms the kindlin family with FERMT2 and FERMT3. As an evolutionarily conserved focal adhesion (FA) protein, FERMT1 activates integrin and ligand by binding to the tail of β-integrin [45] and mediates cell adhesion, migration, extracellular matrix aggregation, proliferation, and differentiation [46]. Reduced FERMT1 expression leads to the dysregulation of integrin function, causing an upregulation of matrix metalloproteinase and pro-inflammatory cytokine expression [47, 48]. FERMT1 is also an inducible gene of the TGF-β signaling pathway. Their expression levels are correlated, and FERMT1 has been found to mediate the involvement of TGF-β in mammalian cell adhesion processes through integrin-dependent cells [49]. Previous studies have confirmed that abnormal TGF-β pathway expression plays a vital role in the development of AAD [50]. Consequently, we speculated that FERMT1 might be involved in the development of AAD through the regulation of TGF-β pathway expression. SGCD is closely associated with cardiomyopathy [51], but its relationship with AAD has not yet been investigated. An SGCD gene knockdown was previously found to damage cardiomyocytes and lead to structural remodeling of the heart [52], suggesting that SGCD should be studied further in cardiovascular diseases. Notably, we confirmed in clinical specimens that FERMT1 and SGCD expression levels differed significantly in the aortic tissues of patients with AAD when compared to healthy controls. Overall, the two core molecules screened may be involved in the development of AAD from different perspectives, so it is reasonable to use them as predictive and risk assessment factors.
The role of immune infiltration and two key genes in AAD
In this investigation, the GO annotation, KEGG, and GSEA enrichment analysis of the DEGs in the training set suggested mechanisms predominantly associated with immune and inflammatory responses. We thus used the CIBERSORT deconvolution algorithm to characterize the expression profile of immune infiltration in AAD patient tissues. The expression profiles of regulatory T cells, monocytes, γδ T cells, quiescent NK cells, and mast cells were significantly different from those in the healthy controls, which is consistent with the results from earlier studies. During the degeneration of the middle layer of the aorta, a large number of T lymphocytes infiltrate the lesion and cause apoptosis of the smooth muscle cells (SMCs) through the Fas-FasL pathway, thereby weakening the vessel wall and leading to the development of AD [53]. In contrast, regulatory T cells are reduced in AD. The expression of regulatory T cells has protective effects on AD by reducing immune cell activation, upregulating interleukin IL-10 expression, and enhancing its anti-inflammatory effects, thus reducing the inflammatory response in vessels and preventing the development of AD and aneurysms [54, 55]. The inflammatory response in AAD involves the infiltration of monocytes and macrophages into the aortic wall [56]. Most of these macrophages are derived from circulating monocytes, which are rapidly attracted to activated endothelial cells during inflammation. Aortic adventitial fibroblasts produce the pro-inflammatory cytokine IL-6 and monocyte chemokine MCP-1, which promotes the differentiation of monocytes to macrophages and mediates subsequent inflammatory responses, including extracellular matrix plasticity, the promotion of inflammation, and tissue healing responses [57–59]. Neutrophils play vital roles in phagocytosis and chemotaxis and are the principal cells that secrete MMP-2 and MMP-9. Some researchers have found high expression levels of chemokines and granulocyte colony-stimulating factors in AAD lesions, which leads to significant infiltration of the peripheral neutrophils that secrete IL-6 and MMP-9, thereby promoting the inflammatory response and degradation of elastic fibers and accelerating the expansion and rupture of the dissection [60]. In addition, we analyzed the correlation of immune cells with key markers to further investigate their pathogenic mechanisms relative to immune infiltration. Our results showed that FERMT1 expression was positively correlated with monocyte and memory B cell expression and negatively correlated with Treg cell expression in AAD tissues. In contrast, SGCD was positively correlated with γδ T cells and negatively correlated with monocytes and quiescent NK cells. A study showed that Treg cell deficiency promoted aortic aneurysm in mice and that the addition of Treg cells to CD28−/− Treg-deficient mice prevented AAD development. Another study showed that B cells infiltrated into aortic dissection tissues. Moreover, the expression of genes that are associated with the B cell receptor signaling pathway increased in aortic tissues in BAPN-treated mice in the early stage of the pathogenesis of AAD. Therefore, the reduction of B cells appears to protect the mice from developing AAD [61]. These lines of evidence suggest that future research should focus on elucidating the mechanisms underlying the inflammatory immune response to AAD, enabling the development of immune-infiltration-targeted personalized therapies for AAD.
Drug target screening and AAD control strategy in the framework of PPPM
What is essential for the management of AAD is the primary prevention of risk factors for aortic rupture, such as blood pressure control, smoking control, healthy diet, and weight loss [62]. Some studies have shown that the pathogenesis of AAD may be related to angiogenesis [63]. We identified the targeted therapy drug relationship network of FERMT1 and SGCD. Motesanib and Pyrazoloacridine are confirmed as gene targeting drugs and are beneficial to the treatment of AAD, and the results of molecular docking showed that drug binding to the gene is firmly established. Motesanib and pyrazoloacridine are common antineoplastic drugs [64, 65], which are rarely used in cardiovascular diseases. The main pathogenic mechanism of these two drugs is anti-angiogenesis; from the perspective of PPPM, controlling neovascularization has great clinical potential in effectively preventing the occurrence of AAD, so we speculate that the two drugs may provide some help in the personalized treatment of AAD. For the healthy population with abnormal expression of two key targets, the risk factors of AAD should be comprehensively evaluated and actively controlled to prevent or delay the occurrence and progress of AAD. For patients with established or postoperative AAD and abnormal expression of FERMT1 and SGCD, it is recommended to start secondary and tertiary prevention in time to prevent deterioration or postoperative recurrence.
Limitations and future studies
Finally, there were several limitations in this present study. Firstly, due to the small number of AAD samples in the GEO database, the number of subjects included in this study is limited, which affects the reliability of the model and may miss some biomarkers. More external validation of the model under different settings and groups is needed to fully understand model portability. Secondly, it is a retrospective analysis that lacks detailed clinical information; the clinical utility of this study needs to be demonstrated in a larger prospective validation cohort. Lastly, our study preliminarily screened the key markers of AAD through public data; further experiments in vivo and in vitro are required to investigate its detailed mechanisms in AAD, which may help FERMT1 and SGCD to apply in the field of PPPM for AAD.
Conclusions
In summary, we identified FERMT1 and SGCD as key markers associated with AAD using an innovative combined machine learning approach and constructed a novel predictive model for AAD. Targeted drugs based on FERMT1 and SGCD were also screened, providing a new strategy for potential drug treatment of AAD. In addition, the immune infiltration profile in the tissues of patients with AAD and the correlation between key markers and immune cells were investigated. These results may help guide the development of targeted prevention and personalized treatment in AAD and promote the paradigm shift from reactive medical services to PPPM.
Expert recommendations and outlook within the framework of PPPM
Herein, from the perspective of PPPM, we strongly recommend FERMT1 and SGCD as biomarkers for predictive diagnosis and targeted prevention of AAD, as well as special targets for personalized treatment of AAD patients. First of all, this study focuses on the identification of AAD key biomarker genes based on integrated bioinformatics methods and a variety of machine learning strategies. The results provide scientific data for screening the key characteristics of AAD and elucidating the molecular mechanisms related to immune infiltration, which will be helpful to the PPPM practice of AAD. Secondly, the results of detecting the expression of two key markers in human peripheral blood and tissues also suggest that it is necessary to determine the normal reference values of FERMT1 and SGCD and the diagnostic threshold of AAD in healthy people in the future, which can improve the strategy of preventing AAD based on PPPM. By dynamically monitoring the levels of key markers in blood circulation in patients with high-risk factors of AAD (such as hypertension and obesity), potential diseases can be detected as early as possible so that medical intervention can be carried out more timely and accurately. Therefore, in the future, it may be necessary to introduce high-order algorithms to comprehensively analyze these factors to improve the prediction effectiveness of our model. In addition, the pathogenesis of AAD caused by the changes of FERMT1 and SGCD may be mediated by a variety of immune infiltration pathways and immune cells, especially the monocyte-macrophage system, which may contribute to the targeted prevention and personalized medical services of AAD patients. Finally, AAD-targeted drug therapy based on two key markers is a very promising method. Our study screened two accurate drugs for the prevention and treatment of AAD, which developed a new and effective drug treatment strategy for AAD's PPPM practice. All of these are consistent with the concept of “early prediction, accurate prevention, and patient-centered personalized medical medicine” advocated by PPPM and will be the development trend of the concept of prevention and treatment of AAD patients in the future.
Data availability
Publicly available datasets were analyzed in this study. These data can be found here:https://www.ncbi.nlm.nih.gov/geo/.
Supplementary Information
Below is the link to the electronic supplementary material.
Acknowledgements
We would like to thank the Gene Expression Omnibus (GEO) database for the precious data used for free in scientific research.
Author contribution
Mierxiati: study design, data collection, statistical analysis, visualization, writing, and revised original draft. Wang Qi and Gulinazi revised the manuscript and performed the experiments. Ma Xiang led the study and provided scientific supervision. The final draft was verified by all authors before the submission.
Funding
This work was supported by the Construction of key laboratories in Xinjiang Uygur Autonomous Region (NO.2019D04017) and the Tianshan cedar Project Fund of Xinjiang (2020XS13).
Code availability
The code that supports the findings of this study is available from the corresponding author upon request.
Declarations
Ethics approval
Data retrieved from the GEO database was collected from patients who provided informed consent based on guidelines laid out by the GEO Ethics, Law, and Policy Group. The procedures used in this study adhere to the tenets of the Declaration of Helsinki and approval was obtained from the ethics committee of Xinjiang Medical University.
Consent to participate
Not applicable.
Consent for publication
Not applicable.
Conflict of interest
The authors declare no competing interests.
Footnotes
Publisher's Note
Springer Nature remains neutral with regard to jurisdictional claims in published maps and institutional affiliations.
References
- 1.Nienaber CA, Clough RE, Sakalihasan N, Suzuki T, Gibbs R, Mussa F, et al. Aortic dissection. Nat Rev Dis Primers. 2016;2:16053. doi: 10.1038/nrdp.2016.53. [DOI] [PubMed] [Google Scholar]
- 2.Golledge J, Eagle KA. Acute aortic dissection. Lancet. 2008;372:55–66. doi: 10.1016/S0140-6736(08)60994-0. [DOI] [PubMed] [Google Scholar]
- 3.Hagan PG, Nienaber CA, Isselbacher EM, Bruckman D, Karavite DJ, Russman PL, et al. The international registry of acute aortic dissection (IRAD): new insights into an old disease. JAMA. 2000;283:897. doi: 10.1001/jama.283.7.897. [DOI] [PubMed] [Google Scholar]
- 4.Mészáros I, Mórocz J, Szlávi J, Schmidt J, Tornóci L, Nagy L, et al. Epidemiology and clinicopathology of aortic dissection. Chest. 2000;117:1271–1278. doi: 10.1378/chest.117.5.1271. [DOI] [PubMed] [Google Scholar]
- 5.Zhu Y, Lingala B, Baiocchi M, Tao JJ, Toro Arana V, Khoo JW, et al. Type A aortic dissection—experience over 5 decades. J Am Coll Cardiol. 2020;76:1703–1713. doi: 10.1016/j.jacc.2020.07.061. [DOI] [PubMed] [Google Scholar]
- 6.Nienaber CA, Clough RE. Management of acute aortic dissection. The Lancet. 2015;385:800–811. doi: 10.1016/S0140-6736(14)61005-9. [DOI] [PubMed] [Google Scholar]
- 7.Grech G, Zhan X, Yoo BC, Bubnov R, Hagan S, Danesi R, et al. EPMA position paper in cancer: current overview and future perspectives. EPMA Journal. 2015;6:9. doi: 10.1186/s13167-015-0030-6. [DOI] [PMC free article] [PubMed] [Google Scholar]
- 8.Evangelista A, Isselbacher EM, Bossone E, Gleason TG, Eusanio MD, Sechtem U, et al. Insights from the international registry of acute aortic dissection: a 20-year experience of collaborative clinical research. Circulation. 2018;137:1846–1860. doi: 10.1161/CIRCULATIONAHA.117.031264. [DOI] [PubMed] [Google Scholar]
- 9.Klompas M. Does this patient have an acute thoracic aortic dissection? 2000;11. 10.1001/jama.287.17.2262 [DOI] [PubMed]
- 10.Golubnitschaja O, Baban B, Boniolo G, Wang W, Bubnov R, Kapalla M, et al. Medicine in the early twenty-first century: paradigm and anticipation - EPMA position paper 2016. EPMA Journal. 2016;7:23. doi: 10.1186/s13167-016-0072-4. [DOI] [PMC free article] [PubMed] [Google Scholar]
- 11.Dalman RL, Wanhainen A, Mani K, Modarai B. Top 10 candidate aortic disease trials. J Intern Med. 2020;288:23–37. doi: 10.1111/joim.13042. [DOI] [PubMed] [Google Scholar]
- 12.Bossone E, Czerny M, Lerakis S, Rodríguez-Palomares J, Kukar N, Ranieri B, et al. Imaging and biomarkers in acute aortic syndromes: diagnostic and prognostic implications. Curr Probl Cardiol. 2021;46:100654. doi: 10.1016/j.cpcardiol.2020.100654. [DOI] [PubMed] [Google Scholar]
- 13.Nazerian P, Mueller C. Soeiro A de M, Leidel BA, Salvadeo SAT, Giachino F, et al Diagnostic accuracy of the aortic dissection detection risk score plus D-dimer for acute aortic syndromes the ADvISED Prospective Multicenter Study. Circulation. 2018;137:250–8. doi: 10.1161/CIRCULATIONAHA.117.029457. [DOI] [PubMed] [Google Scholar]
- 14.Fletcher AJ, Syed MBJ, Aitman TJ, Newby DE, Walker NL. Inherited thoracic aortic disease: new insights and translational targets. Circulation. 2020;141:1570–1587. doi: 10.1161/CIRCULATIONAHA.119.043756. [DOI] [PMC free article] [PubMed] [Google Scholar]
- 15.Nienaber CA, Powell JT. Management of acute aortic syndromes. Eur Heart J. 2012;33:26–35. doi: 10.1093/eurheartj/ehx319. [DOI] [PubMed] [Google Scholar]
- 16.Skotsimara G. Aortic wall inflammation in the pathogenesis, diagnosis and treatment of aortic aneurysms. :12. 10.1007/s10753-022-01626-z [DOI] [PubMed]
- 17.Del Porto F, Proietta M, Tritapepe L, Miraldi F, Koverech A, Cardelli P, et al. Inflammation and immune response in acute aortic dissection. Ann Med. 2010;42:622–629. doi: 10.3109/07853890.2010.518156. [DOI] [PubMed] [Google Scholar]
- 18.Cifani N, Proietta M, Tritapepe L, Di Gioia C, Ferri L, Taurino M, et al. Stanford-A acute aortic dissection, inflammation, and metalloproteinases: a review. Ann Med. 2015;47:441–446. doi: 10.3109/07853890.2015.1073346. [DOI] [PubMed] [Google Scholar]
- 19.Stranneheim H, Wedell A. Exome and genome sequencing: a revolution for the discovery and diagnosis of monogenic disorders. J Intern Med. 2016;279:3–15. doi: 10.1111/joim.12399. [DOI] [PubMed] [Google Scholar]
- 20.Deo RC. Machine learning in medicine. Circulation. 2015;132:1920–1930. doi: 10.1161/CIRCULATIONAHA.115.001593. [DOI] [PMC free article] [PubMed] [Google Scholar]
- 21.Greener JG, Kandathil SM, Moffat L, Jones DT. A guide to machine learning for biologists. Nat Rev Mol Cell Biol. 2022;23:40–55. doi: 10.1038/s41580-021-00407-0. [DOI] [PubMed] [Google Scholar]
- 22.Buzdin A, Sorokin M, Garazha A, Glusker A, Aleshin A, Poddubskaya E, et al. RNA sequencing for research and diagnostics in clinical oncology. Semin Cancer Biol. 2020;60:311–323. doi: 10.1016/j.semcancer.2019.07.010. [DOI] [PubMed] [Google Scholar]
- 23.Leek JT, Johnson WE, Parker HS, Jaffe AE, Storey JD. The SVA package for removing batch effects and other unwanted variation in high-throughput experiments. Bioinformatics. 2012;28:882–883. doi: 10.1093/bioinformatics/bts034. [DOI] [PMC free article] [PubMed] [Google Scholar]
- 24.Ritchie ME, Phipson B, Wu D, Hu Y, Law CW, Shi W, et al. limma powers differential expression analyses for RNA-sequencing and microarray studies. Nucleic Acids Research. 2015;43:e47–e47. doi: 10.1093/nar/gkv007. [DOI] [PMC free article] [PubMed] [Google Scholar]
- 25.Carlson M. org.Mm.eg.db [Internet]. Bioconductor; 2017 [cited 2022 Apr 29]: https://bioconductor.org/packages/org.Mm.eg.db10.18129/B9.BIOC.ORG.MM.EG.DB.
- 26.Yu G, Wang L-G, Han Y, He Q-Y. clusterProfiler: an R package for comparing biological themes among gene clusters. OMICS A Journal of Integrative Biology. 2012;16:284–7. doi: 10.1089/omi.2011.0118. [DOI] [PMC free article] [PubMed] [Google Scholar]
- 27.Tibshirani R. The Lasso method for variable selection in the Cox model. Statist Med. 1997;16:385–395. doi: 10.1002/(SICI)1097-0258(19970228)16:4<385::AID-SIM380>3.0.CO;2-3. [DOI] [PubMed] [Google Scholar]
- 28.Breiman L. No title found. Mach Learn. 2001;45:5–32. doi: 10.1023/A:1010933404324. [DOI] [Google Scholar]
- 29.Liaw A, Wiener M. Classification and regression by randomForest. 2002;2:5. [Google Scholar]
- 30.Moskowitz CS. Using free-response receiver operating characteristic curves to assess the accuracy of machine diagnosis of cancer. JAMA. 2017;318:2250. doi: 10.1001/jama.2017.18686. [DOI] [PubMed] [Google Scholar]
- 31.Choi RY, Coyner AS, Kalpathy-Cramer J, Chiang MF, Campbell JP. Introduction to machine learning, Neural Networks, and Deep Learning. Neural Networks. :12. 10.1167/tvst.9.2.14 [DOI] [PMC free article] [PubMed]
- 32.Beck MW. NeuralNetTools : Visualization and analysis tools for neural networks. J Stat Soft [Internet]. 2018 [cited 2022 Apr 29];85. Available from: http://www.jstatsoft.org/v85/i11/ [DOI] [PMC free article] [PubMed]
- 33.Newman AM, Liu CL, Green MR, Gentles AJ, Feng W, Xu Y, et al. Robust enumeration of cell subsets from tissue expression profiles. Nat Methods. 2015;12:453–457. doi: 10.1038/nmeth.3337. [DOI] [PMC free article] [PubMed] [Google Scholar]
- 34.Kim Y, Kang JW, Kang J, Kwon EJ, Ha M, Kim YK, et al. Novel deep learning-based survival prediction for oral cancer by analyzing tumor-infiltrating lymphocyte profiles through CIBERSORT. OncoImmunology. 2021;10:1904573. doi: 10.1080/2162402X.2021.1904573. [DOI] [PMC free article] [PubMed] [Google Scholar]
- 35.Liberzon A, Subramanian A, Pinchback R, Thorvaldsdottir H, Tamayo P, Mesirov JP. Molecular signatures database (MSigDB) 3.0. Bioinformatics. 2011;27:1739. doi: 10.1093/bioinformatics/btr260. [DOI] [PMC free article] [PubMed] [Google Scholar]
- 36.Schmittgen TD, Livak KJ. Analyzing real-time PCR data by the comparative CT method. Nat Protoc. 2008;3:1101–1108. doi: 10.1038/nprot.2008.73. [DOI] [PubMed] [Google Scholar]
- 37.Chou K-C, Shen H-B. Cell-PLoc: a package of Web servers for predicting subcellular localization of proteins in various organisms. Nat Protoc. 2008;3:153–162. doi: 10.1038/nprot.2007.494. [DOI] [PubMed] [Google Scholar]
- 38.Trott O, Olson AJ. AutoDock Vina: Improving the speed and accuracy of docking with a new scoring function, efficient optimization, and multithreading. J Comput Chem. 2009;NA-NA. 10.1002/jcc.21334. [DOI] [PMC free article] [PubMed]
- 39.W. Caldwell G, Yan Z, Lang W, A. Masucci J. The IC50 concept revisited. CTMC 2012;12:1282–90. 10.2174/156802612800672844. [DOI] [PubMed]
- 40.Renard M. Clinical validity of genes for heritable thoracic aortic aneurysm and dissection. 2018;72:11. doi: 10.1016/j.jacc.2018.04.089. [DOI] [PMC free article] [PubMed] [Google Scholar]
- 41.Bossone E, Eagle KA. Epidemiology and management of aortic disease: aortic aneurysms and acute aortic syndromes. Nat Rev Cardiol. 2021;18:331–348. doi: 10.1038/s41569-020-00472-6. [DOI] [PubMed] [Google Scholar]
- 42.Reel PS, Reel S, Pearson E, Trucco E, Jefferson E. Using machine learning approaches for multi-omics data analysis: a review. Biotechnol Adv. 2021;49:107739. doi: 10.1016/j.biotechadv.2021.107739. [DOI] [PubMed] [Google Scholar]
- 43.Fernandez-Delgado M, Cernadas E, Barro S, Amorim D. Do we need hundreds of classifiers to solve real world classification problems? :49.
- 44.Zhang Y, Lin H, Yang Z, Wang J, Sun Y, Xu B, et al. Neural network-based approaches for biomedical relation classification: a review. J Biomed Inform. 2019;99:103294. doi: 10.1016/j.jbi.2019.103294. [DOI] [PubMed] [Google Scholar]
- 45.Rognoni E, Ruppert R, Fässler R. The kindlin family: functions, signaling properties and implications for human disease. J Cell Sci. 2016;129:17–27. doi: 10.1242/jcs.161190. [DOI] [PubMed] [Google Scholar]
- 46.Siegel DH, Ashton GHS, Penagos HG, Lee JV, Feiler HS, Wilhelmsen KC, et al. Loss of Kindlin-1, a human homolog of the Caenorhabditis elegans actin–extracellular-matrix linker protein UNC-112, causes Kindler syndrome. The American Journal of Human Genetics. 2003;73:174–187. doi: 10.1086/376609. [DOI] [PMC free article] [PubMed] [Google Scholar]
- 47.Malinin NL, Plow EF, Byzova TV. Kindlins in FERM adhesion. Blood. 2010;115:4011–4017. doi: 10.1182/blood-2009-10-239269. [DOI] [PMC free article] [PubMed] [Google Scholar]
- 48.Qu H, Wen T, Pesch M, Aumailley M. Partial loss of epithelial phenotype in Kindlin-1–deficient keratinocytes. Am J Pathol. 2012;180:1581–1592. doi: 10.1016/j.ajpath.2012.01.005. [DOI] [PubMed] [Google Scholar]
- 49.Rognoni E, Widmaier M, Jakobson M, Ruppert R, Ussar S, Katsougkri D, et al. Kindlin-1 controls Wnt and TGF-β availability to regulate cutaneous stem cell proliferation. Nat Med. 2014;20:350–359. doi: 10.1038/nm.3490. [DOI] [PMC free article] [PubMed] [Google Scholar]
- 50.Bauer R, Blain A, Greally E, Bushby K, Lochmüller H, Laval S, et al. Intolerance to β-blockade in a mouse model of δ-sarcoglycan-deficient muscular dystrophy cardiomyopathy. Eur J Heart Fail. 2010;12:1163–1170. doi: 10.1093/eurjhf/hfq129. [DOI] [PubMed] [Google Scholar]
- 51.Isselbacher EM, Lino Cardenas CL, Lindsay ME. Hereditary influence in thoracic aortic aneurysm and dissection. Circulation. 2016;133:2516–2528. doi: 10.1161/CIRCULATIONAHA.116.009762. [DOI] [PMC free article] [PubMed] [Google Scholar]
- 52.Heydemann A, McNally EM. Consequences of disrupting the dystrophin-sarcoglycan complex in Cardiac and Skeletal Myopathy. Trends Cardiovasc Med. 2007;17:55–59. doi: 10.1016/j.tcm.2006.12.002. [DOI] [PubMed] [Google Scholar]
- 53.He R, Guo D-C, Estrera AL, Safi HJ, Huynh TT, Yin Z, et al. Characterization of the inflammatory and apoptotic cells in the aortas of patients with ascending thoracic aortic aneurysms and dissections. J Thorac Cardiovasc Surg. 2006;131:671–678.e2. doi: 10.1016/j.jtcvs.2005.09.018. [DOI] [PubMed] [Google Scholar]
- 54.Rubtsov YP, Rasmussen JP, Chi EY, Fontenot J, Castelli L, Ye X, et al. Regulatory T cell-derived interleukin-10 limits inflammation at environmental interfaces. Immunity. 2008;28:546–558. doi: 10.1016/j.immuni.2008.02.017. [DOI] [PubMed] [Google Scholar]
- 55.Forrer A, Schoenrath F, Torzewski M, Schmid J, Franke UFW, Göbel N, et al. Novel blood biomarkers for a diagnostic workup of acute aortic dissection. Diagnostics. 2021;11:615. doi: 10.3390/diagnostics11040615. [DOI] [PMC free article] [PubMed] [Google Scholar]
- 56.Li X, Liu D, Zhao L, Wang L, Li Y, Cho K, et al. Targeted depletion of monocyte/macrophage suppresses aortic dissection with the spatial regulation of MMP-9 in the aorta. Life Sci. 2020;254:116927. doi: 10.1016/j.lfs.2019.116927. [DOI] [PubMed] [Google Scholar]
- 57.Cifani N, Proietta M, Taurino M, Tritapepe L, Del Porto F. Monocyte Subsets, Stanford-A acute aortic dissection, and carotid artery stenosis: new evidences. J Immunol Res. 2019;2019:1–6. doi: 10.1155/2019/9782594. [DOI] [PMC free article] [PubMed] [Google Scholar]
- 58.Tieu BC, Lee C, Sun H, LeJeune W, Recinos A, Ju X, et al. An adventitial IL-6/MCP1 amplification loop accelerates macrophage-mediated vascular inflammation leading to aortic dissection in mice. J Clin Invest. 2009;119:3637–3651. doi: 10.1172/JCI38308. [DOI] [PMC free article] [PubMed] [Google Scholar]
- 59.Tomida S, Aizawa K, Nishida N, Aoki H, Imai Y, Nagai R, et al. Indomethacin reduces rates of aortic dissection and rupture of the abdominal aorta by inhibiting monocyte/macrophage accumulation in a murine model. Sci Rep. 2019;9:10751. doi: 10.1038/s41598-019-46673-z. [DOI] [PMC free article] [PubMed] [Google Scholar]
- 60.Padang R, Bagnall RD, Richmond DR, Bannon PG, Semsarian C. Rare non-synonymous variations in the transcriptional activation domains of GATA5 in bicuspid aortic valve disease. J Mol Cell Cardiol. 2012;53:277–281. doi: 10.1016/j.yjmcc.2012.05.009. [DOI] [PubMed] [Google Scholar]
- 61.Gao Y, Wang Z, Zhao J, Sun W, Guo J, Yang Z, et al. Involvement of B cells in the pathophysiology of β-aminopropionitrile-induced thoracic aortic dissection in mice. Exp Anim. 2019;68:331–339. doi: 10.1538/expanim.18-0170. [DOI] [PMC free article] [PubMed] [Google Scholar]
- 62.Howard DPJ, Banerjee A, Fairhead JF, Perkins J, Silver LE, Rothwell PM. Population-based study of incidence and outcome of acute aortic dissection and premorbid risk factor control. :12. 10.1161/CIRCULATIONAHA.112.000483 [DOI] [PMC free article] [PubMed]
- 63.Pan L, Lin Z, Tang X, Tian J, Zheng Q, Jing J, et al. S-nitrosylation of plastin-3 exacerbates thoracic aortic dissection formation via endothelial barrier dysfunction. ATVB. 2020;40:175–188. doi: 10.1161/ATVBAHA.119.313440. [DOI] [PubMed] [Google Scholar]
- 64.Kruser TJ, Wheeler DL, Armstrong EA, Iida M, Kozak KR, van der Kogel AJ, et al. Augmentation of radiation response by motesanib, a aultikinase inhibitor that targets vascular endothelial growth factor receptors. Clin Cancer Res. 2010;16:3639–3647. doi: 10.1161/ATVBAHA.119.313440. [DOI] [PMC free article] [PubMed] [Google Scholar]
- 65.Christianmd M, Trimblemdmph E. Salvage chemotherapy for epithelial ovarian carcinoma. Gynecol Oncol. 1994;55:S143–S150. doi: 10.1006/gyno.1994.1354. [DOI] [PubMed] [Google Scholar]
Associated Data
This section collects any data citations, data availability statements, or supplementary materials included in this article.
Supplementary Materials
Data Availability Statement
Publicly available datasets were analyzed in this study. These data can be found here:https://www.ncbi.nlm.nih.gov/geo/.
The code that supports the findings of this study is available from the corresponding author upon request.


