

Abstract
Background:
Tamoxifen is the drug of choice for treating breast cancer, particularly the estrogen receptor-positive luminal A subtype. However, the increased occurrence of Tamoxifen resistance highlights the need to develop an agent to enhance the effectiveness of this drug.
Objective:
Although glycyrrhizic acid (GA) is known to exhibit cytotoxic effects on Michigan Cancer Foundation-7 cells, the specific gene targets and pathways it employs to overcome Tamoxifen resistance are incompletely understood. Therefore, the goal of the present research is to discover the potential targets and pathways of GA by using a bioinformatics approach.
Methods:
Differentially expressed genes (DEGs) were identified in the Gene Expression Omnibus NCBI database using microarray data from GSE67916 and GSE85871. Further analyses were performed on these DEGs by using DAVID v6.8, STRING-DB v11.0, and Cytoscape v3.8.0. Analysis of gene alterations was performed using cBioPortal for target validation, and the relevant interaction process was examined via the molecular docking method.
Results:
Gene Ontology and Kyoto Encyclopedia of Genes and Genomes pathway enrichment analyses identified the PI3K-AKT signaling as the potential target mechanism. Construction of the protein–protein interaction network and analysis of hub genes identified the top 25 hub genes. Genetic alterations were observed in six potential target genes, such as CDK2, MDM2, NF1, SMAD3, PTPN11, and CALM1. Molecular docking analysis demonstrated that the docking score of GA is lower than that of the native ligand of p53. More importantly, 3n the PI3K-AKT signaling pathway is a potential target for overcoming Tamoxifen resistance in breast cancer. C
Conclusion:
MDM2 may be a potential gene target of GA and the PI3K-AKT signaling may be a prospective mechanism for overcoming Tamoxifen resistance in breast cancer cells. Additional research is required to validate the findings of this study.
Key Words: Breast cancer, tamoxifen resistance, glycyrrhizic acid, bioinformatics
Introduction
Cancer is the leading cause of mortality worldwide. Approximately 9.6 million cancer-related deaths, 2 million of which are breast cancer-related, were recorded in 2018 (World Health Organization, 2018). Although selective estrogen receptor modulators, such as Tamoxifen, have improved survival rates in patients with the luminal A subtype of breast cancer, the effectiveness of this drug may be considerably decreased by the development of drug resistance (Fagan et al., 2017). The PI3K-AKT signaling pathway is a critical mechanism known to cause Tamoxifen resistance in Michigan Cancer Foundation-7 (MCF-7) cells (Yao et al., 2020). PI3K-AKT pathway mutations have been reported in nearly in all human cancer cells, including breast cancer (Engelman, 2009). Given the emergence of Tamoxifen resistance, combining Tamoxifen with another potential compound is necessary to improve its therapeutic efficacy.
Glycyrrhizic acid (GA), an active compound found in licorice plants (Glycyrrhiza glabra), may be an effective substance for treating breast cancer. GA promotes cytotoxicity in MCF-7 cells by inducing apoptosis and inhibits colonization and cell invasion (Zhang et al., 2019). MCF-7 cells are a luminal A breast cancer cell line (Hermawan and Putri, 2020) that is frequently used in experiments focusing on estrogen receptor-positive treatment resistance (Comşa et al., 2015). GA is known to inhibit the mTOR/PI3K/AKT signaling pathways in the MCF-7 cells (Zhang et al., 2019), which are involved in the Tamoxifen resistance mechanism (Yao et al., 2020). However, because the potential targets and molecular mechanisms through which GA could overcome Tamoxifen resistance are incompletely understood, further in-depth research on this substance is necessary.
This study identified the potential gene targets and molecular mechanisms of GA via an integrated bioinformatics approach. Here, data on differentially expressed genes (DEGs) are integrated with Gene Ontology (GO) and Kyoto Encyclopedia of Genes and Genomes (KEGG) enrichment analyses by using Database for Annotation, Visualization and Integrated Discovery (DAVID). Further analysis with STRING-DB, Cytoscape, and CytoHubba was performed to identify the top 25 hub genes, from which 6 hub genes were selected and integrated with the cBioPortal database to observe genetic alterations. The predicted target genes are further analyzed through the molecular docking method for target validation; the relevant interaction process is also observed. A bioinformatics approach can save time and costs and facilitate large-scale data analysis (Kuznetsov et al., 2013). This research was developed to support the early assessment or prediction of preclinical studies and aims to identify natural substances capable of overcoming Tamoxifen resistance.
Materials and Methods
Data collection and processing
Tamoxifen-resistant MCF-7 cells microarray data were obtained from GSE67916 (Elias et al., 2015), which contains two samples of Tamoxifen-resistant and Tamoxifen-sensitive MCF-7 cells. The microarray data of GA-treated MCF-7 cells were acquired from GSE85871 (Lv et al., 2017). In this database, cells were treated with either 10 μM GA for 24 h or dimethyl sulfoxide as a control. Gene expression profiling was completed using the Affymetrix Human Genome U133A Array (Santa Clara, CA, USA). GSE67916 and GSE86871 contained normal distribution data. Data were processed using GEO2R as a data analysis tool from the Gene Expression Omnibus database written in R language. Both datasets were screened for finding the DEGs. Data cutoff were specifically determined (p-value < 0.05, log-fold change > 1, and log-fold change < −1) to select significant DEGs (Hermawan and Putri, 2020).
Functional annotation and pathway analysis
GO and KEGG pathway enrichment analyses were conducted using DAVID v6.8 with a p-value < 0.05 as the cutoff value (Hermawan et al., 2021; Huang et al., 2009).
Construction of Protein-Protein Interaction (PPI) network
The PPI network was constructed using STRING-DB v11.0 (Szklarczyk et al., 2017) with a confidence score > 0.400 and visualized using Cytoscape Software v3.8.0 (Doncheva et al., 2019). The top 25 hub genes were screened using the CytoHubba Plugin and selected according to their degree score
Genetic alterations findings
Genetic alterations in the selected hub genes were analyzed using cBioPortal for Cancer Genomics (Gao et al., 2013). The breast cancer study including the largest number of genetic alterations for a clinical case was chosen for further analysis.
Molecular Docking Analysis
Computational prediction was performed on a computer with an Intel Core i5-10th Gen processor, Windows 10 operating system, and 8 GB of RAM. MOE 2010 (licensed from the Faculty of Pharmacy, UGM) was used for docking simulation, RMSD-docking score calculation, and interaction visualization. The PDB IDs of MDM2 and p53 were searched in rcsb.org and found to be 4HBM, and 2X0W, respectively. The GA structure was drawn using Marvin Sketch, subjected to a conformational search, and minimized in MOE by using the Energy Minimize menu. For docking simulation settings, London dG was used for Rescoring 1 and Rescoring 2, Triangle Matcher was used for the score function and placement setting, and Forcefield was used to refine the docking result from 30 retained settings. Molecular docking method will determine which conformation has the lowest binding interaction between the ligand and its receptor.
Results
Data collection and processing
A total of 2,044 genes, including 599 upregulated and 1,445 downregulated genes, were extracted from GSE67916 (Supplementary file). In addition, 1,377 genes, including 860 upregulated and 517 downregulated genes, were obtained from GSE85871 contained GA structure (Figure 1A). In total, 216 DEGs were extracted from both datasets (Figure 1B, Supplementary file).
Figure 1.
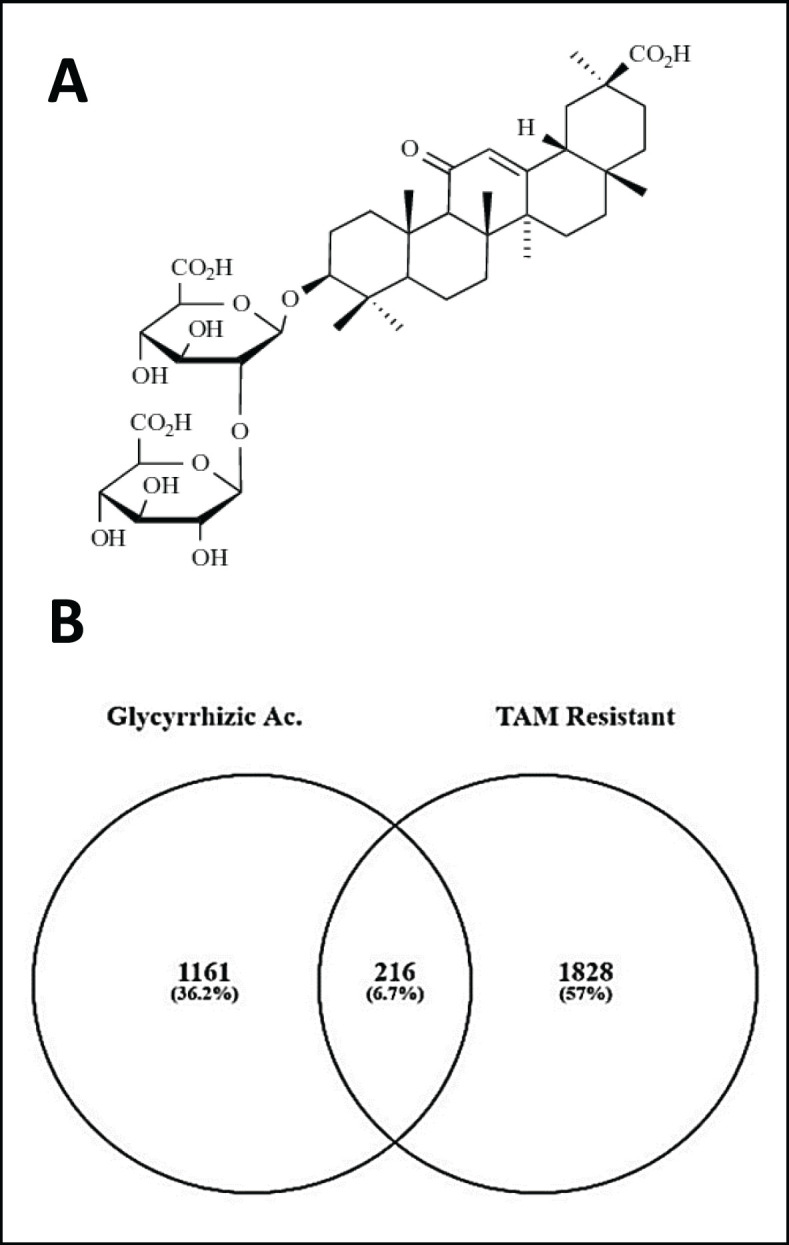
(A) Chemical structure of glycyrrhizic acid (GA). (B) Venn diagram of GA-treated and Tamoxifen-resistant in MCF-7 breast cancer cells
Functional annotation and pathway analysis
The biological functions and molecular mechanisms of the DEGs were evaluated using GO and KEGG pathway enrichment analysis. DAVID v6.8 was used to analyze the KEGG pathways and GO terms, which were categorized as biological process, cellular component, and molecular function.
KEGG pathway enrichment analysis of the DEGs, especially those connected to breast cancer, indicated the involvement of four signaling pathways, namely, the PI3K-AKT signaling pathway, the MAPK signaling pathway, the FoxO signaling pathway, and the Ras signaling pathway (Table 1, Supplementary file).
Table 1.
Top 4 KEGG Pathways of the DEGs.
| Term | p-value | Genes |
|---|---|---|
| PI3K-Akt signaling pathway | 0.004428 | TNXB, ATF6B, FOXO3, PRLR, EPOR, KITLG, IL7, CDK2, MDM2, COL4A6, COL4A5, GNB5, FGFR2 |
| MAPK signaling pathway | 0.01169 | MAP3K2, MAP3K1, JUND, GADD45B, MAX, RASA2, NF1, MAP3K7, PAK2, FGFR2 |
| FoxO signaling pathway | 0.046724 | SMAD3, GADD45B, CCNG2, CDK2, MDM2, FOXO3 |
| Ras signaling pathway | 0.047885 | KITLG, RASA2, NF1, PTPN11, GNB5, CALM1, PAK2, FGFR2 |
Several DEGs participated in the biological processes of positive regulation of transcription, DNA templating, and negative regulation of transcription from the RNA polymerase II promoter. These DEGs were located in the nucleoplasm, cytosol, and cytoplasm. Moreover, the DEGs performed molecular functions in protein binding and protein kinase activity (Table 2, Supplementary file).
Table 2.
Top 10 GO Terms Ranked by p-value and DEG Count
| ID | Term | Count | p-value |
|---|---|---|---|
| Biological Process | |||
| GO:0008152 | Metabolic process | 10 | 1.27E-04 |
| GO:0000165 | MAPK cascade | 11 | 8.20E-04 |
| GO:0098609 | Cell-cell adhesion | 10 | 0.003782 |
| GO:0007155 | Cell adhesion | 13 | 0.006135 |
| GO:0043547 | Positive regulation of GTPase activity | 14 | 0.012209 |
| GO:0000122 | Negative regulation of transcription from RNA polymerase II promoter | 16 | 0.016964 |
| GO:0045893 | Positive regulation of transcription, DNA-templated | 12 | 0.032698 |
| GO:0006468 | protein phosphorylation | 11 | 0.034977 |
| GO:0007165 | Signal transduction | 21 | 0.039678 |
| GO:0007399 | Nervous system development | 8 | 0.044982 |
| Cellular Component | |||
| GO:0070062 | Extracellular exosome | 56 | 5.82E-06 |
| GO:0005737 | Cytoplasm | 83 | 7.53E-05 |
| GO:0005829 | Cytosol | 56 | 5.61E-04 |
| GO:0005654 | Nucleoplasm | 49 | 6.08E-04 |
| GO:0016020 | Membrane | 41 | 6.99E-04 |
| GO:0005783 | Endoplasmic reticulum | 19 | 0.004083 |
| GO:0005789 | Endoplasmic reticulum membrane | 19 | 0.006149 |
| GO:0005634 | Nucleus | 74 | 0.017642 |
| GO:0005730 | Nucleolus | 17 | 0.024886 |
| GO:0005615 | Extracellular space | 23 | 0.03608 |
| Molecular Function | |||
| GO:0005515 | protein binding | 125 | 1.57E-05 |
| GO:0044822 | poly(A) RNA binding | 27 | 2.35E-04 |
| GO:0019899 | enzyme binding | 13 | 3.01E-04 |
| GO:0098641 | cadherin binding involved in cell-cell adhesion | 10 | 0.004606 |
| GO:0004672 | protein kinase activity | 11 | 0.00611 |
| GO:0004674 | protein serine/threonine kinase activity | 11 | 0.008358 |
| GO:0042803 | protein homodimerization activity | 16 | 0.013938 |
| GO:0016301 | kinase activity | 8 | 0.016625 |
| GO:0003713 | transcription coactivator activity | 8 | 0.019217 |
| GO:0005524 | ATP binding | 25 | 0.035337 |
Construction of PPI network
In order to explore the interactions between DEGs, a PPI network analysis was conducted. A total of 216 DEGs were included in the protein network. The network consisted of 202 nodes and 364 edges and had an average node degree of 3.6 (Figure 2). Analysis using CytoHubba identified the top 25 hub genes, including MDM2, CDK2, NF1, SMAD3, PTPN11, and CALM1. In the network, different colors reflect different levels of interaction: yellow indicates weak interactions whereas red indicates strong interaction between DEGs (Table 3, Figure 3).
Figure 2.

PPI Network of Proteins Related to Pathways that could Overcome Tamoxifen Resistance via Glycyrrhizic Acid as Analyzed by STRING-DB. Degree scores > 5 are marked yellow, while degree scores < 5 are marked blue. A degree score > 5 can facilitate the identification of the top 25 hub genes
Table 3.
Top 25 Genes Involved in the PPI Network Ranked by Degree Score
| Rank | Genes | Score |
|---|---|---|
| 1 | ACTB | 21 |
| 2 | SMARCA4 | 18 |
| 3 | CDK2 | 15 |
| 4 | SMAD3 | 14 |
| 5 | HIST1H4A | 14 |
| 6 | NF1 | 14 |
| 7 | MDM2 | 14 |
| 8 | PTPN11 | 13 |
| 9 | HIST1H2BJ | 13 |
| 10 | SMARCA2 | 11 |
| 11 | DLG4 | 11 |
| 12 | NCOA3 | 11 |
| 13 | RPS11 | 10 |
| 14 | TRRAP | 10 |
| 15 | CXCL12 | 10 |
| 16 | MBNL1 | 10 |
| 17 | P4HB | 9 |
| 18 | EZR | 9 |
| 19 | PSMB8 | 9 |
| 20 | RPS10 | 8 |
| 21 | EIF5B | 8 |
| 22 | FASN | 8 |
| 23 | CALM1 | 8 |
| 24 | DICER1 | 8 |
| 25 | RPL37A | 8 |
Figure 3.

Protein Network of top 25 hub Genes, Analyzed by CytoHubba
Genetic alterations findings
A total of 18 breast cancer studies were included in the cBioPortal for Cancer Genomics database. From these 18 studies, 1 was selected (i.e., “Mutational Profile of Metastatic Breast Cancers: A Retrospective Analysis”) (Lefebvre et al., 2016). The study discussed the incidence of metastatic breast cancer, and the clinical data were obtained from 216 cases, among which 16.67% demonstrated genetic changes (Figure 4A). Among the alterations detected, 5.56% (12 cases) were mutations, 8.8% (19 cases) were amplifications, 1.39% (3 cases) were deep deletions, and 0.93% (2 cases) were multiple alterations.
Figure 4.

(A) Frequency of alterations in CDK2, MDM2, NF1, SMAD3, PTPN11, and CALM1 in a genomic dataset obtained from 18 studies of breast cancer. (B) Summary of genetic alterations in CDK2, MDM2, NF1, SMAD3, PTPN11, and CALM1 according to Lefebvre et al. (2016 )
Oncoprints visualization through the cBioPortal for Cancer Genomics database was used to show the percentage of genetic alterations found in queried genes. Oncoprints provide a means to describe genetic changes and pathways involved in breast cancer research. The percentage of genetic alterations in each queried gene was 3% for CDK2, 2.3% for SMAD3, 8% for NF1, 6% for MDM2, 0.9% for PTPN11, and 0.9% for CALM1 (Figure 4B). These results reveal that the NF1 gene undergoes the greatest number of genetic changes, followed by the MDM2 gene.
Analysis of the pathways associated with the identified genetic alterations supported the results of the breast cancer mechanism or the so-called BRCA pathway in the cBioPortal for Cancer Genomics database (Figure 5). Moreover, although NF1 has a higher percentage of genetic alterations, MDM2 is still selected as a potential target gene in breast cancer because of its pathway enrichment related to genetic alterations in the BRCA pathway, analyzed by cBioportal (Figure 5). Moreover, MDM2 interacts with TP53 as neighbouring genes, which affects the apoptosis of breast cancer cells, and a neighboring gene, AKT1, which is involved in the PI3K-AKT signaling pathway (Figure 5). The previous DAVID analysis also identified MDM2 as a gene involved in the PI3K-AKT signaling pathway.
Figure 5.

Breast Cancer Pathways Related to Genetically Altered Hub Genes as Analyzed Using the cBioPortal for Cancer Genomics Database
Molecular Docking Analysis
Pathway enrichment analysis related to the genetic alterations showed that MDM2 and TP53 are two genes with a high percentage of genetic alterations which regulate the BRCA pathway; therefore, we selected these two proteins for further molecular docking study. The native ligands of each protein consisted of MDM2 and p53 complexes comprising 0Y7 ({(3R,5R,6S)-5-(3-chlorophenyl)-6-(4-chlorophenyl)-1-[(2S) -1-hydroxybutan-2-yl]-2-oxopiperidin-3-yl} acetic acid) and X0W (5,6-dimethoxy-2-methyl-1,3-benzothiazole). The docking score between the protein receptor p53 (2X0W) and GA was approximately two times lower than that between the protein and the native ligand (Table 4). The lower the docking score, the more potent the binding affinity of the ligand. The strong interaction of GA to the p53 receptor may be attributed to the presence of more amino acids (e.g., Thr150, Cys220, and Thr230) in GA than in the native ligand (only Pro151) (Table 4, Figure 6). This result implies that p53 strongly tends to bind and react with GA.
Table 4.
Docking Scores of the Interactions of Glycyrrhizic Acid and the Native Ligand with MDM2 and p53
| PDB ID | Native ligand | Glycyrrhizic Acid | ||||||||||
|---|---|---|---|---|---|---|---|---|---|---|---|---|
| S | RMSD (Å) | LA | AA | BT | D | S | RMSD (Å) | LA | AA | BT | D | |
| MDM2 (4HBM) | -12.91 | 0.546 | O | Lys94 | ScD | 1.85 | -10.52 | 1.718 | O;O | Lys94 | ScD | 2.03 |
| O | His96 | ScD | 2.02 | H | His96 | ArH | 2.85 | |||||
| O;O | Thr150 | ScD; ScD | 2.66; 2.77 | |||||||||
| p53 (2X0W) | -8.29 | 0.811 | C | Pro151 | ArH | 3.67 | -16.71 | 3.941 | O | Cys220 | ScD | 3.11 |
| O | Thr230 | ScD | 2.52 | |||||||||
S, docking score; RMSD, root mean square deviation; LA, ligand atom; AA, amino acid; BT, binding type; D, distance; ScD, sidechain donor; ScA, sidechain acceptor; ArH, arene H; BbD, backbone donor.
Figure 6.

(A) The interaction of GA with MDM2 has a higher docking score than the interaction of the native ligand with the protein, thus indicating lower binding affinity to MDM2. (B) GA interaction with the receptor has more amino acids that are involved than the native. Analyzed using the MOE 2010 molecular docking tool
The docking score of the interaction of GA with MDM2 was higher than that between the protein and its native ligand. has low binding affinity to MDM2, which is in line with the amino acids on GA involved in the interaction with each receptor. While two amino acids (Lys94 and His96) are similarly found in GA and the native ligand, these groups are much farther from the former than from the latter (Table 4).
Discussion
The goal of the present research is to discover the potential gene target and molecular mechanism of GA in overcoming breast cancer resistance Tamoxifen by the protein network-based using bioinformatics method, including gene neighbor and PPI network analyses. GO enrichment analysis showed that several DEGs affect the biological process of positive regulation of transcription, DNA templating, and negative regulation of transcription from RNA polymerase II promoter. Downregulation of MDM2 promotes the negative regulation of transcription of RNA polymerase II promoter, which induces p53 degradation via the protein-binding-activity between MDM2 and p53 in cancer cells (Shangary and Wang, 2008). The DEGs were mainly located in the nucleoplasm, cytosol, and cytoplasm. MDM2–p53 complex formation may enhance p53 export from the nucleus so that the protein could be degraded by proteasomes (Lu et al., 2000). KEGG pathway enrichment analysis showed the involvement of the PI3K-AKT, MAPK, FoxO, and Ras signaling pathways in overcoming Tamoxifen resistance. The PI3K-AKT signaling pathway plays an essential role in overcoming Tamoxifen resistance, particularly by promoting apoptotic activity (Yao et al., 2020).
The PPI network showed the top 25 hub genes with a degree score greater than 8. Hub gene selection for cBioportal analysis depends on the data available on the top 25 hub genes from CytoHubba and KEGG pathways from DAVID. CDK2, MDM2, NF1, SMAD3, PTPN11, and CALM1 were selected for further analysis by using cBioPortal. Among these genes, MDM2 demonstrated greater potential activity with AKT1, as its neighboring gene, and TP53 to affect apoptotic activity. According to the KEGG pathway database, MDM2 is involved in the same pathway as AKT1 in the PI3K-AKT signaling pathway. PI3K has been involved in the phosphorylation of PIP2 to generate the second messenger PIP3 in the PI3K-AKT signaling pathway (Miller et al., 2011). RAC-alpha serine/threonine-protein kinase (AKT) could be divided into three main types of genes, among which AKT1 interacts with PIP3 via the Pleckstrin homology domain (Vara et al., 2004). AKT is translocated from the cytoplasm to the cell membrane as a result of the interactions between AKT1 and PIP3. In addition, PIP3 recruits PDK1 and activates AKT by phosphorylating Thr308 (Sarbassov et al., 2005). AKT activation results in the translocation of MDM2 from the cytoplasm to the nucleus and phosphorylation of serines 166 and 186 (Ogawara et al., 2002).
The p53 tumor suppressor gene has the duties to induce cell cycle arrest, cellular senescence, and also apoptosis activity (Handayani et al., 2013; Li and Lizano, 2013). MDM2 can inhibit p53 (Oliner et al., 2016; Wienken et al., 2017). An autoregulatory feedback loop in which MDM2 downregulates p53 whereas p53 upregulates MDM2 has been observed. The p53 protein increases MDM2 levels by upregulating the expression of the MDM2 gene, which then binds to p53 and causes p53 degradation as a negative regulator (Shangary and Wang, 2008). MDM2 overexpression can lead to increased p53 inactivation and apoptotic inhibition (Qiu et al., 2008). Thus, the activity of MDM2, as a regulatory gene for Tamoxifen resistance, is a potential gene target that should be controlled.
NF1 encodes neurofibromin 1 (NF-1), a tumor suppressor that inhibits the downstream signaling of Ras/MAPK/PI3K/AKT/MTOR signaling pathways (Watson et al., 2014). The genetic alteration analysis using cBioportal showed that NF1 has a higher percentage of genetic alterations. NF-1 is also a repressor of estrogen receptor transcriptional activity and is downregulated in tamoxifen-resistant breast cancer cells (yeng 2020). Previously, GA was found to suppress adipogenesis by inhibiting the MAPK kinase (MEK) signaling pathway (Yamamoto et al., 2021). Collectively, the effect of GA on the GTP-ase activity of neurofibromin in Tamoxifen-resistance breast cancer cells deserves further investigation.
GA was previously reported to downregulate PI3K/AKT protein expression and target the mTOR/PI3K/AKT signaling pathway, ultimately causing apoptosis, in the MCF-7 cell line (Zhang et al., 2019). The same authors reported that the antiproliferative, apoptotic induction, involve the PI3K-AKT pathway and affect the apoptotic process, similar to the findings in the present study. GA selectively promotes cell death by p53 reactivation, which leads to G1 cell cycle arrest, DNA fragmentation (Curreli et al., 2005), and anti-migration mechanisms of GA also and apoptosis in several cancer cell lines (Okamura et al., 2003; Takeda et al., 1996). GA suppresses the p53-mediated mitochondrial pathway by attenuating CCI4-induced hepatocytes in rats (Guo et al., 2013). The results of molecular docking simulations support these findings. Specifically, the docking score of GA (−16.71) is lower than that of the native ligand of p53 X0W (5,6-dimethoxy-2-methyl-1,3-benzothiazole) (−8.29). Lower docking scores indicate greater potential to bind to the ligand (Hermawan et al., 2021). This interaction between GA and its receptor (p53) has 4 sidechain donor with two Thr150, Cys220, and Thr230. The ligand atom that involved in this interaction is oxygen with the distance of 2.66; 2.77; 3.11; and 2.52, respectively. This is in line with other previous research such as pelargonidin (PG, a natural food dye) with p53 complex showed the interaction of PG at Arg126, Cys127 and Cys151 (Dey et al., 2021). While one of selected bioactive compounds derived from Moringa oleifera such as Quercetin has the best docking score towards p53 (-6.72) with 3 H-bonding that consists of two bonds with Ile21 and one bond with Glu89 (Rath et al., 2021).
However, the binding affinity of GA to MDM2 is slightly less potent than that of the native ligand, even though both ligands have the same amino acid that binds to each receptor (i.e., Lys94 and His96, Table 4). However, GA still has a good potential to inhibit MDM2, compared to the absence of GA in MDM2 inhibition. A previous study on viral infections showed a decrease in the level of SUMOylated protein with increasing GA level, thereby indicating that GA inhibits the SUMOylation process (Bentz et al., 2019). MDM2, an E3 ubiquitinating p53 ligase, is one of the most critical p53 regulators stimulating the interaction between p53 and SUMO E3 ligase, which leads to SUMOylation. SUMOylation also enhances the p53–MDM2 interaction, leading to p53 degradation (Wu and Chiang, 2009). The ability of an agent to increase p53 levels in MCF-7 cells is critical to enhance cancer cell sensitivity to resistance (Adina et al., 2014). No research on the effect of GA on MDM2 in breast cancer is yet available and, therefore, will help further explorations of the mechanism of GA by doing this research. Taken together, the findings from the present study and literature review reveal that the mechanism of GA in overcoming Tamoxifen resistance may involve the targeting of MDM2 in the MDM2–p53 protein-binding interaction to prevent p53 degradation and cause apoptosis (Figure 7).
Figure 7.

Prediction of Pathways that could Overcome TamoxifenResistance by Using GA, further interpretation based on the findings and previous research by Miller (2011); Vara (2004); Sarbassov (2005); Mayo (2001); Qiu (2008); Shangary (2008); Wu (2009); Bentz (2019); Khan (2013); and Carter (2007)
This research was conducted with integrated bioinformatics and, as such, presents a number of limitations. Additional research is necessary to validate the prediction results. Because this research only identified a potential target gene and, thus, has limited ability to present the effects of GA under actual conditions, further studies, such as in vitro and in vivo validation of the effects of GA on Tamoxifen-resistant MCF-7 cells, are necessary. However, this study significantly reduces the time and cost of drug discovery by providing predictive information on the potential gene targets and molecular mechanisms employed by GA to overcome Tamoxifen resistance.
In conclusion, this research assessed the most likely target gene of GA for overcoming Tamoxifen resistance in breast cancer, namely MDM2. PI3K-AKT signaling appears to be an MDM2-related mechanism that could overcome Tamoxifen resistance in breast cancer cells. Additional research is required to validate the findings of this study in actual physiological conditions.
Author Contribution Statement
SNAA was responsible for acquiring and analyzing the data, drafting the article, and finalizing the manuscript. NH was responsible for acquiring the data, analyzing the results, and drafting the article. AH was responsible for conceptualizing this research, obtaining funding, supervision, and reviewing and approving the final version of the manuscript.
Acknowledgements
Funding
This study was supported by the Directorate of Research, Universitas Gadjah Mada, through the Rekognisi Tugas Akhir (RTA) program (SK Rektor UGM No. 1185/UN1.P.III/SK/HUKOR/2021).
Supplementary File
Supplementary file is available in http://ugm.id/SupplementaryGA.
References
- Adina AB, Goenadi FA, Handoko FF, et al. Combination of ethanolic extract of Citrus aurantifolia peels with Doxorubicin modulate cell cycle and increase apoptosis induction on MCF-7 Cells. Iran J Pharm Res. 2014;13:919–26. [PMC free article] [PubMed] [Google Scholar]
- Bentz GL, Lowrey AJ, Horne DC, et al. Using glycyrrhizic acid to target sumoylation processes during Epstein-Barr virus latency. PLoS One. 2019;14:0217578. doi: 10.1371/journal.pone.0217578. [DOI] [PMC free article] [PubMed] [Google Scholar]
- Comşa Ş, Cîmpean AM, Raica M. The story of MCF-7 breast cancer cell line: 40 years of experience in research. Anticancer Res. 2015;35:3147–54. [PubMed] [Google Scholar]
- Curreli F, Kien AE, Flore O. Glycyrrhizic acid alters Kaposi sarcoma–associated herpesvirus latency, triggering p53-mediated apoptosis in transformed B lymphocytes. J Clin Invest. 2005;115:642–52. doi: 10.1172/JCI23334. [DOI] [PMC free article] [PubMed] [Google Scholar]
- Dey R, Nandi S, Samadder A. Pelargonidin mediated selective activation of p53 and parp proteins in preventing food additive induced genotoxicity: an in vivo coupled in silico molecular docking study. Eur J Pharm Sci. 2021;156:105586. doi: 10.1016/j.ejps.2020.105586. [DOI] [PubMed] [Google Scholar]
- Doncheva NT, Morris JH, Gorodkin J, Jensen LJ. Cytoscape StringApp: network analysis and visualization of proteomics data. J Proteome Res. 2019;18:623–32. doi: 10.1021/acs.jproteome.8b00702. [DOI] [PMC free article] [PubMed] [Google Scholar]
- Elias D, Vever H, Lænkholm AV, et al. Gene expression profiling identifies FYN as an important molecule in tamoxifen resistance and a predictor of early recurrence in patients treated with endocrine therapy. Oncogene. 2015;34:1919–27. doi: 10.1038/onc.2014.138. [DOI] [PubMed] [Google Scholar]
- Engelman JA. Targeting PI3K signalling in cancer: opportunities, challenges and limitations. Nat Rev Cancer. 2009;9:550–62. doi: 10.1038/nrc2664. [DOI] [PubMed] [Google Scholar]
- Fagan DH, Fettig LM, Avdulov S, et al. Acquired tamoxifen resistance in MCF-7 breast cancer cells requires hyperactivation of eIF4F-mediated translation. Horm Cancer. 2017;8:219–29. doi: 10.1007/s12672-017-0296-3. [DOI] [PMC free article] [PubMed] [Google Scholar]
- Gao J, Aksoy BA, Dogrusoz U, et al. Integrative analysis of complex cancer genomics and clinical profiles using the cBioPortal. Sci Signal. 2013;6:l1. doi: 10.1126/scisignal.2004088. [DOI] [PMC free article] [PubMed] [Google Scholar]
- Guo XL, Liang B, Wang XW, et al. Glycyrrhizic acid attenuates CCl4-induced hepatocyte apoptosis in rats via a p53-mediated pathway. World J Gastroenterol. 2013;19:3781–91. doi: 10.3748/wjg.v19.i24.3781. [DOI] [PMC free article] [PubMed] [Google Scholar]
- Handayani S, Hermawan A, Meiyanto E, Udin LZ. Induction of apoptosis on MCF-7 cells by selaginella fractions. J Appl Pharm Sci. 2013;3:31–4. [Google Scholar]
- Hermawan A, Putri H. Identification of potential gene associated with berberine in overcoming tamoxifen resistance by functional network analysis. J Appl Pharm Sci. 2020;10:9–18. [Google Scholar]
- Hermawan A, Putri H, Hanif N, Ikawati M. Integrative bioinformatics study of tangeretin potential targets for preventing metastatic breast cancer. Evid Based Complementary Altern. 2021;2021:2234554. doi: 10.1155/2021/2234554. [DOI] [PMC free article] [PubMed] [Google Scholar]
- Huang DW, Sherman BT, Lempicki RA. Bioinformatics Enrichment tools: paths toward the comprehensive functional analysis of large gene lists. Nucleic Acids Res. 2009;37:1–13. doi: 10.1093/nar/gkn923. [DOI] [PMC free article] [PubMed] [Google Scholar]
- Kuznetsov V, Lee HK, Maure S, et al. How bioinformatics influences health informatics: usage of biomolecular sequences, expression profiles and automated microscopic image analyses for clinical needs and public health. Health Inf Sci Syst. 2013;1:2. doi: 10.1186/2047-2501-1-2. [DOI] [PMC free article] [PubMed] [Google Scholar]
- Lefebvre C, Bachelot T, Filleron T, et al. Mutational profile of metastatic breast cancers: a retrospective analysis. PLoS Med. 2016;13:1002201. doi: 10.1371/journal.pmed.1002201. [DOI] [PMC free article] [PubMed] [Google Scholar]
- Li Q, Lozano G. Molecular pathways: targeting MDM2 and MDM4 in cancer therapy. Clin Cancer Res. 2013;19:34–41. doi: 10.1158/1078-0432.CCR-12-0053. [DOI] [PMC free article] [PubMed] [Google Scholar]
- Lu W, Pochampally R, Chen L, et al. Nuclear exclusion of p53 in a subset of tumors requires MDM2 function. Oncogene. 2000;19:232–40. doi: 10.1038/sj.onc.1203262. [DOI] [PubMed] [Google Scholar]
- Lv C, Wu X, Wang X, et al. The gene expression profiles in response to 102 traditional Chinese medicine (TCM) components: A general template for research on TCMs. Sci Rep. 2017;7:352. doi: 10.1038/s41598-017-00535-8. [DOI] [PMC free article] [PubMed] [Google Scholar]
- Miller TW, Balko JM, Arteaga CL. Phosphatidylinositol 3-Kinase and antiestrogen resistance in breast cancer. J Clin Oncol. 2011;29:4452–61. doi: 10.1200/JCO.2010.34.4879. [DOI] [PMC free article] [PubMed] [Google Scholar]
- Ogawara Y, Kishishita S, Obata T, et al. Akt enhances MDM2-mediated ubiquitination and degradation of p53. J Biol Chem. 2002;277:21843–50. doi: 10.1074/jbc.M109745200. [DOI] [PubMed] [Google Scholar]
- Okamura N, Miyauchi H, Choshi T, Ishizu T, Yagi A. Simultaneous determination of glycyrrhizin metabolites formed by the incubation of glycyrrhizin with rat feces by semi-micro high-performance liquid chromatography. Biol Pharm Bull. 2003;26:658–61. doi: 10.1248/bpb.26.658. [DOI] [PubMed] [Google Scholar]
- Oliner JD, Saiki AY, Caenepeel S. The role of MDM2 amplification and overexpression in tumorigenesis. Cold Spring Harb Perspect Med. 2016;6:026336. doi: 10.1101/cshperspect.a026336. [DOI] [PMC free article] [PubMed] [Google Scholar]
- Qiu W, Wu J, Walsh EM, et al. retinoblastoma protein modulates gankyrin-MDM2 in regulation of p53 stability and chemosensitivity in cancer cells. Oncogene. 2008;27:4034–43. doi: 10.1038/onc.2008.43. [DOI] [PubMed] [Google Scholar]
- Rath S, Jagadeb M, Bhuyan R. Molecular docking of bioactive compounds derived from Moringa oleifera with p53 protein in the apoptosis pathway of oral squamous cell carcinoma. Genomics Inform. 2021;19:46. doi: 10.5808/gi.21062. [DOI] [PMC free article] [PubMed] [Google Scholar]
- Sarbassov DD, Guertin DA, Ali SM, Sabatini DM. Phosphorylation and regulation of Akt/PKB by the rictor-mTOR complex. Science. 2005;307:1098–101. doi: 10.1126/science.1106148. [DOI] [PubMed] [Google Scholar]
- Shangary S, Wang S. Targeting the MDM2-p53 interaction for cancer therapy. Clin Cancer Res. 2008;14:5318–24. doi: 10.1158/1078-0432.CCR-07-5136. [DOI] [PMC free article] [PubMed] [Google Scholar]
- Szklarczyk D, Morris JH, Cook H, et al. The STRING database in 2017: quality-controlled protein–protein association networks made broadly accessible. Nucleic Acids Res. 2017;45:362–8. doi: 10.1093/nar/gkw937. [DOI] [PMC free article] [PubMed] [Google Scholar]
- Takeda S, Ishihara K, Wakui Y, et al. bioavailability study of glycyrrhetic acid after oral administration of glycyrrhizin in rats; relevance to the intestinal bacterial hydrolysis. J Pharm Pharmacol. 1996;48:902–5. doi: 10.1111/j.2042-7158.1996.tb05998.x. [DOI] [PubMed] [Google Scholar]
- Vara JAF, Casado E, Castro J, et al. PI3K/Akt signalling pathway and cancer. Cancer Treat Rev. 2004;30:193–204. doi: 10.1016/j.ctrv.2003.07.007. [DOI] [PubMed] [Google Scholar]
- Watson AL, Anderson LK, Greeley AD, et al. Co-targeting the MAPK and PI3K/AKT/mTOR pathways in two genetically engineered mouse models of schwann cell tumors reduces tumor grade and multiplicity. Oncotarget. 2014;5:1502–14. doi: 10.18632/oncotarget.1609. [DOI] [PMC free article] [PubMed] [Google Scholar]
- Wienken M, Moll UM, Dobbelstein M. MDM2 as a chromatin modifier. J Mol Cell Biol. 2017;9:74–80. doi: 10.1093/jmcb/mjw046. [DOI] [PMC free article] [PubMed] [Google Scholar]
- World Health Organization. Cancer. World Health Organization; 2018. [Google Scholar]
- Wu SY, Chiang CM. Crosstalk between sumoylation and acetylation regulates p53-dependent chromatin transcription and DNA binding. EMBO J. 2009;28:1246–59. doi: 10.1038/emboj.2009.83. [DOI] [PMC free article] [PubMed] [Google Scholar]
- Yamamoto M, Nagasawa Y, Fujimori K. Glycyrrhizic acid suppresses early stage of adipogenesis through repression of MEK/ERK-mediated C/EBPβ and C/EBPδ expression in 3T3-L1 cells. Chem Biol Interact. 2021;346:109595. doi: 10.1016/j.cbi.2021.109595. [DOI] [PubMed] [Google Scholar]
- Yao J, Deng K, Huang J, Zeng R, Zuo J. Progress in the understanding of the mechanism of tamoxifen resistance in breast cancer. Front Pharmacol. 2020;11:592912. doi: 10.3389/fphar.2020.592912. [DOI] [PMC free article] [PubMed] [Google Scholar]
- Zhang Z, Feng Y, Li ZY, Cao XZ. Antiproliferative and apoptotic activity of glycyrrhizinic acid in MCF-7 Human breast cancer cells and evaluation of its effect on cell cycle, cell migration and m-TOR/PI3K/Akt signalling pathway. Arch Med Sci. 2019;15:174–82. doi: 10.5114/aoms.2018.79429. [DOI] [PMC free article] [PubMed] [Google Scholar] [Retracted]
- Zheng ZY, Anurag M, Lei JT, et al. Neurofibromin is an estrogen receptor-alpha transcriptional Co-repressor in breast cancer. Cancer Cell. 2020;37:387–402. doi: 10.1016/j.ccell.2020.02.003. [DOI] [PMC free article] [PubMed] [Google Scholar]