Abstract
Strategies to visualize cellular membranes with light microscopy are restricted by the diffraction limit of light, which far exceeds the dimensions of lipid bilayers. Here, we describe a method for super-resolution imaging of metabolically labeled phospholipids within cellular membranes. Guided by the principles of expansion microscopy, we develop an all-small molecule approach that enables direct chemical anchoring of bioorthogonally labeled phospholipids into a hydrogel network and is capable of super-resolution imaging of cellular membranes. We apply this method, termed lipid expansion microscopy (LExM), to visualize organelle membranes with precision, including a unique class of membrane-bound structures known as nuclear invaginations. Compatible with standard confocal microscopes, LExM will be widely applicable for super-resolution imaging of phospholipids and cellular membranes in numerous physiological contexts.
Biological membranes have many essential functions, from encapsulating cells and organelles to directing metabolic, trafficking, and signaling events. Membranes are primarily composed of phospholipids, making methods to visualize these biomolecules vital to understanding cellular functions.1–5 However, techniques to accurately image phospholipids with fluorescence microscopy are challenged by the impermeable nature of the membrane and dimensions of the lipid bilayer, which are smaller than the diffraction limit of light.6
Super-resolution imaging techniques including stimulated emission depletion (STED) and single-molecule localization microscopy (SMLM) can surpass the diffraction limit and enable imaging of lipids within membranes.7–10 However, these techniques require specialized setups and procedures, limiting such imaging to laboratories with the required instrumentation and expertise. Expansion microscopy (ExM) has emerged as a powerful and accessible super-resolution imaging strategy, wherein target biomolecules are anchored to a hydrogel network that is swollen to expand the physical size of a sample by ~5× and even ~15× in specialized versions, spatially separating the signal for high-resolution imaging with standard fluorescence microscopes.11–22 Though traditional ExM protocols involve permeabilization, and thus lipid removal, certain adaptations have allowed for imaging of membranes. For example, unnatural hydrophobic probes can intercalate into membranes, allowing retention in ExM imaging.23–26 Alternatively, metabolic labeling of native phospholipids has been leveraged for expansion of membranes using click-ExM, which anchors lipids to hydrogel networks through biotin–streptavidin interactions.27 Notably, these methods require at least mild detergent-based permeabilization, which can compromise membrane integrity, to ensure a uniform distribution of ExM reagents and isotropic expansion of samples.
We were motivated to visualize lipids using ExM while preserving membrane structural integrity. Here, we present an approach involving metabolic labeling of phospholipids and trifunctional fluorophores for tagging and tethering lipids to the hydrogel (Figure 1A). This method, Lipid Expansion Microscopy (LExM), involves direct anchoring of metabolically labeled phospholipids into a polymer network without detergent-based permeabilization to enable super-resolution imaging of organelle membranes. We apply LExM to visualize subdiffraction scale invaginations of the nuclear membrane and their membrane-bound cytoplasmic contents.
Figure 1.
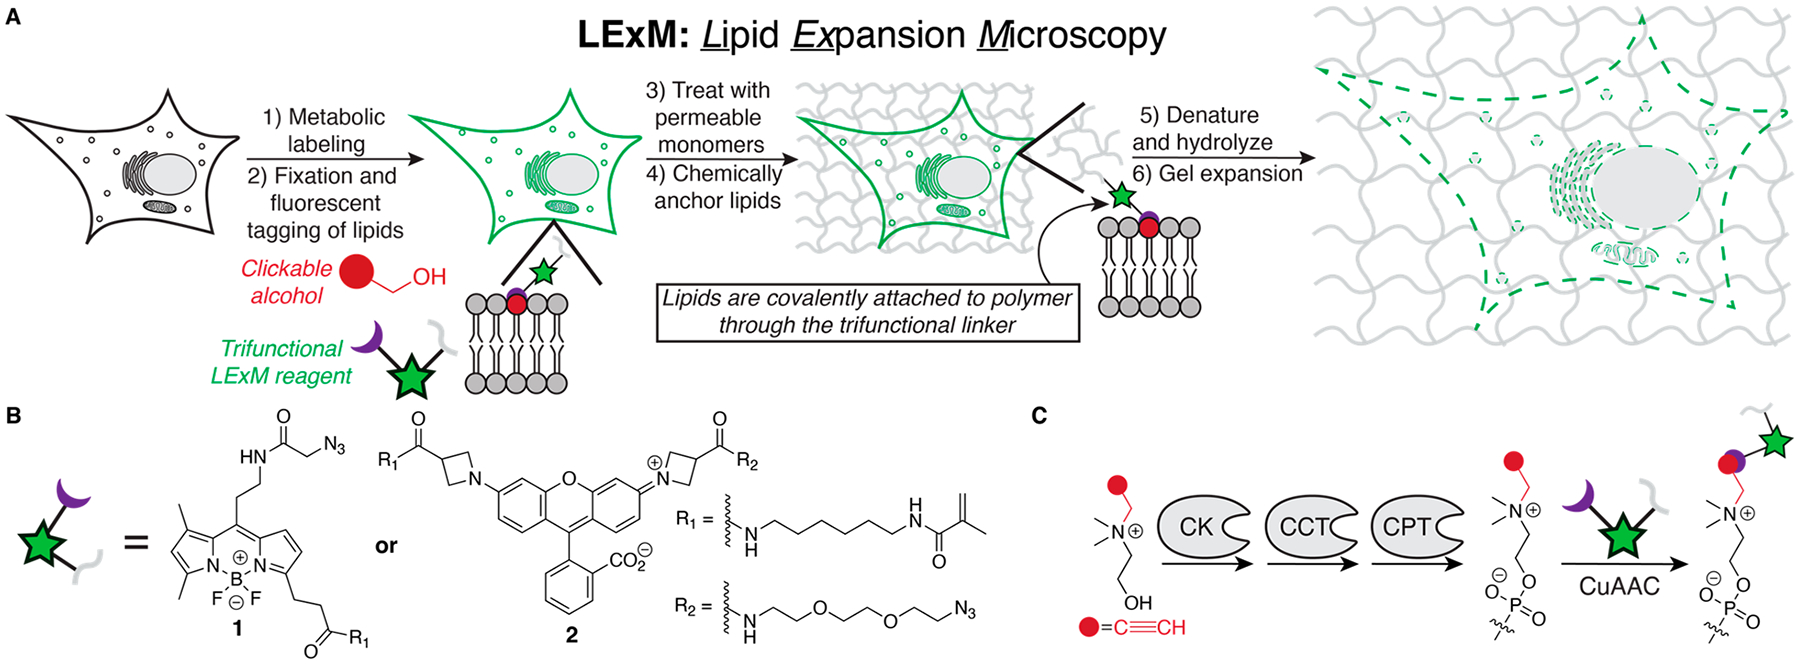
(A) Scheme of Lipid Expansion Microscopy (LExM). (B) Structures of trifunctional reagents 1 and 2. (C) Propargylcholine (ProCho) incorporation into phospholipids through the Kennedy pathway. CK: choline kinase, CCT: CTP:phosphocholine cytidylyltransferase, CPT: cholinephosphotransferase.
To incorporate phospholipids directly into the hydrogel network, we designed and prepared trifunctional LExM reagents 1 and 2 (Figure 1B), equipped with (i) azides for tagging alkyne-labeled biomolecules via Cu-catalyzed azide–alkyne cyclo-addition (CuAAC), (ii) fluorophores for imaging pre- and post-LExM including BODIPY, a hydrophobic green dye well suited for lipid imaging, and Janelia Fluor 549 (JF549), a bright and photostable red dye,28 and (iii) methacrylamides for covalent incorporation into the hydrogel.
We first evaluated 1 and 2 by tagging HeLa cells labeled with propargylcholine (ProCho), an alkynyl metabolic label for phosphatidylcholine (PC) and other choline-containing lipids (Figure 1C).29 Both 1 and 2 afforded strong fluorescence from many intracellular membranes, consistent with the broad distribution of PC. Importantly, the signal was ProCho-dependent, indicating that 1 and 2 are specific for alkyne-labeled phospholipids (Figure S1).
A key feature of ExM is isotropic sample expansion, achieved by disrupting membranes with detergent-based permeabilization to enable uniform diffusion of polymerization reagents.30 This step is critical to incorporate typically membrane-impermeable ionic monomers needed for the final osmotic expansion step.17,26,27 To ensure that monomers are evenly distributed in LExM, we used uncharged, membrane-permeable monomers that are hydrolyzed, postpolymerization, to yield ionic residues necessary for expansion.13
LExM involves metabolic labeling of cells with ProCho, fixation, CuAAC tagging with 1 or 2, polymerization with acrylamide and bis-acrylamide monomers, denaturation and hydrolysis, expansion, and visualization by traditional or Airyscan confocal microscopy (Figure 1A). Excitingly, we observed fluorescent signal from expanded samples, demonstrating that 1 and 2 are suitable chemical anchors that incorporate labeled lipids into hydrogel networks (Figure 2A, D). The methacrylamide unit is necessary, as an analogue of 1 lacking this group does not retain fluorescent signal in LExM (Figure S1). Using a 4 h hydrolysis step, LExM afforded 6.8× and 4.9× expansion factors, respectively, for 1 and 2, enabling visualization of fine structures, e.g., the nuclear envelope, which is clearly distinguished from other intracellular membranes (Figure 2B, C, E, F).
Figure 2.
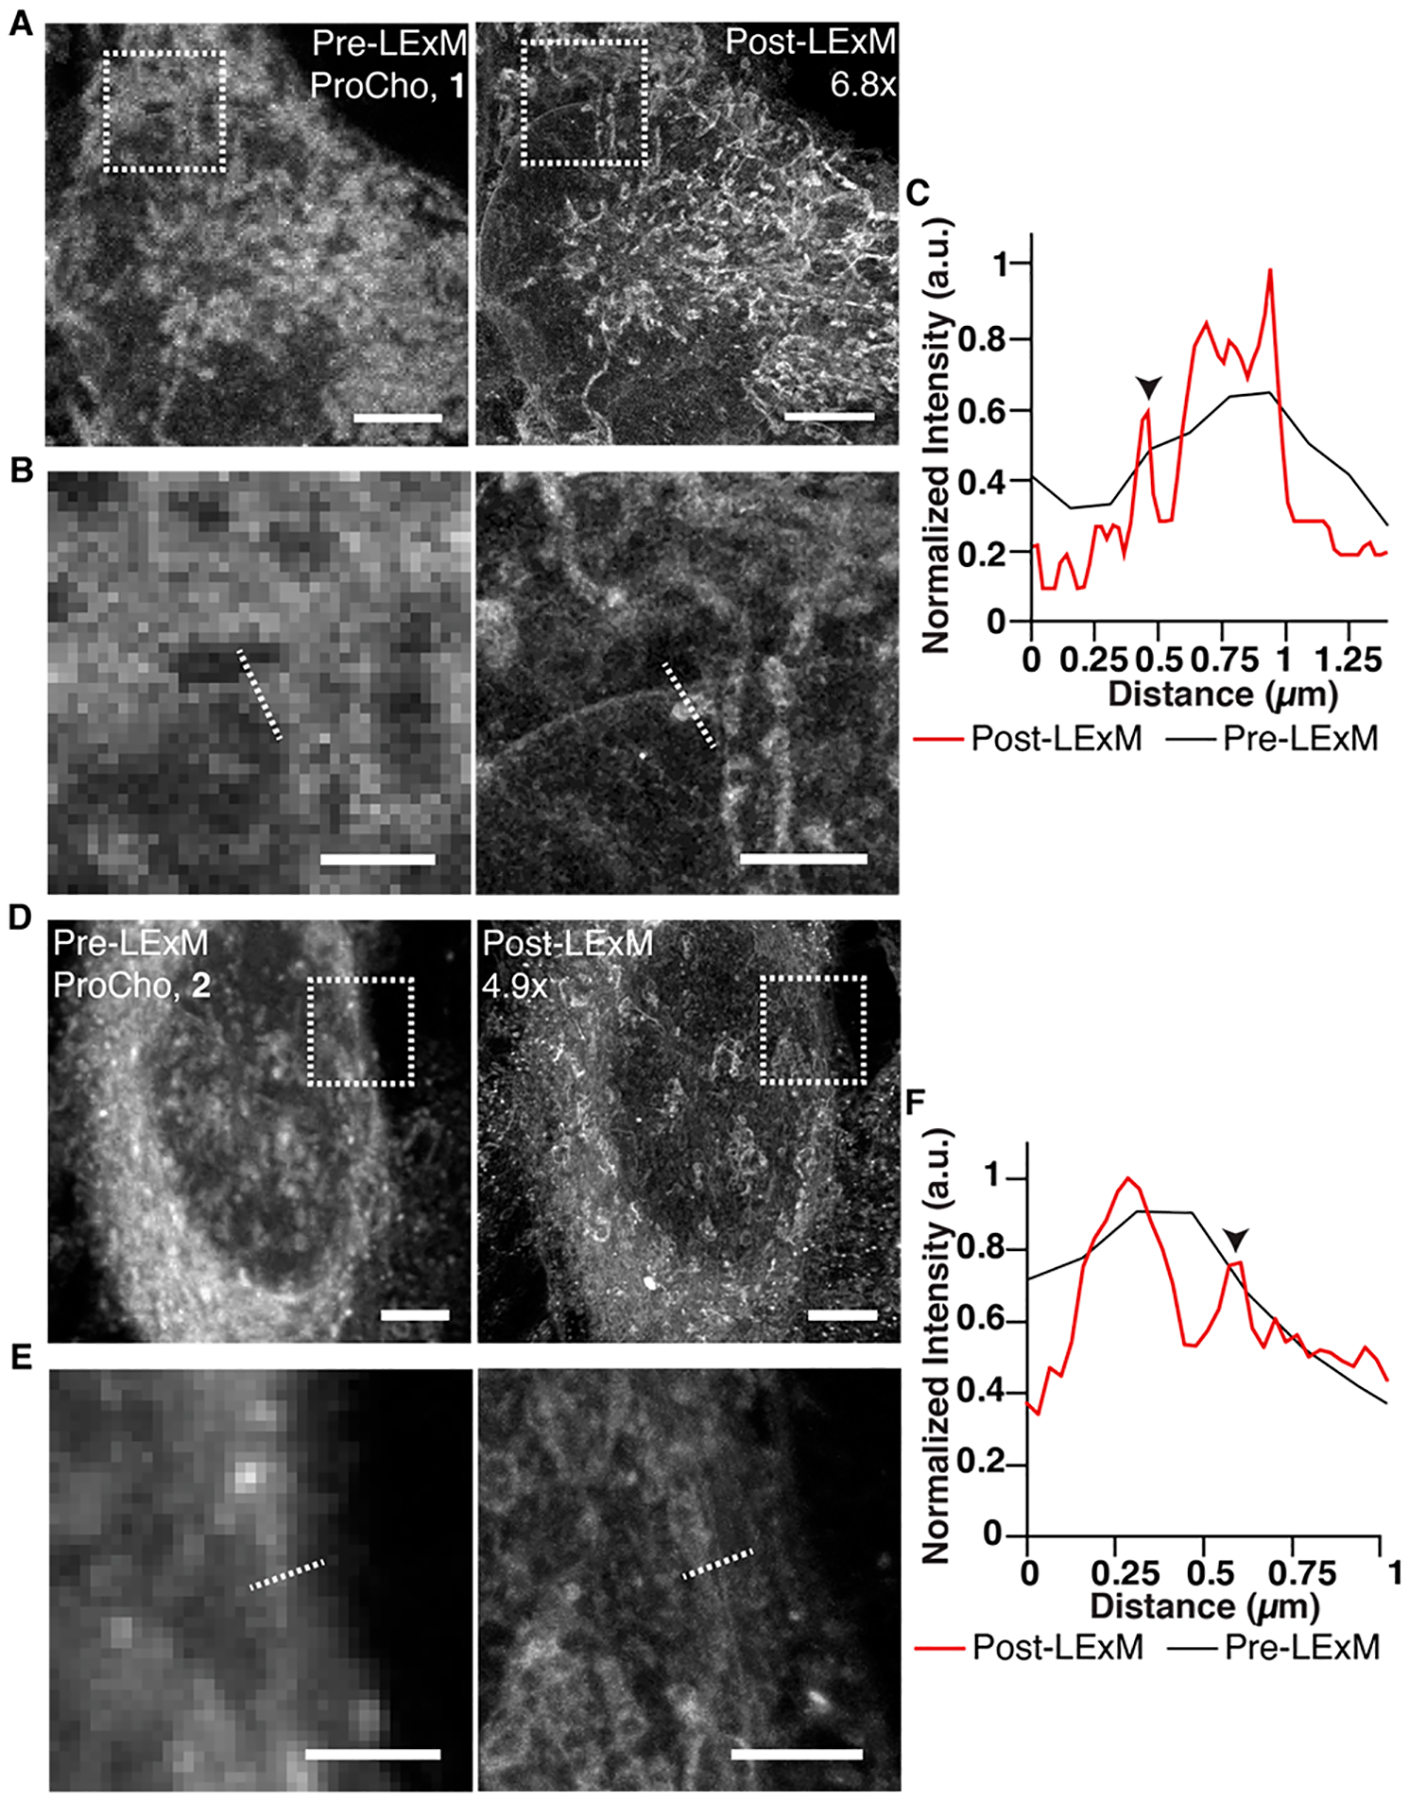
Confocal microscopy images of the same cell metabolically labeled with ProCho and tagged with 1 (A) or 2 (D); pre-LExM (left) and post-LExM (right). Expansion factors are displayed in post-LExM images. (B, E) Enlarged boxed areas from pre-LExM (left) and post-LExM (right) images in A (B) and D (E). (C, F) Fluorescence intensity profile line plots for dotted lines in pre- and post-LExM images of B (C) and E (F). Arrowheads indicate nuclear envelope. Scale bars (pre-LExM distance): 5 μm (A and D), 2 μm (B and E).
Next, we assessed both the ability of LExM to expand samples in a tunable and isotropic fashion and the extent of signal loss throughout the protocol. Varying the acrylamide to acrylate hydrolysis time to 2, 4, and 8 h gave expansion factors of ~5.0x, ~ 6.4x and ~7.8x respectively, indicating that LExM enables tunable expansion of membranes (Figure S2B). Comparison of pre- and post-LExM images revealed minimal sample distortion, with a root-mean-square (RMS) error of <3% for distances of up to 10 μm, demonstrating that LExM expands tagged lipids isotropically (Figure S2A, B).
Quantification of fluorescence after each step revealed ~40% retention of signal in samples labeled using 1, consistent with retention in ExM using similar scaffolds (Figure S2C).16 Interestingly, the fluorescence intensity of samples tagged with 2 increased after digestion, likely due to high amounts of sodium dodecyl sulfate during the digestion/hydrolysis step, which can increase absorbance of rhodamine fluorophores (Figure S2C).31
We next compared LExM to alternative procedures for visualizing membranes with ExM, including click-ExM, which uses metabolic labeling and CuAAC tagging but requires permeabilization with saponin for uniform expansion, and 10-fold Robust ExM (TRExM), which uses the unnatural lipid probe mCling-ATTO-488 (Figure S3; see Supplementary Note 1 for a detailed discussion). Briefly, we observed some punctate artifacts in samples labeled with click-ExM and found that TRExM only labeled a subset of organelles compared to LExM and click-ExM. Areas of higher confluency were also less efficiently labeled by click-ExM and TRExM compared to LExM. Crucially, omission of detergent in click-ExM and TRExM led to highly distorted and/or torn expanded samples, demonstrating the requirement for detergent-based permeabilization steps that can alter membrane structure.
We next sought to harness the enhanced resolution of LExM to identify locations of metabolically labeled PC, an analysis that is challenged by the close juxtaposition of organelles.32 We adapted LExM to enable colocalization studies with organelle markers using immunofluorescence. Comparisons of pre- and post-LExM images of ProCho-labeled cells tagged with 1 and immunostained for a transfected ER marker revealed that areas with high colocalization could be clearly delineated from other closely associated membranes post-LExM at a level of detail absent pre-LExM (Figures 3A and S4A). Representative line plots of fluorescent profiles from each image demonstrate peaks separated by ~100 nm in the post-LExM image, in contrast to peaks ~300 nm in width in the pre-LExM image. Similar increases in resolution were seen in post-LExM images of labeled PC with markers of the Golgi complex, outer mitochondrial membrane (OMM), and mitochondrial matrix (Figures 3B–D and S4B–D), with the latter enabling specific visualization of labeled PC in the inner mitochondrial membrane (IMM). This observation is consistent with previous reports detailing the localization of labeled PC lipids in the IMM but contrasts with observations made using click-ExM, where mitochondrial fluorescence was observed exclusively in the OMM.27,33 Overall, we performed LExM with immunofluorescence labeling of several organelle markers encompassing both epitope-tagged and endogenous proteins (Figures 3 and S5), illustrating the broad scope of antibody labeling compatible with LExM and demonstrating the ability of LExM to precisely identify the locations of PC-containing membranes.
Figure 3.
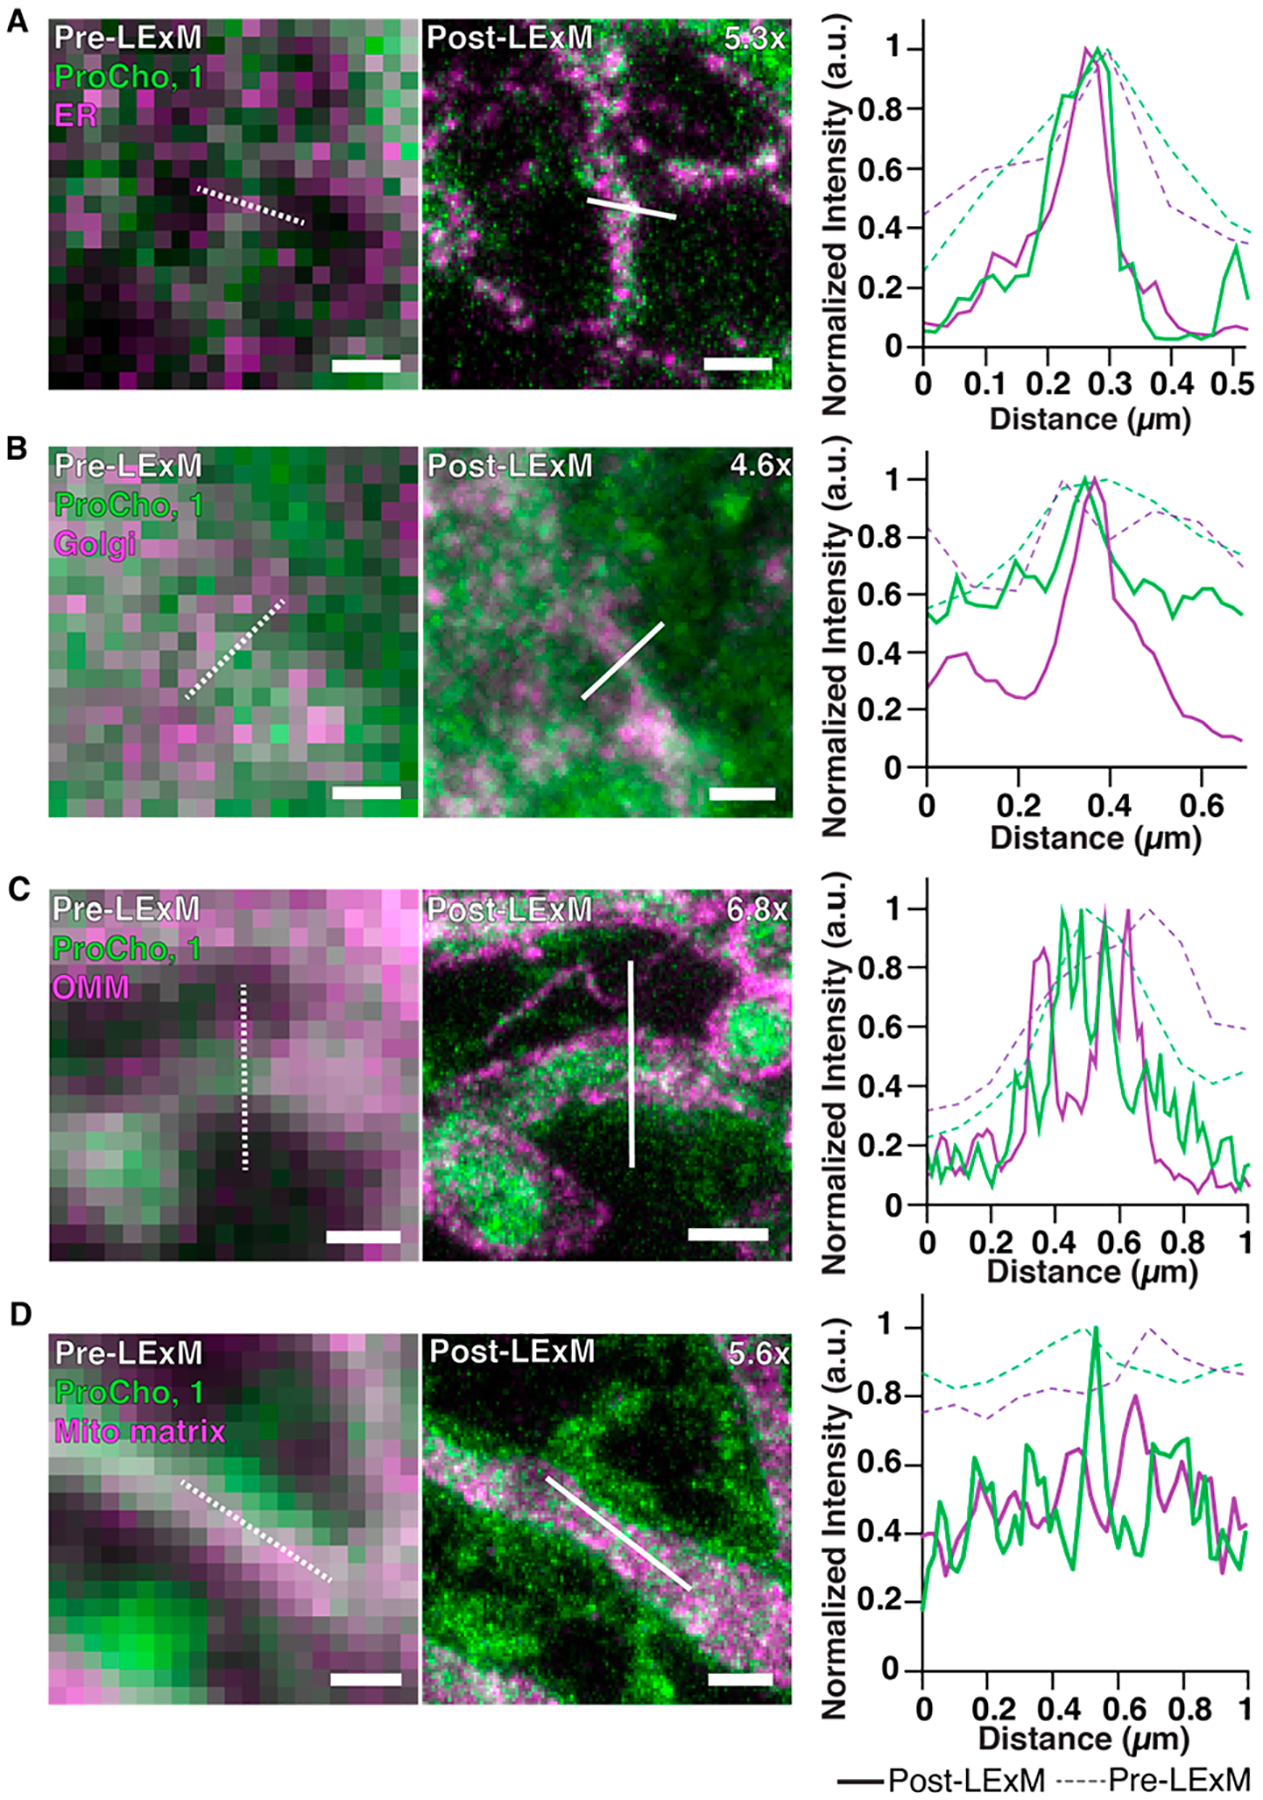
Pre- (left) and post-LExM (middle) Airyscan confocal images of cells transfected with organelle marker (magenta); mRFP-Sec61β, ER (A); mCherry-PH(OSBP), Golgi complex (B); OMP25TMmCherry, outer mitochondrial membrane (OMM, C); mCherry-Mito7, mitochondrial matrix (D) then labeled with ProCho and 1 (green), with fluorescence intensity profile line plots of pre- (dotted line) and post-LExM (solid line) images. Expansion factors are displayed in post-LExM images. Dotted and solid lines indicate profiles measured for line plots. Scale bars (pre-LExM distance): 400 nm.
Whereas metabolic labeling of phospholipids with ProCho enables measurement of bulk membrane lipids, many important signaling phospholipids, such as phosphatidic acid (PA), are generated at much lower levels.34 To establish LExM as a more general strategy for ExM-based imaging of alkyne-labeled lipids, we used a method termed IMPACT to visualize the activity of PA-generating phospholipase Ds (PLDs) by leveraging the ability of these enzymes to attach bioorthogonally labeled primary alcohols onto phospholipids (Figure 4A).35–38 We subjected cells to IMPACT labeling with the PLD substrate hexynol, CuAAC tagging with 1, and the LExM protocol. Consistent with ProCho-based LExM studies, IMPACT labeling generated samples with 5.6x expansion and fluorescence signal that correlated well with the pre-LExM image (Figure 4B). The enhanced resolution of the post-LExM image also enabled identification of distinct membranes such as the nuclear envelope (Figure 4B–D). Samples generated with IMPACT were obtained in a tunable manner with isotropic expansion and were amenable to colocalization studies with organelle markers (Figures S6 and S7). Importantly, treatment with a pan-PLD inhibitor prevented fluorescent labeling in pre-LExM images (Figure S6A). Beyond imaging headgroup-functionalized phospholipids, we also assessed LExM for visualizing alkyne-functionalized cholesterol within cellular membranes (Figure S8).39 Notably, post-LExM fluorescent signal was observed in alkyne-cholesterol-labeled cells tagged with 1 but not 2, highlighting the ability of hydrophobic BODIPY-based probe 1 to detect membrane-embedded alkynes.
Figure 4.
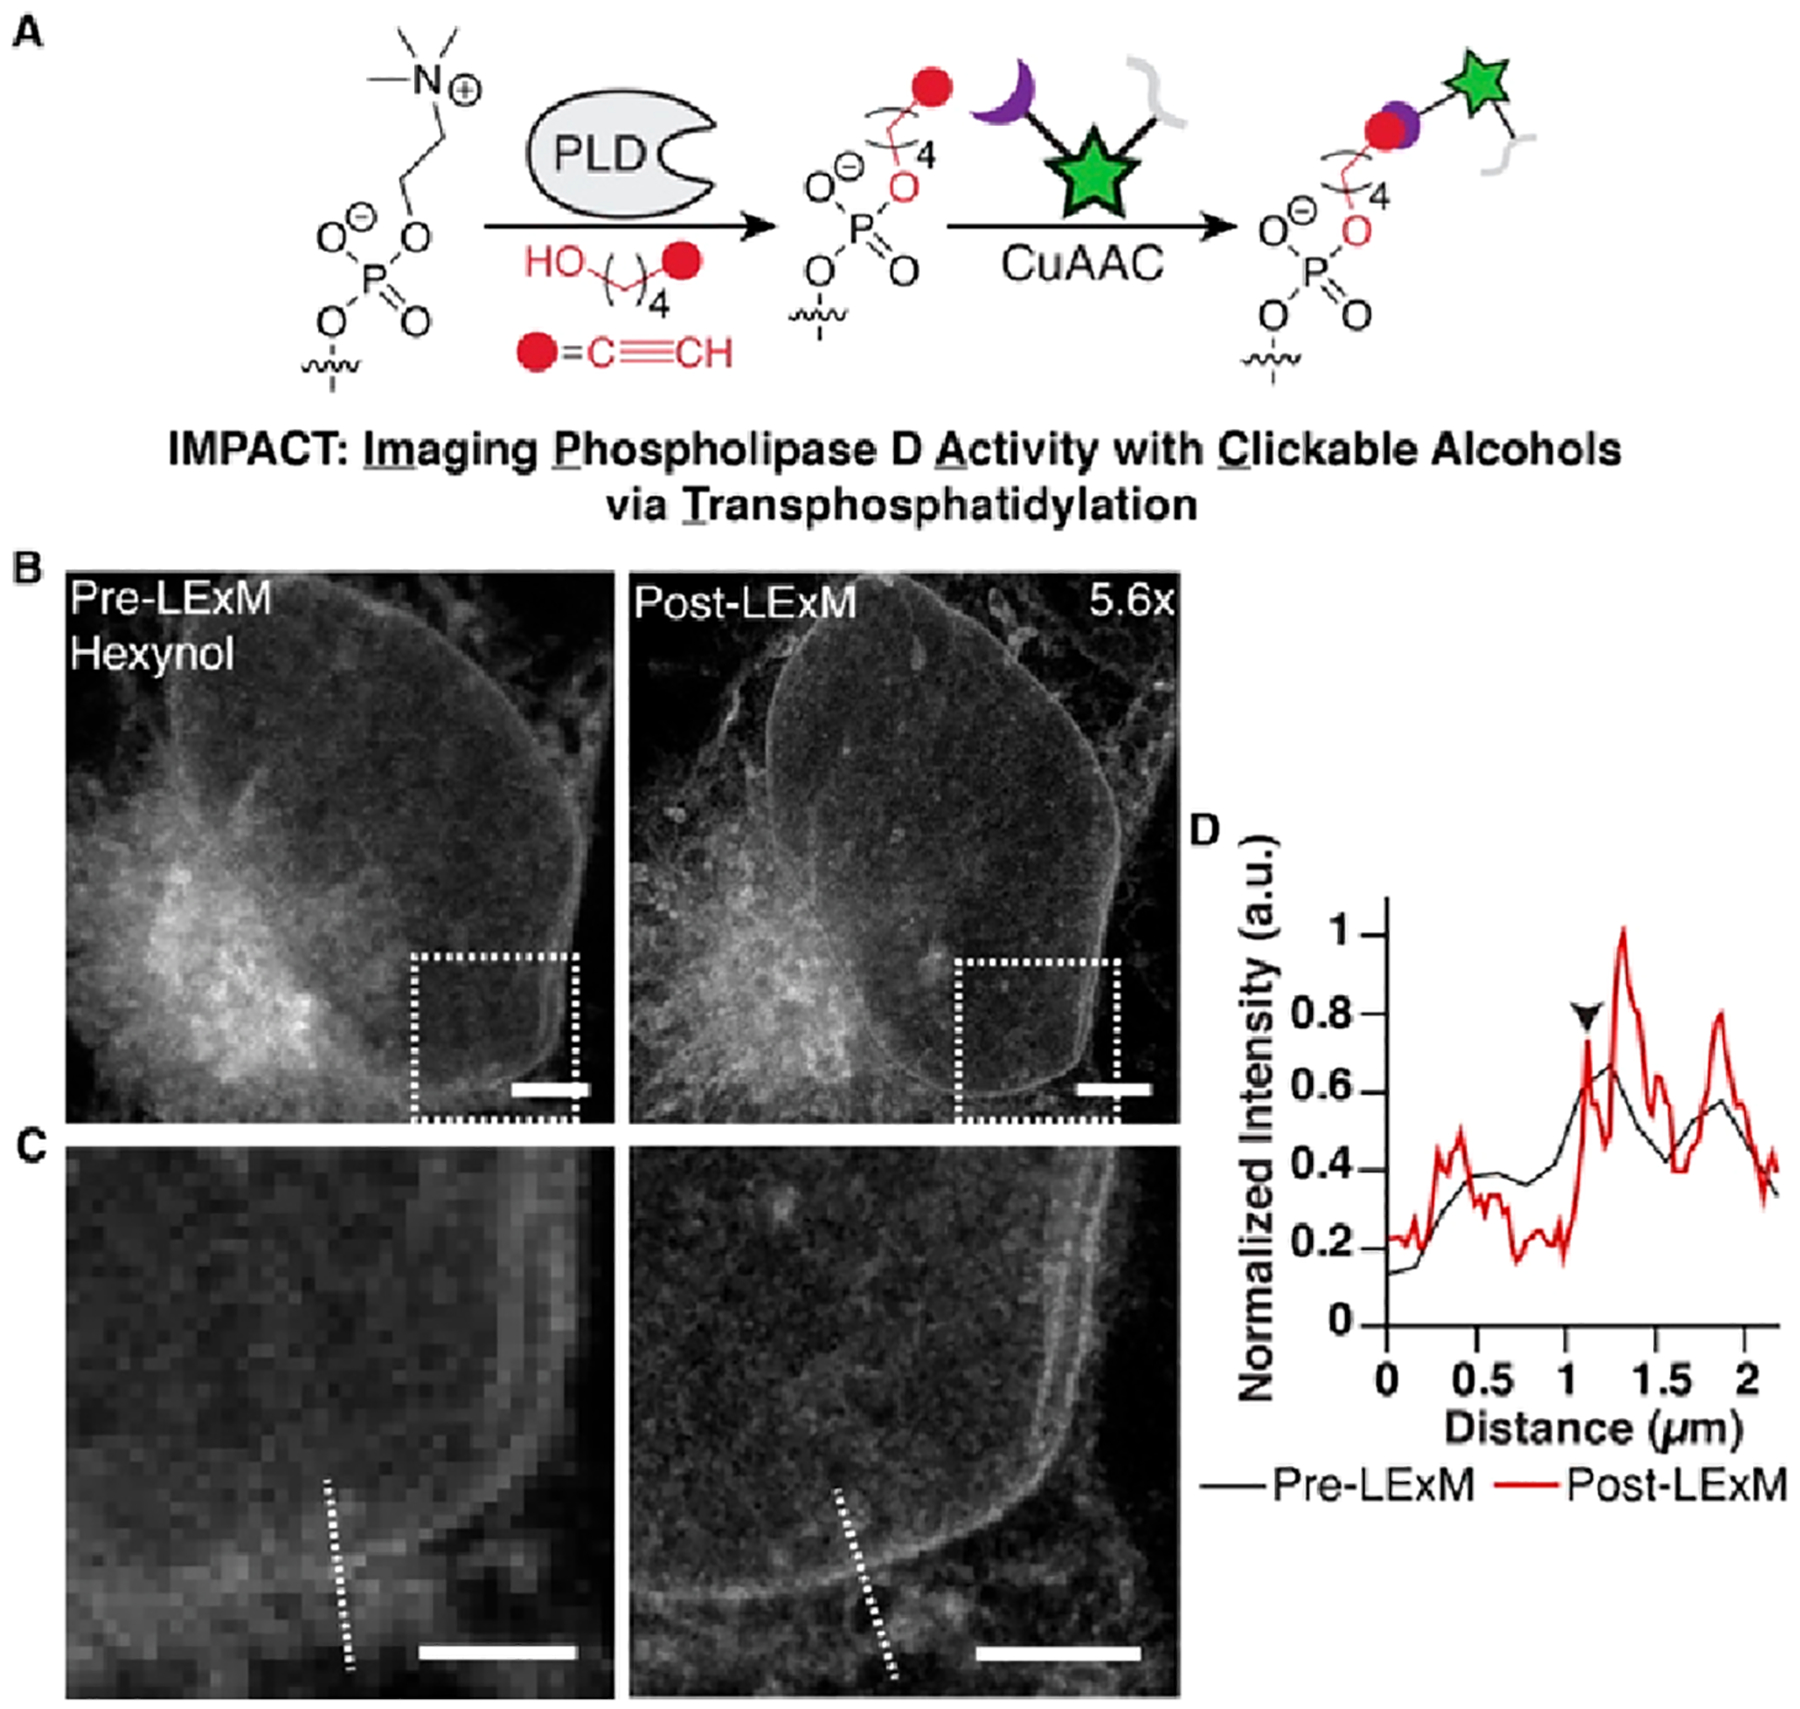
(A) Cell labeling via IMPACT in the presence of hexynol followed by CuAAC tagging with 1. (B) Pre- (left) and post-LExM (right) confocal images of IMPACT-labeled cells. Expansion factor is displayed in the post-LExM image. (C) Pre-LExM (left) and post-LExM (right) boxed areas in B. Scale bars (pre-LExM distance): 3 μm (B) and 2 μm (C). (D) Fluorescence intensity profile line plot for dotted lines in pre- (black) and post-LExM (red) images. Arrowhead indicates nuclear envelope.
Finally, we applied LExM to study subdiffraction scale cellular structures. Metabolic labeling of phospholipids revealed channels that traverse nuclei, which we hypothesized were a unique class of structures known as nuclear invaginations (Video S1). These channels are composed of the nuclear membrane surrounded by a lamina, which envelops cytoplasmic contents.40,41 Because of their narrow dimensions, their detailed analysis has been limited to electron microscopy and traditional super-resolution microscopy (e.g., STED/SMLM).7,8,42,43 To visualize these membrane-bound structures with ExM, we labeled cells expressing a nuclear lamina marker with ProCho and performed LExM with 1. Inspection of post-ExM images revealed channels that were surrounded by lamina, confirming their identity as nuclear invaginations (Figures 5A and S9A). Additionally, the ProCho fluorescence strongly colocalized with an ER marker (Figures 5B and S9B), indicating the presence of cytoplasmic contents within invaginations. We also detected large nuclear invaginations in IMPACT-labeled samples colabeled with a mitochondrial marker, in which the outer and inner mitochondrial membranes could be distinguished (Figures 5C and S9C). Collectively, these experiments indicate that LExM can detect organelles associated with nuclear invaginations, demonstrating LExM as a powerful method for detailed analysis of intracellular structures.
Figure 5.
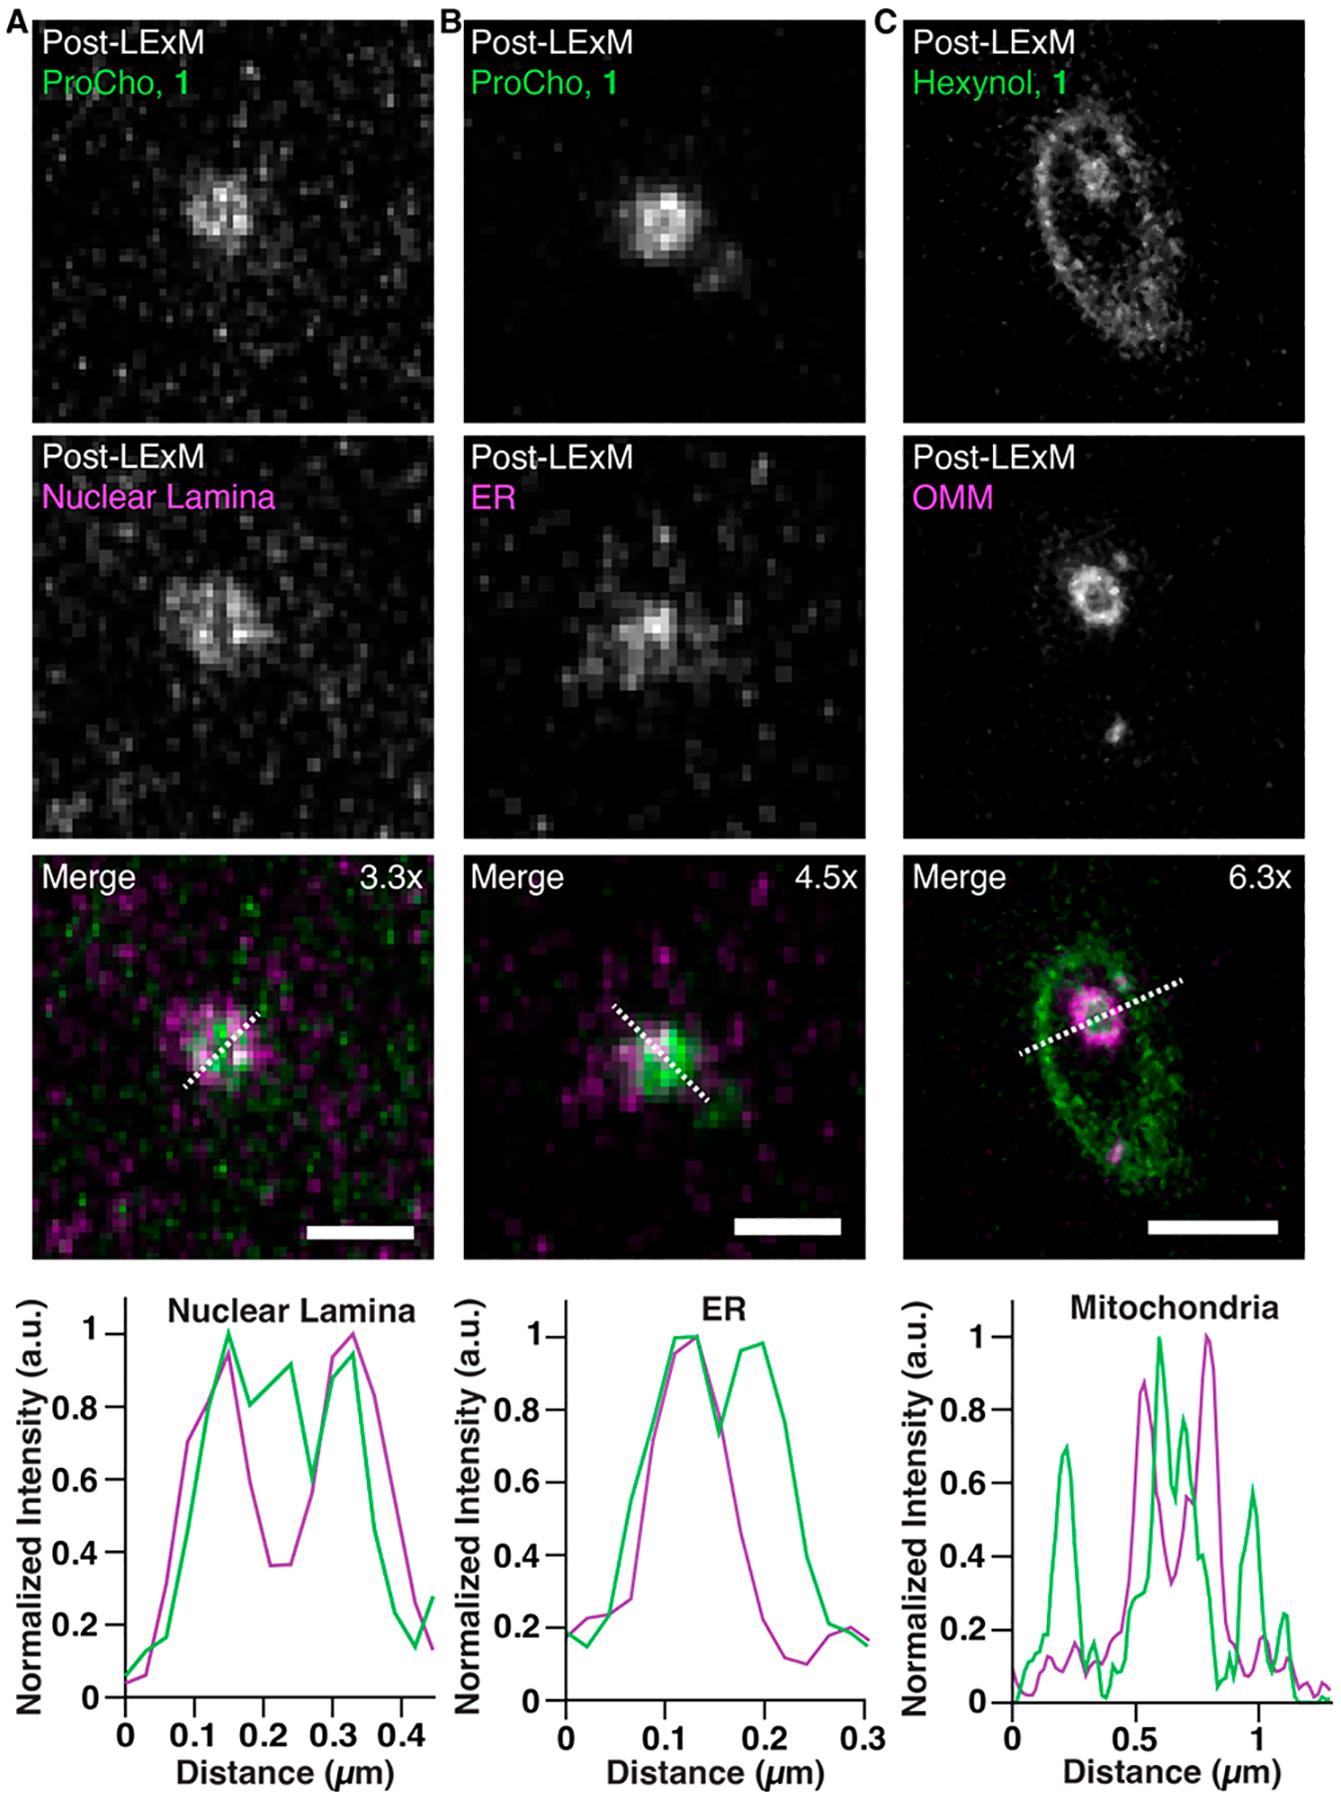
Airyscan confocal images of cells transfected with organelle markers (mRFP-Lamin A, nuclear lamina (A); mRFP-Sec61β, ER (B); OMP25TM-mCherry, outer mitochondrial membrane (OMM) (C)) and labeled with ProCho (A, B) or hexynol via IMPACT (C) and LExM using 1. Fluorescence intensity profile line plots were generated from dotted lines in merged images. Zoom-ins show lipids (top, green in merge), organelle markers (middle, magenta in merge), and merged image (bottom). Expansion factors are displayed in merged images. Scale bars (pre-LExM distance): 500 nm (A), 300 nm (B), and 1 μm (C).
In summary, LExM enables ExM imaging of lipid species within cellular membranes. It exploits small-molecule reagents to covalently anchor metabolically labeled lipids to a hydrogel network, permitting tunable and isotropic expansion without detergent-based permeabilization to preserve and illuminate molecular and structural details. LExM is compatible with metabolic labels for bulk phospholipids, sterols, and low-abundant signaling lipids, enabling high-resolution visualization of organelle membranes and subcellular structures with dimensions smaller than the diffraction limit of light. With accessible reagents requiring only a standard confocal microscope, we envision that LExM will democratize high-resolution imaging of lipids and membranes. Further, we anticipate that LExM may be suitable for super-resolution imaging of lipids within intact tissues and, beyond lipids, visualization of other biomolecules capable of bioorthogonal metabolic or chemoenzymatic labeling.
Supplementary Material
ACKNOWLEDGMENTS
We thank Jan Lammerding and Reika Tei for supplies and Timothy Bumpus, Marshall Colville, and Matthew Paszek for helpful discussions.
Funding
J.M.B. acknowledges support from the Arnold and Mabel Beckman Foundation (Beckman Young Investigator Award) and the Alfred P. Sloan Foundation (Sloan Research Fellowship). B.M.W. acknowledges support from the National Institutes of Health (F32GM134632). This work was partially supported by the Howard Hughes Medical Institute (HHMI). This work made use of the Cornell University NMR Facility, which is supported in part by the NSF (CHE-1531632).
Footnotes
The authors declare no competing financial interest.
Supporting Information
The Supporting Information is available free of charge at https://pubs.acs.org/doi/10.1021/jacs.2c03743.
Detailed LExM procedures and Supplementary Note 1 comparing ExM methods, and synthetic procedures and compound characterization (PDF)
Video demonstrating nuclear invaginations traveling through the nucleus of a cell labeled with ProCho (AVI)
Complete contact information is available at: https://pubs.acs.org/10.1021/jacs.2c03743
Contributor Information
Brittany M. White, Department of Chemistry and Chemical Biology, Cornell University, Ithaca, New York 14853, United States; Weill Institute for Cell and Molecular Biology, Cornell University, Ithaca, New York 14853, United States
Pratik Kumar, Janelia Research Campus, Howard Hughes Medical Institute, Ashburn, Virginia 20147, United States.
Amanda N. Conwell, Department of Chemistry and Chemical Biology, Cornell University, Ithaca, New York 14853, United States; Weill Institute for Cell and Molecular Biology, Cornell University, Ithaca, New York 14853, United States.
Kane Wu, Department of Chemistry and Chemical Biology, Cornell University, Ithaca, New York 14853, United States; Weill Institute for Cell and Molecular Biology, Cornell University, Ithaca, New York 14853, United States.
Jeremy M. Baskin, Department of Chemistry and Chemical Biology, Cornell University, Ithaca, New York 14853, United States; Weill Institute for Cell and Molecular Biology, Cornell University, Ithaca, New York 14853, United States
REFERENCES
- (1).Harayama T; Riezman H Understanding the Diversity of Membrane Lipid Composition. Nat. Rev. Mol. Cell Biol 2018, 19 (5), 281–296. [DOI] [PubMed] [Google Scholar]
- (2).Prinz WA; Toulmay A; Balla T The Functional Universe of Membrane Contact Sites. Nat. Rev. Mol. Cell Biol 2020, 21 (1), 7–24. [DOI] [PMC free article] [PubMed] [Google Scholar]
- (3).Vance JE Phospholipid Synthesis and Transport in Mammalian Cells. Traffic 2015, 16 (1), 1–18. [DOI] [PubMed] [Google Scholar]
- (4).Bumpus TW; Baskin JM Greasing the Wheels of Lipid Biology with Chemical Tools. Trends Biochem. Sci 2018, 43 (12), 970–983. [DOI] [PMC free article] [PubMed] [Google Scholar]
- (5).Flores J; White BM; Brea RJ; Baskin JM; Devaraj NK Lipids: Chemical Tools for Their Synthesis, Modification, and Analysis. Chem. Soc. Rev 2020, 49 (14), 4602–4614. [DOI] [PMC free article] [PubMed] [Google Scholar]
- (6).Yang NJ; Hinner MJ Getting Across the Cell Membrane: An Overview for Small Molecules, Peptides, and Proteins. Methods Mol. Biol 2015, 1266, 29–53. [DOI] [PMC free article] [PubMed] [Google Scholar]
- (7).Thompson AD; Bewersdorf J; Toomre D; Schepartz A HIDE Probes: A New Toolkit for Visualizing Organelle Dynamics, Longer and at Super-Resolution. Biochemistry 2017, 56 (39), 5194–5201. [DOI] [PMC free article] [PubMed] [Google Scholar]
- (8).Takakura H; Zhang Y; Erdmann RS; Thompson AD; Lin Y; McNellis B; Rivera-Molina F; Uno SN; Kamiya M; Urano Y; Rothman JE; Bewersdorf J; Schepartz A; Toomre D Long Time-Lapse Nanoscopy with Spontaneously Blinking Membrane Probes. Nat. Biotechnol 2017, 35 (8), 773–780. [DOI] [PMC free article] [PubMed] [Google Scholar]
- (9).Gupta A; Rivera-Molina F; Xi Z; Toomre D; Schepartz A Endosome Motility Defects Revealed at Super-Resolution in Live Cells Using HIDE Probes. Nat. Chem. Biol 2020, 16 (4), 408–414. [DOI] [PMC free article] [PubMed] [Google Scholar]
- (10).Dadina N; Tyson J; Zheng S; Lesiak L; Schepartz A Imaging Organelle Membranes in Live Cells at the Nanoscale with Lipid-Based Fluorescent Probes. Curr. Opin. Chem. Biol 2021, 65, 154–162. [DOI] [PMC free article] [PubMed] [Google Scholar]
- (11).Chen F; Tillberg PW; Boyden ES Expansion Microscopy. Science 2015, 347 (6221), 543–548. [DOI] [PMC free article] [PubMed] [Google Scholar]
- (12).Chozinski TJ; Halpern AR; Okawa H; Kim HJ; Tremel GJ; Wong ROL; Vaughan JC Expansion Microscopy with Conventional Antibodies and Fluorescent Proteins. Nat. Methods 2016, 13 (6), 485–488. [DOI] [PMC free article] [PubMed] [Google Scholar]
- (13).Park H; Choi D; Park JS; Sim C; Park S; Kang S; Yim H; Lee M; Kim J; Pac J; Rhee K; Lee J; Lee Y; Lee Y; Kim S-Y Scalable and Isotropic Expansion of Tissues with Simply Tunable Expansion Ratio. Adv. Sci 2019, 6 (22), 1901673. [DOI] [PMC free article] [PubMed] [Google Scholar]
- (14).Shi X; Li Q; Dai Z; Tran AA; Feng S; Ramirez AD; Lin Z; Wang X; Chow TT; Chen J; Kumar D; McColloch AR; Reiter JF; Huang EJ; Seiple IB; Huang B Label-Retention Expansion Microscopy. J. Cell Biol 2021, 220 (9), No. e202105067. [DOI] [PMC free article] [PubMed] [Google Scholar]
- (15).Ku T; Swaney J; Park JY; Albanese A; Murray E; Hun Cho J; Park YG; Mangena V; Chen J; Chung K Multiplexed and Scalable Super-Resolution Imaging of Three-Dimensional Protein Localization in Size-Adjustable Tissues. Nat. Biotechnol 2016, 34 (9), 973–981. [DOI] [PMC free article] [PubMed] [Google Scholar]
- (16).Wassie AT; Zhao Y; Boyden ES Expansion Microscopy: Principles and Uses in Biological Research. Nat. Methods 2019, 16 (1), 33–41. [DOI] [PMC free article] [PubMed] [Google Scholar]
- (17).Asano SM; Gao R; Wassie AT; Tillberg PW; Chen F; Boyden ES Expansion Microscopy: Protocols for Imaging Proteins and RNA in Cells and Tissues. Curr. Protoc. Cell Biol 2018, 80 (1), No. e56. [DOI] [PMC free article] [PubMed] [Google Scholar]
- (18).Truckenbrodt S; Maidorn M; Crzan D; Wildhagen H; Kabatas S; Rizzoli SO X10 Expansion Microscopy Enables 25-Nm Resolution on Conventional Microscopes. EMBO Rep 2018, 19 (9), No. e45836. [DOI] [PMC free article] [PubMed] [Google Scholar]
- (19).Chang JB; Chen F; Yoon YG; Jung EE; Babcock H; Kang JS; Asano S; Suk HJ; Pak N; Tillberg PW; Wassie AT; Cai D; Boyden ES Iterative Expansion Microscopy. Nat. Methods 2017, 14 (6), 593–599. [DOI] [PMC free article] [PubMed] [Google Scholar]
- (20).Truckenbrodt S; Sommer C; Rizzoli SO; Danzl JG A Practical Guide to Optimization in X10 Expansion Microscopy. Nat. Protoc 2019, 14 (3), 832–863. [DOI] [PubMed] [Google Scholar]
- (21).Wen G; Vanheusden M; Leen V; Rohand T; Vandereyken K; Voet T; Hofkens J A Universal Labeling Strategy for Nucleic Acids in Expansion Microscopy. J. Am. Chem. Soc 2021, 143 (34), 13782–13789. [DOI] [PubMed] [Google Scholar]
- (22).Chen F; Wassie AT; Cote AJ; Sinha A; Alon S; Asano S; Daugharthy ER; Chang JB; Marblestone A; Church GM; Raj A; Boyden ES Nanoscale Imaging of RNA with Expansion Microscopy. Nat. Methods 2016, 13 (8), 679–684. [DOI] [PMC free article] [PubMed] [Google Scholar]
- (23).Karagiannis ED; Kang JS; Shin TW; Emenari A; Asano S; Lin L; Costa EK; Consortium IGC; Marblestone AH; Kasthuri N; Boyden ES Expansion Microscopy of Lipid Membranes. bioRxiv, November 4, 2019. DOI: 10.1101/829903 (accessed 2022-09-09). [DOI] [Google Scholar]
- (24).Götz R; Kunz TC; Fink J; Solger F; Schlegel J; Seibel J; Kozjak-Pavlovic V; Rudel T; Sauer M Nanoscale Imaging of Bacterial Infections by Sphingolipid Expansion Microscopy. Nat. Commun 2020, 11, 6173. [DOI] [PMC free article] [PubMed] [Google Scholar]
- (25).Wen G; Vanheusden M; Acke A; Valli D; Neely RK; Leen V; Hofkens J Evaluation of Direct Grafting Strategies via Trivalent Anchoring for Enabling Lipid Membrane and Cytoskeleton Staining in Expansion Microscopy. ACS Nano 2020, 14 (7), 7860–7867. [DOI] [PubMed] [Google Scholar]
- (26).Damstra HGJ; Mohar B; Eddison M; Akhmanova A; Kapitein LC; Tillberg PW Visualizing Cellular and Tissue Ultrastructure Using Ten-Fold Robust Expansion Microscopy (TREx). eLife 2022, 11, No. e73775. [DOI] [PMC free article] [PubMed] [Google Scholar]
- (27).Sun D. en; Fan X; Shi Y; Zhang H; Huang Z; Cheng B; Tang Q; Li W; Zhu Y; Bai J; Liu W; Li Y; Wang X; Lei X; Chen X Click-ExM Enables Expansion Microscopy for All Biomolecules. Nat. Methods 2021, 18 (1), 107–113. [DOI] [PubMed] [Google Scholar]
- (28).Grimm JB; Muthusamy AK; Liang Y; Brown TA; Lemon WC; Patel R; Lu R; Macklin JJ; Keller PJ; Ji N; Lavis LD A General Method to Fine-Tune Fluorophores for Live-Cell and in Vivo Imaging. Nat. Methods 2017, 14 (10), 987–994. [DOI] [PMC free article] [PubMed] [Google Scholar]
- (29).Jao CY; Roth M; Welti R; Salic A Metabolic Labeling and Direct Imaging of Choline Phospholipids in Vivo. Proc. Natl. Acad. Sci. U. S. A 2009, 106 (36), 15332–15337. [DOI] [PMC free article] [PubMed] [Google Scholar]
- (30).Gao R; Yu CC; Gao L; Piatkevich KD; Neve RL; Munro JB; Upadhyayula S; Boyden ES A Highly Homogeneous Polymer Composed of Tetrahedron-like Monomers for High-Isotropy Expansion Microscopy. Nat. Nanotechnol 2021, 16 (6), 698–707. [DOI] [PMC free article] [PubMed] [Google Scholar]
- (31).Zheng Q; Ayala AX; Chung I; Weigel AV; Ranjan A; Falco N; Grimm JB; Tkachuk AN; Wu C; Lippincott-Schwartz J; Singer RH; Lavis LD Rational Design of Fluorogenic and Spontaneously Blinking Labels for Super-Resolution Imaging. ACS Cent. Sci 2019, 5 (9), 1602–1613. [DOI] [PMC free article] [PubMed] [Google Scholar]
- (32).Zhanghao K; Liu W; Li M; Wu Z; Wang X; Chen X; Shan C; Wang H; Chen X; Dai Q; Xi P; Jin D High-Dimensional Super-Resolution Imaging Reveals Heterogeneity and Dynamics of Subcellular Lipid Membranes. Nat. Commun 2020, 11, 5890. [DOI] [PMC free article] [PubMed] [Google Scholar]
- (33).Tamura T; Fujisawa A; Tsuchiya M; Shen Y; Nagao K; Kawano S; Tamura Y; Endo T; Umeda M; Hamachi I Organelle Membrane-Specific Chemical Labeling and Dynamic Imaging in Living Cells. Nat. Chem. Biol 2020, 16 (12), 1361–1367. [DOI] [PubMed] [Google Scholar]
- (34).Selvy PE; Lavieri RR; Lindsley CW; Brown HA Phospholipase D: Enzymology, Functionality, and Chemical Modulation. Chem. Rev 2011, 111 (10), 6064–6119. [DOI] [PMC free article] [PubMed] [Google Scholar]
- (35).Bumpus TW; Baskin JM A Chemoenzymatic Strategy for Imaging Cellular Phosphatidic Acid Synthesis. Angew. Chemie Int. Ed 2016, 55 (42), 13155–13158. [DOI] [PMC free article] [PubMed] [Google Scholar]
- (36).Bumpus TW; Baskin JM Clickable Substrate Mimics Enable Imaging of Phospholipase D Activity. ACS Cent. Sci 2017, 3 (10), 1070–1077. [DOI] [PMC free article] [PubMed] [Google Scholar]
- (37).Liang D; Wu K; Tei R; Bumpus TW; Ye J; Baskin JM A Real-Time Click Chemistry Imaging Approach Reveals Stimulus-Specific Subcellular Locations of Phospholipase D Activity. Proc. Natl. Acad. Sci. U. S. A 2019, 116 (31), 15453–15462. [DOI] [PMC free article] [PubMed] [Google Scholar]
- (38).Tei R; Baskin JM Click Chemistry and Optogenetic Approaches to Visualize and Manipulate Phosphatidic Acid Signaling. J. Biol. Chem 2022, 298 (4), 101810. [DOI] [PMC free article] [PubMed] [Google Scholar]
- (39).Jao CY; Nedelcu D; Lopez LV; Samarakoon TN; Welti R; Salic A Bioorthogonal Probes for Imaging Sterols in Cells. ChemBioChem 2015, 16 (4), 611–617. [DOI] [PMC free article] [PubMed] [Google Scholar]
- (40).Drozdz MM; Jiang H; Pytowski L; Grovenor C; Vaux DJ Formation of a Nucleoplasmic Reticulum Requires de Novo Assembly of Nascent Phospholipids and Shows Preferential Incorporation of Nascent Lamins. Sci. Rep 2017, 7, 7454. [DOI] [PMC free article] [PubMed] [Google Scholar]
- (41).Schoen I; Aires L; Ries J; Vogel V Nanoscale Invaginations of the Nuclear Envelope: Shedding New Light on Wormholes with Elusive Function. Nucleus 2017, 8 (5), 506–514. [DOI] [PMC free article] [PubMed] [Google Scholar]
- (42).Fricker M; Hollinshead M; White N; Vaux D Interphase Nuclei of Many Mammalian Cell Types Contain Deep, Dynamic, Tubular Membrane-Bound Invaginations of the Nuclear Envelope. J. Cell Biol 1997, 136 (3), 531–544. [DOI] [PMC free article] [PubMed] [Google Scholar]
- (43).Drozdz MM; Vaux DJ Shared Mechanisms in Physiological and Pathological Nucleoplasmic Reticulum Formation. Nucleus 2017, 8 (1), 34–45. [DOI] [PMC free article] [PubMed] [Google Scholar]
Associated Data
This section collects any data citations, data availability statements, or supplementary materials included in this article.


