Abstract
Background:
Cirrhosis is associated with cardiac dysfunction and distinct ECG abnormalities. This study aimed to develop a proof-of-concept deep learning-based artificial intelligence (AI) model that could detect cirrhosis-related signals on ECG and generate an AI-Cirrhosis-ECG (ACE) score that would correlate with disease severity.
Methods:
A review of Mayo Clinic’s electronic health records identified 5,212 patients with advanced cirrhosis ≥18 years of age who underwent liver transplantation (LT) at the three Mayo Clinic transplant centers between 1988 and 2019. The patients were matched by age and sex in a 1:4 ratio to controls without liver disease, then divided into training, validation, and test sets using a 70%–10%–20% split. The primary outcome was the performance of the model in distinguishing patients with cirrhosis from controls using their ECGs. Additionally, the association between the ACE score and the severity of patients’ liver disease was assessed.
Results:
The model’s AUC in the testing set was 0.908 with 84.9% sensitivity and 83.2% specificity, and this performance remained consistent after additional matching for medical comorbidities. Significant elevations in the ACE scores were seen with increasing MELD-Na. Longitudinal trends in the ACE scores before and after LT mirrored the progression and resolution of liver disease.
Conclusion:
The ACE score, a deep learning model, can accurately discriminate ECGs from patients with and without cirrhosis. This novel relationship between AI-enabled ECG analysis and cirrhosis holds promise as the basis for future low-cost tools and applications in the care of patients with liver disease.
Keywords: Cirrhosis, electrocardiogram, deep learning, neural network, artificial intelligence
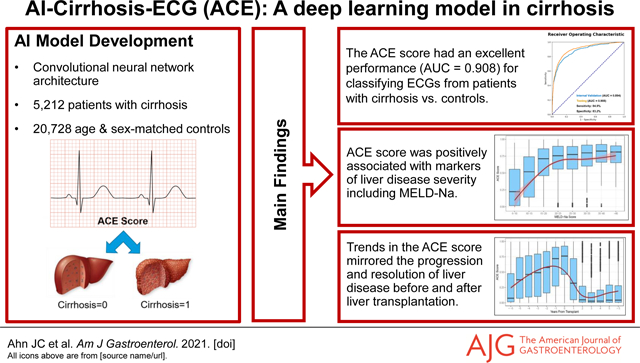
Graphical Abstract
Introduction
Cirrhosis is the common endpoint in patients with chronic progressive liver diseases of various causes. Globally, cirrhosis accounts for approximately 2 million deaths each year.(1) In the United States, it is the 12th leading cause of death overall but the 4th leading cause among patients aged 45–64 years.(2) Cirrhosis is known to cause distinct cardiac dysfunction and electromechanical abnormalities that correlate with severity of liver disease.(3) Recently, deep learning-based artificial intelligence (AI) models utilizing convolutional neural networks (CNN) have enabled automated prediction of various cardiac and non-cardiac conditions on digitized 12-lead ECGs. We proposed that the structural and metabolic changes in the circulatory system that take place alongside hepatic cirrhosis would be reliably detected on 12-lead ECGs by a CNN trained on a well-curated sample of patients with cirrhosis. The aim of our study was to determine if an ECG-derived CNN could accurately detect the presence of cirrhosis and to produce a numerical scale that correlated with disease severity.
Methods
Data Sources and Study Population
To best capture cirrhosis-related ECG changes on our CNN, we trained the model using ECGs of patients with advanced cirrhosis who underwent liver transplantation (LT). A retrospective review of Mayo Clinic’s electronic health records was performed to identify patients over 18 years of age who underwent LT at three Mayo Clinic sites (MN; AZ; FL) between years 1988 and 2019 and had at least one standard, 10-second, 12-lead ECG at most a week prior to LT. Those who underwent LT for non-cirrhosis-related reasons were excluded. Patients were randomly matched on age and sex in a 1:4 ratio to controls without liver disease. Both the cirrhosis and the control cohorts were divided into training, validation, and test sets using a 70%–10%–20% split (Figure 1). Baseline demographic information and medical comorbidities at the time of the ECGs were collected. Continuous variables were reported as mean (±SD) and median (Q1, Q3), and compared using the Student’s t-test. Categorical variables were reported as absolute numbers and percentages and compared using the chi-square test.
Figure 1.
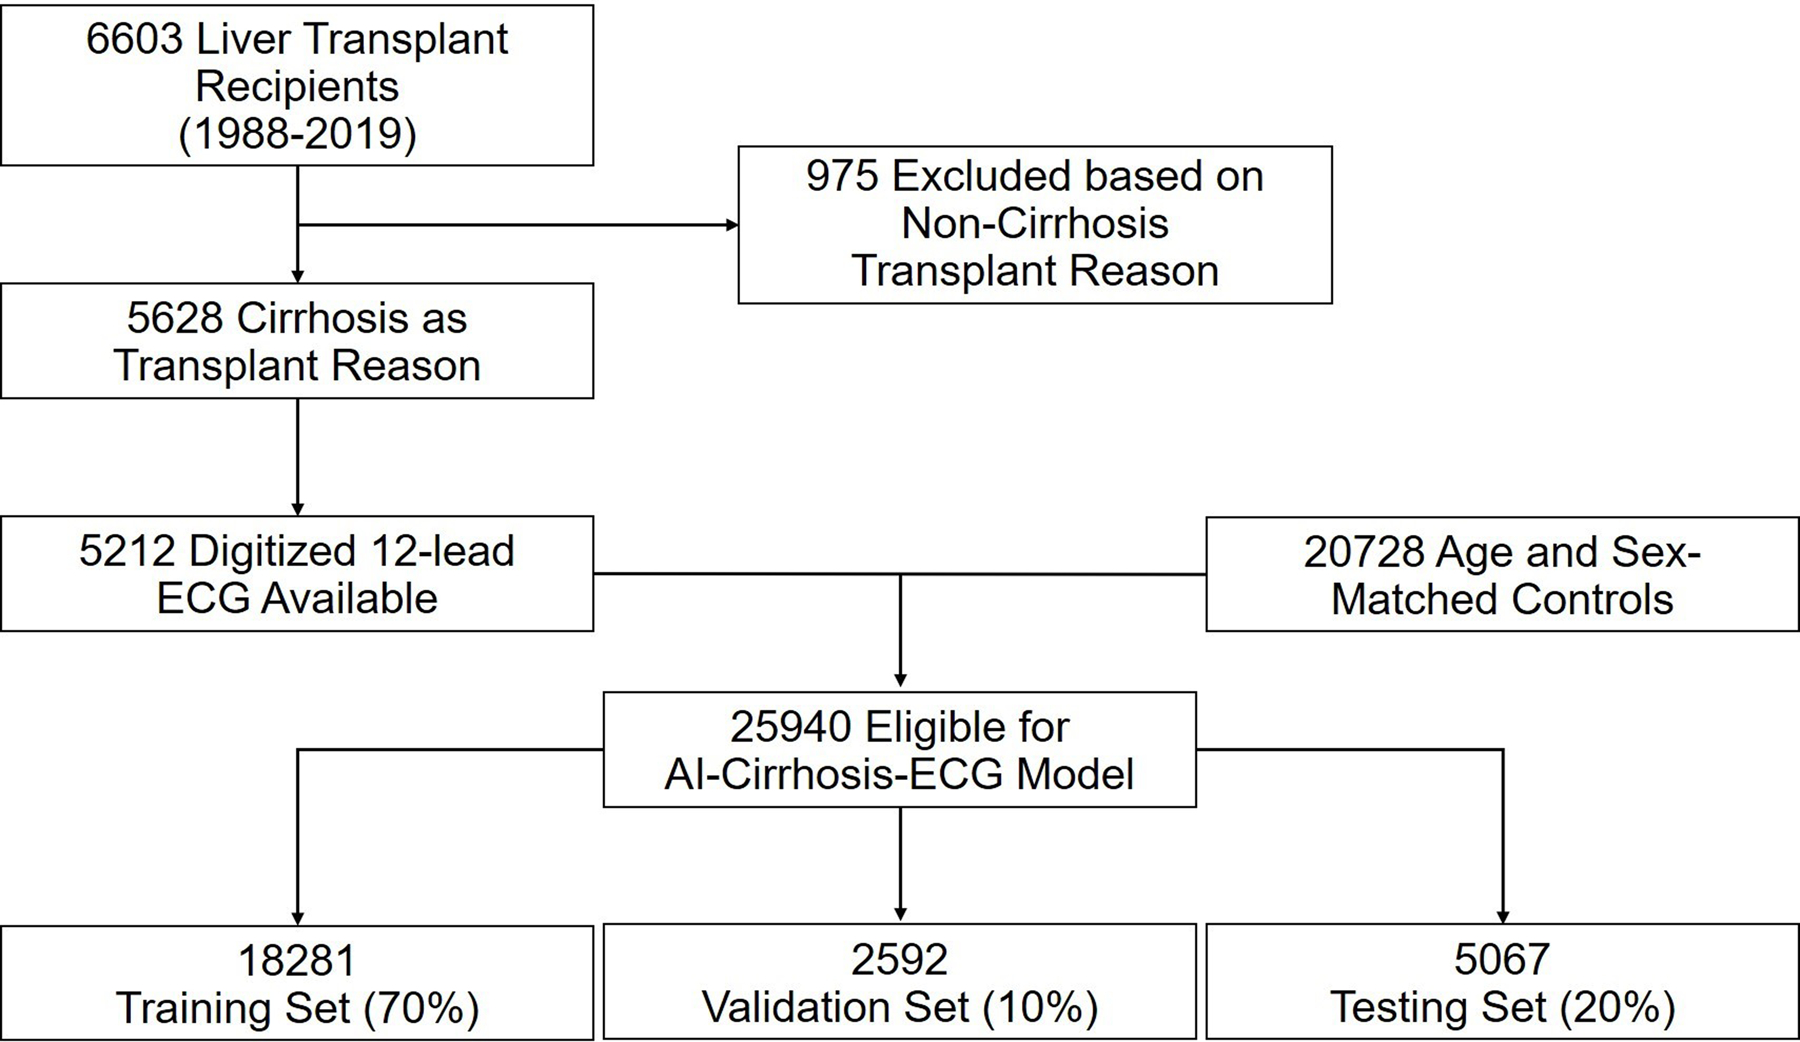
Cohort Selection and Model Development
Model Development
We trained a binary classification model using a CNN. The model input was a standard 10-second, 12-lead ECG and the output being the likelihood of the ECG being from a patient with cirrhosis. A detailed description of the CNN architecture and training is provided in the Supplemental Methods.
Model Performance Assessment
The primary outcome was the ability of the CNN to distinguish patients with cirrhosis from controls. The CNN produced the AI-Cirrhosis ECG (ACE) score, a continuous value between 0 and 1 indicating the estimated likelihood of cirrhosis on each ECG. After developing and refining the model, we used the receiver-operating characteristic (ROC) curve from the validation set to select an optimal ACE score threshold for binary classification. The CNN was then applied to a hold-out test set and its performance metrics were measured using this optimal threshold. To minimize confounding from other disease states, we evaluated the CNN’s performance in the test set using controls matched not only for age and sex, but also for comorbidities, specifically hypertension, diabetes mellitus, cardiovascular disease, chronic kidney disease, and chronic lung disease. In addition, we assessed the model performance in subgroups of the test set categorized by sex, age, comorbid medical conditions, and etiologies of liver disease.
Relationship between the ACE score and Liver Disease Severity
We evaluated the relationship between the magnitude of the ACE score and the severity of liver disease as represented by the model for end-stage liver disease-sodium score (MELD-Na).(4) For patients with cirrhosis in the test set, we obtained patients’ MELD-Na corresponding to the time of their ECGs. Individuals were then grouped into categories according to their MELD-Na, and the median ACE scores across these categories were compared using the Kruskal-Wallis test. In addition, we calculated the Spearman coefficients to assess correlation between the ACE score and laboratory markers of cirrhosis.
Longitudinal changes in the ACE score before and after liver transplant
To assess how changes in the ACE score reflect the severity of patients’ liver disease over time, we investigated longitudinal trends in the ACE scores of 547 test set patients who received long-term care at Mayo Clinic and had multiple 12-lead ECGs at various time points. We assessed the distribution of their ACE scores over time, categorized by years before and after LT. We used the Kruskal-Wallis test to determine differences in median ACE scores between the time point categories.
ACE scores in asymptomatic patients with compensated cirrhosis
As an additional validation, the performance of the model was tested in a distinct set of patients with earlier stages of disease, namely compensated cirrhosis. Review of the electronic records identified a cohort of 843 patients with cirrhosis without any decompensating events including variceal hemorrhage, ascites, or hepatic encephalopathy. ECGs were obtained for all these patients at most 6 months prior to the diagnosis of compensated cirrhosis according to clinical documentation. The distribution of ACE scores was compared to the original controls and patients with cirrhosis requiring LT.
Results
Baseline Characteristics of the Patients with Cirrhosis and Controls
Table 1 demonstrates the baseline characteristics for the cirrhosis and control groups. Overall, there were 5,212 patients with cirrhosis meeting the inclusion criteria and 20,728 age and sex-matched controls without liver diseases. According to the 70%–10%–20% split, a total of 18,281 (3,665 cirrhosis vs. 14,616 controls), 2,592 (532 cirrhosis vs. 2060 controls), and 5,067 (1,015 cirrhosis vs. 4,052 controls) subjects were assigned to the training, validation, and test sets respectively (Supplemental Table 1). All groups had comparable age (median age = 57) and sex distributions (65% male). Controls had higher prevalence of cardiovascular diseases (coronary artery disease or cardiomyopathy) while the patients with cirrhosis had higher prevalence of diabetes mellitus, hypertension, chronic lung disease and chronic kidney disease. Among patients with cirrhosis, viral hepatitis was the most common cause of liver disease followed by alcohol-related liver disease, non-alcoholic steatohepatitis (NASH), biliary diseases, hereditary/genetic conditions, cryptogenic cirrhosis, autoimmune hepatitis and other liver diseases. Hepatocellular carcinoma was present in 27.1% of patients.
Table 1.
Baseline Characteristics
| Overall Set N = 25,940 |
||||
|---|---|---|---|---|
| Categories | Cirrhosis N=5,212 |
Control N=20,728 |
p-value | |
| Sex | F | 1,801 (34.6%) | 7,207 (34.7%) | 0.84 |
| M | 3,411 (65.4%) | 13,521 (65.3%) | ||
| Age |
Median
(Q1,Q3) |
57.0 (50.0,63.0) |
57.0 (50.0,63.0) |
0.80 |
|
Mean
(SD) |
55.63 (10.17) | 55.66 (10.17) | ||
| Cardiovascular disease | 458 (8.8%) |
2,387 (11.5%) |
<0.01 | |
| Diabetes mellitus | 1,793 (34.4%) |
2,928 (14.1%) |
<0.01 | |
| Hypertension | 2,268 (43.5%) |
8,197 (39.5%) |
<0.01 | |
| Chronic lung disease | 955 (18.3%) |
3,452 (16.7%) |
<0.01 | |
| Chronic kidney disease | 1,553 (29.8%) |
1,453 (7.0%) |
<0.01 | |
| Alcohol-related liver disease | 1,337 (25.7%) |
0 (0.0%) |
<0.01 | |
| NASH | 966 (18.5%) |
0 (0.0%) |
<0.01 | |
| Viral Hepatitis (HBV/HCV) | 1,929 (37.0%) |
0 (0.0%) |
<0.01 | |
|
Biliary
(PBC/PSC) |
656 (12.6%) |
0 (0.0%) |
<0.01 | |
| Autoimmune hepatitis | 204 (3.9%) |
0 (0.0%) |
<0.01 | |
|
Hereditary/Genetic
(A1ATD, HH, WD) |
273 (5.2%) |
0 (0.0%) |
<0.01 | |
| Cryptogenic | 238 (4.6%) |
0 (0.0%) |
<0.01 | |
| Hepatocellular carcinoma | 1,413 (27.1%) |
0 (0.0%) |
<0.01 | |
| Other liver diseases | 302 (5.8%) |
0 (0.0%) |
<0.01 | |
| MELD Score |
Median
(Q1,Q3) |
18.0 (13.0,24.0) |
N/A | |
|
Mean
(SD) |
19.14 (8.5) |
N/A | ||
Abbreviations: A1ATD = alpha-1-antitrypsin deficiency; HBV = hepatitis B virus; HCV = hepatitis C virus; HH = hereditary hemochromatosis; PBC = primary biliary cholangitis; PSC = primary sclerosing cholangitis; WD = Wilson’s disease
Model Performance in the Test Set
Figure 2 shows the CNN’s performance as a binary classifier within the test set. The full model using standard 10-second, 12-lead ECGs showed an excellent performance with AUC of 0.908. When the model was modified to use only the first 2 seconds of 12-lead ECGs, its AUC was unchanged at 0.908. Simpler models utilizing 10 seconds of six limb leads and 10 seconds of lead I continued to perform well with AUCs of 0.866 and 0.842, respectively. Using an ACE score of 0.17 as the optimal threshold, the model showed 84.9% sensitivity and 83.2% specificity, as well as 55.9% PPV and 95.7% NPV for the detection of cirrhosis in this cohort.
Figure 2. Model Performance.
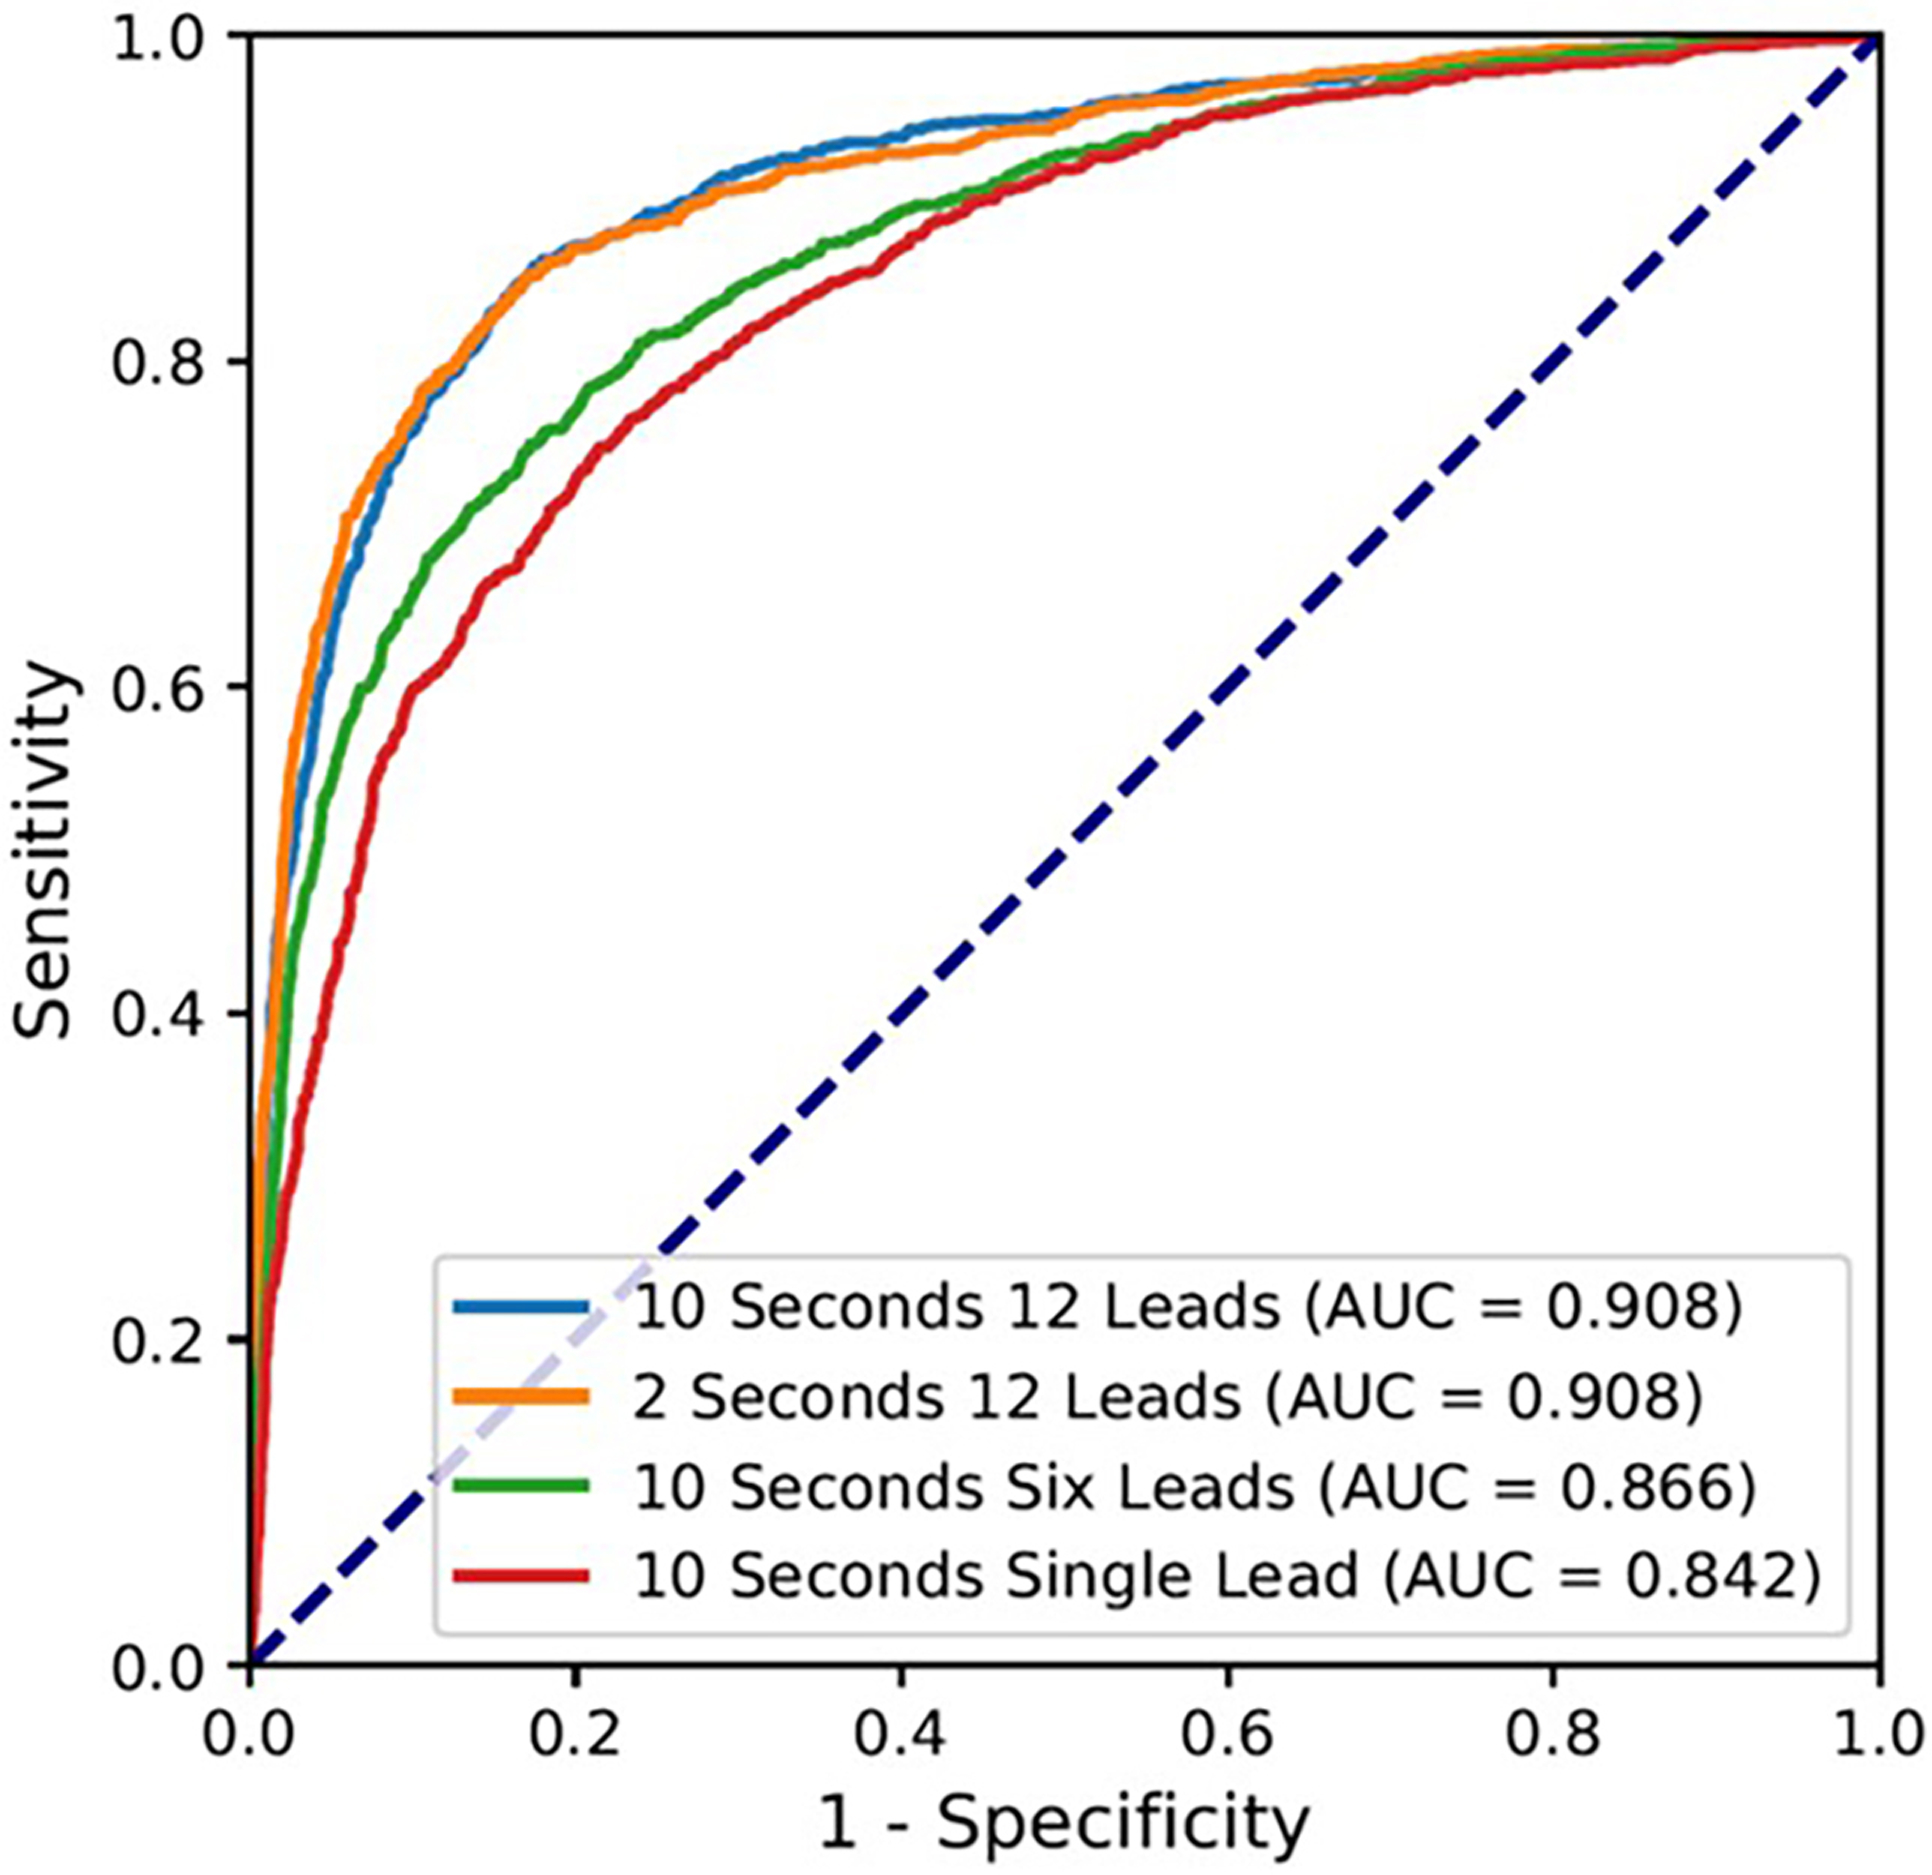
The receiver operating characteristic (ROC) curve for the model performance using 10 seconds of 12 leads, 2 seconds of 12 leads, 10 seconds of six limb leads (I, II, III, aVL, aVF, aVR), and 10 seconds of single lead (I).
Abbreviation: AUC = area under the curve
For the 1,015 patients with cirrhosis in the test set, we were able to match 921 (90.7%) patients in a 1:1 ratio to controls on 5 comorbid conditions of hypertension, diabetes mellitus, cardiovascular diseases, chronic kidney diseases, and chronic lung diseases (Table 2). In this matched subset of test set subjects, the ACE model’s performance did not significantly change, with an AUC of 0.893, 83.6% sensitivity and 81.8% specificity.
Table 2.
Distribution of comorbidities and ACE model performance in the test set before and after matching for comorbidities
| Before matching on comorbidities | After matching on comorbidities | |||||
|---|---|---|---|---|---|---|
| Comorbidities | Cirrhosis (N = 1,015) |
Controls (N = 4,052) |
p-value | Cirrhosis (N = 921) |
Controls (N = 921) |
p-value |
| Cardiovascular disease | 83 (8.2%) | 456 (11.3%) | <0.01 | 79 (8.6%) | 79 (8.6%) | 1.0 |
| Hypertension | 351 (34.6%) | 569 (14.0%) | <0.01 | 408 (44.3%) | 408 (44.3%) | 1.0 |
| Diabetes mellitus | 434 (42.8%) | 1589 (39.2%) | 0.04 | 278 (30.2%) | 278 (30.2%) | 1.0 |
| Chronic kidney disease | 192 (18.9%) | 651 (16.1%) | 0.03 | 192 (18.9%) | 192 (18.9%) | 1.0 |
| Chronic lung disease | 281 (27.7%) | 286 (7.1%) | <0.01 | 165 (17.9%) | 165 (17.9%) | 1.0 |
| Model Performances | Before matching on comorbidities | After matching on comorbidities | ||||
| AUC of the ACE model | 0.908 | 0.893 | ||||
| Sensitivity of the ACE model | 84.9% | 83.6% | ||||
| Specificity of the ACE model | 83.2% | 81.8% | ||||
Abbreviations: ACE = AI-Cirrhosis-ECG; AUC = area under the curve
Subgroup Analyses
Figure 3 shows the results of subgroup analyses on the test set according to age, sex, and medical comorbidities. The 95% confidence intervals for diagnostic odds ratios of all subgroups overlapped around the diagnostic odds ratio for the overall cohort, suggesting that the model performance was uniform regardless of subjects’ sex, age, or comorbidities. Among patients with different etiologies of liver disease, the model’s sensitivity was the highest in patients with NASH (92.4%) and consistently above 80% in patients with autoimmune, biliary, cryptogenic, viral, and other liver diseases. Notably, the sensitivity was lower for patients transplanted for hepatocellular carcinoma (73.6%).
Figure 3. Subgroup Analysis.
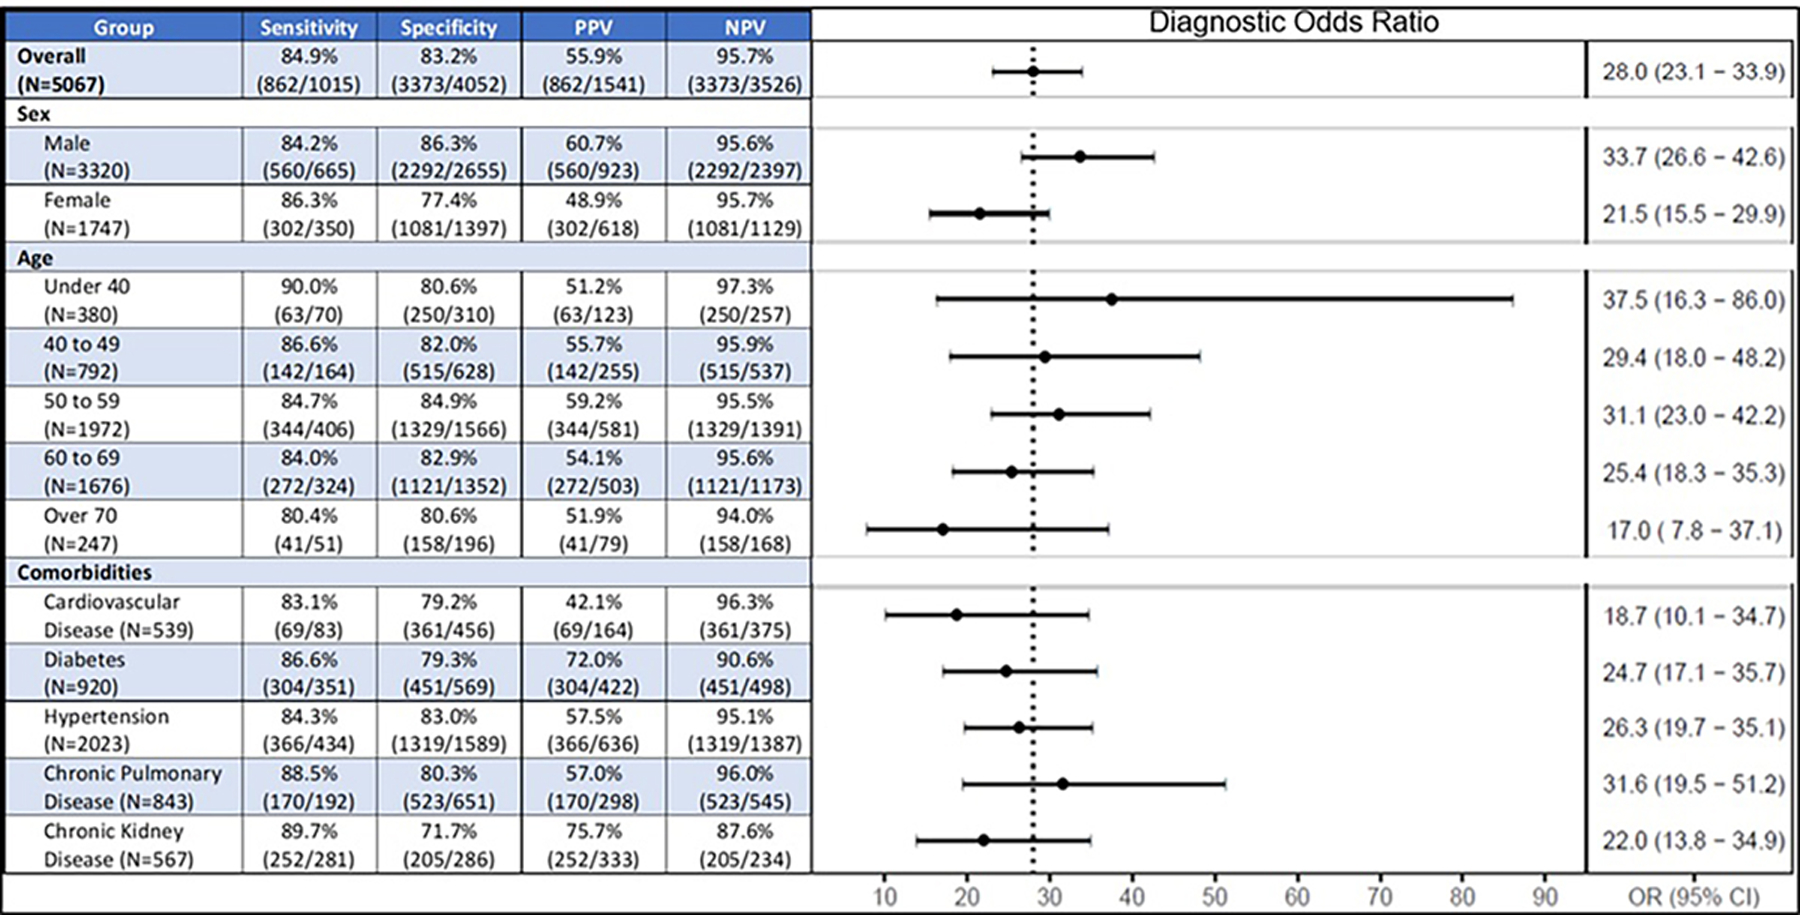
Abbreviations: OR = odds ratio; NPV = negative predictive value; PPV = positive predictive value
Relationship between ACE score and markers of liver disease severity
Figure 4a shows the distributions of test set patients’ ACE scores across groups of ascending MELD-Na. A clear trend of increasing ACE scores with increasing MELD-Na was observed for patients with MELD-Na less than or equal to 20. Starting at the lowest MELD-Na between 6 to 10, the median ACE scores were significantly higher compared to controls (0.225 vs. 0.016, p<0.001). Significant differences in ACE scores with rising MELD-Na groups of 6 to 10, 11 to 15, and 16 to 20 were found (median ACE: 0.225 vs. 0.519 vs. 0.713, p<0.001). A plateau in the ACE score was seen for MELD-Na above 20, with no significant differences in the high MELD-Na groups of 26 to 30, 31 to 35, 36 to 40, and above 40.
Figure 4. Relationship between ACE score and liver disease severity.
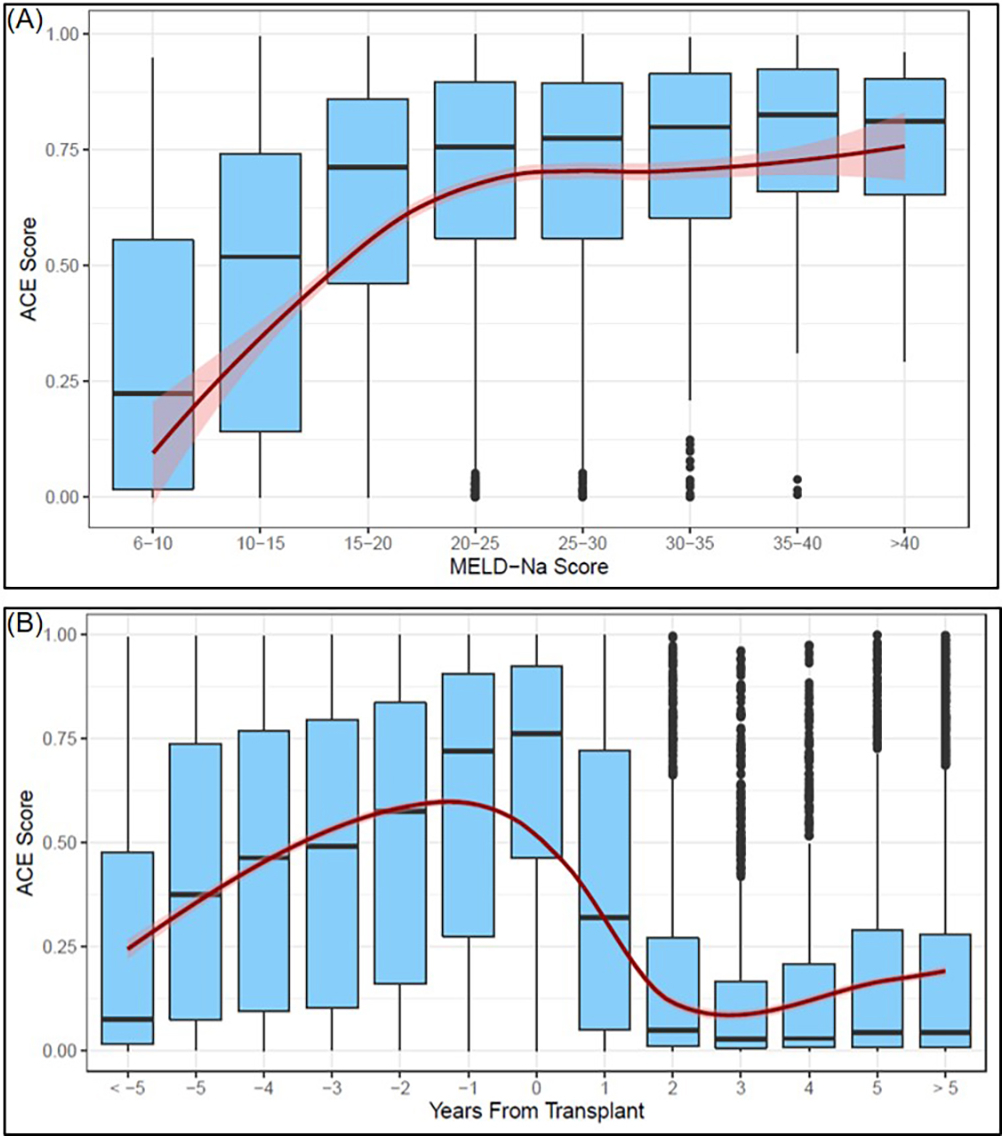
(A) Relationship between MELD-Na score and ACE score
(B) Longitudinal trends in ACE score before and after liver transplant. Negative numbers represent years prior to transplant, positive numbers represent years following transplant.
Assessing the Spearman’s correlation coefficient (ρ) between the ACE score and several laboratory test-based markers of liver disease severity showed that the ACE score positively correlated with MELD-Na (ρ = 0.3267, p<0.001), total bilirubin (ρ = 0.2976, p<0.001) and INR (ρ = 0.1120, p<0.001) (Table 3). On the other hand, an inverse correlation with platelet count (ρ = −0.2719, p<0.001) and serum sodium levels (ρ = −0.1757, p<0.001) was found.
Table 3.
Correlation between ACE score and laboratory-based markers of liver disease severity
| Variable | Spearman Correlation | P-Value |
|---|---|---|
| MELD-Na | 0.3267 | <0.001 |
| ALT | 0.0788 | 0.003 |
| AST | 0.0723 | 0.006 |
| Platelet count | −0.2719 | <0.001 |
| Creatinine | 0.0476 | 0.049 |
| Sodium | −0.1757 | <0.001 |
| Total bilirubin | 0.2976 | <0.001 |
| INR | 0.1120 | <0.001 |
Abbreviations: ALT = alanine aminotransferase; AST = aspartate aminotransferase; FIB-4 = fibrosis-4 score; INR = international normalized ratio; MELD-Na = model for end-stage liver disease score-sodium
Changes in ACE score before and after liver transplant
Figure 4b shows the longitudinal changes in the ACE scores for 547 patients with cirrhosis who had ECGs at multiple time points prior to and after LT. Significant increases in median ACE scores were observed year-over-year leading to the time of LT, starting around 0.079 more than five years pre-transplant and rising to 0.762 around the time of LT (p<0.001). Following LT, the median ACE score markedly dropped to 0.183 within a year and further dropped two years after LT, continuing to remain very low and comparable to the ACE scores for the control population. This trend remained consistent after controlling for medications commonly prescribed for complications of portal hypertension, such as nonselective beta-blockers, diuretics, and/or lactulose (Supplemental Figure 1).
ACE scores in asymptomatic patients with compensated cirrhosis
The CNN accurately classified most of the ECGs from the additional cohort of patients with compensated cirrhosis as having cirrhosis based on the established threshold of 0.17 from model development. The ACE scores for the compensated cirrhosis group (Supplemental Figure 2) were overall lower in comparison to the ACE scores of patients with decompensated disease, but also notably higher from non-cirrhosis controls.
Discussion
In this proof-of-concept study, an AI model utilizing a CNN was able to differentiate between ECGs from patients with and without cirrhosis with excellent accuracy. The model’s performance was maintained after matching for comorbidities including cardiovascular disease. The ACE score was also associated with liver disease severity as determined by the MELD-Na as well as individual laboratory markers. Furthermore, trends in the ACE score before and after LT reflected the progression and resolution of cirrhosis, and importantly did not appear related to post-transplant medication changes, including nonselective beta-blockers, diuretics, or lactulose. These results demonstrate that ECGs differ sufficiently between patients with and without cirrhosis to be discriminated by a CNN, and also that deep learning-based analyses of ECG signals offer promising potential as the basis of novel tools, such as the ACE score and its future iterations, in the care of patients with liver disease (Figure 5).
Figure 5.
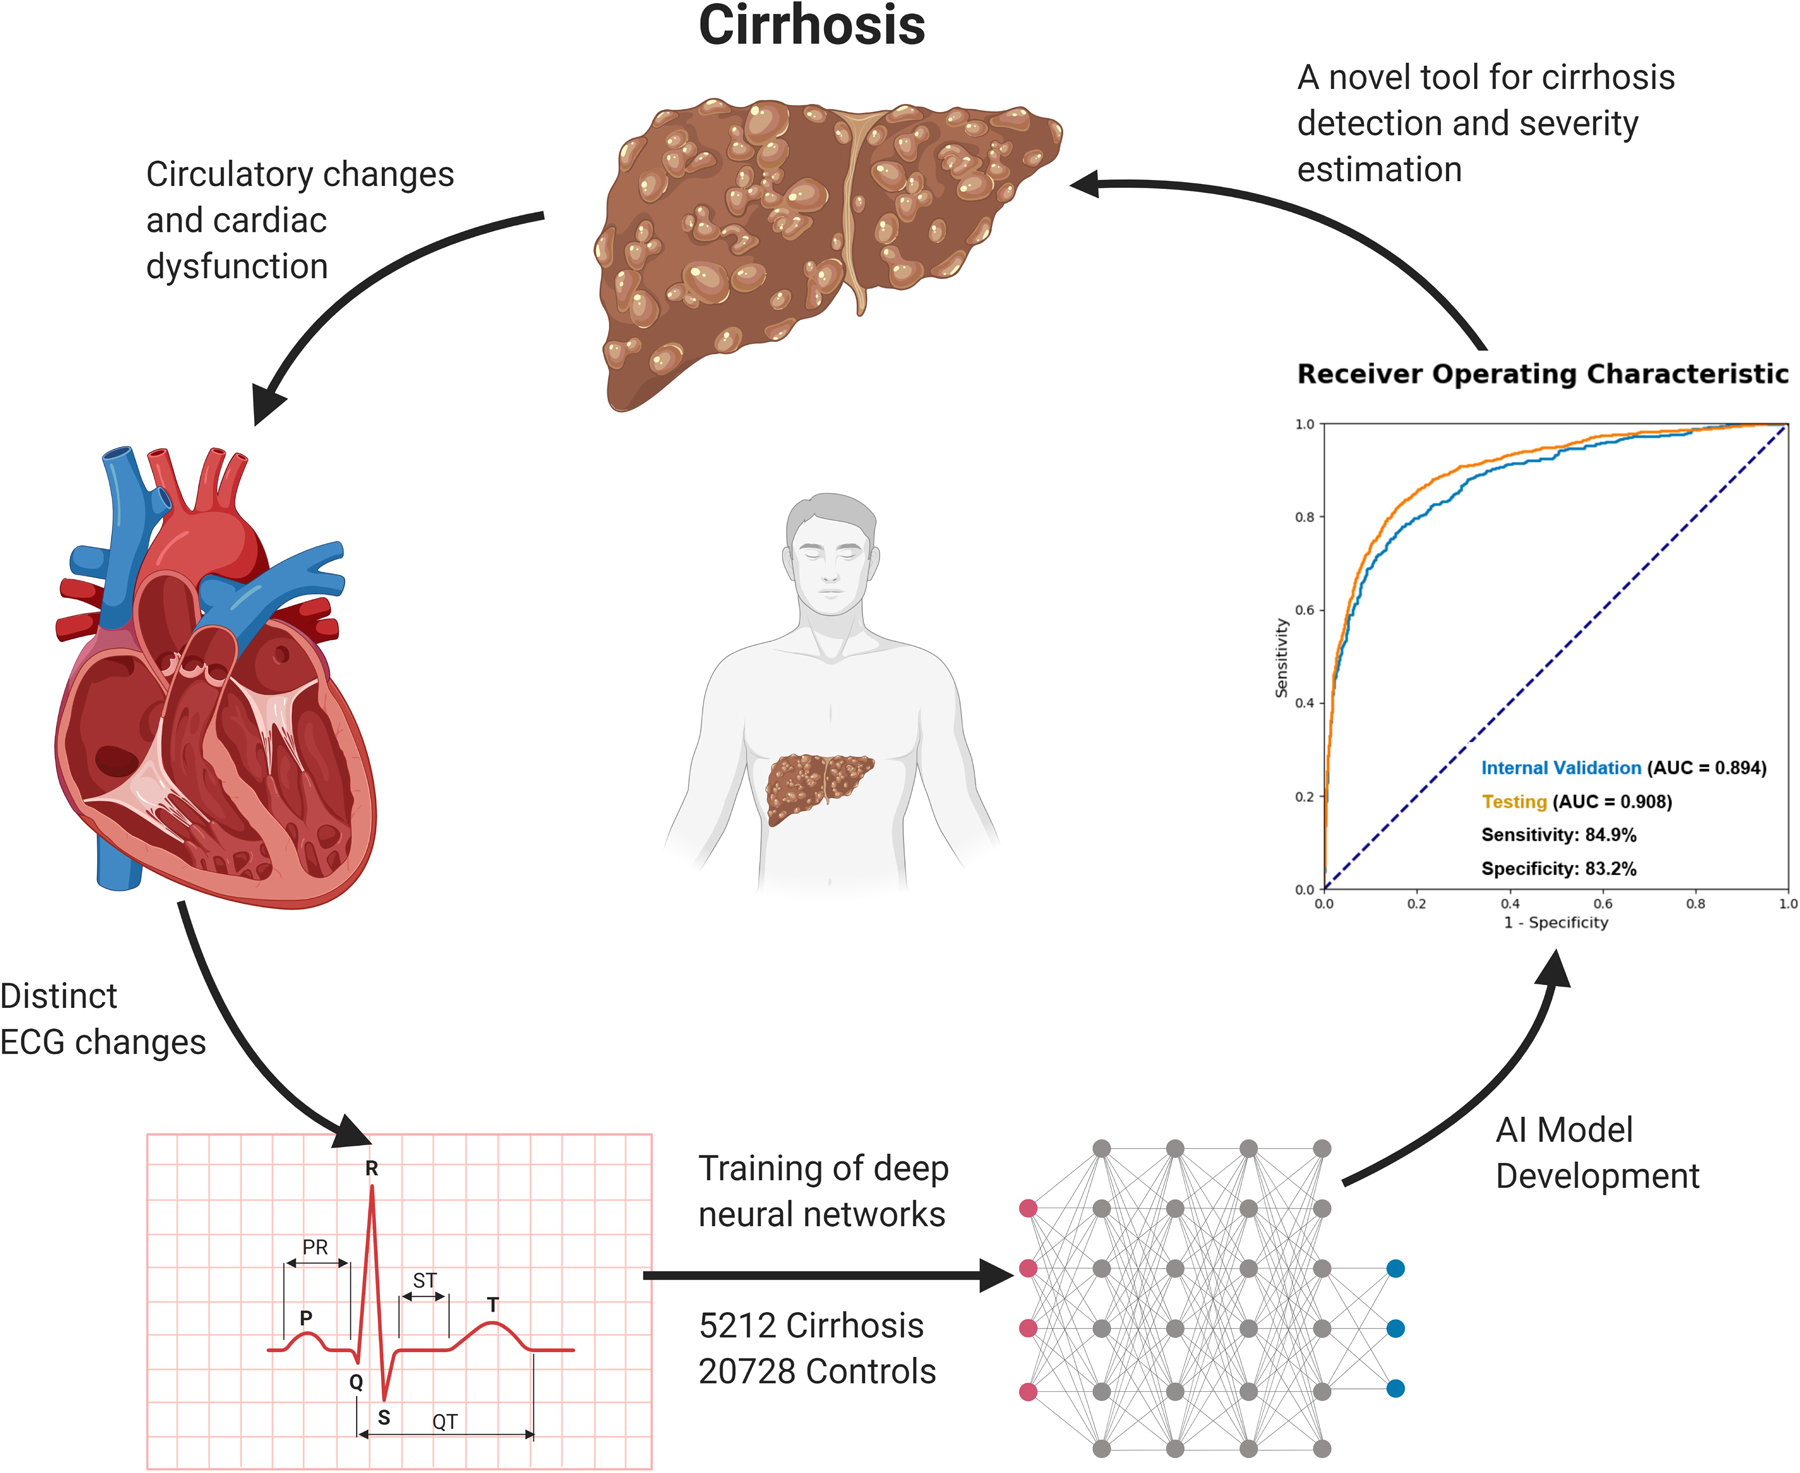
Conceptual Overview
Several mechanisms could play a role in the relationship between liver disease and ECG changes. Cirrhosis and the related development of portal hypertension are intricately linked to the circulatory system. Patients with cirrhosis develop a distinct type of cardiac dysfunction named cirrhotic cardiomyopathy independent of the etiology of liver disease.(6) In patients with portal hypertension, there is increased production and activity of vasodilators such as nitric oxide, carbon monoxide, and endogenous cannabinoids within the splanchnic vasculature. This pathological state is known to have decreased vascular reactivity to vasoconstrictors.(7) These agents may directly impact cardiac endothelium and myocytes, leading to subtle ECG changes. Additionally, these physiologic changes cause splanchnic vasodilation and a reduction in vascular resistance that leads to a compensatory hyperdynamic circulatory state characterized by an increased heart rate and cardiac output with low mean arterial pressure.(3) These secondary compensatory changes may further impact the ECG.
The circulatory changes and cardiac dysfunction seen in patients with cirrhosis are not mere observations, but critically related to clinical outcomes. The hyperdynamic circulatory dysfunction and abnormal activation of vasoconstrictor systems such as the renin-angiotensin-aldosterone system, sympathetic nervous system, and antidiuretic hormone axis lead to hypervolemia and ascites. Persistent activation of vasoconstrictors can escalate into renal vasoconstriction resulting in hepatorenal syndrome, a deadly condition with high mortality.(8) In 1988, Llach et al. identified mean arterial pressure and plasma norepinephrine as the best predictors of survival in patients with cirrhosis.(9) Studies suggest that cardiac dysfunction precedes hepatorenal syndrome and predicts poor survival in patients with cirrhosis.(10) Furthermore, patients with cirrhosis-related cardiovascular dysfunction are at increased risk of decompensation following transjugular intrahepatic portosystemic shunt insertion(11, 12) as well as poor outcomes following LT.(13, 14)
Several electrophysiological changes in the context of cirrhosis have been well studied. The most commonly reported ECG abnormality in cirrhosis is a prolonged QTc interval.(15) In patients with cirrhosis, the prevalence of prolonged QTc interval increased with worsening Child-Pugh scores (16) and significantly improved following LT.(17) Proposed mechanisms for prolonged QTc in cirrhosis include increased sympathetic activity,(18) molecular defects in the myocardial potassium(19) and calcium channels,(20) and increased levels of cardiotoxic substances due to portosystemic shunting.(21) Other studies found significantly lower QRS voltage in patients with cirrhosis and noted its association with presence of ascites.(22, 23) R-R interval variations, considered to represent the integrity of the cardiac vagal nervous system, were also found to be decreased in patients with cirrhosis, especially in parallel with the presence and degree of hepatic encephalopathy.(24, 25) In addition, short TpTe intervals (the time from the peak to the end of the T wave) were found to be associated with disease severity and predictive of death and/or LT.(26)
Despite the well-known electrophysiologic effects of cirrhosis, the ECG findings are generally non-specific, often subtle, and highly variable, and as such have not been incorporated into routine evaluation and management of patients with cirrhosis. This is the first study to apply state-of-the-art deep learning-based AI methodologies to demonstrate the presence of a strong cirrhosis-associated ECG signal and quantify the signal in a manner that correlates with liver disease severity. The CNN is not constrained by the commonly known intervals and waves, but instead analyzes thousands of ECG waveforms to simultaneously process multiple, nonlinear, subtle patterns and combinations of features. The feasibility of this strategy is supported by several published studies which successfully demonstrate the ability of AI-ECG models to predict a variety of cardiac and non-cardiac conditions including left ventricular dysfunction,(27) hypertrophic cardiomyopathy,(28) paroxysmal atrial fibrillation,(29) as well as hyperkalemia,(30) sex and age.(31) Another strength of such a model is that ECGs are already used worldwide as one of the most ordered medical tests. Discovery of a new role for such an inexpensive, standardized, and ubiquitous test makes wide implementation feasible. Additionally, the fact that our model was able to achieve an excellent classification performance even with a single lead (lead I) is promising for its incorporation in app-based wearable devices.
The main limitation of this study is the “black-box” nature of neural networks, meaning that the specific ECG characteristics that the CNN uses to detect cirrhosis are not known. The fact that the model’s performance did not change between 10 seconds vs. 2 seconds of the 12-lead ECGs suggests that it is not relying on time-dependent patterns such as heart rate but instead on waveform morphology. Moreover, the remarkable improvement in patients’ ACE score after LT suggests that the CNN is capturing predominantly functional aspects rather than more ingrained structural derangements of the electrophysiological system. As mentioned above, there are numerous functional changes in the autonomic nervous system, myocardial ion channels, and levels of cardiotoxic substances which may resolve with restoration of normal hepatic function. Although higher ACE scores were associated with laboratory markers of liver disease severity, the retrospective nature and large cohort size precluded an accurate assessment of the relationship between ACE and clinical manifestations of advanced portal hypertension. The association of the ACE score with the presence of ascites, hepatic encephalopathy, pulmonary vascular disease, and frailty will be important to elucidate in further studies.
Another potential limitation is external generalizability. The cirrhosis and control cohorts used to develop our CNN were highly diverse, as they were obtained from three Mayo Clinic sites across the United States. Nevertheless, the three sites are highly specialized tertiary referral centers whose patient population may differ from those seen in rural/community settings. Concerns have been raised that AI algorithms developed at university hospitals tend to over-represent individuals with higher income, younger age, and white race and may not be as effective when applied to a community hospital serving a low-income, minority patient population.(32) A prospective implementation at different sites with continuous refining of the model using new data will be essential for long-term viability.
We acknowledge that there are several important steps to be taken before the ACE score can be applied to the clinical care of patients with cirrhosis. For diagnostic purposes, its performance will need to be tested among a large cohort of patients with asymptomatic, early-stage cirrhosis and compared against existing tools such as the FIB-4 index or transient elastography. For prognostic purposes, the ACE score’s ability to predict liver-related outcomes will need to be evaluated against or in combination with existing prognostic tools such as the MELD-Na score.
Conclusion
Application of AI in the form of deep convolutional neural network to analyze a standard 12-lead ECG enables it to distinguish cirrhosis-related signals from others. Although rigorous refinement and validation in external, heterogeneous cohorts in a prospective manner is needed, this represents a unique discovery with promising potential as the basis for novel ECG-enabled tools and applications in the care of patients with liver disease.
Supplementary Material
Study Highlights.
WHAT IS KNOWN
Cirrhosis is associated with cardiac dysfunction and distinct electrophysiologic changes seen on ECGs.
Deep learning-based artificial intelligence (AI) models have enabled automated detection of several cardiac and non-cardiac conditions on ECGs.
WHAT IS NEW HERE
The AI-Cirrhosis-ECG (ACE) score, a deep learning model trained on thousands of ECGs from patients with cirrhosis and age and sex-matched controls, was able to accurately discriminate ECGs from the two patient cohorts.
The magnitude of the ACE score was significantly associated with liver disease severity over time mirroring the disease progression up until liver transplantation and the expected resolution afterwards.
Acknowledgments
Conflict of Interest Statement:
Dr. Simonetto and Dr. Shah’s research are funded by National Institute of Health U01AA026886-03.
List of Abbreviations
- ACE
AI-Cirrhosis-ECG
- AI
artificial intelligence
- AUC
area under the curve
- CNN
convolutional neural network
- ECG
electrocardiogram
- EHR
electronic health records
- HBV
hepatitis B virus
- HCV
hepatitis C virus
- LT
liver transplantation
- MELD
model for end-stage liver disease score
- MELD-Na
model for end-stage liver disease – sodium score
- NASH
non-alcoholic steatohepatitis
- NPV
negative predictive value
- PPV
positive predictive value
- ROC
receiver-operating characteristic
Footnotes
No other potential conflicts of interest relevant to this article exist.
Article Guarantor: Douglas A. Simonetto, MD
References
- 1.Asrani SK, Devarbhavi H, Eaton J, et al. Burden of liver diseases in the world. Journal of Hepatology 2019;70:151–171. [DOI] [PubMed] [Google Scholar]
- 2.Asrani SK, Larson JJ, Yawn B, et al. Underestimation of liver-related mortality in the United States. Gastroenterology 2013;145:375–382.e2. [DOI] [PMC free article] [PubMed] [Google Scholar]
- 3.Møller S, Henriksen JH. Cardiovascular complications of cirrhosis. Gut 2008;57:268–78. [DOI] [PubMed] [Google Scholar]
- 4.Kim WR, Biggins SW, Kremers WK, et al. Hyponatremia and mortality among patients on the liver-transplant waiting list. N Engl J Med 2008;359:1018–26. [DOI] [PMC free article] [PubMed] [Google Scholar]
- 5.Abshagen K, Kuhla A, Genz B, et al. Anatomy and Physiology of the Hepatic Circulation. In: Lanzer P, editor. PanVascular Medicine. Berlin, Heidelberg: Springer Berlin Heidelberg; 2015. p. 3607–3629. [Google Scholar]
- 6.Møller S, Lee SS. Cirrhotic cardiomyopathy. Journal of Hepatology 2018;69:958–960. [DOI] [PubMed] [Google Scholar]
- 7.Solà E, Ginès P. Renal and circulatory dysfunction in cirrhosis: current management and future perspectives. J Hepatol 2010;53:1135–45. [DOI] [PubMed] [Google Scholar]
- 8.Schrier RW, Arroyo V, Bernardi M, et al. Peripheral arterial vasodilation hypothesis: a proposal for the initiation of renal sodium and water retention in cirrhosis. Hepatology 1988;8:1151–7. [DOI] [PubMed] [Google Scholar]
- 9.Llach J, Ginès P, Arroyo V, et al. Prognostic value of arterial pressure, endogenous vasoactive systems, and renal function in cirrhotic patients admitted to the hospital for the treatment of ascites. Gastroenterology 1988;94:482–7. [DOI] [PubMed] [Google Scholar]
- 10.Ruiz-del-Arbol L, Monescillo A, Arocena C, et al. Circulatory function and hepatorenal syndrome in cirrhosis. Hepatology 2005;42:439–47. [DOI] [PubMed] [Google Scholar]
- 11.Cazzaniga M, Salerno F, Pagnozzi G, et al. Diastolic dysfunction is associated with poor survival in patients with cirrhosis with transjugular intrahepatic portosystemic shunt. Gut 2007;56:869–875. [DOI] [PMC free article] [PubMed] [Google Scholar]
- 12.Jansen C, Schröder A, Schueler R, et al. Left Ventricular Longitudinal Contractility Predicts Acute-on-Chronic Liver Failure Development and Mortality After Transjugular Intrahepatic Portosystemic Shunt. Hepatology Communications 2019;3:340–347. [DOI] [PMC free article] [PubMed] [Google Scholar]
- 13.Fouad TR, Abdel-Razek WM, Burak KW, et al. Prediction of cardiac complications after liver transplantation. Transplantation 2009;87:763–70. [DOI] [PubMed] [Google Scholar]
- 14.Izzy M, Oh J, Watt KD. Cirrhotic Cardiomyopathy After Transplantation: Neither the Transient Nor Innocent Bystander. Hepatology 2018;68:2008–2015. [DOI] [PubMed] [Google Scholar]
- 15.Day CP, James OF, Butler TJ, et al. QT prolongation and sudden cardiac death in patients with alcoholic liver disease. Lancet 1993;341:1423–8. [DOI] [PubMed] [Google Scholar]
- 16.Bernardi M, Calandra S, Colantoni A, et al. Q-T interval prolongation in cirrhosis: prevalence, relationship with severity, and etiology of the disease and possible pathogenetic factors. Hepatology 1998;27:28–34. [DOI] [PubMed] [Google Scholar]
- 17.Bal JS, Thuluvath PJ. Prolongation of QTc interval: relationship with etiology and severity of liver disease, mortality and liver transplantation. Liver Int 2003;23:243–8. [DOI] [PubMed] [Google Scholar]
- 18.Trevisani F, Sica G, Mainquà P, et al. Autonomic dysfunction and hyperdynamic circulation in cirrhosis with ascites. Hepatology 1999;30:1387–1392. [DOI] [PubMed] [Google Scholar]
- 19.Ward CA, Ma Z, Lee SS, et al. Potassium currents in atrial and ventricular myocytes from a rat model of cirrhosis. Am J Physiol 1997;273:G537–44. [DOI] [PubMed] [Google Scholar]
- 20.Ward CA, Liu H, Lee SS. Altered cellular calcium regulatory systems in a rat model of cirrhotic cardiomyopathy. Gastroenterology 2001;121:1209–18. [DOI] [PubMed] [Google Scholar]
- 21.Bernardi M, Maggioli C, Dibra V, et al. QT interval prolongation in liver cirrhosis: innocent bystander or serious threat? Expert Review of Gastroenterology & Hepatology 2012;6:57–66. [DOI] [PubMed] [Google Scholar]
- 22.Cichoż-Lach H, Tomaszewski M, Kowalik A, et al. QT Interval Prolongation and QRS Voltage Reduction in Patients with Liver Cirrhosis. Adv Clin Exp Med 2015;24:615–22. [DOI] [PubMed] [Google Scholar]
- 23.Pourafkari L, Ghaffari S, Nazeri L, et al. Electrocardiographic findings in hepatic cirrhosis and their association with the severity of disease. Cor et Vasa 2017;59:e105–e113. [Google Scholar]
- 24.Isobe H, Sakai H, Sakamoto S, et al. Decreased variation of electrocardiographic R-R interval in patients with liver cirrhosis. J Gastroenterol Hepatol 1994;9:232–5. [DOI] [PubMed] [Google Scholar]
- 25.Mani AR, Montagnese S, Jackson CD, et al. Decreased heart rate variability in patients with cirrhosis relates to the presence and degree of hepatic encephalopathy. Am J Physiol Gastrointest Liver Physiol 2009;296:G330–8. [DOI] [PMC free article] [PubMed] [Google Scholar]
- 26.Salgado AA, Barbosa PRB, Ferreira AG, et al. Prognostic Value of a New Marker of Ventricular Repolarization in Cirrhotic Patients. Arquivos brasileiros de cardiologia 2016;107:523–531. [DOI] [PMC free article] [PubMed] [Google Scholar]
- 27.Attia ZI, Kapa S, Lopez-Jimenez F, et al. Screening for cardiac contractile dysfunction using an artificial intelligence–enabled electrocardiogram. Nature Medicine 2019;25:70–74. [DOI] [PubMed] [Google Scholar]
- 28.Ko WY, Siontis KC, Attia ZI, et al. Detection of Hypertrophic Cardiomyopathy Using a Convolutional Neural Network-Enabled Electrocardiogram. J Am Coll Cardiol 2020;75:722–733. [DOI] [PubMed] [Google Scholar]
- 29.Attia ZI, Noseworthy PA, Lopez-Jimenez F, et al. An artificial intelligence-enabled ECG algorithm for the identification of patients with atrial fibrillation during sinus rhythm: a retrospective analysis of outcome prediction. Lancet 2019;394:861–867. [DOI] [PubMed] [Google Scholar]
- 30.Galloway CD, Valys AV, Shreibati JB, et al. Development and Validation of a Deep-Learning Model to Screen for Hyperkalemia From the Electrocardiogram. JAMA Cardiol 2019;4:428–436. [DOI] [PMC free article] [PubMed] [Google Scholar]
- 31.Attia ZI, Friedman PA, Noseworthy PA, et al. Age and Sex Estimation Using Artificial Intelligence From Standard 12-Lead ECGs. Circ Arrhythm Electrophysiol 2019;12:e007284. [DOI] [PMC free article] [PubMed] [Google Scholar]
- 32.Gianfrancesco MA, Tamang S, Yazdany J, et al. Potential Biases in Machine Learning Algorithms Using Electronic Health Record Data. JAMA internal medicine 2018;178:1544–1547. [DOI] [PMC free article] [PubMed] [Google Scholar]
Associated Data
This section collects any data citations, data availability statements, or supplementary materials included in this article.


