

Abstract
Telomeres are the physical ends of linear chromosomes, composed of short repeating sequences (e.g. TTGGGG in Tetrahymena for the G-strand) of double-stranded DNA with a single-strand 3’-overhang of the G-strand and, in humans, a group of six proteins called shelterin1,2. Among these, TPP1 and POT1 associate with the 3’-overhang, with POT1 binding the G-strand3 and TPP1 (in complex with TIN24) recruiting telomerase via interaction with telomerase reverse transcriptase (TERT)5. The telomere DNA ends are replicated and maintained by telomerase6, for the G-strand, and subsequently DNA Polymerase α-Primase7,8 (PolαPrim), for the C-strand9. PolαPrim activity is stimulated by CTC1–STN1–TEN1 (CST)10–12, but the structural basis of PolαPrim and CST recruitment to telomere ends remains unknown. Here we report cryo-EM structures of Tetrahymena CST in the context of telomerase holoenzyme, both in the absence and presence of PolαPrim, and of PolαPrim alone. Tetrahymena Ctc1 binds telomerase subunit p50, a TPP1 ortholog, on a flexible Ctc1 binding motif unveiled jointly by cryo-EM and NMR spectroscopy. PolαPrim polymerase subunit POLA1 binds Ctc1 and Stn1, and its interface with Ctc1 forms an entry port for G-strand DNA to the POLA1 active site. Together, we obtained a snapshot of four key players required for telomeric DNA synthesis in a single active complex—telomerase core ribonucleoprotein (RNP), p50/TPP1, CST and PolαPrim—that provides unprecedented insights into CST and PolαPrim recruitment and handoff between G-strand and C-strand synthesis.
Synthesis of the G-strand at the ends of telomeres by telomerase is terminated by the heterotrimeric complex CST12,13. Human CST (hCST) is essential for maintaining the telomere C-strand and also plays a role in overcoming genome-wide replication stress10,14,15. Like the shelterin proteins and telomerase, mutations in hCST lead to telomere biology disorders16 including Coats Plus and dyskeratosis congenita17. CST small subunits STN1 and TEN1 are structurally homologous to those in replication protein A (RPA)18, a single-stranded DNA binding protein involved in all aspects of DNA replication and repair, while the large subunit Ctc1(Tetrahymena)/CTC1(vertebrate)/Cdc13(yeast) is more diverse19–23. Structural and biochemical studies of CST proteins have suggested various stoichiometries, oligomerization states, and functions of subunits19,20,23. The only structure of complete CST19, from human, revealed a decameric architecture of heterotrimers in the presence of single-stranded telomeric (G-strand) DNA (sstDNA). In vertebrates, CST is proposed to inhibit telomerase activity by physical interaction with shelterin proteins TPP1 or POT1 at telomere ends12,24,25 and G-strand sequestration12,13, and it promotes C-strand fill-in by association with PolαPrim26–29, but structures of these interactions in any organism are lacking. PolαPrim is an unusual polymerase containing both primase and DNA polymerase subunits; the primase synthesizes an RNA primer on a DNA template and then hands off the duplex to the polymerase that initiates synthesis of a short DNA duplex7,8. PolαPrim initiates both the leading and lagging strand synthesis in eukaryotes8, and in association with CST has functions in genome-wide DNA repair15 in addition to its role in C-strand synthesis at telomere ends.
Tetrahymena telomerase holoenzyme comprises, in addition to its RNP catalytic core of TERT, telomerase RNA (TER) that provides the template for G-strand telomere repeat synthesis, and LARP7 assembly protein p65, several proteins that are orthologous to human proteins that only transiently associate with telomerase at telomeres30. These include p50, the structural and functional equivalent of TPP1 that recruits and activates telomerase22,31–33; Teb1, a subunit of a trimeric RPA related complex TEB22,34, that binds the sstDNA35 and together with p50 increases activity and processivity like its ortholog POT136–38; and another trimeric RPA related complex p75–p45–p19 that has been identified as Tetrahymena Ctc1–Stn1–Ten1 (TtCST)22,23. The constitutive association of these proteins with telomerase catalytic core makes Tetrahymena telomerase an ideal model system for elucidating details of the protein structures and interactions that regulate G-strand and C-strand synthesis22,39,40. Structural and functional studies of Tetrahymena telomerase and PolαPrim described here show how monomeric TtCST binds p50/TPP1 and PolαPrim on different interfaces to coordinate G-strand termination and C-strand fill-in synthesis, and suggest commonalities with interactions at human telomeres.
Structure of Tetrahymena telomerase CST
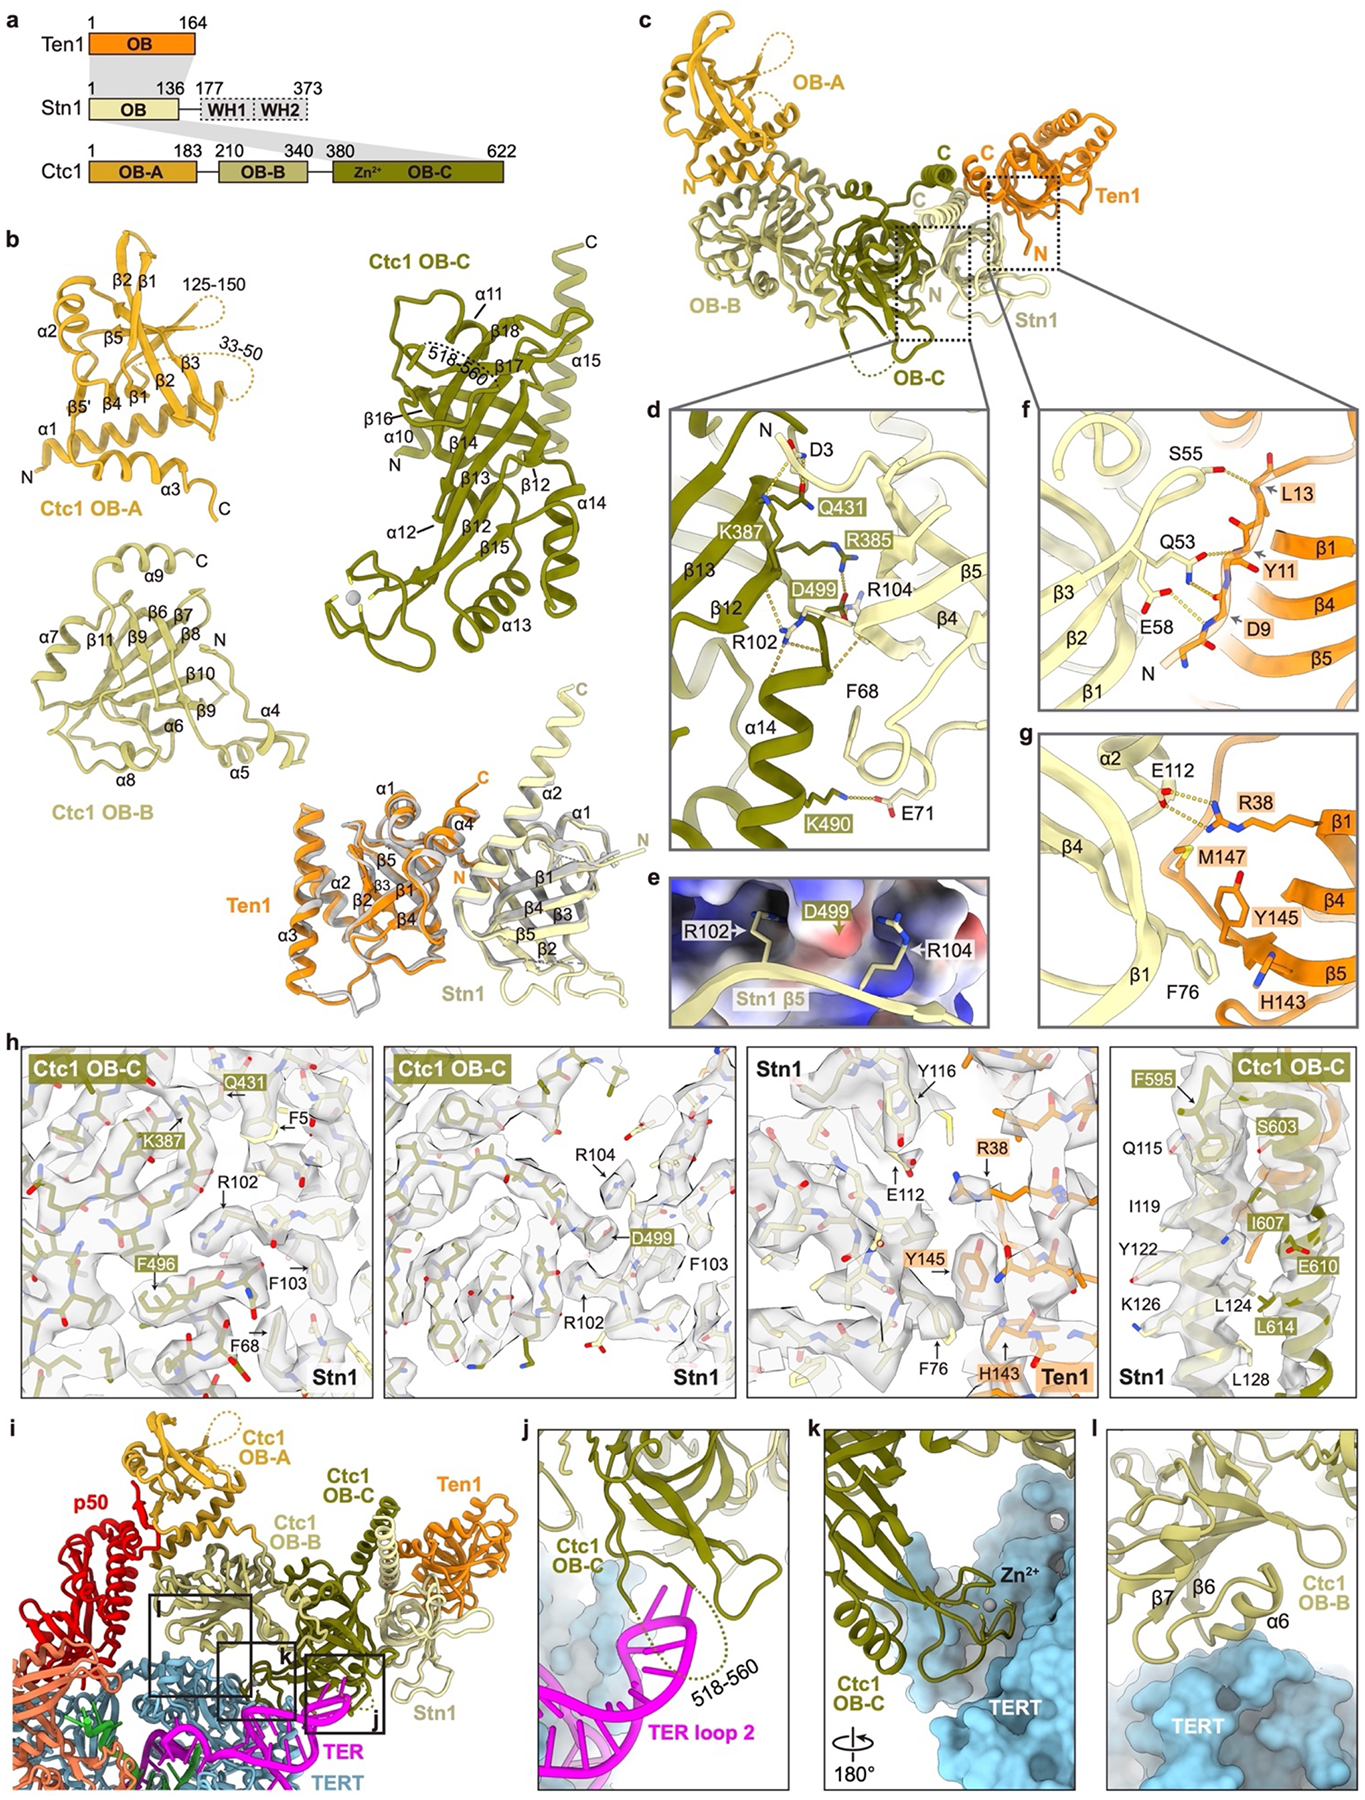
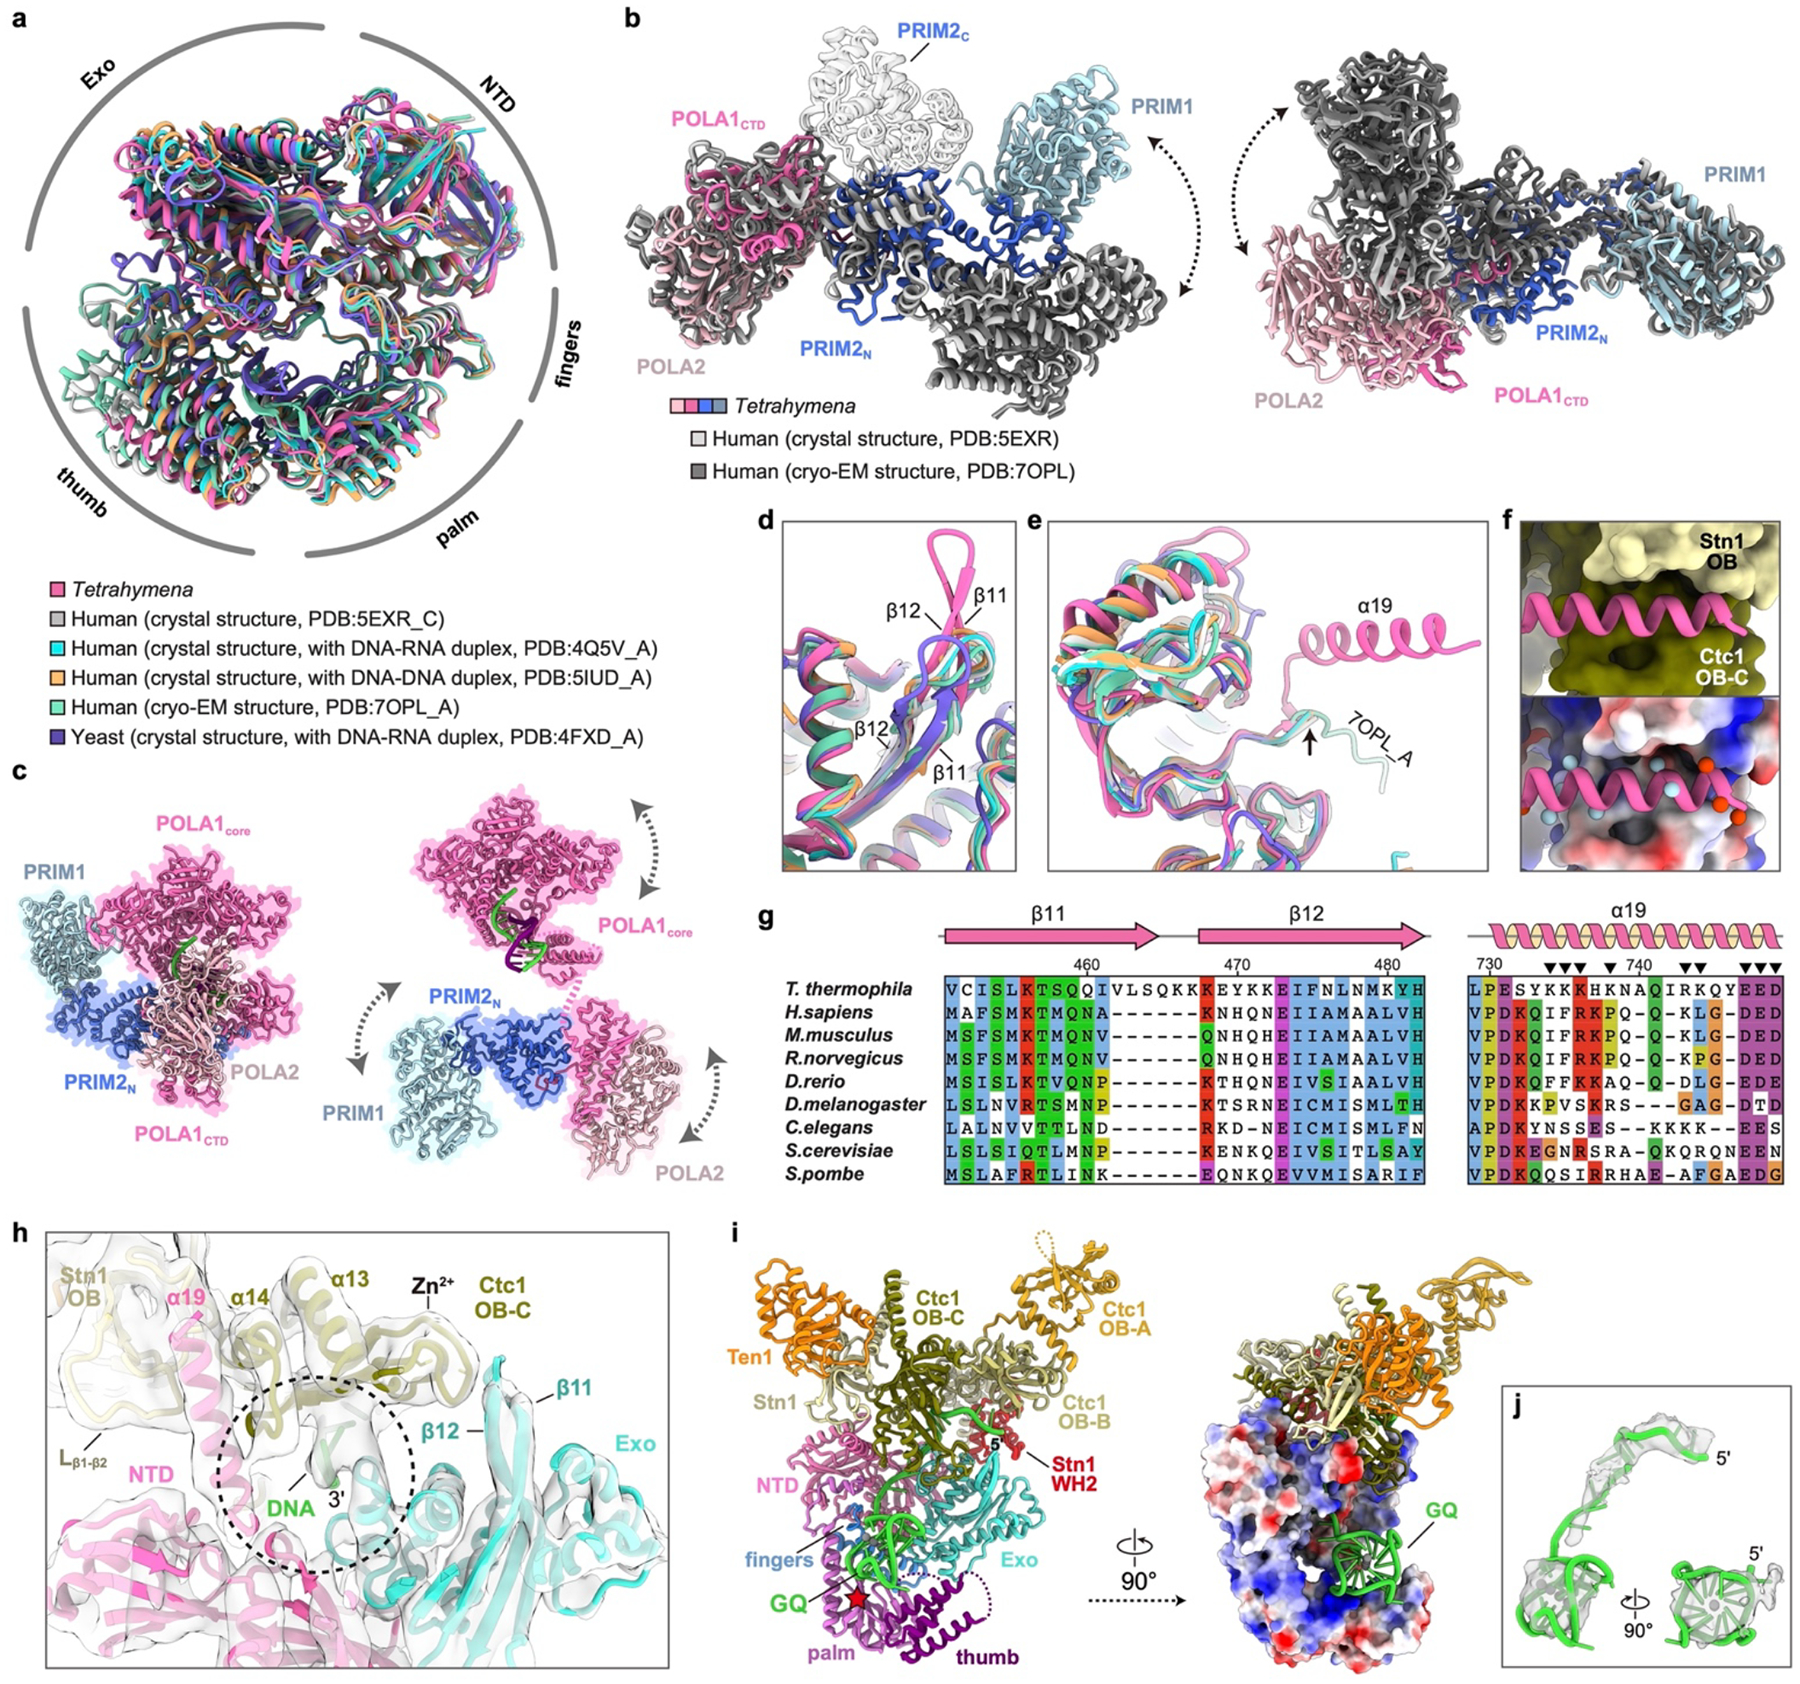
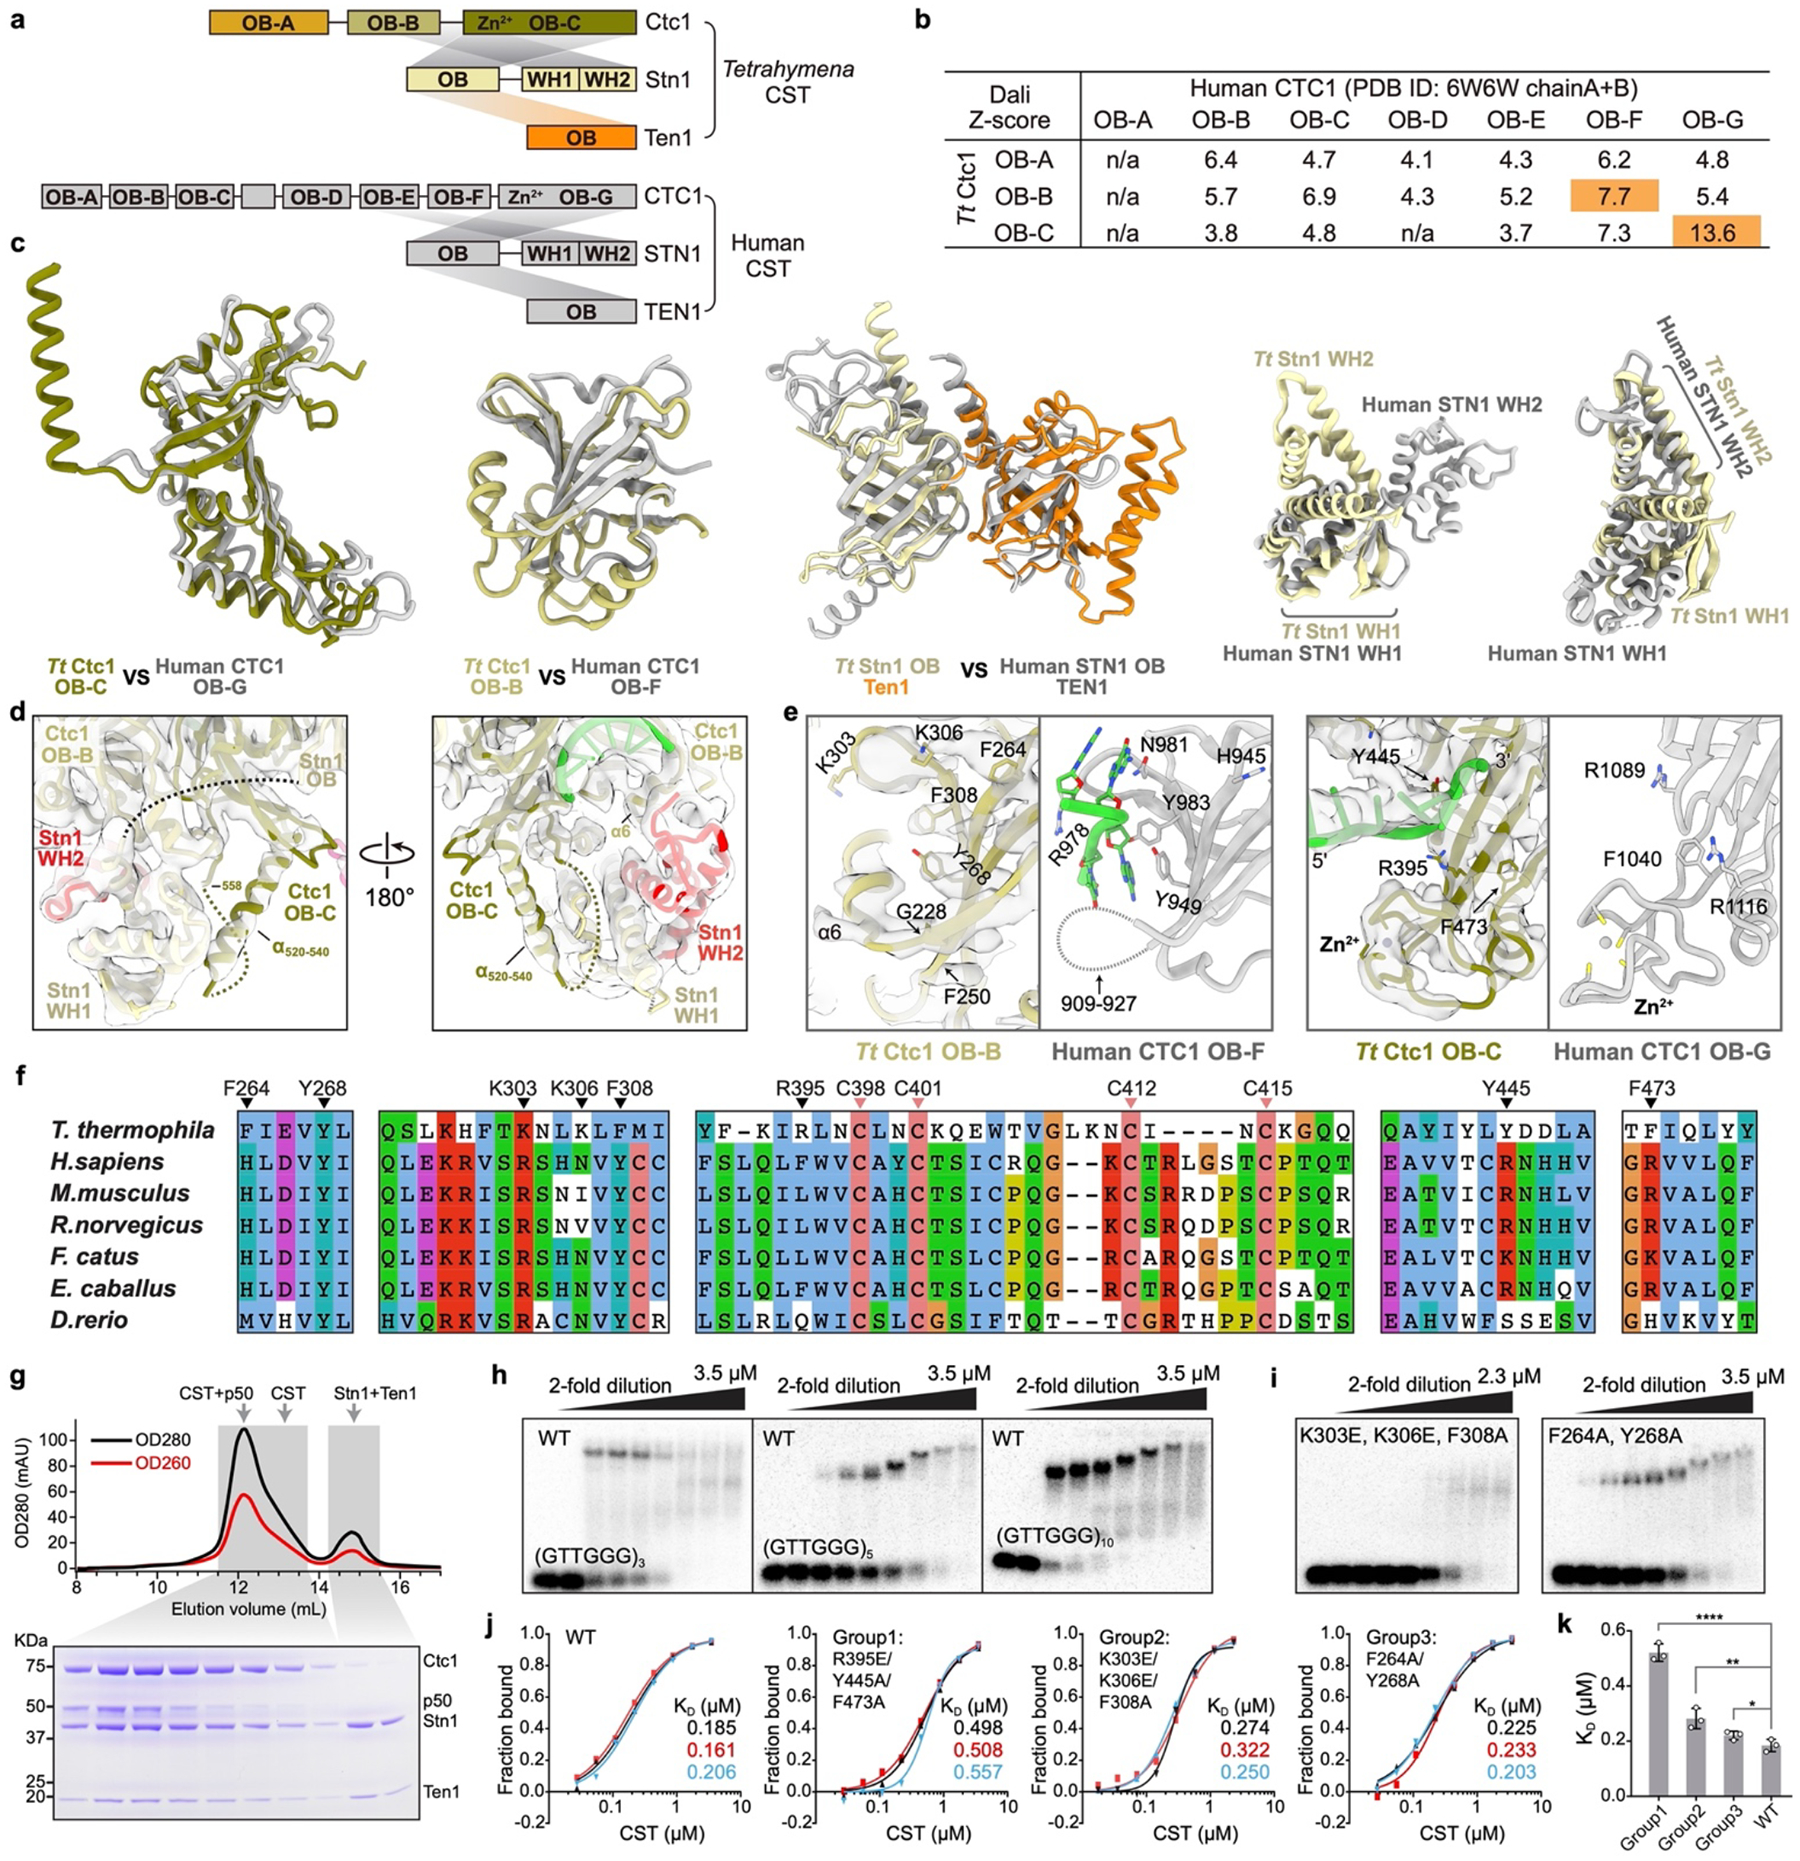
While cryo-EM studies of Tetrahymena telomerase have provided high-resolution structures of the RNP catalytic core, TEB heterotrimer, and p50 OB40, the dynamic positioning of TtCST has limited its structure modeling to date. Here, we combined three previously reported datasets of Tetrahymena telomerase bound to sstDNA40 and conducted focused classification on TtCST followed by refinement of the holoenzyme to obtain a reconstruction with an overall resolution of 3.5 Å (Fig. 1a, Extended Data Fig. 1, Extended Data Table 1). For the model of TtCST, Stn1–Ten1 crystal structures22,23 were rigid body fit into the density and manually refined with little change, and Ctc1 was built de novo (Fig. 1b, Extended Data Fig. 2). Modeling of the N-terminal domain of Ctc1, which has lower resolution (Extended Data Fig. 1c), was facilitated by using information derived from NMR data on secondary structure elements and inter-β-strand NOEs (see Methods) (Extended Data Fig. 3). Ctc1, whose domain structure was not previously established, comprises three OBs (OB-A, -B, and -C) connected by structured linkers that stabilize the rigid pairwise interactions between the domains (Fig. 1c, d). Ctc1 OB-C has a C-shaped cleft and Zn-ribbon motif (Fig. 1c) typical of the C-terminal OB of the large subunit of RPA18 and related complexes, including mammalian CTC119, POT137,38, and TtTeb135,40. Ctc1 OB-C forms a heterotrimer with Stn1 and Ten1 OB that is stabilized by an intermolecular three-helix bundle (Fig. 1c, e) and by Ten1–Stn1 and Stn1–Ctc1 OB interactions (Extended Data Fig. 2c–h). The tandem winged helix-turn-helix (WH-WH) domain of Stn1 is connected to OB by a flexible linker and is not visible in the cryo-EM map, consistent with its multi-positioning shown by negative-stain EM22. Overall, this structure of monomeric TtCST strongly suggests its origin from RPA and establishes the domain structure of the least conserved subunit Ctc1.
Fig. 1: Cryo-EM structure of TtCST in telomerase holoenzyme.
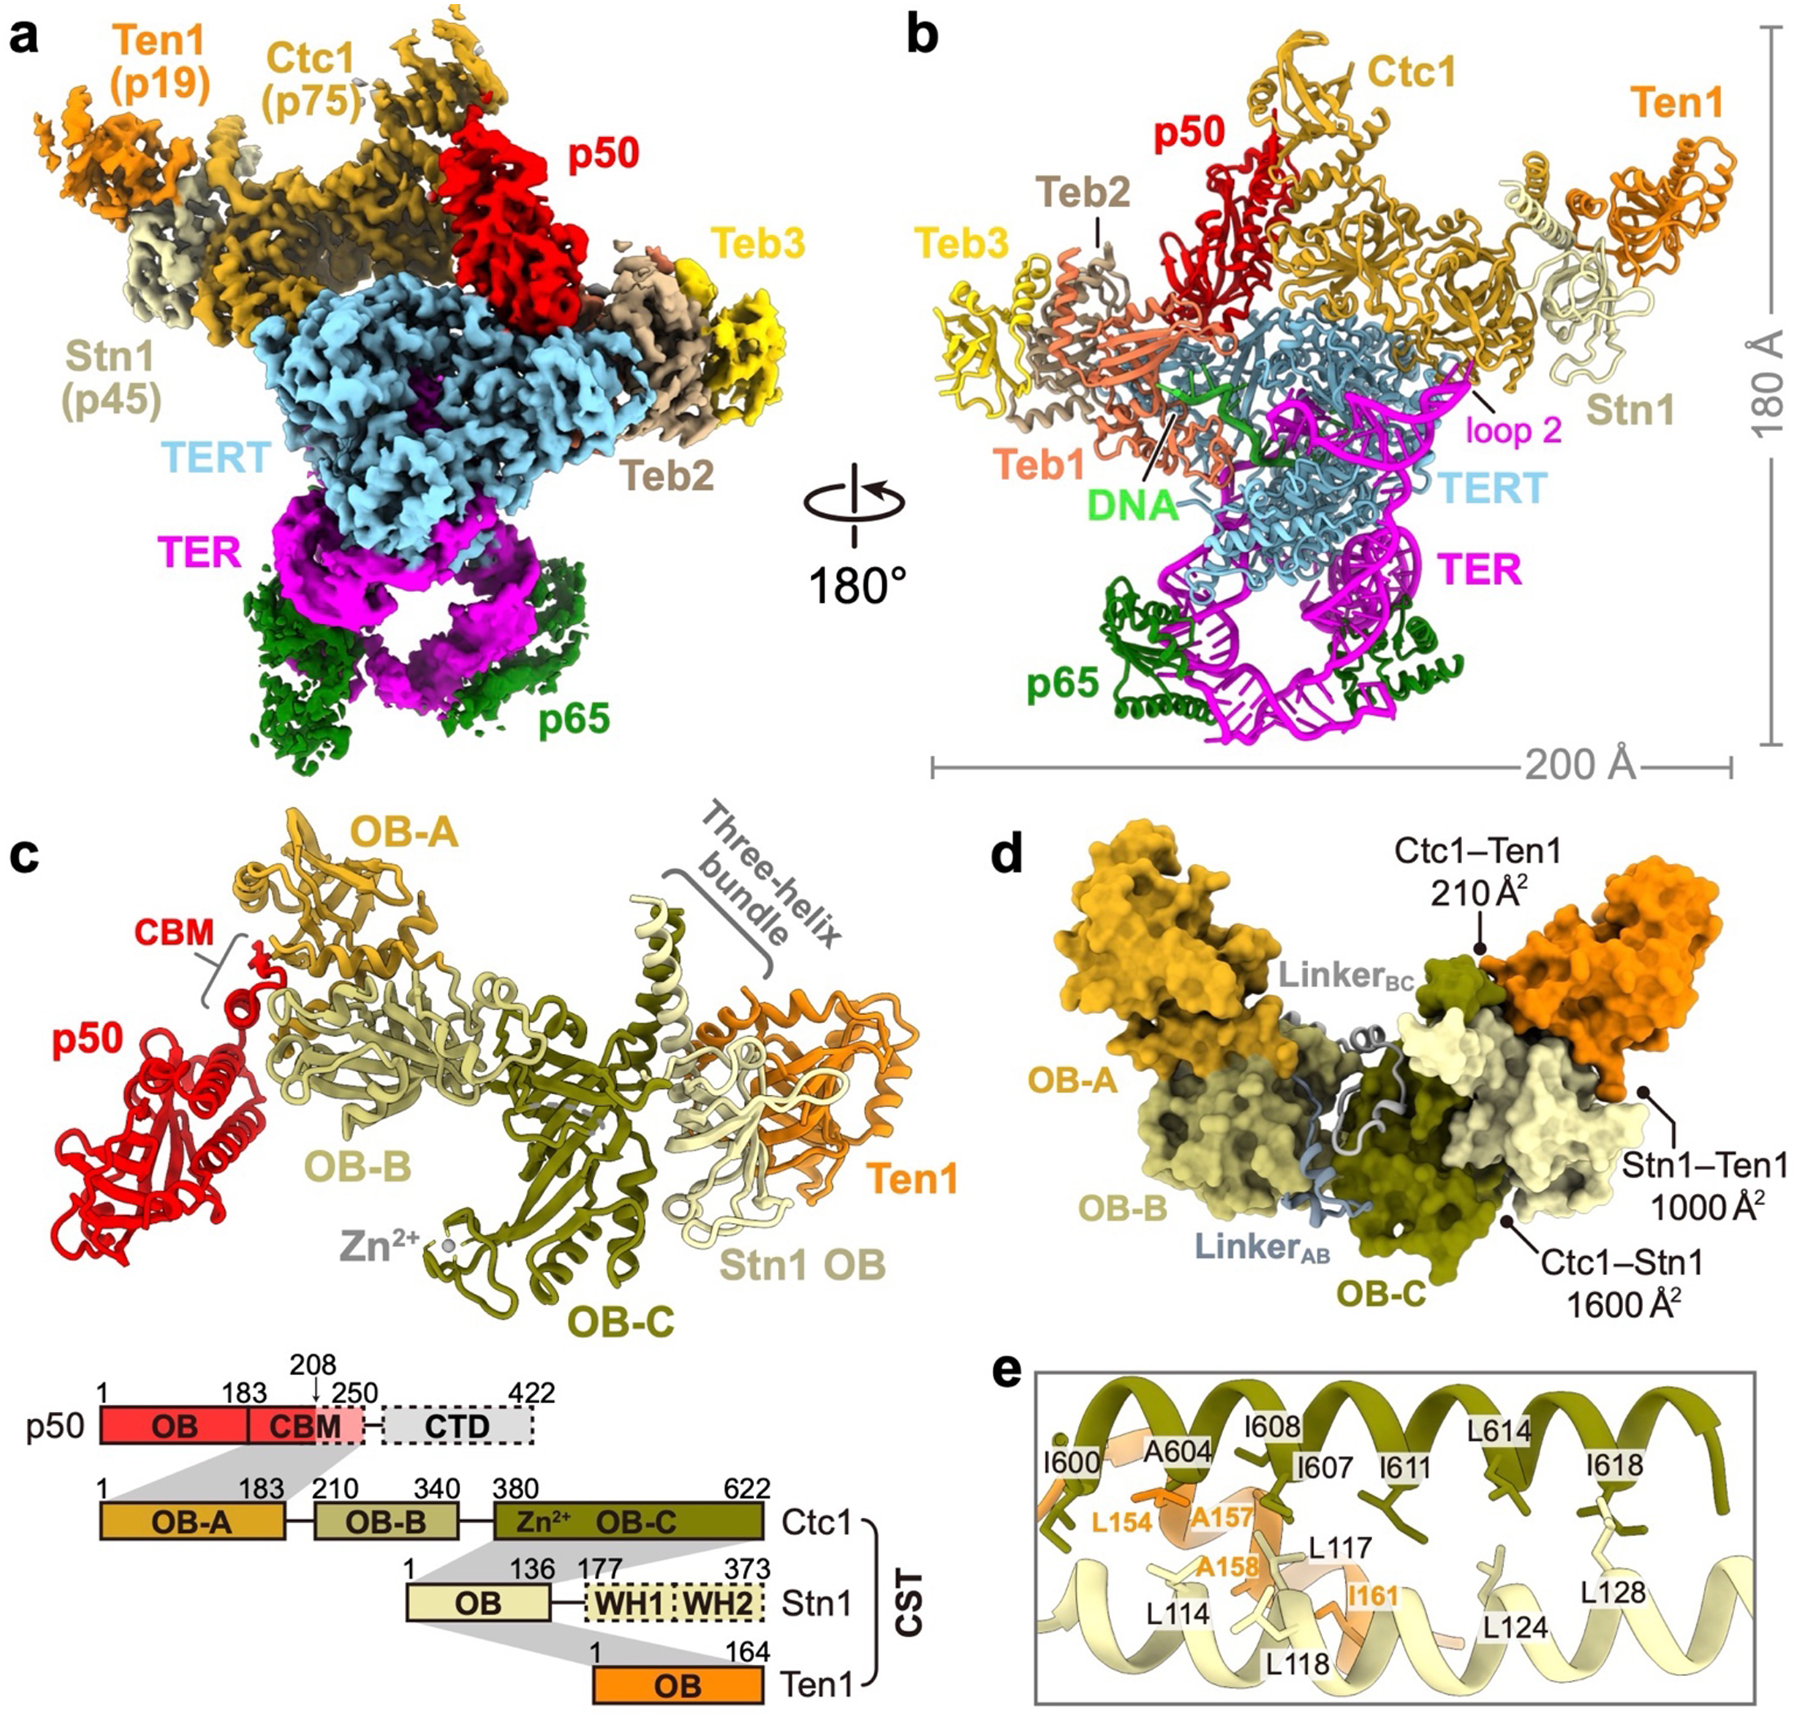
a, Cryo-EM map of telomerase holoenzyme. b, Ribbon representation of the model of telomerase holoenzyme, viewed after a 180° rotation from a. The proteins, TER and DNA are color-coded as indicated. c, Structure and schematic of TtCST with p50. The three OB domains (OB-A, -B, and -C) of Ctc1 are colored individually as indicated. In the schematic, invisible regions in the cryo-EM map are shown as dashed boxes. Intermolecular interactions between proteins are indicated as gray shading. OB, oligonucleotide/oligosaccharide-binding fold domain; WH, winged-helix domain; CBM, CST binding motif; CTD, C-terminal domain; Zn2+, Zn-ribbon motif. d, Surface representation of TtCST structure. Buried surface areas in the interfaces between TtCST subunits are indicated. The two structured linkers between Ctc1 OB domains are shown as ribbon. e, Zoom-in view of the hydrophobic interface of TtCST intermolecular three-helix bundle.
Flexible interface between Ctc1 and p50
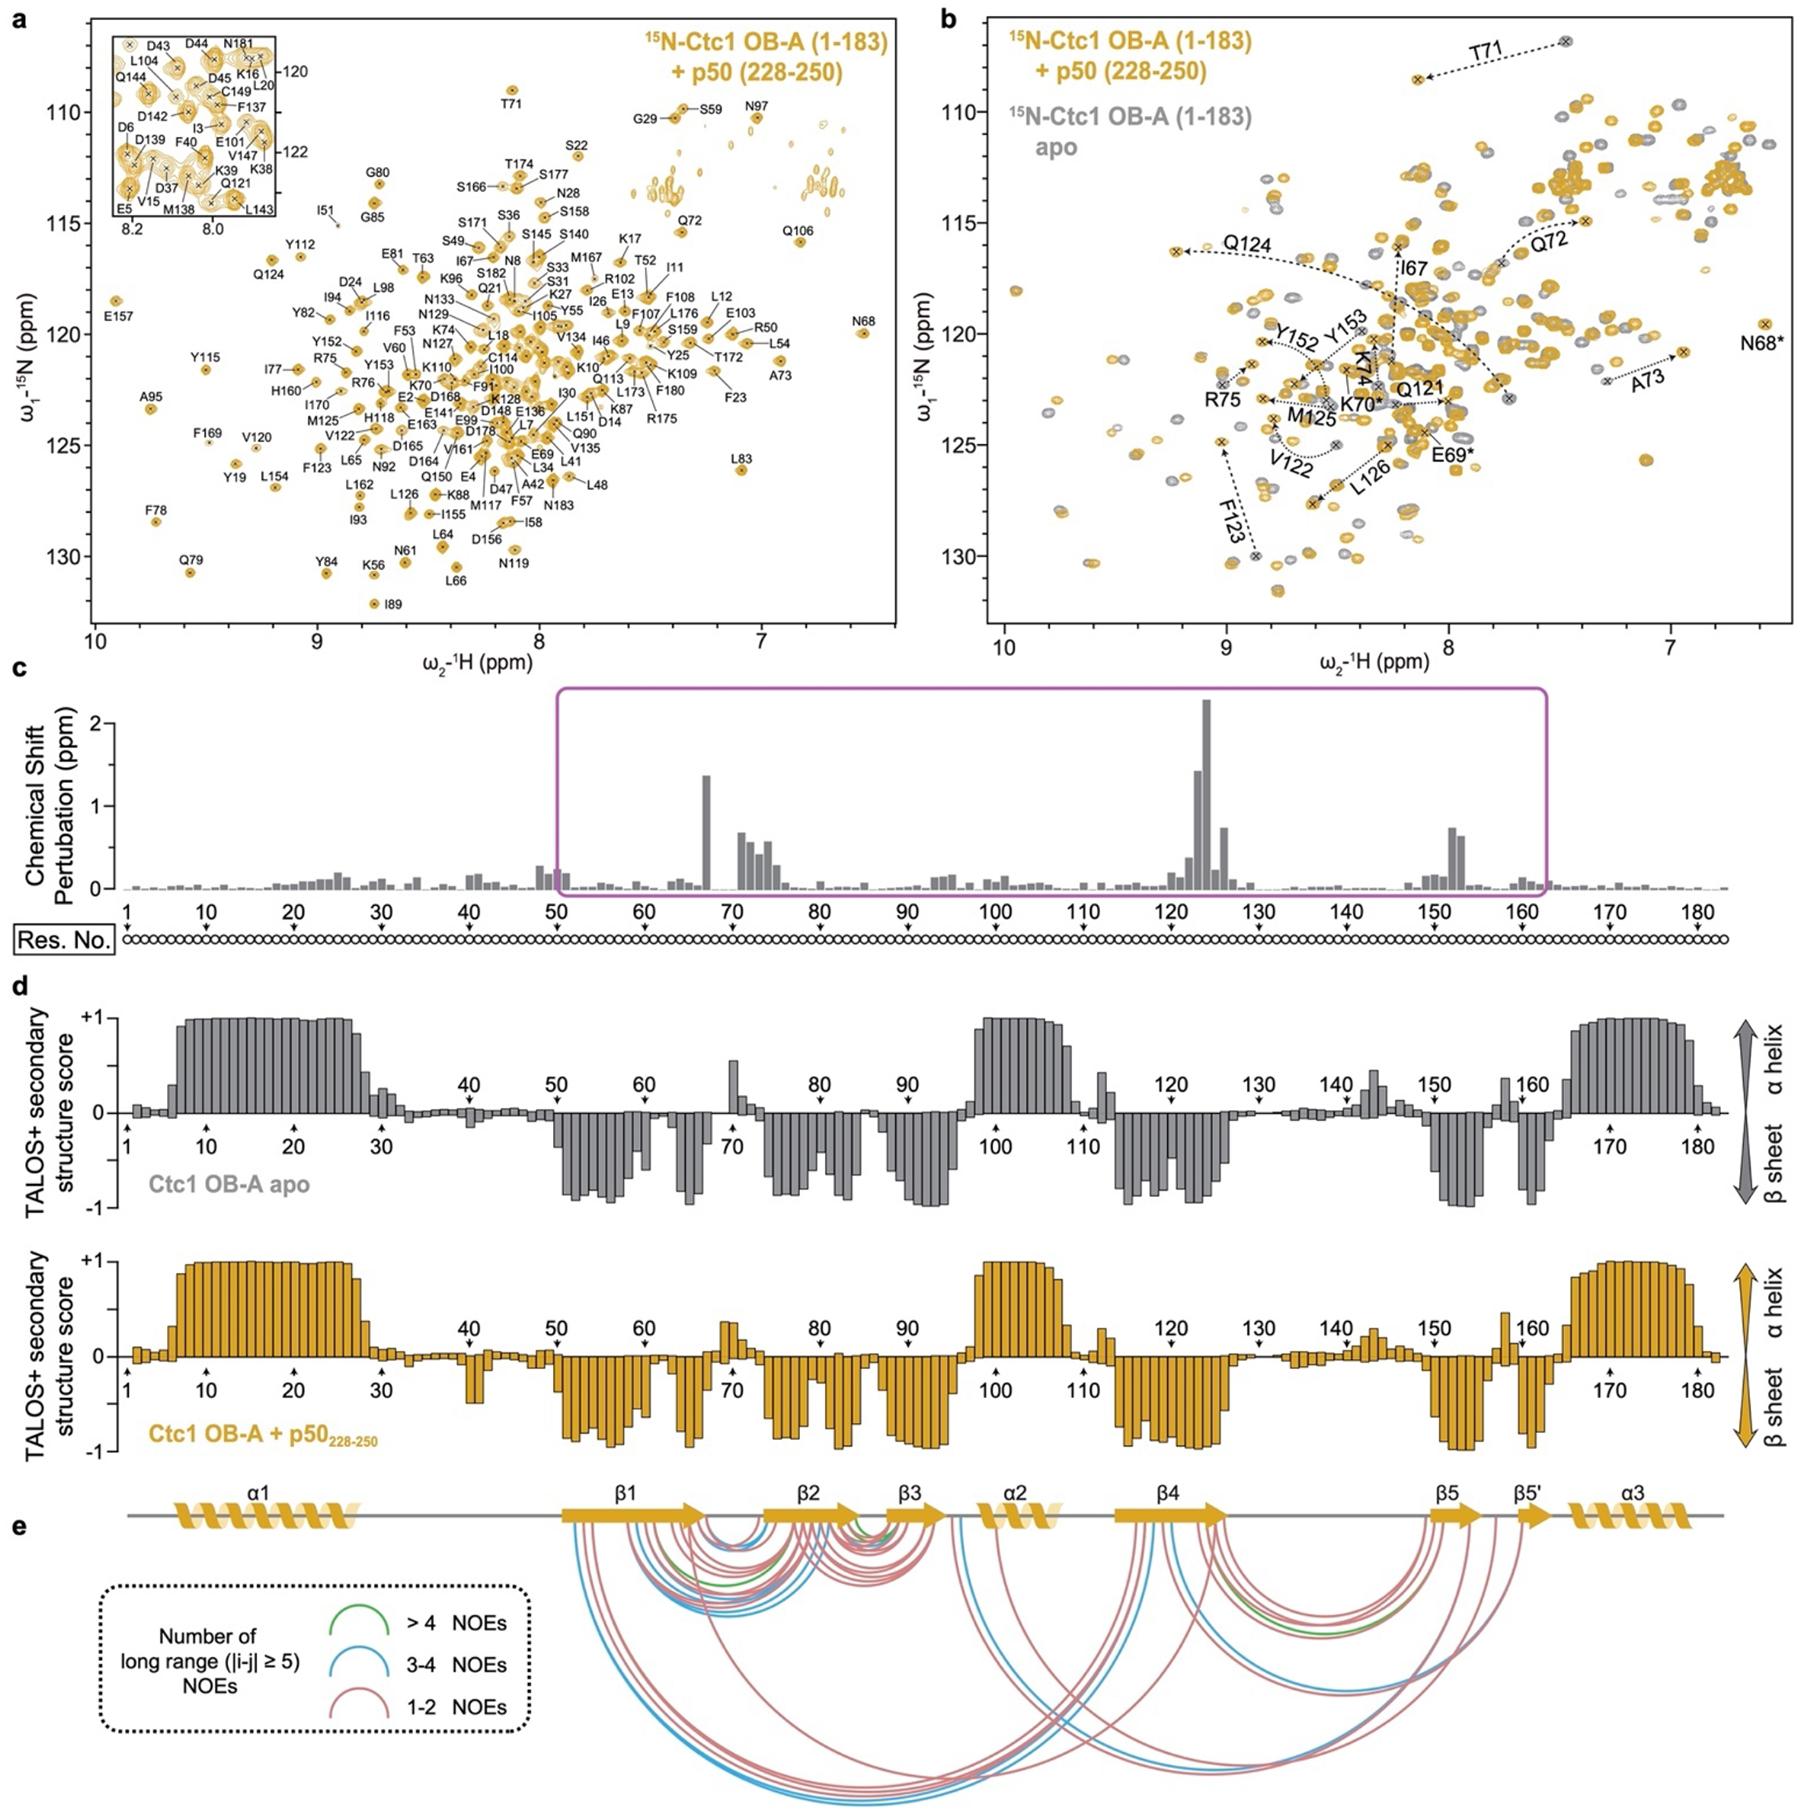
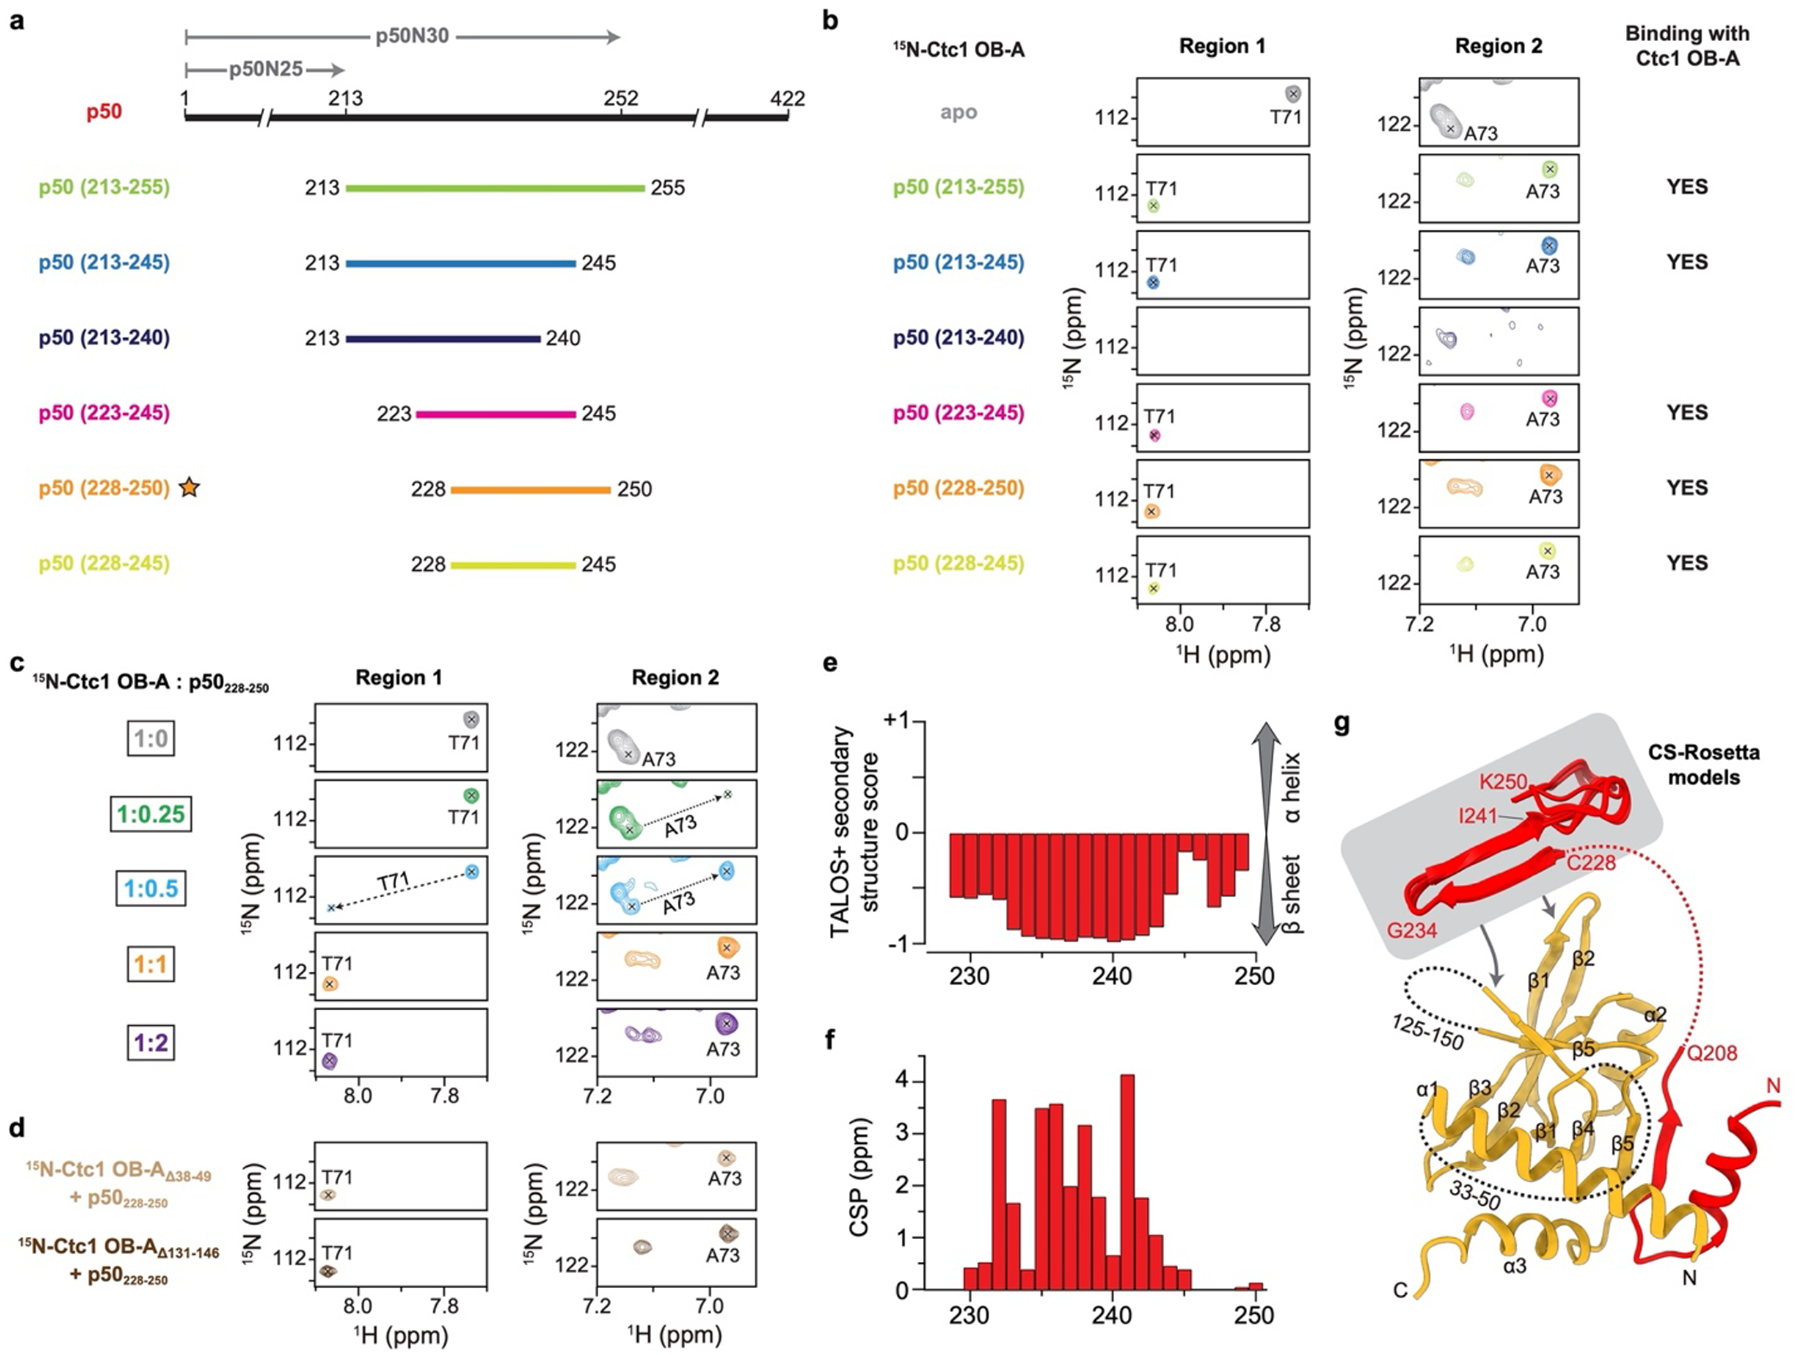
p50 has an N-terminal OB and a C-terminal domain that is invisible in the cryo-EM map (Fig. 1a). p50/TPP1 OB interacts with telomerase on TERT TEN and TRAP domains32,33,39–42, but how p50/TPP1 or POT1 interacts with CST is unknown24,25. We find that TtCST is anchored on p50 via Ctc1 OB-A (Fig. 1c). In the structure, TtCST is positioned across the top of the TERT ring (Fig. 1b), and stabilized in this predominant conformation by additional interactions between Ctc1 and TERT–TER catalytic core (Extended Data Fig. 2j–l). However, these are not stable interactions, as other conformations resolved by 3D classification show TtCST hinged away from TERT (Fig. 2a, Extended Data Fig. 1a). In the cryo-EM map, a previously uncharacterized density of p50 protrudes from its OB C-terminus into Ctc1 OB-A (Extended Data Fig. 1h). p50 residues 185–208 were built against the density as helix α5 and strand β7, the latter of which forms an extended β sheet with β1-β4-β5’ of Ctc1 OB-A (Fig. 2b). However, previous biochemical studies showed that p50 C-terminal truncation at residue 213 almost abrogates binding with Ctc1, while truncation at residue 252 showed binding with Ctc1 comparable to full-length protein43. We therefore investigated whether p50 residues between 208–255 might be contributing to the binding interface with Ctc1. We made a series of p50 peptides and monitored their interaction with Ctc1 OB-A by NMR (Extended Data Fig. 4). 1H-15N HSQC spectra show that optimal binding requires residues 228–250 (Fig. 2c, Extended Data Fig. 4b). This peptide forms a 1:1 complex with Ctc1 OB-A that is in slow exchange on the NMR timescale indicating slow off-rate (Extended Data Fig. 4c). Talos+ secondary structure scores, CS-Rosetta modeling, and chemical shift mapping (see Methods) indicate that p50 peptide residues 228–241 form a β-hairpin that interacts with the Ctc1 OB-A β-barrel near β1-β2 linker, β4, and β5 (Fig. 2d, Extended Data Fig. 4e–g). Together, these cryo-EM and NMR data define a Ctc1 binding motif (CBM) adjacent to p50 OB that tightly associates with Ctc1 but allows hinging movement of the entire TtCST complex on p50. Deletion of residues containing this motif results in loss of cell viability43, indicating the importance of TtCST association with telomerase in vivo.
Fig. 2: Interface between TtCST and p50.
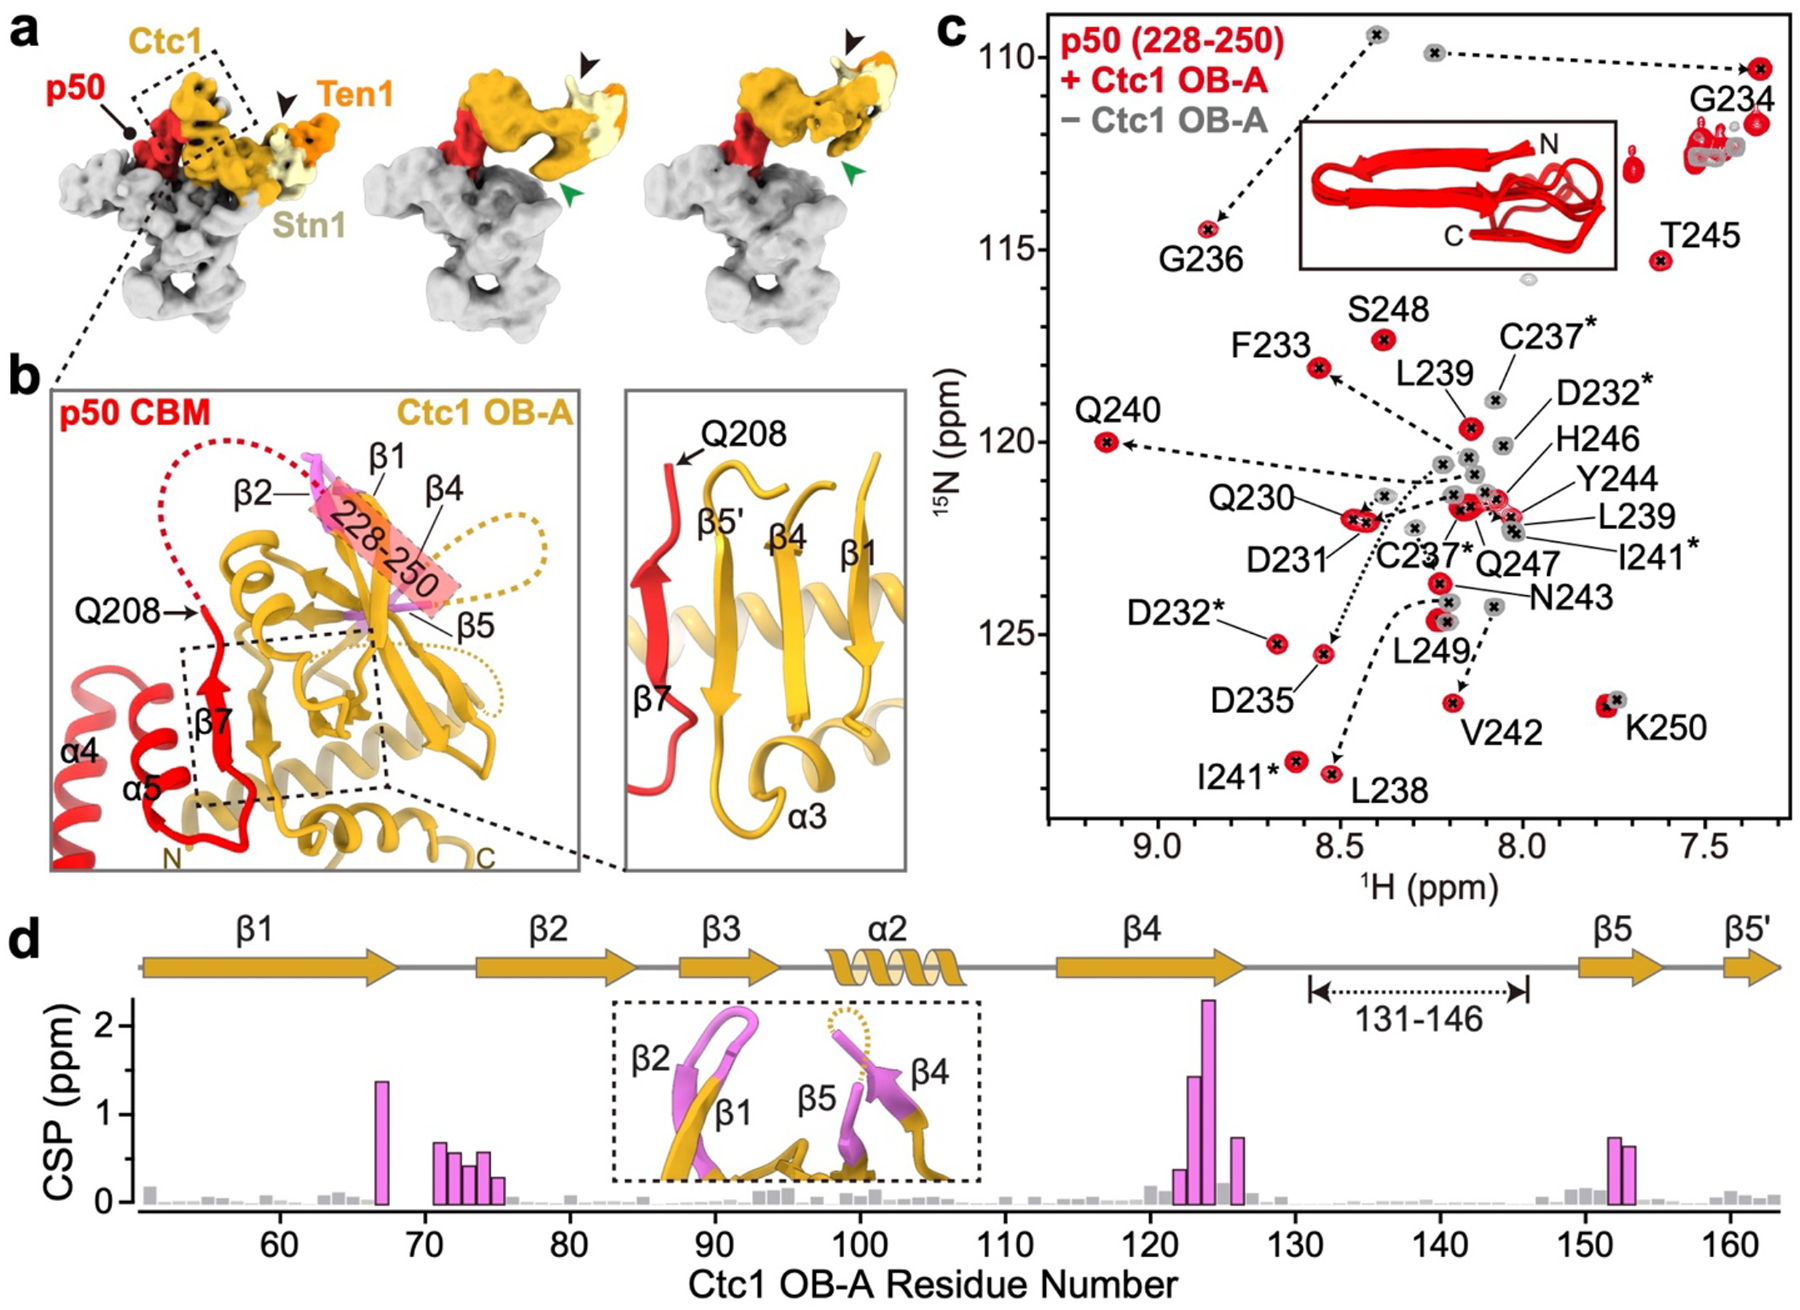
a, Cryo-EM maps of telomerase holoenzyme with TtCST at different positions. TtCST subunits and p50 are colored as indicated. The three-helix bundle and Zn-ribbon motif are labeled with black and green arrows, respectively. Cryo-EM maps are low-pass filtered to similar resolution for comparison. b, Interactions between Ctc1 OB-A and p50 CBM. Unmodeled regions in the cryo-EM structure are shown as dashed lines. c, 1H-15N HSQC spectra of 15N-labelled p50 peptide (residues 228–250) with (red) and without (gray) Ctc1 OB-A. NMR signals from the same residues are connected with dashed arrows or labeled with asterisks. Inset shows the 10 lowest energy CS-Rosetta models of p50 peptide (Cα RMSD 1.73 Å) in the presence of Ctc1 OB-A. d, Chemical shift perturbation (CSP) index of 15N-labelled Ctc1 OB-A upon binding p50 peptide. Residues with CSP over 0.25 ppm are highlighted in magenta, and their locations on the cryo-EM structure are shown in an inserted panel and on b.
Overall structure of PolαPrim with CST
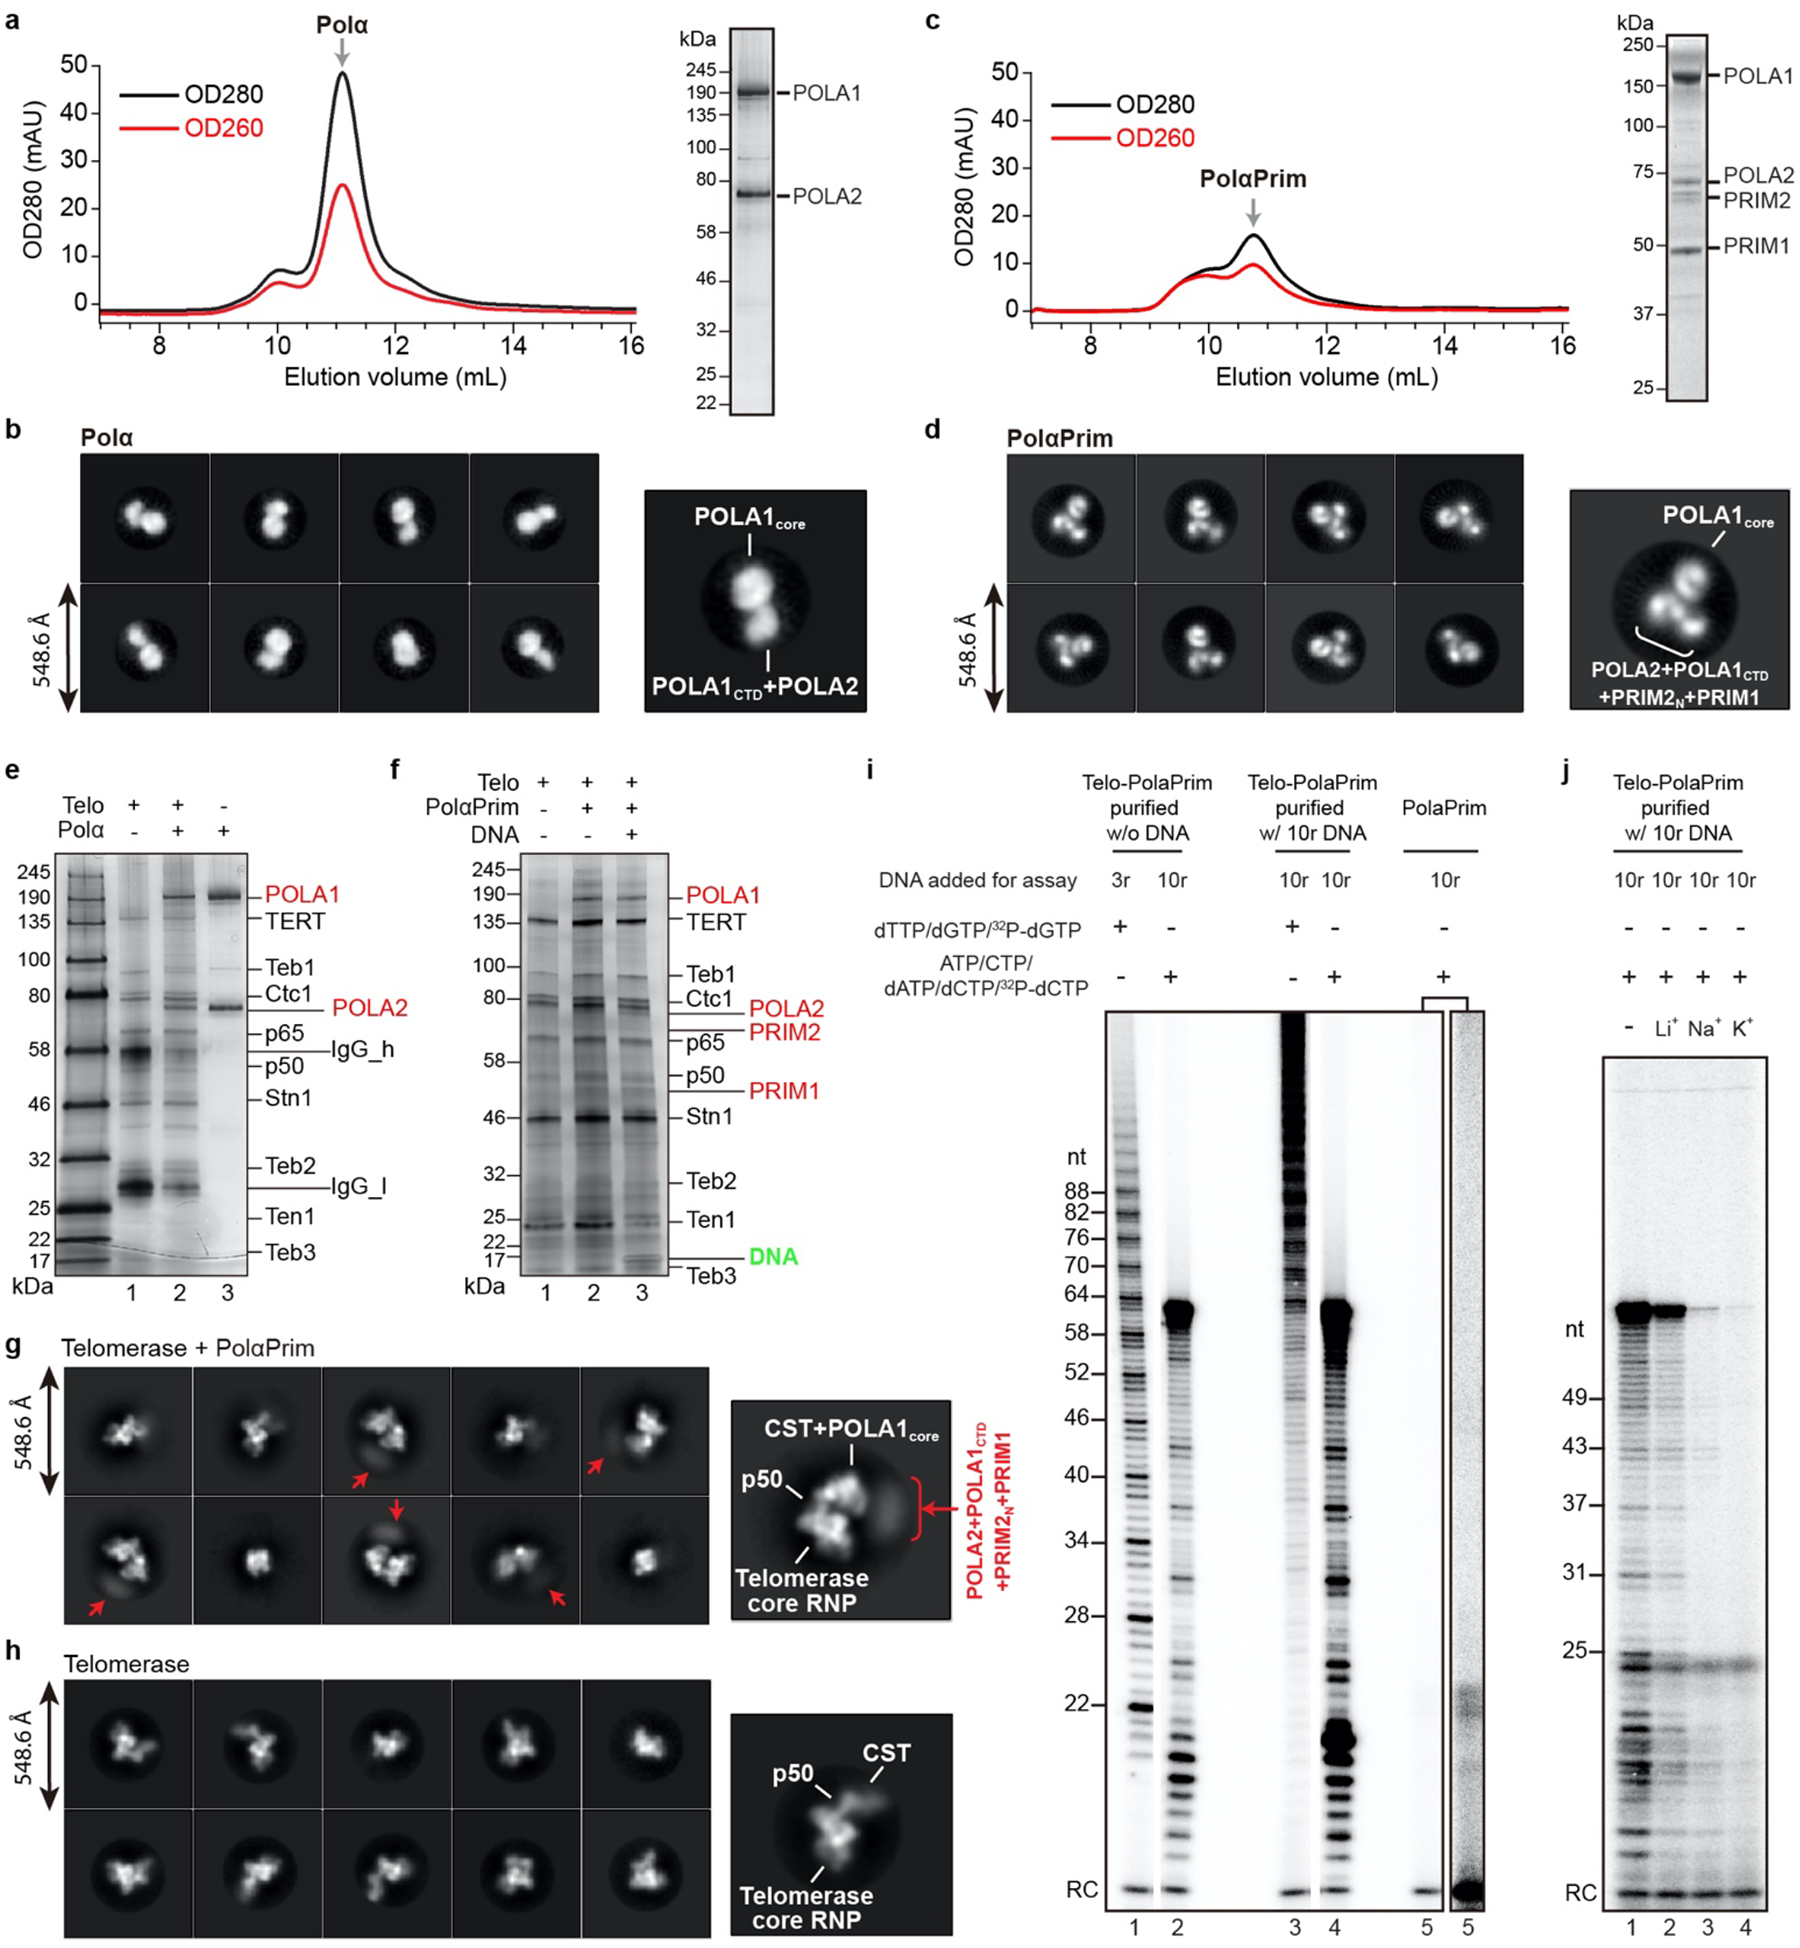
A defining feature of CST function at telomere ends is its ability to recruit PolαPrim for C-strand synthesis; however, the interface between PolαPrim and CST has not been structurally characterized in any organism10,26–29,44. To both verify that p75–p45–p19 is functionally TtCST and define the mechanism of PolαPrim recruitment, we assembled Tetrahymena telomerase–PolαPrim complex using endogenously expressed telomerase and recombinant PolαPrim in the presence of sstDNA d(GTTGGG)10, and determined its cryo-EM structure (Fig. 3a, b, Extended Data Fig. 5, 6). We verified that this complex was active for both G-strand synthesis by telomerase and C-strand synthesis by telomerase associated CST–PolαPrim individually (Extended Data Fig. 5i), and for handoff of G-strand on telomerase to PolαPrim for C-strand synthesis (Fig. 3c) using direct telomerase and PolαPrim activity assays. With d(GTTGGG)10 as template, as in the cryo-EM sample, TtCST–PolαPrim could copy the entire G-strand template (Extended Data Fig. 5i). In comparison, almost no C-strand synthesis is observed with PolαPrim alone (Extended Data Fig. 5i).
Fig. 3: Structure of Tetrahymena telomerase holoenzyme in complex PolαPrim.
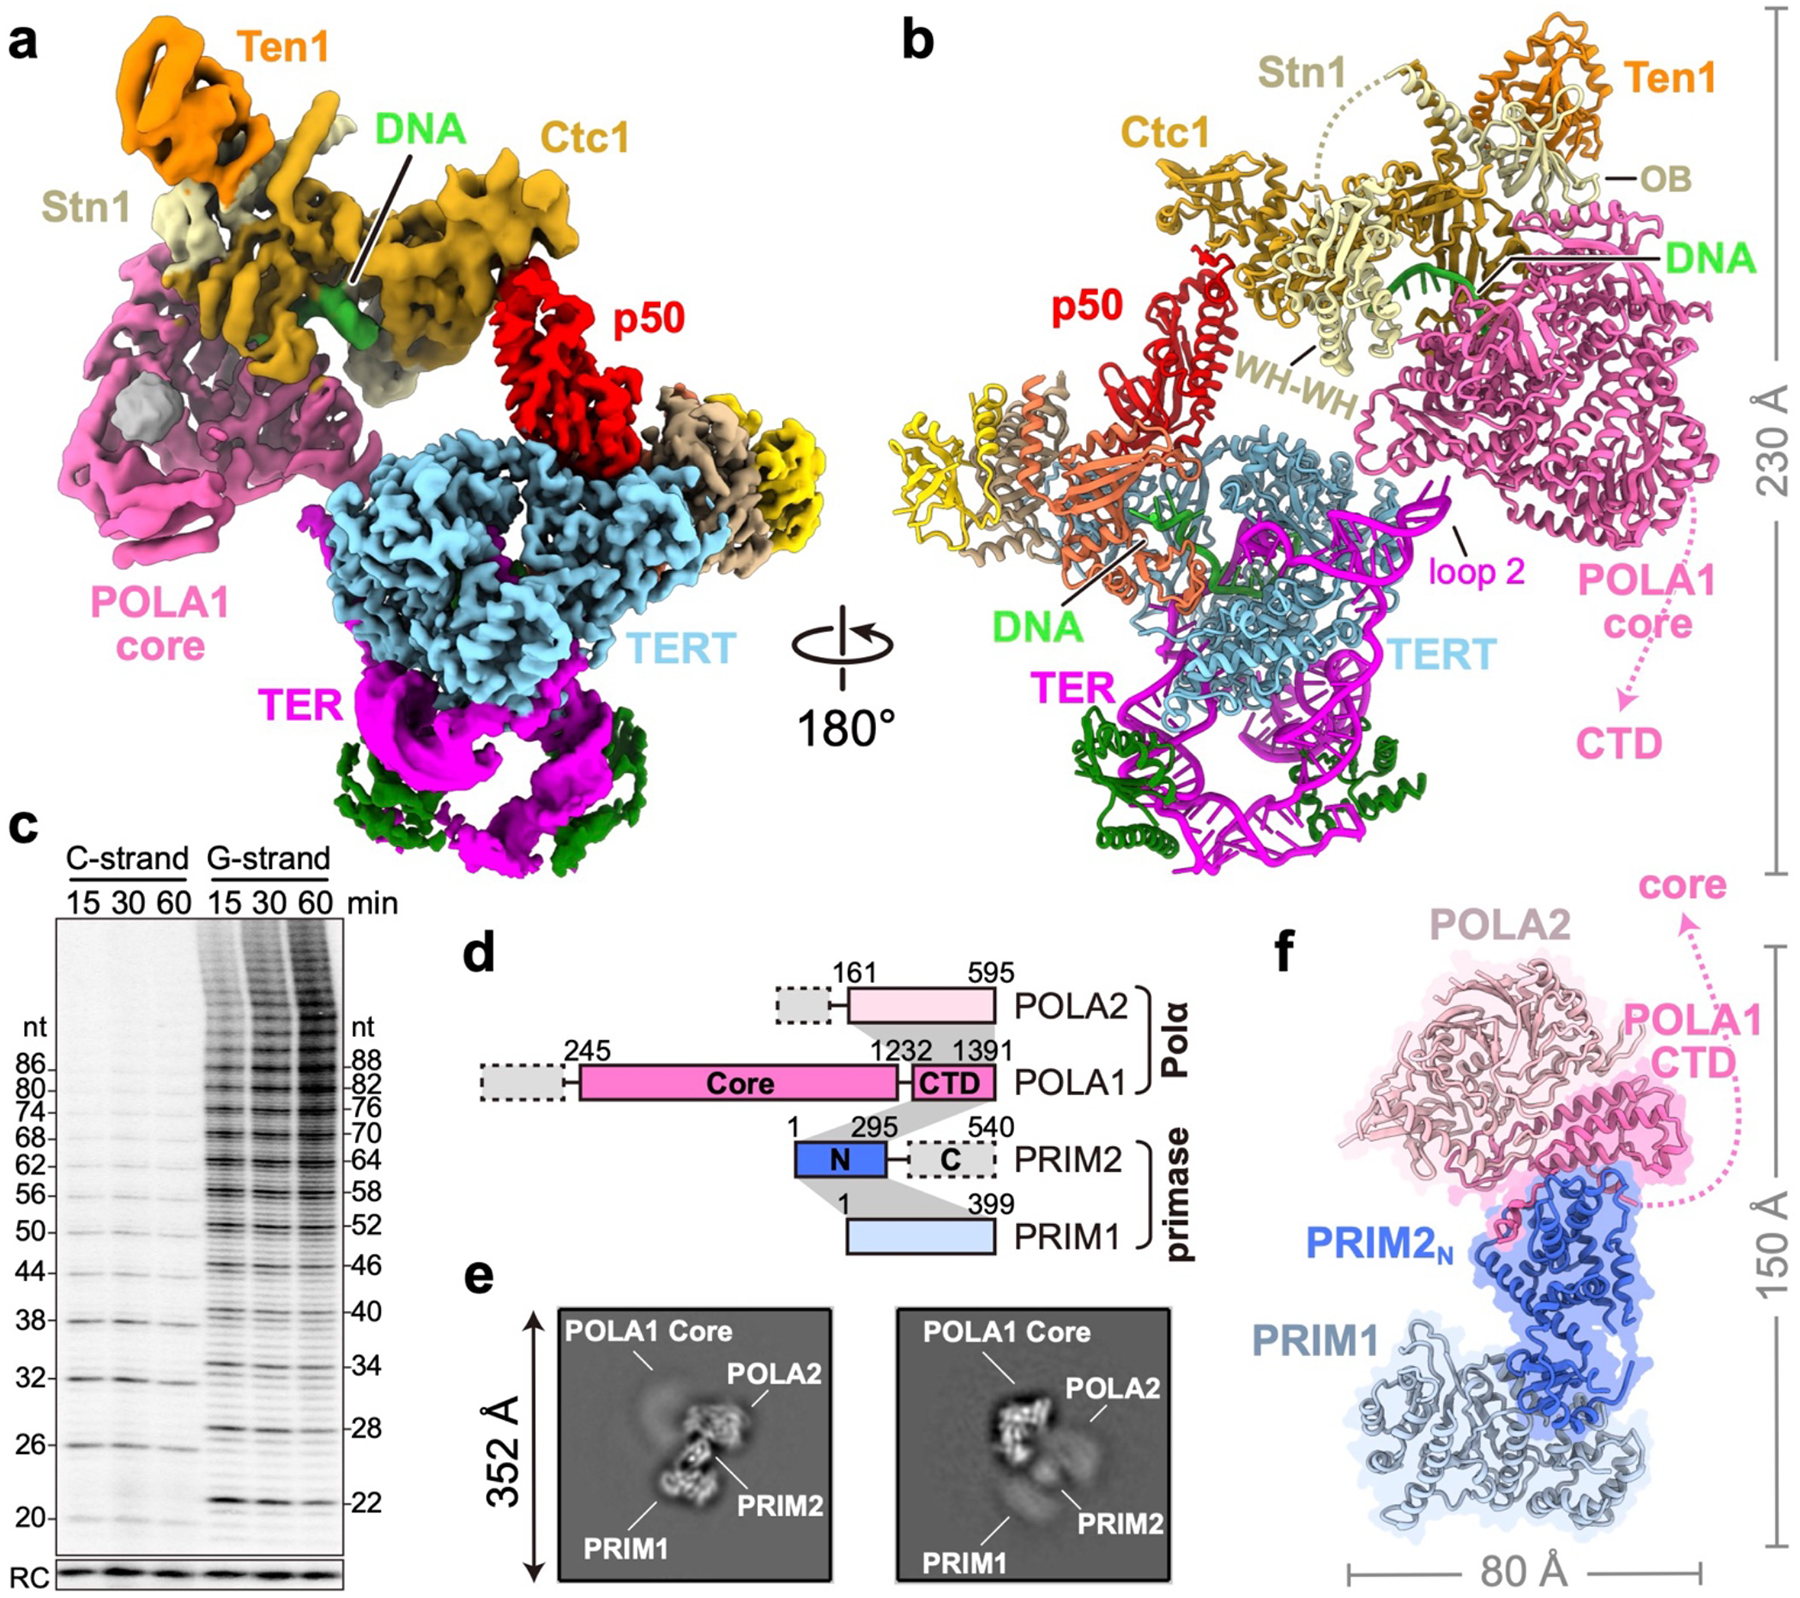
a, Composite map of the complex generated with focused refined cryo-EM maps (Extended Data Fig. 6a). b, Atomic model of the complex. The unstructured linker between Stn1 OB and WH-WH domains is shown as dashed line. c, Concurrent time courses of G-strand and C-strand synthesis by telomerase-PolαPrim using d(GTTGGG)3 DNA primers (detailed in Methods). 32P-dGTP and 32P-dCTP were used to label the G-strand and C-strand products, respectively. The G-strand products provide the template for C-strand synthesis. RC, recovery control. Supplementary Fig. 1 provides gel source data for all figures. d, Structure-based diagram of PolαPrim. Intermolecular interactions between subunits are indicated as gray shading. e, Representative 2D-class averages of PolαPrim. f, Cryo-EM structure of PolαPrim. The flexible linker between POLA1core and POLA1CTD is shown as dashed line.
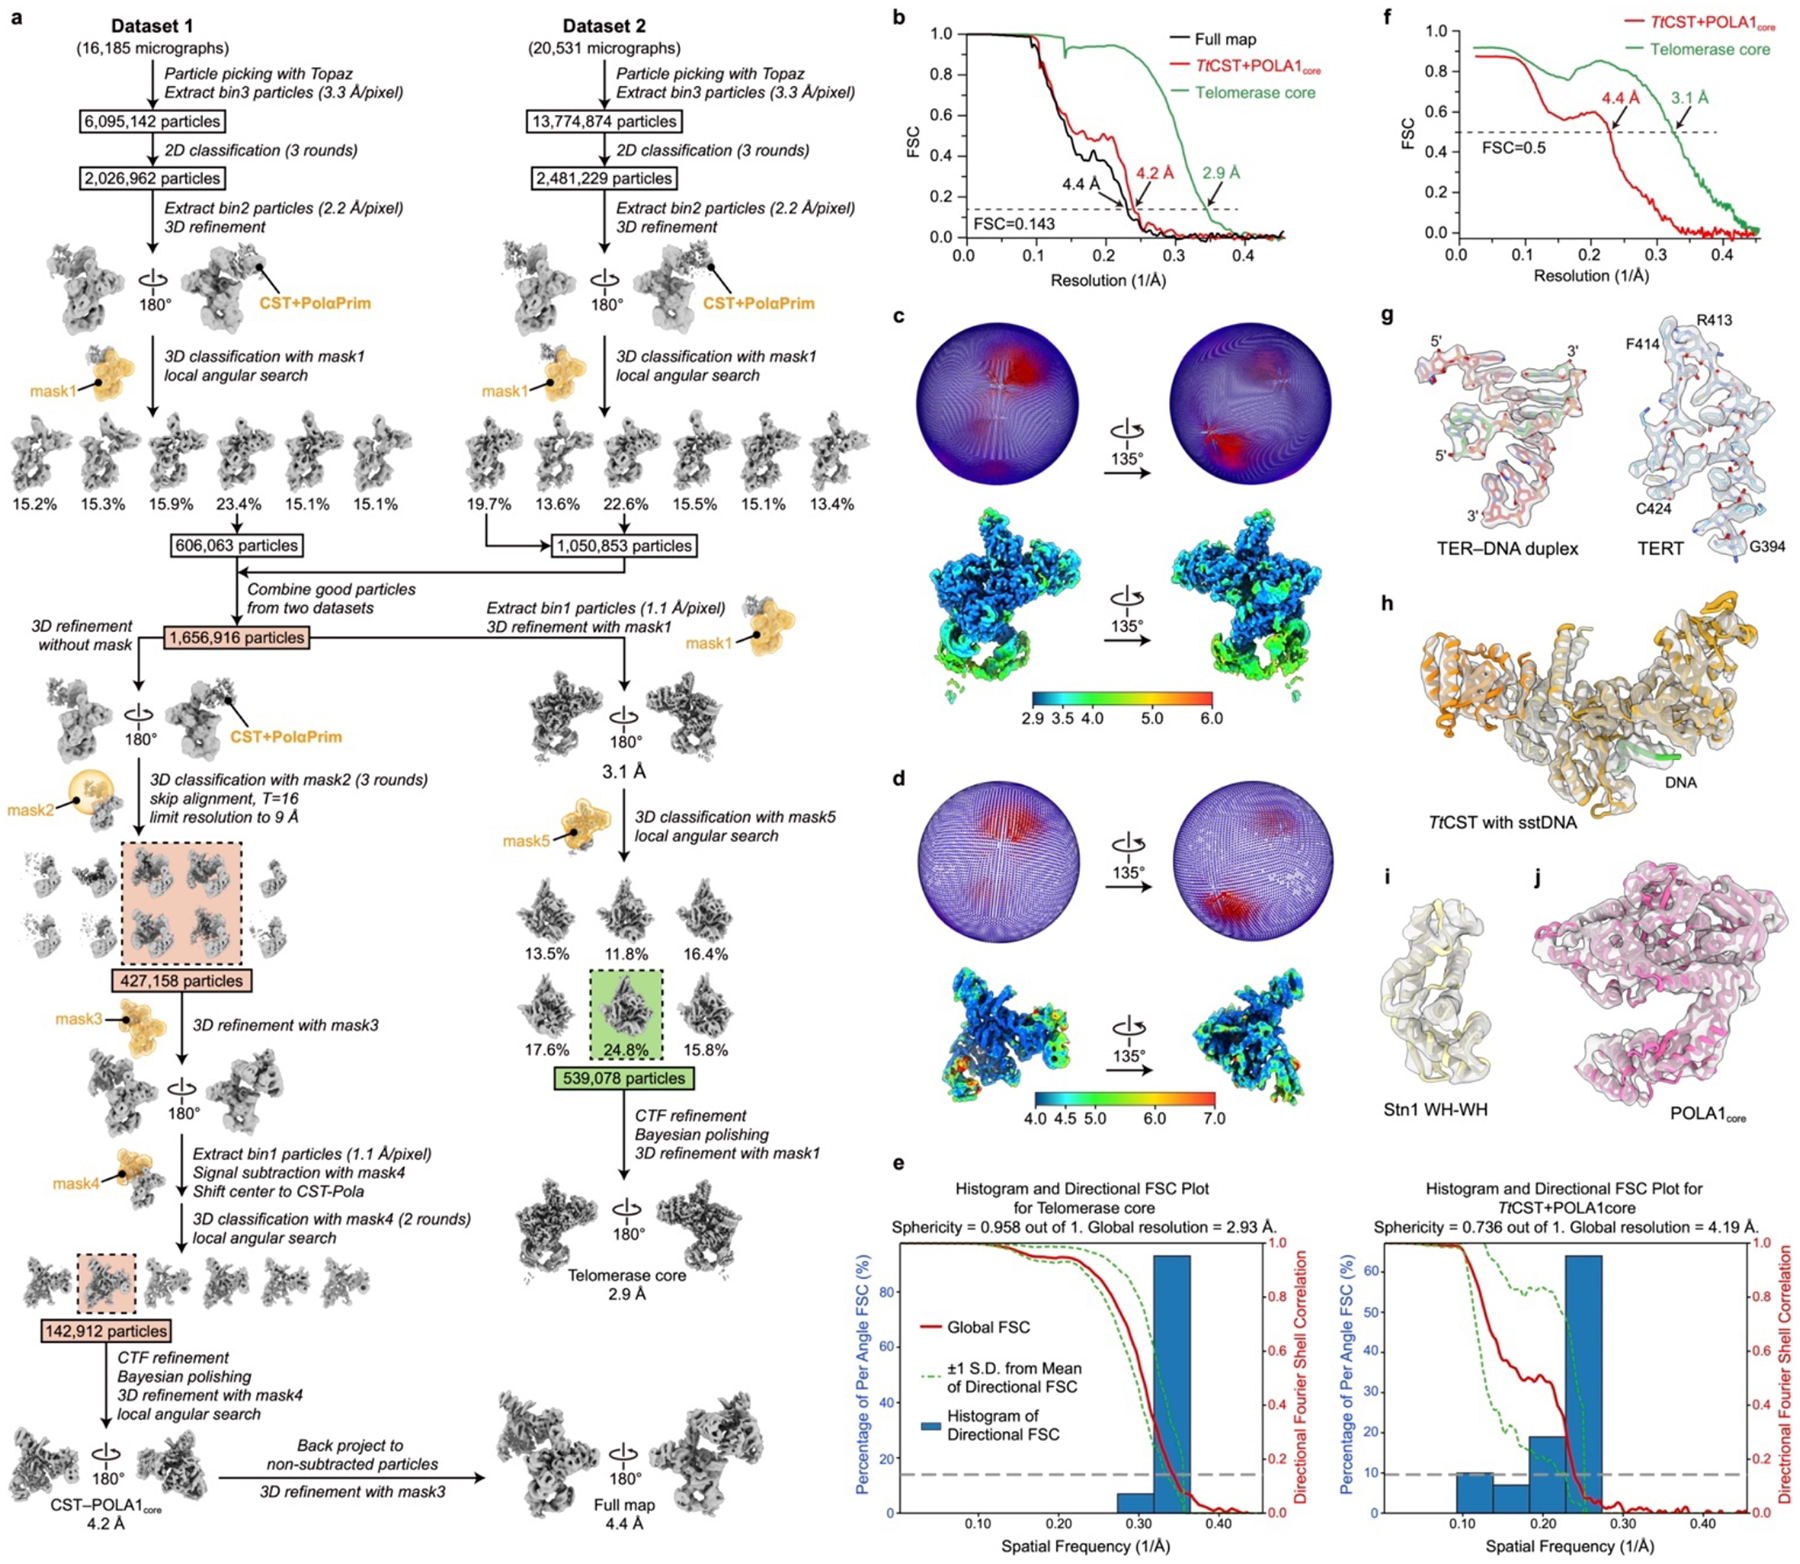
In the telomerase holoenzyme, PolαPrim binds TtCST in the absence or presence of sstDNA (Extended Fig. 5f). Since the entire TtCST–PolαPrim complex was flexibly positioned relative to p50, as seen for TtCST alone, the TtCST–PolαPrim and telomerase RNP core–TEB–p50 complexes were processed separately to obtain cryo-EM 3D reconstructions of 4.2 Å and 2.9 Å resolution, respectively (Fig. 3a, Extended Data Fig. 6, Extended Data Table 1). The modeled structures are the first of telomerase associated CST-bound PolαPrim and the highest resolution structure of telomerase RNP core to date (Fig. 3b, Extended Data Fig. 6g). Modeling of TtCST in the complex by initial rigid body fitting of the structure determined in the absence of PolαPrim revealed the presence of additional density on Ctc1 OB-B and OB-C that could be fit with the crystal structure of Stn1 WH-WH22,23 (Fig. 3b, Extended Data Fig. 6i). Binding of PolαPrim to TtCST displaces Ctc1 from its stable position across the top of the TERT ring (compare Fig. 3a, b to Fig. 1a, b), and instead POLA1 is positioned near TER loop 2. The Stn1 WH-WH binding site on Ctc1 would also be occluded in the stable conformation of TtCST on p50–TERT in the absence of PolαPrim.
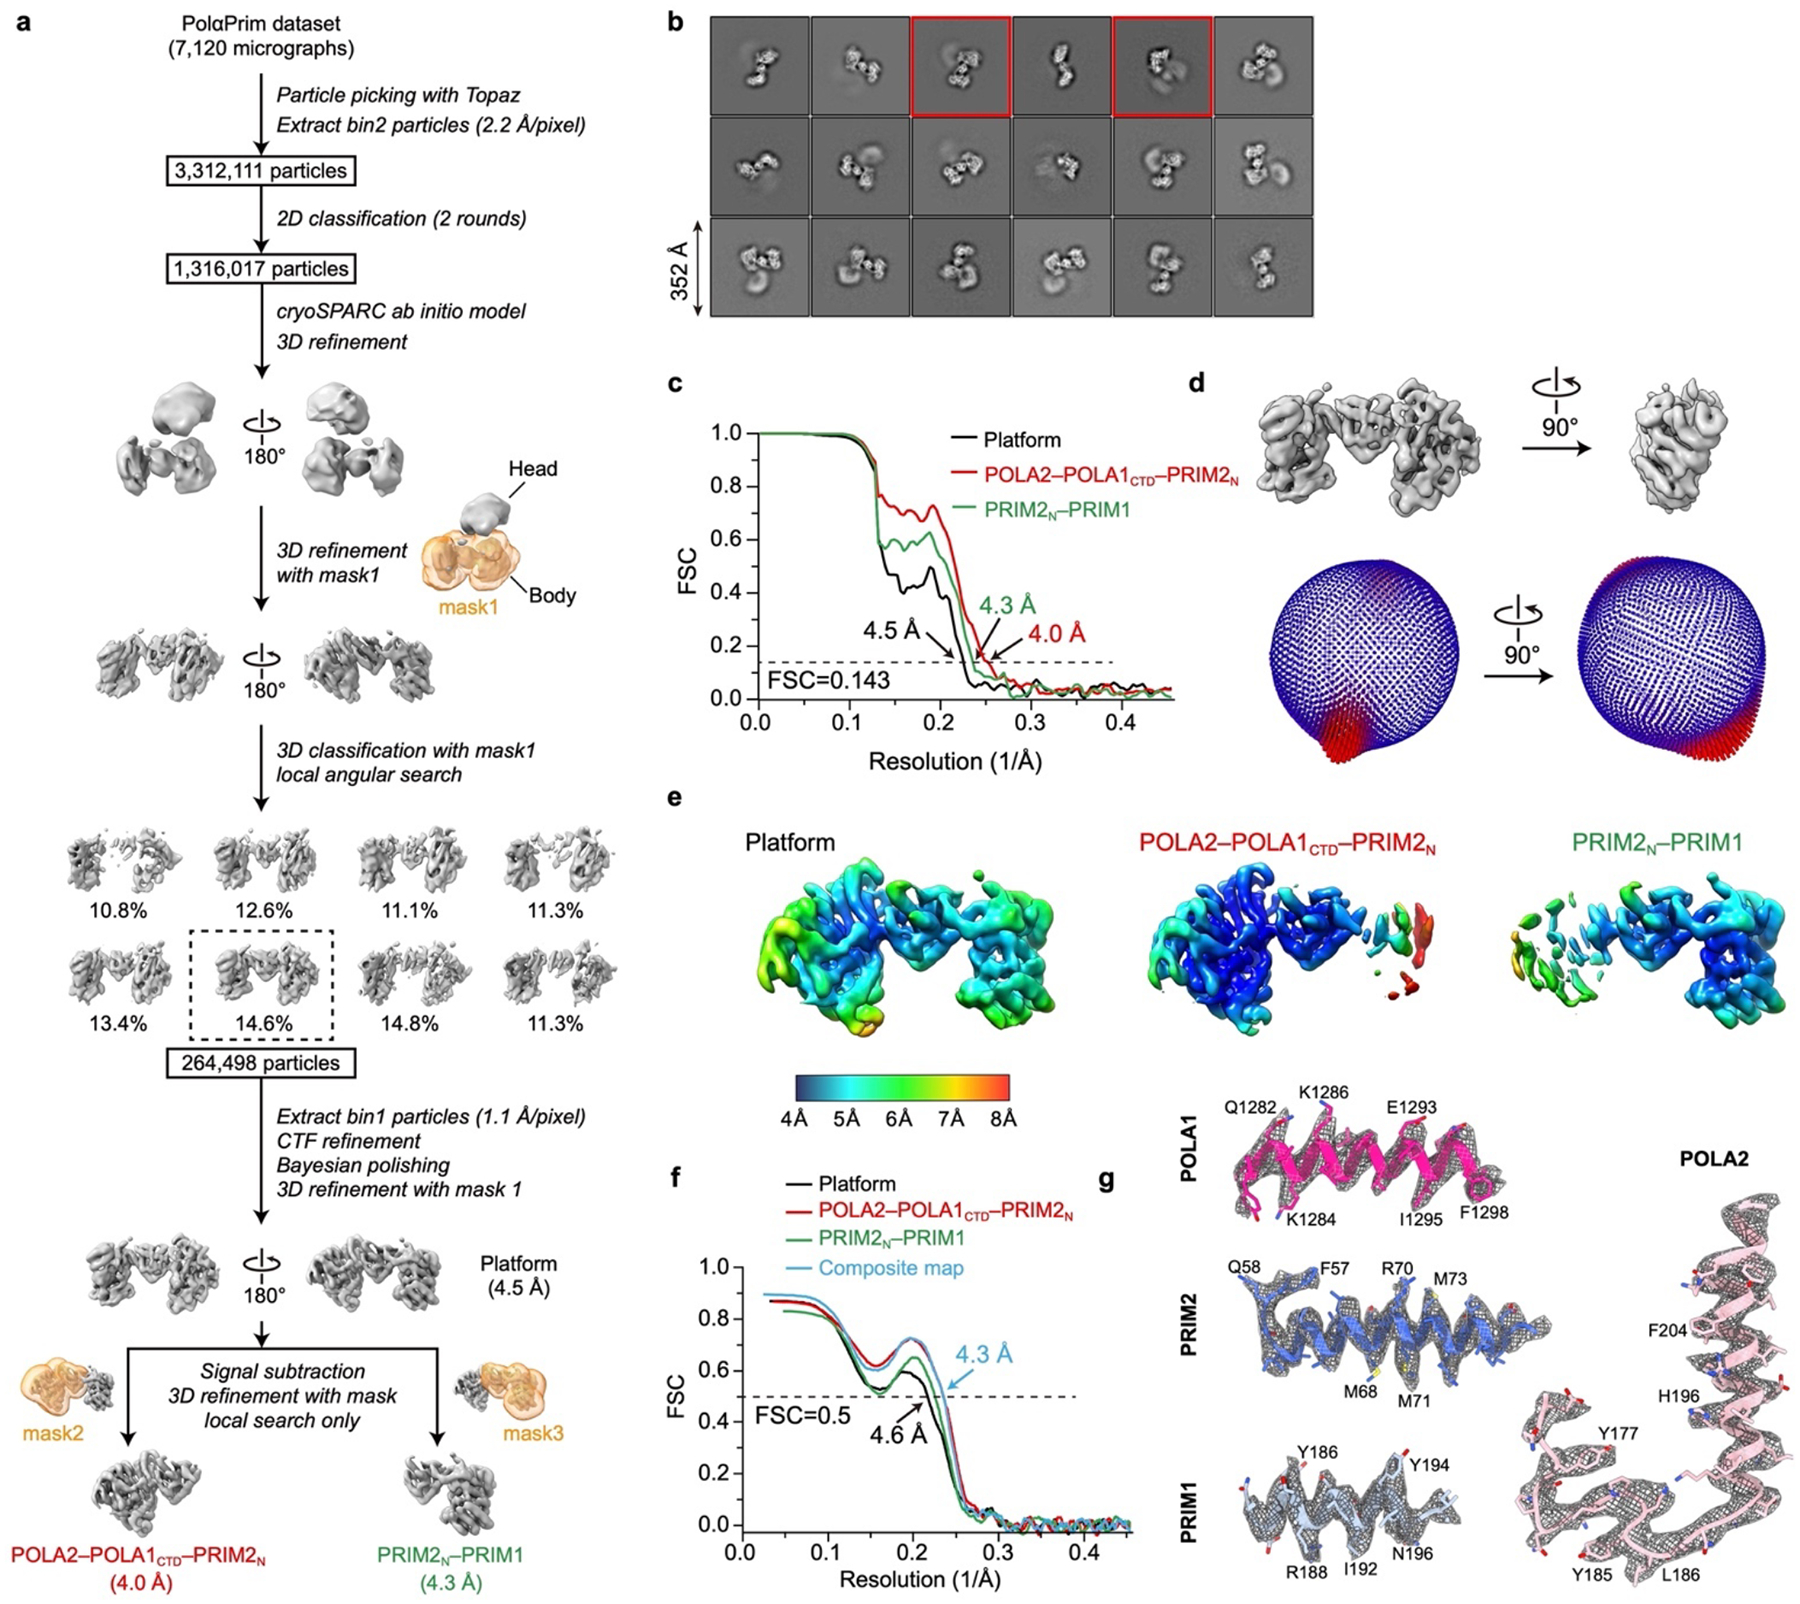
PolαPrim comprises two polymerase (POLA1 and POLA2) and two primase (PRIM1 and PRIM2) subunits7,8 (Fig. 3d). The presence of all four subunits in the complex was confirmed by silver-stain SDS-PAGE (Extended Data Fig. 5f) and negative-stain EM 2D classification analysis (Extended Data Fig. 5g). However, only the catalytic POLA1core was well resolved in the cryo-EM map (Fig. 3a, d). The rest of PolαPrim appears as a fuzzy density connected to POLA1core opposite the interface with Ctc1 (Extended Data Fig. 5g). Therefore, we also investigated the cryo-EM structure of PolαPrim alone, and obtained a 4.0–4.3 Å resolution structure for POLA2–POLA1CTD–PRIM2N–PRIM1 (Fig. 3e, f, Extended Data Fig. 7, Extended Data Table 1). 2D class averages of PolαPrim show that POLA2–POLA1CTD–PRIM2N–PRIM1 forms a platform that holds POLA1core at various positions (Fig. 3e). Initial models of PolαPrim subunits generated using AlphaFold2 were rigid-body fit into corresponding densities and manually adjusted (see Methods). The structures of the individual subunits are highly similar to those of human PolαPrim45–47 (Extended Data Fig. 8a, b). However, POLA2-POLA1CTD and PRIM1 that are located on either end of the platform can apparently rotate relative to each other, with PRIM2N as the pivot (Extended Data Fig. 8b). PRIM2C, which specifically interacts with and coordinates RNA–DNA duplex translocation from the active site on PRIM1 to the active site on POLA1core (ref8), was not observed during cryo-EM data processing, suggesting its dynamic positioning. Such flexible organization of PolαPrim would allow for the large-scale domain movements expected for the switch from RNA primer to C-strand DNA synthesis8. Previous structures of human PolαPrim determined by X-ray crystallography and cryo-EM of a crosslinked sample are in an autoinhibited conformation (Extended Data Fig. 8c) with the active site on POLA1core sterically blocked by POLA1CTD and POLA2 for DNA entry45,46. Here, our studies provide the first structures of a PolαPrim compatible with activity, and they establish its direct interactions with TtCST, as described in detail next.
CST interaction with POLA1 and sstDNA
POLA1core comprises an N-terminal domain (NTD) that brackets a catalytically dead exonuclease (Exo), and a C-terminal DNA polymerase that contains palm, fingers, and thumb domains8 (Fig. 4a, b). All elements of POLA1core except the tip of the thumb are well defined in the cryo-EM map. TtCST interacts with POLA1core via Ctc1 OB-C and Stn1, and the interface is about 3000 Å2 (Fig. 4a–d, Extended Data Fig. 9). On Ctc1 OB-C, the conserved Zn-ribbon motif interacts primarily with conserved Exo β11-β12 hairpin (Fig. 4c, Extended Data Fig. 8d). Ctc1 helix α14 and Stn1 OB β1-β2 and β3-β4 loops form a binding pocket that accommodates POLA1core NTD helix α19 (residues 731–748) with charge complementarity to its side chains (Fig. 4c, Extended Data Fig. 8e–g). Helix α19 is a flexible loop in all other structures of PolαPrim45–47, and apparently becomes structured only on binding Ctc1–Stn1 (Extended Data Fig. 8e), indicating the importance of this interaction for TtCST binding. Behind this interface, the three helices of Stn1 WH2 are inserted into a gap between Ctc1 OB-B and POLA1 Exo (Fig. 4d). The structure shows that POLA1core Exo and NTD form an extensive interface with TtCST involving Ctc1 OB-C, Stn1 OB, and Stn1 WHWH, which is otherwise flexibly tethered to Stn1 OB in the absence of PolαPrim. Structure-based sequence alignment suggests conservation of these regions on POLA1core that interface with TtCST across a wide-range of species (Extended Data Fig. 8g).
Fig. 4: Interface between TtCST and POLA1core.
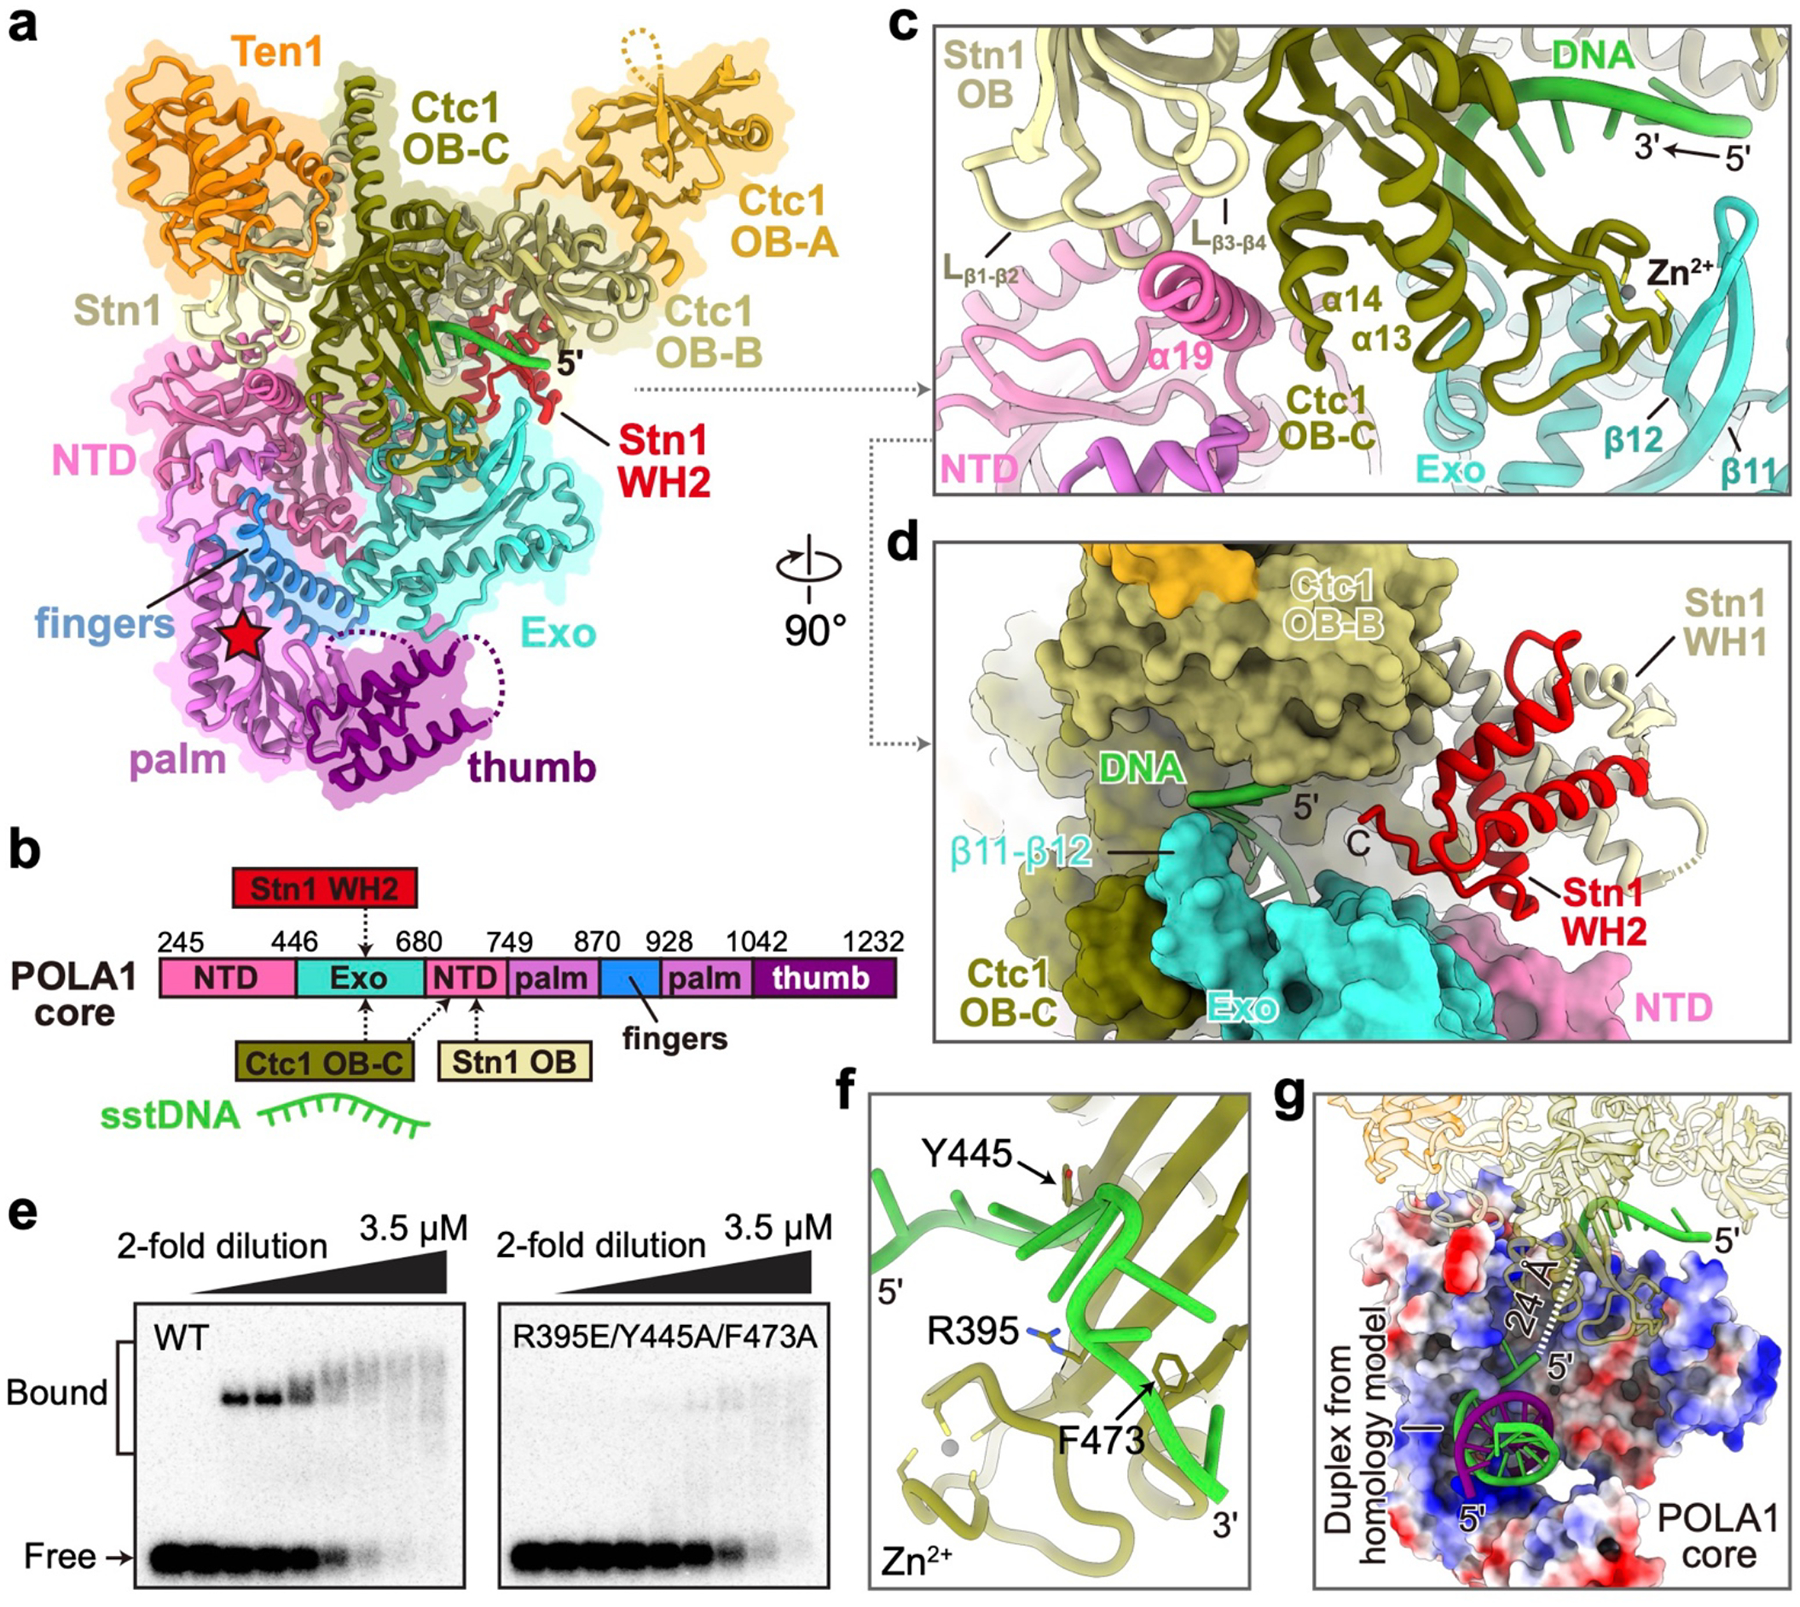
a, Ribbon representation of TtCST and POLA1core with individual protein/domain/motif colored as indicated. Location of POLA1 active site is shown as a red star. NTD, N-terminal domain; Exo, exonuclease domain. b, Structure-based diagram of POLA1core and interactions with TtCST. c, d, Zoom-in views of the interface between POLA1core and TtCST with sstDNA shown from perpendicular directions. e, EMSA of d(GTTGGG)5 DNA binding by wild-type (WT) and Ctc1 mutant TtCST. Wedges indicate two-fold dilutions of TtCST from 3.5 to 0.03 μM. The first lane of each gel is a TtCST-free control. Quantification results of EMSAs were shown in Extended Data Fig. 9j. f, sstDNA binding site on Ctc1 OB-C. Sidechains of residues substituted for EMSA are shown as sticks. g, Zoom-in view of POLA1core (electrostatic surface) with a DNA duplex modeled based on human POLA1 structure47 (PDB 5IUD). The template and product strands in the duplex are colored in green (G-strand) and purple (C-strand), respectively. The path of sstDNA in the channel is shown as dashed line.
Cryo-EM density for ~10 nucleotides of sstDNA is observed on Ctc1 OB-C across the C-shaped binding cleft near the Zn-ribbon (Fig. 4a, c) but side-chain interactions cannot be discerned. Substitution of three residues R395E, Y445A and F473A on the binding surface decreases the KD for sstDNA binding to purified TtCST by ~3-fold (from 0.18 to 0.52 μM), as determined by electromobility shift assays (EMSA) with d(GTTGGG)5 (Fig. 4e, f, Extended Data Fig. 9f–k), verifying the observed DNA binding site. The sstDNA extends 5’→3’ into an entry port, formed by POLA1core NTD and Exo and Ctc1 OB-C (Extended Data Fig. 8h), of a highly basic channel that leads to the active site of POLA1 ~40 Å away, where the primer–sstDNA duplex would bind (Fig. 4g). Since sstDNA is added in excess during the purification, both telomerase and TtCST can bind separate sstDNA strands. No density for sstDNA is visible on TtCST in the absence of PolαPrim, perhaps due to dynamics and/or steric occlusion by interaction of Ctc1 with TERT in the predominant conformation (Fig. 1b, Extended Data Fig. 2i–l).
The sstDNA on Ctc1 OB-C appears positioned for entry into a template (G-strand) binding tunnel on POLA1core, and there is weak density within the tunnel that we attribute to sstDNA (Extended Data Fig. 8i, j), suggesting the possibility that this structure has captured the polymerase mode after handoff from primase. Although no DNA–RNA or DNA–DNA duplex is present in the active site of POLA1, there is unassigned density between POLA1core palm and thumb (Fig. 3a) that fits the dimensions of a G-quadruplex formed by four Tetrahymena telomere repeats48 (Extended Data Fig. 8j). Tetrahymena telomere repeats can form unimolecular G-quadruplexes with 3 or 4 G-quartets in the presence of Na+ or K+, respectively48,49, while G-quadruplexes do not form with Li+ in the absence of other cations. Addition of 50 mM of these cations individually to the activity assay buffer for telomerase–PolαPrim with d(GTTGGG)10 prepared as for the cryo-EM studies decreases C-strand synthesis in the order of increasing G-quadruplex stability, i.e. Li+ > Na+ > K+ 50 (Extended Data Fig. 5j). Since the newly synthesized telomeric DNA is single-stranded as it exits onto Teb140, the slow folding kinetics of G-quadruplexes would likely limit the amount of G-quadruplex formed in vivo prior to G-strand binding on CST–PolαPrim. We propose that the apparent G-quadruplex present in the cryo-EM density may have serendipitously trapped PolαPrim in an incipient inhibited DNA polymerization state. Overall, the structure defines the interface between POLA1 and CST and the pathway of the G-strand from CST to the active site of POLA1, where it provides the template for C-strand synthesis.
Comparison to human CST
While Tetrahymena Stn1 and Ten1 have the same domain structure as human STN1 and TEN1, respectively, human CTC1 (hCTC1) is much larger than Tetrahymena Ctc1, with seven OBs (OB-A through OB-G)19 (Fig. 5a, b, Extended Data Fig. 9a) that may have arisen from a gene duplication of RPA70 (e.g. OB-N,A,B,N,A,B,C). A DALI search of Ctc1 against all proteins in the PDB (see Methods) found the highest structural similarity with hCTC1 (Z-score 14.5). For the individual domains, Ctc1 OB-B and OB-C are most similar to hCTC1 OB-F and OB-G, respectively (Extended Data Fig. 9b, c). A cryo-EM study of hCST with bound sstDNA revealed a decameric structure with D5 symmetry19. Comparing the hCST monomer extracted from the decamer to TtCST shows Ten1/TEN1, Stn1 OB/STN1 OB, and Ctc1 OB-A,B,C/CTC1 OB-E,F,G are positioned similarly (Fig. 5a, b). However, Stn1 WH-WH, which is only visible in the PolαPrim bound TtCST structure, is positioned on Ctc1 OB-B and OB-C (Fig. 5a, Extended Data Fig. 9d), while in hCST STN1 WH-WH is positioned on OB-E and sticks out from the decamer in what has been called the ‘Arm’ conformation19 (Fig. 5b, c). Intriguingly, low resolution cryo-EM densities of monomeric hCST revealed an additional conformation19, called ‘Head’, where hSTN1 WH-WH occupies a position apparently close to that observed in TtCST-bound PolαPrim (Fig. 5c). In our structure, Stn1 WH-WH in this position forms part of the interface with PolαPrim (Fig. 4d). If hCST binds PolαPrim in a similar manner to TtCST, it could only bind as a monomer since the binding interface would be occluded by intermonomer interactions in the hCST decamer.
Fig. 5: Structural comparison of TtCST and hCST.
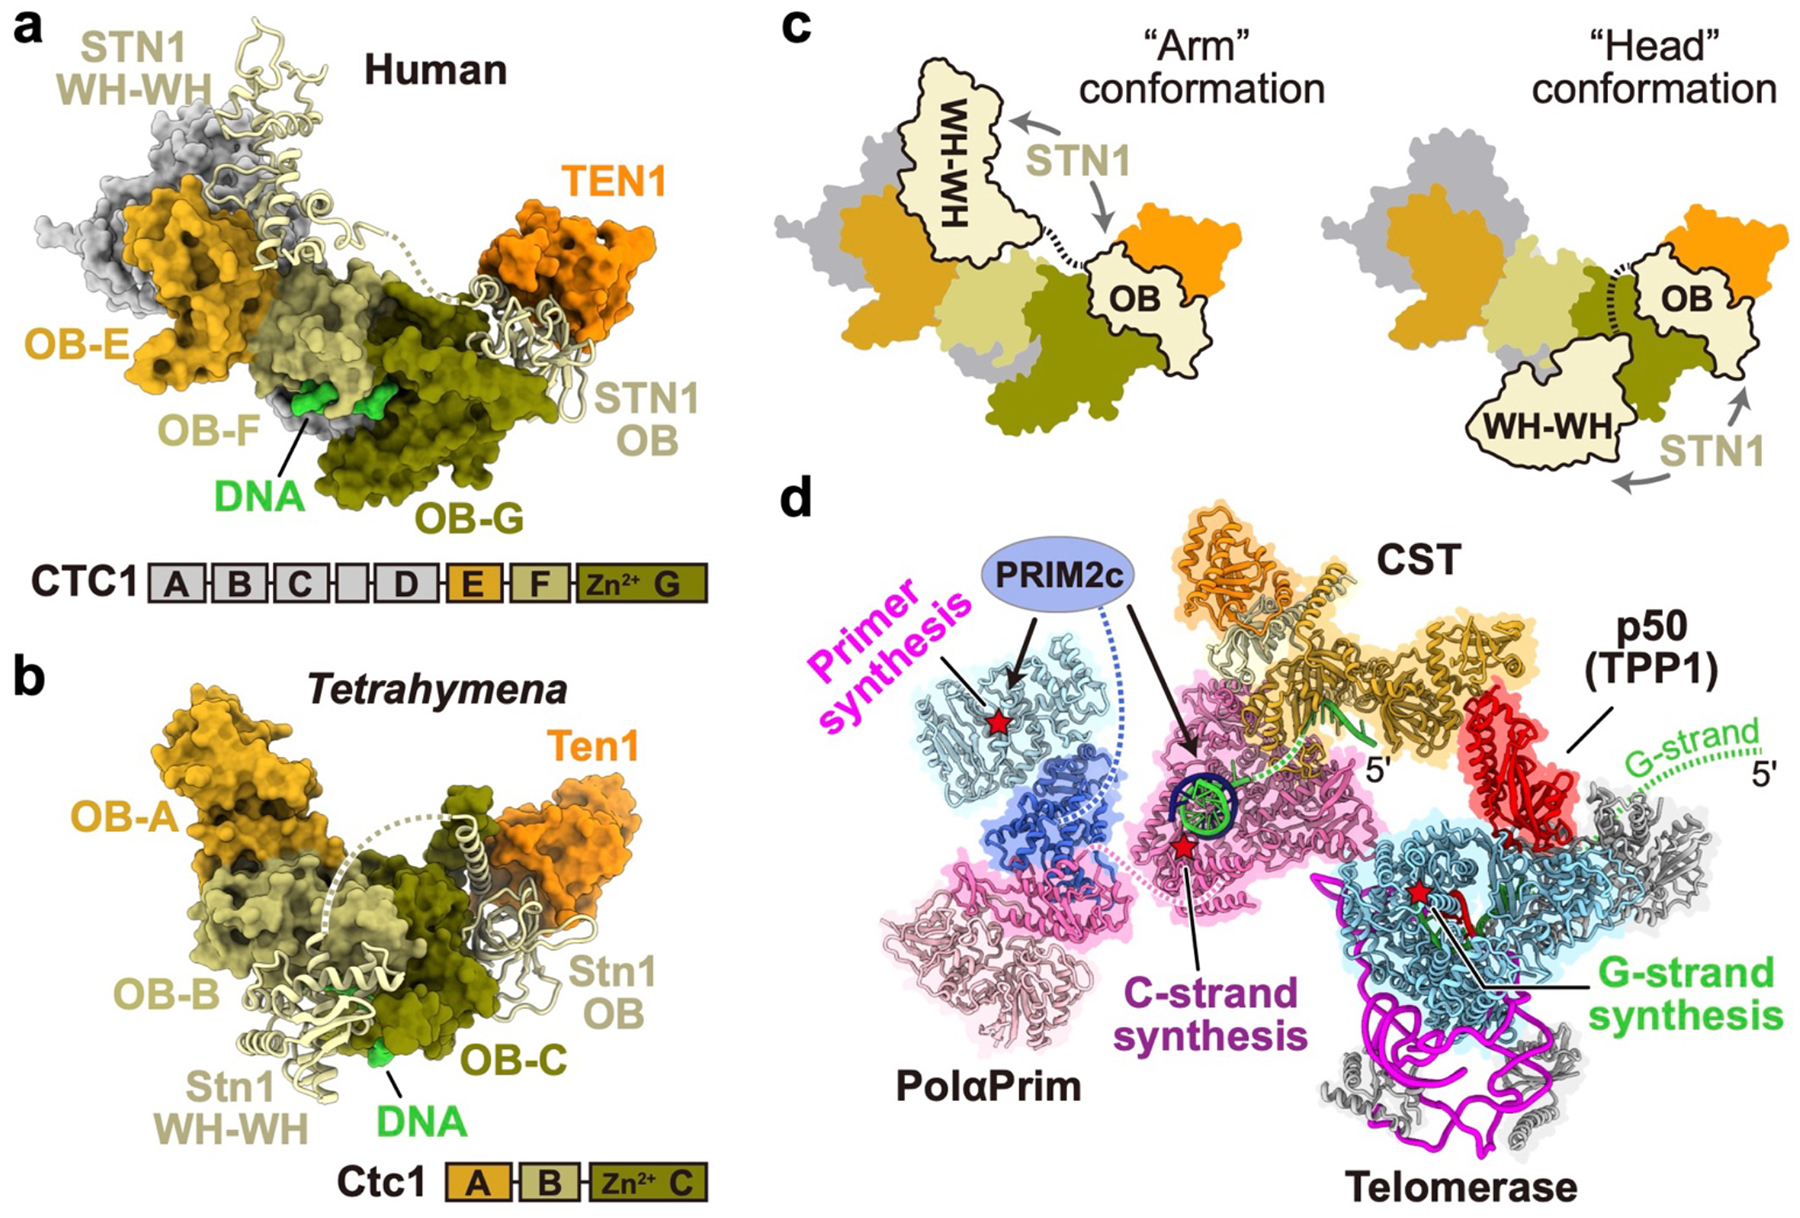
a, b, Surface representation of TtCST (a) and hCST19 (PDB 6W6W) (b) with Stn1/STN1 shown as ribbons. Corresponding subunits/domains are colored the same as indicated. c, Cartoon illustrations of hCST with STN1 WH-WH in “arm” and “head” conformations19. The linker between STN1 OB and WH-WH is shown as dashed line. d, Model of Tetrahymena telomerase holoenzyme in complex with PolαPrim. The DNA duplex on POLA1core is modeled based on a homology model of human POLA1core(ref47) (PDB 5IUD). Position of the POLA2–POLA1CTD–PRIM2N–PRIM1 platform relative to POLA1core is based on a low-resolution cryo-EM map in Extended Data Fig. 7a. Telomeric DNA G-strand and C-strand are colored green and purple, respectively. PRIM2C is shown as an oval connecting to PRIM2N. Active sites on TERT, PRIM1, and POLA1 for the synthesis of G-strand, C-strand primer, and C-strand, respectively, are denoted by red stars. During G-strand and C-strand synthesis, these active sites would be occupied successively for a given G-strand, not simultaneously.
Different but adjacent binding sites for sstDNA are observed for equivalent regions on hCST decamer19 vs TtCST (Fig. 5a, b, Extended Data Fig. 9e). For hCST, the four DNA nucleotides visible in the decameric structure interact with hCTC1 OB-F (Extended Data Fig. 9e), two of which also interact with OB-G19. Comparison of Ctc1 OB-B to CTC1 OB-F shows sequence similarity for the residues on the OB-F binding cleft that interact with the four DNA nucleotides (Extended Data Fig. 9f). To investigate whether there might be a similar DNA interaction on TtCtc1 OB-B (in addition to the ten we observe on OB-C), we substituted three conserved residues (K303E/K306E/F308A), equivalent to a set shown to decrease KD for hCST with sstDNA13,19. These substitutions decrease the KD for d(GTTGGG)5 by ~1.5-fold as assayed by EMSA (Extended Data Fig. 9i–k). Substitution of two conserved aromatic residues (F264A/Y268A) that might contribute to DNA binding through stacking interactions13,19 decreases KD by 1.2-fold (Extended Data Fig. 9i–k). Together, these comparisons suggest hCTC1 C-terminal OB-E, -F, -G may interact with POLA1 and sstDNA in a similar manner to Ctc1 OB-A, -B, -C, and that PolαPrim interaction could only be accommodated on monomeric CST.
Coordinated synthesis of G and C strands
Co-ordinated synthesis of telomeric G- and C-strands in vertebrates is orchestrated by interactions between telomerase, shelterin proteins TPP1 and POT1, sstDNA, CST, and PolαPrim, whose molecular details have been largely undefined. Taking advantage of the constitutive association of p50/TPP1, Teb1 (a POT1 orthologue), and TtCST with Tetrahymena telomerase along with previous structural studies of telomerase22,40 we determined structures and interfaces between all of these components. TtCST Ctc1 C-terminal domain OB-C and Stn1 bind to PolαPrim POLA1 and Ctc1 N-terminal domain OB-A binds p50/TPP1 (Fig. 5d). p50/TPP1 OB in turn binds to TERT TEN–TRAP domains, constitutively in Tetrahymena but transiently to recruit telomerase to telomeres in humans32,33,40. Biochemical studies have shown that hCST binds G-strands released from telomerase during telomere repeat synthesis12,13, and our structures and activity assays verify these results in Tetrahymena. Our structures show that TtCST binds p50 on a flexible hinge (CBM), placing it in proximity to where the 3’-end of sstDNA released from the TER template would be. Teb1, that also interacts with p50 and TERT TEN domain, could contribute by initially maintaining a hold on the 5’ exiting DNA until it binds TtCST. C-strand synthesis requires that the G-strand be released from telomerase catalytic core, to provide the 3’-end of the G-strand as the template for C-strand synthesis. PRIM2c is proposed to bind the RNA–DNA duplex and hand it off from the primase to the active site of POLA18 (Fig. 5d). Our structure explains how CST enhances the activity of POLA1, by binding the G-strand and feeding it into the entry port for the POLA1 template channel (Fig. 4g). The autoinhibited conformation of PolαPrim45,46 would be occluded in the CST–PolαPrim complex, possibly explaining how CST could enhance the primase-to-polymerase switch44. It is less clear how CST binding could activate PRIM1 for primer synthesis, consistent with proposals for a large conformational switch between priming and polymerization steps8. Here we have captured a pre-DNA C-strand polymerization step in a PolαPrim complex with Tetrahymena telomerase RNP core, CST, p50, and TEB, linking G-strand and C-strand synthesis in an almost complete telomere-end replicon.
Methods
Tetrahymena PolαPrim cloning and expression.
Tetrahymena PolαPrim complexes were expressed using the Bac-to-Bac system (Thermo Fisher Scientific) in Sf9 cells. Briefly, cDNAs encoding Tetrahymena POLA1 (Accession number: Q23AJ0), POLA2 (I7MAE1), PRIM1 (Q24HY6) and PRIM2 (Q246C7) were chemically synthesized and purchased from IDT (Integrated DNA Technologies, Inc.). To co-express the POLA1–POLA2 complex, POLA1 and POLA2 cDNAs were cloned into a pFastBacDual vector (Thermo Fisher Scientific), under the polyhedrin promoter and the p10 promoter, respectively. The POLA1 has an N-terminal hexa-histidine-TEV (His6-TEV) tag, in which TEV is a tobacco etch virus protease cleavage site. To co-express the POLA1–POLA2–PRIM1–PRIM2 complex, PRIM1 and PRIM2 cDNAs were cloned into a separate pFastBacDual vector. The expression vectors were used to make baculoviruses based on the established protocol for Bac-to-Bac system (Thermo Fisher Scientific). Sf9 cells (2.0 × 10⁶/ml) were transfected with viruses using a multiplicity of infection (MOI) of 3 at 27°C in SF-900™ II SFM media (Thermo Fisher Scientific). The cells were harvested 48 h after infection and stored at −80°C until purification.
Tetrahymena CST–p50 cloning and expression.
Tetrahymena CST–p50 complex was expressed in insect cells. Briefly, cDNAs encoding p50 (D2CVN8), Ctc1/p75 (A0PGB2), Stn1/p45 (Q6JXI5) and Ten1/p19 (D2CVN7) were chemically synthesized and purchased from IDT (Integrated DNA Technologies, Inc.). The Ctc1 and p50 cDNAs were cloned into a pFastBacDual vector (Thermo Fisher Scientific), with a His6-TEV tag fused onto the N-terminal of Ctc1. The Stn1 and Ten1 cDNAs were cloned into a separate pFastBacDual vector for baculoviruses expression. Sf9 cells (2.1 × 10⁶/ml) were transfected with viruses using a multiplicity of infection (MOI) of 3 at 27°C in SF-900™ II SFM media (Thermo Fisher Scientific). The cells were harvested 48 h after infection and stored at −80°C until purification.
Purification of Tetrahymena PolαPrim and CST–p50 complexes.
The purification steps for both POLA1–POLA2–PRIM1–PRIM2 and p50–Ctc1–Stn1–Ten1 were performed at 4°C using an AKTA chromatography system with prepacked columns (GE Healthcare), following the same protocol. Cells were suspended in buffer A [30 mM Tris-HCl (pH 7.5), 200 mM NaCl, 10% (v/v) glycerol, 1mM dithiothreitol (DTT), and 25 mM imidazole] supplemented with protease inhibitor cocktail (Sigma), lysed by sonication, and centrifuged at 34,000×g for one hour. The supernatant was applied onto a 5-ml HisTrap HP column pre-equilibrated in buffer A. The column was washed with buffer A and the complex was eluted with buffer B [30 mM Tris-HCl (pH 7.5), 1 M NaCl, 10% (v/v) glycerol, 1mM DTT, and 400 mM imidazole]. The protein complex was digested overnight with 0.2 mg/ml TEV protease and buffer-exchanged to buffer A. The digest was applied onto a 5-ml HisTrap HP column pre-equilibrated in buffer A. The target complex was isolated in the column flow-through, concentrated to 10 ml, and then applied onto a Superdex 200 gel filtration column pre-equilibrated in buffer C [25 mM Tris-HCl (pH 7.5), 150 mM NaCl, and 1mM DTT]. The complex was collected from peak fractions and analyzed by SDS polyacrylamide gel electrophoresis.
NMR sample preparation.
cDNAs of Ctc1 OB-A (residues 1–183) and p50 peptides (Extended Data Fig. 4a) were cloned into the pETduet vector with a His6-MBP-TEV tag at the N terminus of each construct, and expressed by Escherichia coli strain BL21(DE3). 2H,13C,15N-labelled Ctc1 OB-A was expressed from M9 minimal media with 0.5 liters of D2O, 2 g of 13C D-glucose, and 0.5 g of 15N ammonium chloride, while 13C,15N-labelled p50 peptide was expressed from M9 minimal media with 13C D-glucose and of 15N ammonium chloride. Cultures were grown to mid-log phase at 37°C, induced by the addition of β-D-1-thiogalactopyranoside (IPTG) to a final concentration of 0.5 mM, and incubated at 18°C for an additional 12 h before harvesting by centrifugation. The purification steps for Ctc1 OB-A and p50 peptides were similar to those for Tetrahymena PolαPrim described above. Briefly, cells were re-suspended in buffer A, lysed by sonication and centrifuged at 4,500×g for 30 min. The supernatant was loaded onto a 5-ml HisTrap HP column pre-equilibrated in buffer A. The column was washed with buffer A and the protein was eluted with buffer B. The protein was digested overnight with 0.2 mg/ml TEV protease and buffer-exchanged to buffer A. The digest was applied onto a 5-ml HisTrap HP column pre-equilibrated in buffer A. The flow-through was concentrated and further purified on an Superdex 75 gel filtration column pre-equilibrated in buffer C. Fractions containing pure protein were pooled, buffer exchanged into protein NMR buffer [20 mM Tris (pH 7.5), 50 mM NaCl, 1 mM TCEP, 3 mM NaN3, and 8% D2O], and concentrated to 0.5–0.8 mM for NMR studies.
NMR spectroscopy and data processing.
NMR experiments were performed at 298 K on 800 and 600 MHz Bruker spectrometers equipped with HCN cryoprobes. The backbone assignments of Ctc1 OB-A were obtained using the TROSY-type HNCACB, HN(CO)CACB, HNCA, HN(CO)CA, HNCO, and HN(CA)CO spectra collected on an 800 MHz Bruker instrument with 2H,13C,15N-labeled Ctc1 OB-A. Conventional triple resonance backbone assignment experiments (HNCACB, CBCA(CO)NH, HNCA, HN(CO)CA) were used for p50 peptide (228–250) backbone assignments. Spectra were collected and processed using Topspin 4.1, and analyzed with CARA (http://cara.nmr.ch) and NMRFAM Sparky51 to interactively obtain sequence-specific resonance assignments. NOE peak lists were automatically generated by Atnos52, and assigned by CYANA 3.98 (ref53). Secondary structure of Ctc1 OB-A and p50 peptide (228–250) were predicted by software TALOS+ (ref54). Models of p50 peptide (228–250) were predicted by CS-Rosetta55 using chemical shift data. Cα RMSD of the 10 lowest energy models is 1.73 Å, suggesting a high confidence of the prediction. To investigate the interaction between Ctc1 OB-A and p50 peptides, 1H-15N HSQC spectra of titration of unlabeled p50 peptides with labeled Ctc1 OB-A and unlabeled Ctc1 OB-A with labeled p50 peptides were obtained, respectively. Chemical shift mapping was analyzed by comparing the apo and bound-form HSQC spectra. The chemical shift perturbation value for each residue was calculated as (ref56). The backbone assignments of 2H,13C,15N-labeled Ctc1 OB-A in the presence of unlabeled p50 peptide (228–250) were obtained using the same TROSY-type spectra as listed above, while the backbone assignment of 13C,15N-labeled p50 peptide (228–250) in the presence of unlabeled Ctc1 OB-A were obtained using conventional triple resonance spectra.
Telomerase sample preparation.
Tetrahymena telomerase holoenzyme was expressed and purified as described previously40,57. To prepare the telomerase–PolαPrim complex sample, 0.5 μM of purified POLA1–POLA2–PRIM1–PRIM2 was incubated with telomerase holoenzyme at the anti-Flag M2 affinity gel (Sigma) step overnight at 4°C, in the presence of excess d(GTTGGG)10 primer. Excess DNA and PolαPrim were removed with wash buffer [20 mM HEPES (pH 8.0), 50 mM NaCl, 1 mM MgCl2, 1 mM TCEP, 10% (v/v) glycerol, 0.1% (v/v) IGEPAL CA-630] and the final product was eluted using a small volume (30–50 μL) of elution buffer [20 mM HEPES (pH 8.0), 50 mM NaCl, 1 mM MgCl2, 1 mM TCEP, and 0.1% (v/v) IGEPAL CA-630] supplemented with 1 mg/mL 3× FLAG peptide.
Cryo-EM specimen preparation and data collection.
For telomerase–PolαPrim complex, 3 μL of the purified sample was applied to glow-discharged lacey carbon grids with a supporting ultrathin carbon film (Ted Pella). The grids were then blotted with filter paper and flash-frozen in liquid ethane using an FEI Vitrobot Mark IV at 10°C and 100% humidity. Cryo-EM grids of PolαPrim were prepared similarly with Quantifoil 200 mesh R2/1 grids. Cryo-EM grids were loaded into a ThermoFisher Titan Krios electron microscope operated at 300 kV for automated data collection using SerialEM58. Movies of dose-fractionated frames were acquired with a Gatan K3 direct electron detector in super-resolution mode at a pixel size of 0.55 Å on the sample level. A Gatan Imaging Filter (GIF) was inserted between the electron microscope and the K3 camera and operated at zero-loss mode with the slit width of 20 eV. The microscope was carefully aligned prior to each imaging session and parallel beam was optimized using coma-free alignment in SerialEM. The total dose rate on the sample was set to ~55 electrons/Å2, which was fractionated into 50 frames with 0.06 s exposure time for each frame. For telomerase–PolαPrim, 36,716 movies were collected in two separate imaging sessions with the same batch of cryo-EM grids. For PolαPrim, 7,120 movies were collected in a single imaging sessions.
Cryo-EM data processing.
Cryo-EM data processing workflows are outlined in Extended Data Fig. 1, 6 and 7 for the structure determination of TtCST in telomerase, PolαPrim-bound TtCST in telomerase, and PolαPrim alone, respectively. All steps described below were performed with RELION 3.1 (ref59) unless otherwise indicated.
To determine TtCST structure, telomerase particles selected from three published datasets (the T3D2, T4D4 and T5D5 datasets as detailed in ref40) were combined, resulting in over 2.5 million good particles (Extended Data Fig. 1a). Refinement of these particles without a mask generated a reconstruction with only weak density for TtCST, which confirms the multiple orientation of TtCST relative to the rest of telomerase holoenzyme22. To separate particles with TtCST at different positions, an alignment-free 3D classification was performed using a spherical mask covering the TtCST region (mask1). Particles from classes with TtCST at similar positions were grouped together and refined, resulting in three reconstructions (P1, P2 and P3 in Extended Data Fig. 1a), among which P1 has the best density and the largest number of particles. To improve the overall density of P1, we performed another round of 3D classification with local angular search (RELION options: --sigma_ang 8--healpix_order 4). A soft mask (mask2) was used in this step to exclude the flexible p65. 259,330 particles from the best class were selected for 3D refinement, following by refinement of contrast transfer function (CTF) parameters and Bayesian polishing in RELION. The resulting “shiny” particles were refined to 3.5 Å resolution for the entire telomerase holoenzyme including TtCST (Extended Data Fig. 1b–d). An additional focused 3D classification step was conducted to improve the local resolution of Ctc1 OB-A. The resulting 78,471 particles were refined to 3.8 Å resolution using mask2.
For the newly collected telomerase–PolαPrim and PolαPrim datasets, dose-fractionated frames of each movie were 2x binned (pixel size of 1.1 Å), aligned for the correction of beam-induced drift, and dose weighted using RELION’s implementation of UCSF MotionCor2 (ref60). CTF parameters, including defocus and astigmatism, of each dose-weighted micrograph were determined by CTFFIND4 (ref61) within RELION.
Two datasets of telomerase–PolαPrim, one for each data collection session, were initially processed separately (Extended Data Fig. 6a). Particles picked from 2,000 representative micrographs using template-free auto-picking in RELION were screened by 2D classification, and the best particles were selected to train a particle detection model in Topaz62 for subsequent neural-network based particle picking for all micrographs. After several rounds of 2D and 3D classifications as detailed in Extended Data Fig. 6a, good particles selected from two datasets were combined, resulting in over 1.6 million particles. Refinement of these particles without using any mask generated a reconstruction with only weak density for TtCST–PolαPrim, suggesting that TtCST–PolαPrim also has multiple orientations relative to the rest of telomerase holoenzyme, including telomerase core RNP, TEB heterotrimer and p50, as previously observed for the TtCST dataset (Extended Data Fig. 1a). Therefore, these two parts were processed separately in the following steps. For telomerase core RNP–TEB–p50, a soft mask was used to exclude the dynamic TtCST–PolαPrim during 3D refinement, which resulted in a 3.1 Å resolution reconstruction. After an additional round of focused classification with local angular search in 8° (RELION options: --sigma_ang 8 --healpix_order 4), 539,078 particles from the best class were selected and refined to 2.9 Å resolution (Extended Data Fig. 6b, c). For TtCST–PolαPrim, three rounds of alignment-free 3D classification with an optimized regularization parameter (RELION option: --tau2_fudge 16) were performed in parallel using a spherical mask covering the TtCST–PolαPrim region (mask2). 427,158 particles from classes with interpretable TtCST–PolαPrim densities were combined after removing duplicates. Refinement of these particles generated a reconstruction with clear TtCST–PolαPrim density. Then, we shifted the center of each particle to TtCST–PolαPrim and performed signal subtraction using mask4 to only keep the signal from TtCST–PolαPrim. After two rounds of 3D classification using mask4, 142,912 particles were selected and refined using the same mask, which resulted in a 4.2 Å resolution reconstruction for TtCST–PolαPrim (Extended Data Fig. 6b, d). These particles were back projected to original particles without signal-subtraction and refined to 4.4 Å resolution for the entire complex including both telomerase and TtCST–PolαPrim.
For the PolαPrim dataset (Extended Data Fig. 7), particle picking was conducted using Topaz62 in a similar way as described above for the PolαPrim bound telomerase datasets. After two rounds of 2D classification, 1.3 million particles were selected and refined using an initial model generated by cryoSPARC63. The resulting cryo-EM map has a “head” that is the catalytic core domain of POLA1 and a bow-tie-shaped “body” that contains POLA2, PRIM1, PRIM2N and the C-terminal domain of POLA1. The “head” and the “body” have multiple orientations relative to each other as indicated by their low-resolution densities in the 3D reconstruction and the 2D classification results (Extended Data Fig. 7b). Focused refinement of the “head” didn’t work well due to its small size, but focused refinement of the “body” generated a map with clear secondary structure features. After one round of 3D classification using the same mask for the “body”, 264,498 particles were selected and refined to 4.5 Å resolution. During the 3D classification step, a notable hinge movement was observed within the “body”. Due to that, we further refined the two halves of the “body” individually and obtained a 4.0 Å resolution reconstruction for POLA2–POLA1CTD–PRIM2N and a 4.3 Å resolution reconstruction for PRIM2N–PRIM1 (Extended Data Fig. 7c–e).
All cryo-EM maps were sharpened with a negative B-factor and low-pass filtered to the stated resolution using the relion_postprocess program in RELION. Local resolution evaluations were determined by ResMap64 with two independently refined half-maps. Directional resolution anisotropy analyses were performed using 3DFSC65. Data collection and processing statistics are given in Extended Data Table 1.
Model building and refinement.
For the modeling of TtCST, two maps were generated from the 3.5 Å resolution cryo-EM reconstruction: an unsharpened map with the best density continuity was used for backbone tracing and secondary structure assignment, and a sharpened map with the best high-resolution features was used to place Cα and sidechain of individual residues. Crystal structures of Tetrahymena Ten1–Stn1-OB22,23 (PDB 5DOI and 5DFM) and cryo-EM structure of Tetrahymena telomerase RNP–TEB–p5040 (PDB 7LMA) were initially rigid-body fitted into the maps using UCSF Chimera66, and refined manually in COOT67. Density of Ctc1 was traced from its signature C-terminal α helix, and models of OB-C and OB-B were built de novo against the density in COOT. Visible densities of amino acid residues with bulky side chains, such as Phe, Tyr and Trp were used as guidance for sequence assignment (Extended Data Fig. 1g). For Ctc1 OB-A, an initial model was built against the cryo-EM density and refined manually with structure information obtained from NMR (Extended Data Fig. 3). Briefly, secondary structure information obtained from TALOS+ (ref54) was used to define the boundaries of β strands within the OB (Extended Data Fig. 3d), and 105 inter-β-strand NOE restraints were used to refine the relative position of the β strands (Extended Data Fig. 3e). Lastly, p50 residues 184–208 following the C-terminus of the previous p50 OB model40 (PDB 7LMA) were built into the cryo-EM map adjacent to Ctc1 OB-A (Extended Data Fig. 1h).
For the modeling of TtCST–PolαPrim, the TtCST model obtained as described above, crystal structures of Stn1 WH-WH22,23 (PDB 5DFN and 5DOK), and a computed model of POLA1 core generated using AlphaFold2 (ref68) were initially rigid-body fitted into the 4.2 Å resolution map (Extended Data Fig. 6d) using UCSF Chimera66, and refined manually in COOT67 (Extended Data Fig. 6h–j). A segment of sstDNA was built manually against the density in the C-shape cleft of Ctc1 OB-C. The previously reported cryo-EM structure of Tetrahymena telomerase RNP–TEB–p5040 (PDB 7LMA) was refined against the 2.9 Å resolution map (Extended Data Fig. 6c).
For the modeling of PolαPrim platform (POLA2–POLA1CTD–PRIM2N–PRIM1), a composite cryo-EM density map was generated using the “combine focused maps” function in Phenix69 with two focused refined maps (Extended Data Fig. 7a, e). Computed models of individual subunits generated using AlphaFold2 (ref68) were rigid-body fitted into the composite map and refined manually in COOT67 (Extended Data Fig. 7g).
All models were refined using Phenix69 in real space with secondary structure, Ramachandran, and rotamer restraints. Refinement statistics of the models are summarized in Extended Data Table 1. Model vs map FSC validations were shown in Extended Data Fig. 1f, 6f and 7f. Structural similarity analyses were conducted using the Dali sever70. Sequence alignment results were presented using Jalview71. All figures presenting the model were prepared using UCSF ChimeraX72.
Telomerase–PolαPrim activity assays.
The direct telomerase activity assays were carried out as previously described40 in 20 μl solutions containing 50 mM Tris-HCl pH 8.0, 2 mM Mg2+, 1 mM spermidine, 2 mM TCEP, 200 μM dTTP, 3 μM dGTP, 5 μCi dGTP [α−32P] (Perkin-Elmer, 6000 Ci/mmol), 20 nM telomerase-PolαPrim and 1 μM d(GTTGGG)3 or d(GTTGGG)10 primer as indicated. The C-strand synthesis assay was carried out in 20 μl solutions containing 50 mM Tris-HCl pH 8.0, 2 mM Mg2+, 1 mM spermidine, 2 mM TCEP, 500 μM dATP, 3 μM dCTP, 5 μCi dCTP [α−32P] (Perkin-Elmer, 3000 Ci/mmol), 0.2 mM ATP, 0.2 mM CTP, 1 μM d(GTTGGG)10 primer and 20 nM telomerase-PolαPrim or PolαPrim as indicated. Reactions were performed at 30 °C for 60 min and stopped with quench buffer [10 mM Tris-HCl pH 8.0 and 10 mM EDTA].
The complete telomere replication reactions were carried out in 20 μl solutions containing 50 mM Tris-HCl pH 8.0, 2 mM Mg2+, 1 mM spermidine, 2 mM TCEP, 2 μM dTTP, 3 μM dGTP, 500 μM dATP, 3 μM dCTP, 0.2 mM ATP, 0.2 mM CTP, 1 μM d(GTTGGG)3 primer and 20 nM telomerase-PolαPrim. Either additional 5 μCi dGTP [α−32P] was supplemented to visualize the G-strand synthesis or 5 μCi dCTP [α−32P] to visualize the corresponding C-strand synthesis. The reactions were performed at 30 °C and stopped with quench buffer at indicated times. All products were phenol–chloroform-extracted and ethanol-precipitated together with a 15 nt 32P-end-labelled DNA oligonucleotide as a recovery control and resolved on a 10% denaturing polyacrylamide gel. The gels were dried and exposed to a phosphor imaging screen and scanned on an Amersham Typhoon scanner (GE Lifesciences).
Electrophoretic mobility shift assay (EMSA).
EMSAs were conducted following a previously reported method13. TtCST and its mutants were expressed and purified from insect cells as described above. For each binding reaction, 0.5 nM 32P-labeled primer (for Extended Data Fig. 9h) or 0.5 nM 32P-labeled primer plus 20 nM unlabeled primer (for Fig. 4e and Extended Data Fig. 9i) was incubated with or without TtCST in 10 μl EMSA buffer [20 mM HEPES-NaOH (pH 8.0), 150 mM NaCl, 2 mM MgCl2, 5% (v/v) glycerol, 50 ug/ml BSA, 1uM random hexamer (Invitrogen), 0.05% (v/v) Tween-20, and 1 mM TCEP] for 1 hour on ice before being loaded onto a 0.5× TBE, 0.7% SeaKem® LE agarose (Lonza) gel. The gels were run at 6.8 v/cm in 0.5× TBE buffer for 40 mins and then vacuum dried onto a Hybond-N+ membrane (Cytiva) with 2 pieces of 3MM chromatography paper (Whatman™). The gels were exposed to a phosphor imaging screen overnight. The final images were obtained by scanning the screen on an Amersham Typhoon scanner (GE Lifesciences) and then quantified with QuantityOne (Bio-rad). The dissociation constant (KD) was calculated by fitting the Hill equation using the fraction of protein bound primer θ. , , where Pf is the unbound protein concentration, Pt is the total protein concentration, Dt is the total DNA concentration, and n is the Hill coefficient. KD numbers obtained using the simplified Hill equation (Pf ≈ Pt) were 2–5% higher.
Statistics and reproducibility.
POLA1–POLA2 and its complex with telomerase were successfully purified three times. POLA1–POLA2–PRIM1–PRIM2 and its complex with telomerase were successfully purified more than ten times. TtCST were successfully purified more than three times for WT and each Ctc1 variant. SEC profiles and protein gels shown in Extended Data Fig. 5a, 5c, 5e, 5f, and 9g present representative results. EMSAs of d(GTTGGG)5 DNA binding by WT and Ctc1 mutant TtCST shown in Fig. 4e and Extended Data Fig. 9i were successfully repeated three times. EMSAs of variant sstDNA binding by WT TtCST shown in Extended Data Fig. 9h were successfully repeated two times. Activity assay results shown in Fig. 3c and Extended Data Fig. 5i–j were successfully repeated three times for each condition.
Extended Data
Extended Data Fig. 1: Cryo-EM data processing workflow of TtCST in telomerase holoenzyme and evaluations of the final reconstructions.
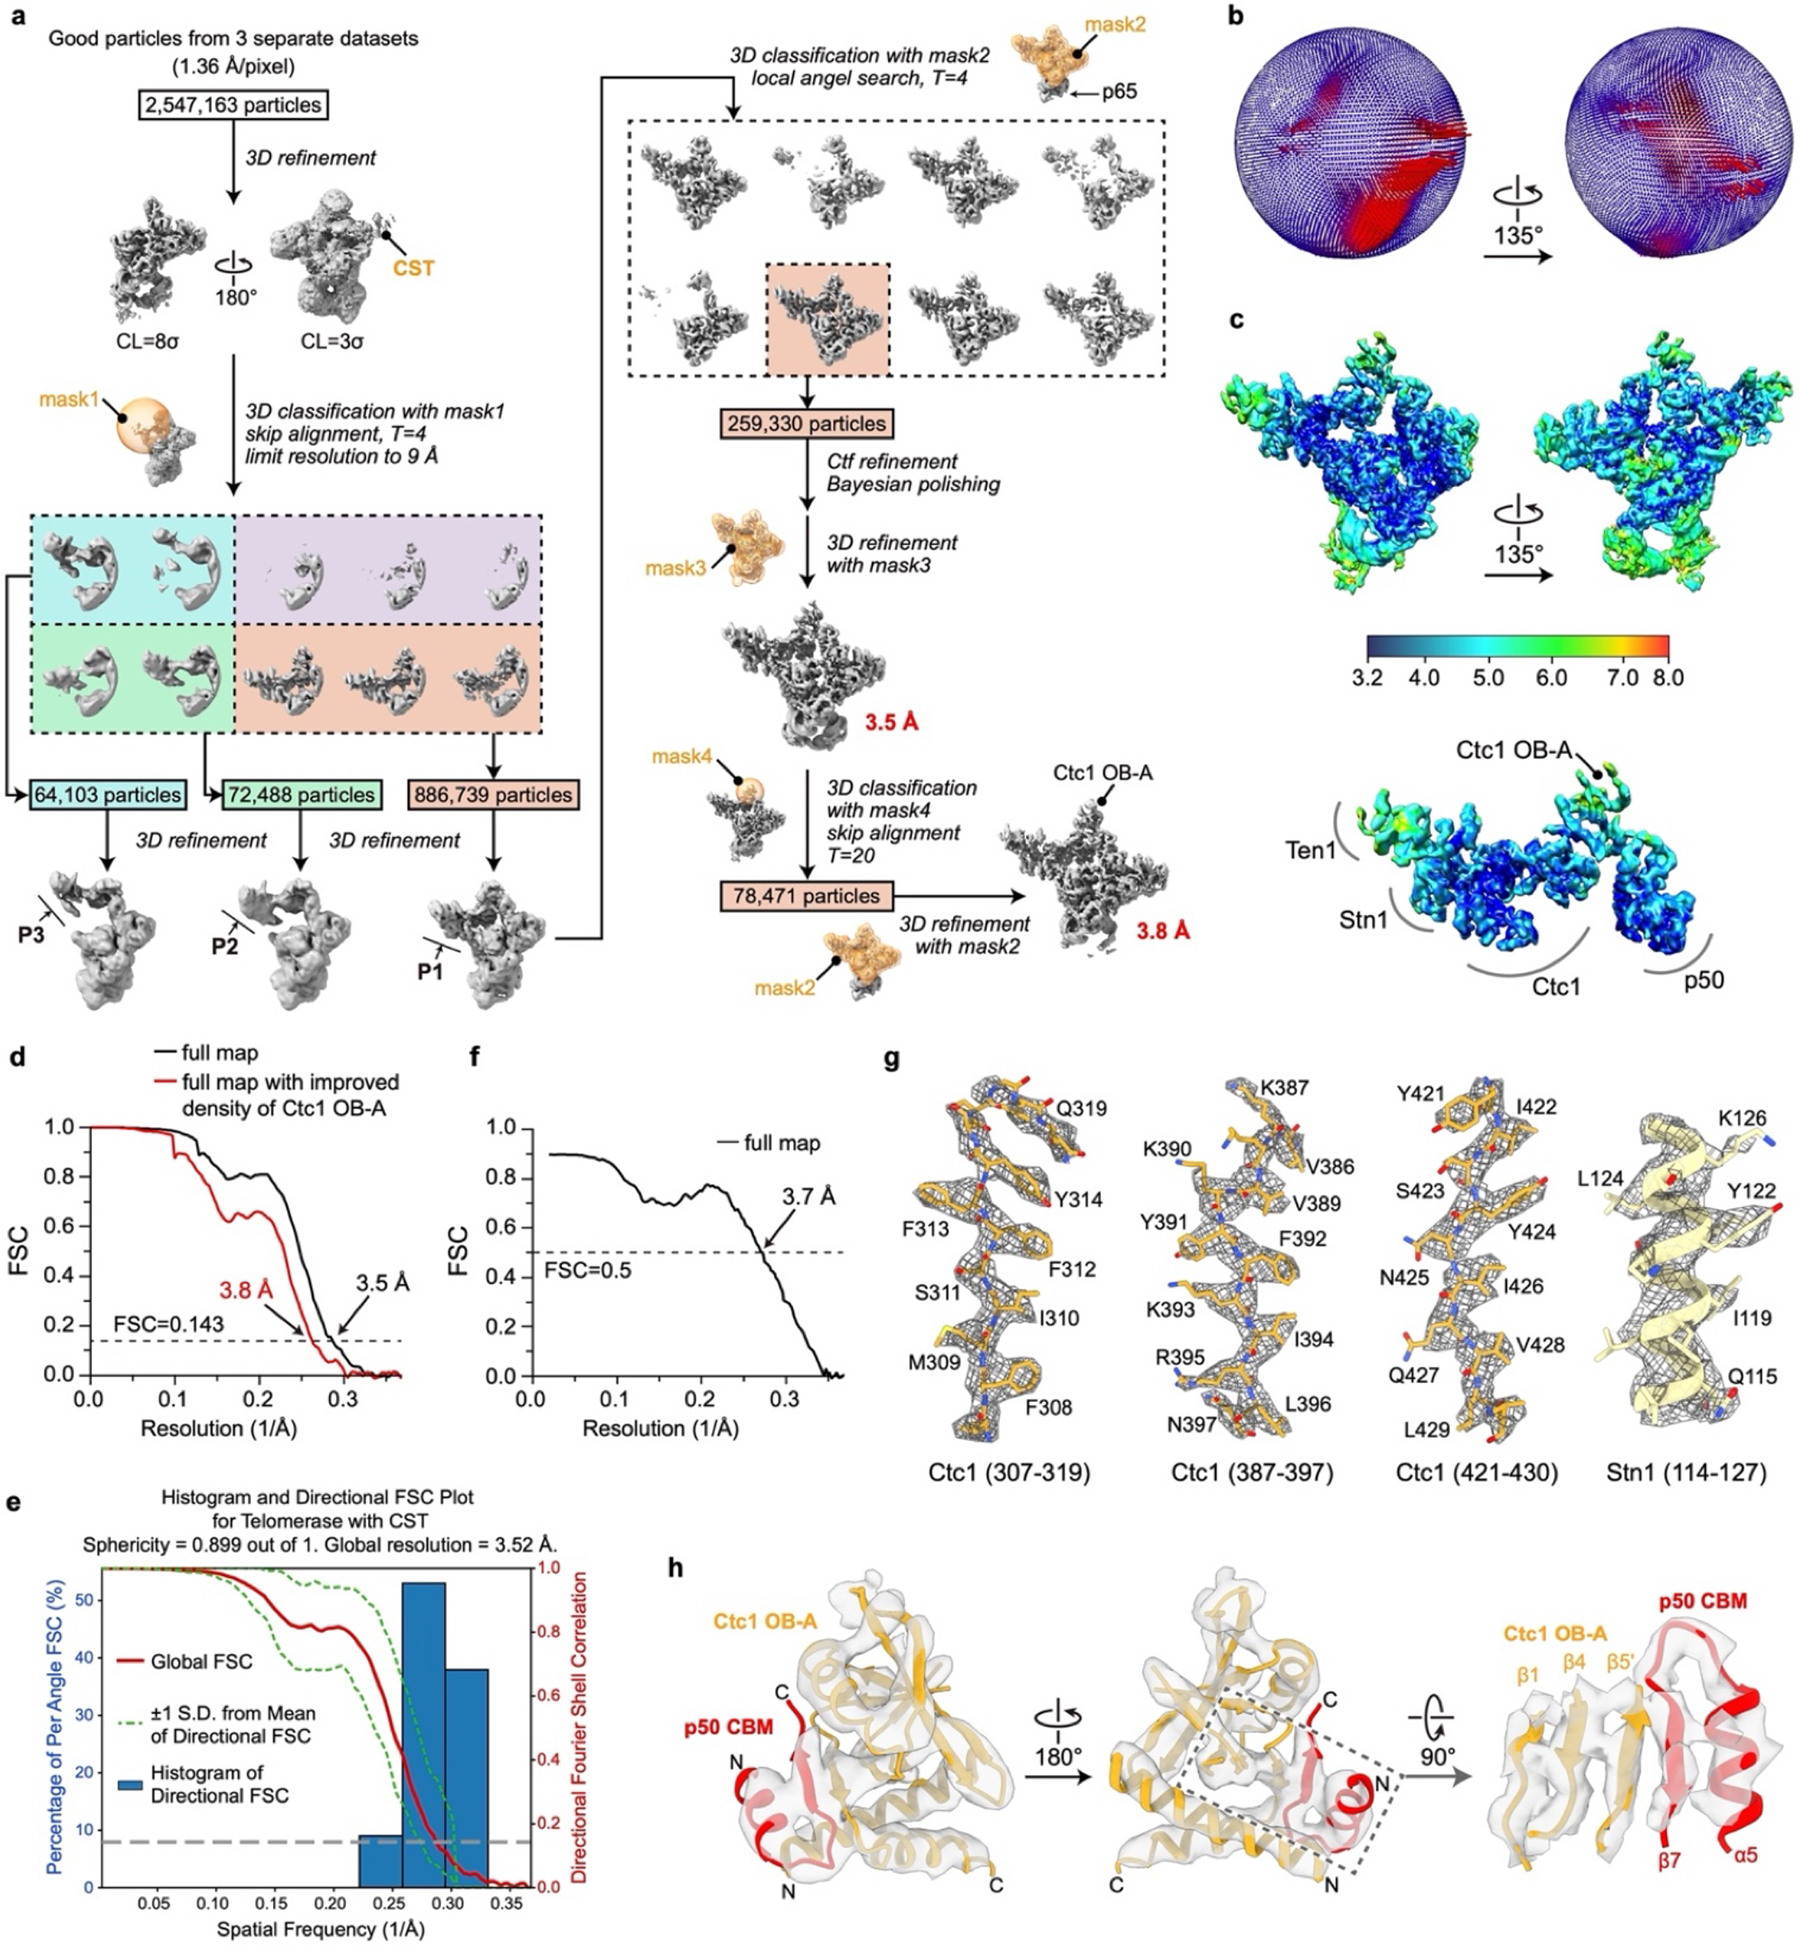
a, Data processing workflow (detailed in Methods). b, Euler angle distributions of particles used for the final 3.5 Å resolution reconstruction. c, Local resolution evaluation of the 3.5 Å resolution reconstruction shown for overall map (upper) and for the TtCST–p50 region (lower). d, Plot of the Fourier shell correlation (FSC) as a function of the spatial frequency demonstrating the resolutions of final reconstructions. e, 3D FSC analysis65 of the 3.5 Å resolution reconstruction. Shown are the global FSC (red line), the spread of directional resolution values (area encompassed by the green dotted lines) and the histogram of directional resolutions evenly sampled over the 3D FSC (blue bars). A sphericity (0.5 threshold) of 0.899 indicates almost isotropic angular distribution of resolution (a value of 1 stands for completely isotropic angular distribution). f, FSC coefficient as a function of spatial frequency between model and cryo-EM density map. g, Representative cryo-EM densities (gray and mesh) encasing the related atomic models (colored sticks and ribbons). h, Superimposition of cryo-EM densities (low-pass filtered to 5 Å) and model of Ctc1 OB-A in complex with p50 CBM.
Extended Data Fig. 2: Structural details of TtCST.
a, Domain organization of TtCST subunits. Invisible regions in the cryo-EM map are shown as dashed boxes. Intermolecular interactions are indicated as gray shading. b, Ribbon diagrams of TtCST subunits/domains with secondary structure elements labelled. Unmodeled regions are shown as dashed lines. Crystal structure of Ten1–Stn1 OB23 (PDB 5DOI) is shown in gray and overlayed with the cryo-EM structure for comparison. c, Ribbon representation of TtCST structure with individual OB domain colored as indicated. d, Zoom-in view of the interface between Ctc1 OB-C and Stn1 OB. Salt bridge and hydrogen-bonding interactions are shown as dashed yellow lines. e, Two arginine sidechains on Stn1 OB (ribbon) clamp D499 on Ctc1 OB-C (electrostatic surface). f, g, Detailed interactions between Stn1 OB and Ten1. h, Close-up views of the cryo-EM densities of the interfaces between CST subunits (Fig. 1e, Extended Data Fig. 2d–g). i, Overall view of the interface between TtCST and TERT–TER. j-l, Zoom-in views of interactions between TtCST and TERT–TER as indicated in dashed boxes in h. These interactions stabilize TtCST in the predominant conformation.
Extended Data Fig. 3: NMR spectra and structural study of Ctc1 OB-A with p50 peptide.
a, Assigned 1H-15N HSQC spectrum of 15N-labelled Ctc1 OB-A (residues 1–183) in the presence of unlabeled p50 peptide (residues 228–250). Inset shows the expanded central region of the spectrum. b, Superimposed 1H-15N HSQC spectra of 15N-labelled Ctc1 OB-A in the presence (yellow) and absence (gray) of unlabeled p50 peptide. Signals from the same residues with chemical shift differences of >0.25 ppm are connected by dashed arrows. Signals from residues 68–70 that only appear in the presence of p50 peptide are labeled with asterisks. c, Chemical shift perturbation (CSP) index of 15N-labelled Ctc1 OB-A upon binding p50 peptide. Magenta box indicates the region that is shown in Fig. 2d. d, Chemical-shift-based secondary structure score of Ctc1 OB-A in the absence (gray) and presence (yellow) of p50 peptide. The scores are determined using TALOS+ (ref54). Top and bottom edges of each bar represent the probabilities of each residue assigned to be α helix and β sheet, respectively. The secondary structure of Ctc1 OB-A observed in the cryo-EM structure is shown below for comparison. e, Plot of long range (greater than 5 residues) 1H-1H NOE restraints observed within Ctc1 OB-A. Residues with pairwise NOE restraint(s) are connected by a link. Links are color coded as indicated based on the number of NOE restraints between the two connected residues.
Extended Data Fig. 4: Identifying the “invisible” interface between Ctc1 OB-A and p50 peptide using NMR methods.
a, Schematic diagram of p50 and constructs of p50 peptide. The N-terminal 30 kDa and 25 kDa fragments of p50 are labeled as p50N30 and p50N25, respectively. Previous biochemical study showed that p50N30 could bind Ctc1, whereas p50N25 could not43. The cryo-EM structure of p50 ends at residue 208 (Fig. 2b). Based on these facts, a series of p50 peptides in the range of residues 213–255 were designed to explore additional interface between p50 and Ctc1 OB-A that are “invisible” in the cryo-EM structure. b, NMR binding study of p50 peptides with Ctc1 OB-A. Two regions of 1H-15N HSQC spectra of 15N-labelled Ctc1 OB-A in the absence (apo) and presence of unlabeled p50 peptides were shown. Chemical shifts of T71 and A73 were chosen to illustrate the binding process in this and the following panels c and d. p50228–250 peptide is determined to be the optimal construct and was used for other NMR studies presented in this paper. c, Titration series of p50 peptide into 15N-labelled Ctc1 OB-A. The binding is in the slow exchange regime and saturated at 1:1 stoichiometry. d, Truncations of two unstructured loops (residues 38–49 and 131–146) of Ctc1 OB-A individually have no effect on its binding with p50 peptide. e, Secondary structure score of p50228–250 in the presence of Ctc1 OB-A. f, CSP index of p50 peptide upon binding Ctc1 OB-A. 1H-15N HSQC spectra shown in Fig. 2c were used for the CSP calculation. g, Model of the interactions between Ctc1 OB-A and p50. CS-Rosetta models of p50228–250 are shown in gray box with arrows pointing to the binding surface on Ctc1 OB-A. Unstructured linkers are shown as dashed lines.
Extended Data Fig. 5: Characterization of purified Tetrahymena PolαPrim samples and their assembly with telomerase holoenzyme.
a, Size-exclusion chromatography (SEC) profile (left) and SDS-PAGE gel (right) of Polα. b, Representative 2D-class averages of Polα particles obtained from negative-stain EM images. c, SEC profile (left) and SDS-PAGE gel (right) of PolαPrim. d, Representative 2D-class averages of PolαPrim particles obtained from negative-stain EM images. e, Silver-stained SDS-PAGE gel of affinity purified telomerase–Polα (lane 2) shows that Polα can bind telomerase in the absence of Primase. Telomerase (lane 1) and Polα (lane 3) samples were loaded on the same gel for comparison. f, Silver-stained SDS-PAGE gel of affinity purified telomerase–PolαPrim samples shows assembly of the complex with or without sstDNA. g, Representative 2D-class averages of affinity purified telomerase–PolαPrim obtained from negative-stain EM images. Densities are assigned based on the cryo-EM structure (Fig. 3a) obtained with the same batch of sample. Smeared densities (red arrows) are observed near POLA1core in several classes, so we were able to assign them to the PolαPrim platform, which comprises POLA2, POLA1CTD, PRIM2N, and PRIM1. h, Representative 2D-class averages of telomerase particles shown for comparison with g. i, Activity assays of telomerase-PolαPrim (lanes 1–4) and PolαPrim alone (lane 5). Direct telomerase activity assays were conducted for G-strand synthesis alone in the presence of dTTP and dGTP (lanes 1 and 3). PolαPrim activity assays were conducted for C-strand synthesis alone in the presence of ATP, CTP, dATP and dCTP (lanes 2, 4 and 5). 32P-dGTP and 32P-dCTP were used to label the G-strand and C-strand products, respectively. A longer exposure is shown for lane 5 so that products can be seen. RC, recovery control. All lanes are from a single gel. j, Activity assays of C-strand synthesis (lane 1) relative to that in 50 mM LiCl (lane 2), 50 mM NaCl (lane 3), or 50 mM KCl (lane 4). For lanes 2–4, the DNA templates were incubated in assay buffer containing 50 mM of the indicated cations on ice for 30 min before the reaction.
Extended Data Fig. 6: Cryo-EM structure determination of Tetrahymena telomerase–PolαPrim complex.
a, Data processing workflow (detailed in Methods). b, Resolution of final reconstructions determined by gold-standard FSC at the 0.143 criterion. c, Particle distribution (upper) and local resolution evaluation (lower) of the 2.9 Å resolution reconstruction of telomerase core. d, Particle distribution (upper) and local resolution evaluation (lower) of the 4.2 Å resolution reconstruction of TtCST–POLA1core. e, 3D FSC analysis65 of the 2.9 Å resolution reconstruction of telomerase core (left) and the 4.2 Å resolution reconstruction of TtCST–POLA1core (right). For each reconstruction, the global FSC (red line), the spread of directional resolution values (area encompassed by the green dotted lines) and the histogram of directional resolutions evenly sampled over the 3D FSC (blue bars) are shown. A sphericity of 0.958 was determined for telomerase core (left), indicating almost isotropic angular distribution of resolution. A sphericity of 0.736 was determined for TtCST-POLA1core (right), suggesting slightly anisotropic angular distribution of resolution. f, FSC curves for refined models versus the corresponding cryo-EM density maps. g-j, Representative cryo-EM densities (transparency surface) encasing the related atomic models (color sticks and ribbons) for telomerase RNP core (g), CST (h), Stn1 WH-WH (i) and POLA1core (j).
Extended Data Fig. 7: Cryo-EM structure determination of PolαPrim.
a, Data processing workflow (detailed in Methods). b, Representative 2D-class averages of PolαPrim particles obtained from cryo-EM images. The two classes shown in Fig. 3e are labeled with red boxes. c, Resolution of final reconstructions determined by gold-standard FSC at the 0.143 criterion. d, Euler angle distributions of particles used for the final reconstructions. e, Local resolution evaluations of the final reconstructions. f, FSC coefficients as a function of spatial frequency between model and cryo-EM density maps. The composite map is generated using Phenix69 with two focused refined maps (detailed in Methods). For the full map and the composite map, the complete model was used to calculate the FSCs. For the two focused refined maps, only corresponding regions of the model were used to calculate the FSCs. g, Representative cryo-EM densities (gray mesh) encasing the related atomic models (colored sticks and ribbons).
Extended Data Fig. 8: Structural conservation of Tetrahymena PolαPrim.
a, Superposition of Tetrahymena (Tt), human and yeast POLA1core structures45–47,73,74 shown in an overall view. b, Structural comparison of PolαPrim platform of Tt and human45,46. The structures were superposed based on POLA2–POLA1CTD (left) or PRIM1 (right). Arrows indicate dynamics of the unaligned regions. PRIM2C in human structures are shown as transparent ribbons. PRIM2C is not observed in the Tt structure. c, Structures of PolαPrim in an autoinhibited conformation (left, modeled based on PDB 5EXR45) and an active conformation (right, modeled based on a low-resolution cryo-EM map in Extended Data Fig. 7a). The DNA-DNA duplexes on POLA1core were modeled based on PDB 5IUD47. In the autoinhibited conformation (left), the active site on POLA1core is sterically blocked by POLA1CTD and POLA2 for DNA entry. In the active conformation (right), dynamics of subunits are indicated with arrows. d-e, Superposition of Tt, human and yeast POLA1core structures for the regions that are on the interface with TtCST. Conserved domains/motifs are labeled as indicated. The β11-β12 hairpin in Tt POLA1core is longer than those in human and yeast (d). The α19 is structured only in Tt POLA1 when binding TtCST (e). f, Zoom-in views of the interface between Tt POLA1core α19 (ribbon) and TtCST (surface/electrostatic surface). In the lower panel, locations of positively and negatively charged residues on α19 are indicated using blue and red balls, respectively. g, Sequence conservation analysis of the β11-β12 hairpin and α19 of POLA1. Charged residues on α19 are indicated with black arrows. h, Zoom-in view of the interface between POLA1core and TtCST with sstDNA. Cryo-EM densities are shown as transparent surface. The template entry port formed by POLA1core NTD and Exo and Ctc1 OB-C is indicated by a cycle. i, Path of sstDNA in the cryo-EM structure of Tt telomerase–PolαPrim. The sstDNA binds in the C-shape cleft of Ctc1 OB-C with its 5’ side, while its 3’ side passes through the template entry port to the active site of POLA1core (left). A G-quadruplex (GQ) formed by four Tt telomere repeats (modeled based on PDB 7JKU48) is observed on a positively charged DNA binding surface of POLA1core between the palm and thumb (right). j, Superimposition of the GQ structure and cryo-EM density. Weak density of sstDNA can be observed connecting the sstDNA on Ctc1 OB-C to the GQ.
Extended Data Fig. 9: Comparison of TtCST and hCST.
a, Domain diagrams of TtCST and hCST. b, Structural homology analysis of individual OB domains of TtCtc1 (OB-A to -C) and human CTC1 (OB-A to -G) using the Dali sever70. Based on the resulted pairwise Z-scores, TtCtc1 OB-B and OB-C are identified as homologs of human CTC1 OB-F and OB-G, respectively. c, Structural comparison of individual domains from TtCST (color) with corresponding domains from hCST (gray). Structures of WH-WH domains of Tt Stn1 and human STN1 were superposed based on WH1 or WH2 domain. The relative orientation of the two WH domains is different between Tt and human. d, The interface between Stn1 WH-WH and Ctc1 in the cryo-EM structure of Tt telomerase–PolαPrim. Cryo-EM densities are shown as transparent surfaces. An previously unstructured loop of Ctc1 OB-C (Extended Data Fig. 2b) partially forms an α helix (α520–540) and contributes to the interface with Stn1 WH-WH. e, Comparison of DNA binding sites on TtCtc1 (color) and human CTC1 (gray). Conserved residues located on the DNA binding interface are shown as sticks. Cryo-EM densities of TtCtc1 are shown as transparent surfaces. In the decameric structure of hCST19 (PDB 6W6W), sstDNA primarily binds on CTC1 OB-F. However, in TtCST, the equivalent sstDNA binding site on OB-B is partially occluded by a helix (α6) that is part of an unstructured loop in hCTC1 OB-F. The helix α6 abuts TERT in TtCST without PolαPrim (Extended Data Fig. 2k) and Stn1 WH2 when PolαPrim is bound (as shown in d). f, Sequence conservation analysis of Ctc1 residues on the DNA binding interface. Residues shown in e are indicated with black arrows. Conserved cysteines in the Zn-ribbon motifs are indicated with pink arrows. g, SEC profile and SDS-PAGE gel of TtCST–p50 co-expressed in Sf9 cells. Gel samples are from the peak fractions of the SEC profile as indicated. h, EMSA of purified wild-type TtCST with d(GTTGGG)n, where n = 3, 5 or 10. i, Substitutions of TtCtc1 OB-B conserved residues K303E/K306E/F308A and F264A/Y268A substantially decrease d(GTTGGG)5 binding, as indicated by EMSAs. These results suggest that the binding site on TtCtc1 OB-B might be accessible to sstDNA in free TtCST where neither TERT nor Stn1 WH-WH stabilize helix α6. Wedges indicate two-fold dilution of TtCST. The first lane of each gel is a TtCST-free control. j, Quantifications of fraction of bound DNA for all the independent EMSA experiments with TtCST WT and variants as indicated (n=3 biological replicates). KD values were determined as described in Methods. k, Effect of TtCST residue substitutions on d(GTTGGG)5 binding. Data are mean ± s.d. from n=3 biological replicates shown in j. *P=0.04, **P=0.009, ****P<0.0001; one-tailed unpaired t-tests.
Extended Data Table. 1:
Cryo-EM data collection, refinement and validation statistics.
| Telomerase with CST (EMD-26863) (PDB 7UY5) | Telomerase with CST–PolaPrim (EMD-26864) | Telomerase (EMD-26865) (PDB 7UY6) | CST–PolαPrim (EMD-26866) (PDB 7UY7) | PolαPrim platform (EMD-26867) (PDB 7UY8) | POLA2-POLA1CTD–PRIM2N (EMD-26868) | PRIM2N–PRIM1 (EMD-26869) | |
|---|---|---|---|---|---|---|---|
| Data collection and processing | |||||||
| Magnification | 105,000 | 81,000 | 81,000 | 81,000 | 81,000 | 81,000 | 81,000 |
| Voltage (kV) | 300 | 300 | 300 | 300 | 300 | 300 | 300 |
| Electron exposure (e−/Å2) | 48 | 55 | 55 | 55 | 55 | 55 | 55 |
| Defocus range (μm) | −0.8 – −4.0 | −0.8 – −4.0 | −0.8 – −4.0 | −0.8 – −4.0 | −0.8 – −4.0 | −0.8 – −4.0 | −0.8 – −4.0 |
| Pixel size (Å) | 1.36 | 1.1 | 1.1 | 1.1 | 1.1 | 1.1 | 1.1 |
| Symmetry imposed | C1 | C1 | C1 | C1 | C1 | C1 | C1 |
| Initial particle images (no.) | 2,547,163 | 19,870,016 | 19,870,016 | 19,870,016 | 3,312,111 | 3,312,111 | 3,312,111 |
| Particle images after class2d (no.) | n/a | 4,508,191 | 4,508,191 | 4,508,191 | 1,316,017 | 1,316,017 | 1,316,017 |
| Final particle images (no.) | 259,330 | 142,912 | 539,078 | 142,912 | 264,498 | 264,498 | 264,498 |
| Map resolution (Å) | 3.5 | 4.4 | 2.9 | 4.2 | 4.5 | 4.0 | 4.3 |
| FSC threshold | 0.143 | 0.143 | 0.143 | 0.143 | 0.143 | 0.143 | 0.143 |
| Map resolution range (Å) | 3.2 – 6.0 | 4.0 – 7.0 | 2.9 – 5.0 | 4.0–7.0 | 4.0 – 7.0 | 4.0 – 6.0 | 4.0 – 6.0 |
| Refinement | |||||||
| Initial model used (PDB code) | 7LMA, 5DOI, 5DFM | 7LMA | 7UY5, 5DFN, 5DOK, AlphaFold2 | AlphaFold2 | |||
| Model resolution (Å) | 3.7 | 3.1 | 4.4 | 4.3 | |||
| FSC threshold | 0.5 | 0.5 | 0.5 | 0.5 | |||
| Map sharpening B factor (Å2) | −130 | −80 | −100 | −100 | |||
| Model composition | |||||||
| Non-hydrogen atoms | 25,772 | 18,746 | 15,161 | 9,552 | |||
| Protein residues | 2,690 | 1,847 | 1,808 | 1,161 | |||
| RNA/DNA Nucleotides | 170 | 170 | 10 | 0 | |||
| Ligands | 2 | 1 | 1 | 1 | |||
| B factors (Å2) | |||||||
| Protein | 21.8 | 47.5 | 124.3 | 74.4 | |||
| RNA/DNA/Ligands | 82.6 | 147.8 | 150.5 | 180.8 | |||
| R.m.s. deviations | |||||||
| Bond lengths (Å) | 0.002 | 0.002 | 0.002 | 0.003 | |||
| Bond angles (°) | 0.455 | 0.442 | 0.557 | 0.636 | |||
| Validation | |||||||
| MolProbity score | 1.54 | 1.19 | 1.91 | 1.87 | |||
| Clashscore | 7.03 | 4.00 | 13.86 | 8.69 | |||
| Poor rotamers (%) | 0.04 | 0.00 | 0.18 | 0.00 | |||
| Ramachandran plot | |||||||
| Favored (%) | 97.17 | 98.30 | 96.17 | 93.92 | |||
| Allowed (%) | 2.83 | 1.70 | 3.83 | 6.08 | |||
| Disallowed (%) | 0.00 | 0.00 | 0.00 | 0.00 |
Supplementary Material
Acknowledgements
This work was supported by grants from NIH R35GM131901 and NSF MCB2016540 to J.F. and NIH R01GM071940 to Z.H.Z. We acknowledge use of instruments at the Electron Imaging Center for Nanomachines supported by UCLA and instrumentation grants from NIH (1S10OD018111 and U24GM116792) and NSF (DBI-1338135 and DMR-1548924). The UCLA-DOE NMR core facility is supported in part by US Department of Energy grant DE-AC02-06CH11357 and NIH instrumentation grants S10OD016336 and S10OD025073.
Footnotes
Competing interests: Authors declare that they have no competing interests.
Data availability
Cryo-EM density maps have been deposited in the Electron Microscopy Data Bank under accession numbers EMD-26863 (telomerase with CST), EMD-26864 (telomerase with CST–PolαPrim), EMD-26865 (telomerase), EMD-26866 (CST–PolαPrim), EMD-26867 (PolαPrim platform), EMD-26868 (POLA2–POLA1CTD–PRIM2N), and EMD-26869 (PRIM2N–PRIM1). The atomic models have been deposited in the Protein Data Bank under accession codes 7UY5 (telomerase with CST), 7UY6 (telomerase), 7UY7 (CST–PolαPrim), and 7UY8 (PolαPrim platform). Backbone chemical shifts have been deposited in BMRB under accession codes 51441 (Ctc1 OB-A), 51442 (Ctc1 OB-A with p50 peptide 228–250), and 51443 (p50 peptide 228–250).
References
- 1.de Lange T Shelterin-Mediated Telomere Protection. Annu Rev Genet 52, 223–247 (2018). [DOI] [PubMed] [Google Scholar]
- 2.Lim CJ & Cech TR Shaping human telomeres: from shelterin and CST complexes to telomeric chromatin organization. Nat Rev Mol Cell Biol (2021). [DOI] [PMC free article] [PubMed] [Google Scholar]
- 3.Baumann P & Cech TR Pot1, the putative telomere end-binding protein in fission yeast and humans. Science 292, 1171–1175 (2001). [DOI] [PubMed] [Google Scholar]
- 4.Abreu E et al. TIN2-tethered TPP1 recruits human telomerase to telomeres in vivo. Mol Cell Biol 30, 2971–2982 (2010). [DOI] [PMC free article] [PubMed] [Google Scholar]
- 5.Nandakumar J et al. The TEL patch of telomere protein TPP1 mediates telomerase recruitment and processivity. Nature 492, 285–289 (2012). [DOI] [PMC free article] [PubMed] [Google Scholar]
- 6.Greider CW & Blackburn EH Identification of a specific telomere terminal transferase activity in Tetrahymena extracts. Cell 43, 405–413 (1985). [DOI] [PubMed] [Google Scholar]
- 7.Pellegrini L The Pol alpha-primase complex. Subcell Biochem 62, 157–169 (2012). [DOI] [PubMed] [Google Scholar]
- 8.Baranovskiy AG & Tahirov TH Elaborated Action of the Human Primosome. Genes (Basel) 8 (2017). [DOI] [PMC free article] [PubMed] [Google Scholar]
- 9.Qi H & Zakian VA The Saccharomyces telomere-binding protein Cdc13p interacts with both the catalytic subunit of DNA polymerase alpha and the telomerase-associated est1 protein. Genes Dev 14, 1777–1788 (2000). [PMC free article] [PubMed] [Google Scholar]
- 10.Wang F et al. Human CST has independent functions during telomere duplex replication and C-strand fill-in. Cell Rep 2, 1096–1103 (2012). [DOI] [PMC free article] [PubMed] [Google Scholar]
- 11.Surovtseva YV et al. Conserved telomere maintenance component 1 interacts with STN1 and maintains chromosome ends in higher eukaryotes. Mol Cell 36, 207–218 (2009). [DOI] [PMC free article] [PubMed] [Google Scholar]
- 12.Chen LY, Redon S & Lingner J The human CST complex is a terminator of telomerase activity. Nature 488, 540–544 (2012). [DOI] [PubMed] [Google Scholar]
- 13.Zaug AJ et al. CST does not evict elongating telomerase but prevents initiation by ssDNA binding. Nucleic Acids Res 49, 11653–11665 (2021). [DOI] [PMC free article] [PubMed] [Google Scholar]
- 14.Stewart JA et al. Human CST promotes telomere duplex replication and general replication restart after fork stalling. EMBO J 31, 3537–3549 (2012). [DOI] [PMC free article] [PubMed] [Google Scholar]
- 15.Mirman Z et al. 53BP1-RIF1-shieldin counteracts DSB resection through CST- and Polalpha-dependent fill-in. Nature 560, 112–116 (2018). [DOI] [PMC free article] [PubMed] [Google Scholar]
- 16.Holohan B, Wright WE & Shay JW Cell biology of disease: Telomeropathies: an emerging spectrum disorder. J Cell Biol 205, 289–299 (2014). [DOI] [PMC free article] [PubMed] [Google Scholar]
- 17.Chen LY, Majerska J & Lingner J Molecular basis of telomere syndrome caused by CTC1 mutations. Genes Dev 27, 2099–2108 (2013). [DOI] [PMC free article] [PubMed] [Google Scholar]
- 18.Prakash A & Borgstahl GE The structure and function of replication protein A in DNA replication. Subcell Biochem 62, 171–196 (2012). [DOI] [PMC free article] [PubMed] [Google Scholar]
- 19.Lim CJ et al. The structure of human CST reveals a decameric assembly bound to telomeric DNA. Science 368, 1081–1085 (2020). [DOI] [PMC free article] [PubMed] [Google Scholar]
- 20.Ge Y et al. Structural insights into telomere protection and homeostasis regulation by yeast CST complex. Nat Struct Mol Biol 27, 752–762 (2020). [DOI] [PubMed] [Google Scholar]
- 21.Bryan C, Rice C, Harkisheimer M, Schultz DC & Skordalakes E Structure of the human telomeric Stn1-Ten1 capping complex. PLoS One 8, e66756 (2013). [DOI] [PMC free article] [PubMed] [Google Scholar]
- 22.Jiang J et al. Structure of Tetrahymena telomerase reveals previously unknown subunits, functions, and interactions. Science 350, aab4070 (2015). [DOI] [PMC free article] [PubMed] [Google Scholar]
- 23.Wan B et al. The Tetrahymena telomerase p75-p45-p19 subcomplex is a unique CST complex. Nat Struct Mol Biol 22, 1023–1026 (2015). [DOI] [PMC free article] [PubMed] [Google Scholar]
- 24.Kratz K & de Lange T Protection of telomeres 1 proteins POT1a and POT1b can repress ATR signaling by RPA exclusion, but binding to CST limits ATR repression by POT1b. J Biol Chem 293, 14384–14392 (2018). [DOI] [PMC free article] [PubMed] [Google Scholar]
- 25.Wan M, Qin J, Songyang Z & Liu D OB fold-containing protein 1 (OBFC1), a human homolog of yeast Stn1, associates with TPP1 and is implicated in telomere length regulation. J Biol Chem 284, 26725–26731 (2009). [DOI] [PMC free article] [PubMed] [Google Scholar]
- 26.Kelich JM, Papaioannou H & Skordalakes E Pol alpha-primase dependent nuclear localization of the mammalian CST complex. Commun Biol 4, 349 (2021). [DOI] [PMC free article] [PubMed] [Google Scholar]
- 27.Ganduri S & Lue NF STN1-POLA2 interaction provides a basis for primase-pol alpha stimulation by human STN1. Nucleic Acids Res 45, 9455–9466 (2017). [DOI] [PMC free article] [PubMed] [Google Scholar]
- 28.Feng X, Hsu SJ, Kasbek C, Chaiken M & Price CM CTC1-mediated C-strand fill-in is an essential step in telomere length maintenance. Nucleic Acids Res 45, 4281–4293 (2017). [DOI] [PMC free article] [PubMed] [Google Scholar]
- 29.Feng X et al. CTC1-STN1 terminates telomerase while STN1-TEN1 enables C-strand synthesis during telomere replication in colon cancer cells. Nat Commun 9, 2827 (2018). [DOI] [PMC free article] [PubMed] [Google Scholar]
- 30.Wang Y, Susac L & Feigon J Structural Biology of Telomerase. Cold Spring Harb Perspect Biol (2019). [DOI] [PMC free article] [PubMed] [Google Scholar]
- 31.Wang F et al. The POT1-TPP1 telomere complex is a telomerase processivity factor. Nature 445, 506–510 (2007). [DOI] [PubMed] [Google Scholar]
- 32.Sekne Z, Ghanim GE, van Roon AM & Nguyen THD Structural basis of human telomerase recruitment by TPP1-POT1. Science 375, 1173–1176 (2022). [DOI] [PMC free article] [PubMed] [Google Scholar]
- 33.Liu B et al. Structure of active human telomerase with telomere shelterin protein TPP1. Nature 604, 578–583 (2022). [DOI] [PMC free article] [PubMed] [Google Scholar]
- 34.Upton HE, Chan H, Feigon J & Collins K Shared Subunits of Tetrahymena Telomerase Holoenzyme and Replication Protein A Have Different Functions in Different Cellular Complexes. J Biol Chem 292, 217–228 (2017). [DOI] [PMC free article] [PubMed] [Google Scholar]
- 35.Zeng Z et al. Structural basis for Tetrahymena telomerase processivity factor Teb1 binding to single-stranded telomeric-repeat DNA. Proc Natl Acad Sci U S A 108, 20357–20361 (2011). [DOI] [PMC free article] [PubMed] [Google Scholar]
- 36.Lei M, Podell ER & Cech TR Structure of human POT1 bound to telomeric single-stranded DNA provides a model for chromosome end-protection. Nat Struct Mol Biol 11, 1223–1229 (2004). [DOI] [PubMed] [Google Scholar]
- 37.Chen C et al. Structural insights into POT1-TPP1 interaction and POT1 C-terminal mutations in human cancer. Nat Commun 8, 14929 (2017). [DOI] [PMC free article] [PubMed] [Google Scholar]
- 38.Rice C et al. Structural and functional analysis of the human POT1-TPP1 telomeric complex. Nat Commun 8, 14928 (2017). [DOI] [PMC free article] [PubMed] [Google Scholar]
- 39.Jiang J et al. Structure of Telomerase with Telomeric DNA. Cell 173, 1179–1190 e1113 (2018). [DOI] [PMC free article] [PubMed] [Google Scholar]
- 40.He Y et al. Structures of telomerase at several steps of telomere repeat synthesis. Nature 593, 454–459 (2021). [DOI] [PMC free article] [PubMed] [Google Scholar]
- 41.Ghanim GE et al. Structure of human telomerase holoenzyme with bound telomeric DNA. Nature (2021). [DOI] [PMC free article] [PubMed] [Google Scholar]
- 42.Wang Y, Gallagher-Jones M, Sušac L, Song H & Feigon J A structurally conserved human and Tetrahymena telomerase catalytic core. Proceedings of the National Academy of Sciences, 202011684 (2020). [DOI] [PMC free article] [PubMed] [Google Scholar]
- 43.Hong K et al. Tetrahymena telomerase holoenzyme assembly, activation, and inhibition by domains of the p50 central hub. Mol Cell Biol 33, 3962–3971 (2013). [DOI] [PMC free article] [PubMed] [Google Scholar]
- 44.Lue NF, Chan J, Wright WE & Hurwitz J The CDC13-STN1-TEN1 complex stimulates Pol alpha activity by promoting RNA priming and primase-to-polymerase switch. Nat Commun 5, 5762 (2014). [DOI] [PMC free article] [PubMed] [Google Scholar]
- 45.Baranovskiy AG et al. Mechanism of Concerted RNA-DNA Primer Synthesis by the Human Primosome. J Biol Chem 291, 10006–10020 (2016). [DOI] [PMC free article] [PubMed] [Google Scholar]
- 46.Kilkenny ML et al. Structural basis for the interaction of SARS-CoV-2 virulence factor nsp1 with DNA Polymerase a - Primase. Protein Sci (2021). [DOI] [PMC free article] [PubMed] [Google Scholar]
- 47.Coloma J, Johnson RE, Prakash L, Prakash S & Aggarwal AK Human DNA polymerase alpha in binary complex with a DNA:DNA template-primer. Sci Rep 6, 23784 (2016). [DOI] [PMC free article] [PubMed] [Google Scholar]
- 48.Beseiso D et al. The first crystal structures of hybrid and parallel four-tetrad intramolecular G-quadruplexes. Nucleic Acids Res 50, 2959–2972 (2022). [DOI] [PMC free article] [PubMed] [Google Scholar]
- 49.Bryan TM G-Quadruplexes at Telomeres: Friend or Foe? Molecules 25 (2020). [DOI] [PMC free article] [PubMed] [Google Scholar]
- 50.Williamson JR, Raghuraman MK & Cech TR Monovalent cation-induced structure of telomeric DNA: the G-quartet model. Cell 59, 871–880 (1989). [DOI] [PubMed] [Google Scholar]
- 51.Lee W, Tonelli M & Markley JL NMRFAM-SPARKY: enhanced software for biomolecular NMR spectroscopy. Bioinformatics 31, 1325–1327 (2015). [DOI] [PMC free article] [PubMed] [Google Scholar]
- 52.Herrmann T, Guntert P & Wuthrich K Protein NMR structure determination with automated NOE-identification in the NOESY spectra using the new software ATNOS. J Biomol NMR 24, 171–189 (2002). [DOI] [PubMed] [Google Scholar]
- 53.Guntert P & Buchner L Combined automated NOE assignment and structure calculation with CYANA. J Biomol NMR 62, 453–471 (2015). [DOI] [PubMed] [Google Scholar]
- 54.Shen Y, Delaglio F, Cornilescu G & Bax A TALOS+: a hybrid method for predicting protein backbone torsion angles from NMR chemical shifts. J Biomol NMR 44, 213–223 (2009). [DOI] [PMC free article] [PubMed] [Google Scholar]
- 55.Shen Y et al. Consistent blind protein structure generation from NMR chemical shift data. Proc Natl Acad Sci U S A 105, 4685–4690 (2008). [DOI] [PMC free article] [PubMed] [Google Scholar]
- 56.Williamson MP Using chemical shift perturbation to characterise ligand binding. Progress in Nuclear Magnetic Resonance Spectroscopy 73, 1–16 (2013). [DOI] [PubMed] [Google Scholar]
- 57.Jiang J et al. The architecture of Tetrahymena telomerase holoenzyme. Nature 496, 187–192 (2013). [DOI] [PMC free article] [PubMed] [Google Scholar]
- 58.Mastronarde DN Automated electron microscope tomography using robust prediction of specimen movements. J Struct Biol 152, 36–51 (2005). [DOI] [PubMed] [Google Scholar]
- 59.Zivanov J et al. New tools for automated high-resolution cryo-EM structure determination in RELION-3. Elife 7 (2018). [DOI] [PMC free article] [PubMed] [Google Scholar]
- 60.Zheng SQ et al. MotionCor2: anisotropic correction of beam-induced motion for improved cryo-electron microscopy. Nat Methods 14, 331–332 (2017). [DOI] [PMC free article] [PubMed] [Google Scholar]
- 61.Rohou A & Grigorieff N CTFFIND4: Fast and accurate defocus estimation from electron micrographs. J Struct Biol 192, 216–221 (2015). [DOI] [PMC free article] [PubMed] [Google Scholar]
- 62.Bepler T et al. Positive-unlabeled convolutional neural networks for particle picking in cryo-electron micrographs. Nat Methods 16, 1153–1160 (2019). [DOI] [PMC free article] [PubMed] [Google Scholar]
- 63.Punjani A, Rubinstein JL, Fleet DJ & Brubaker MA cryoSPARC: algorithms for rapid unsupervised cryo-EM structure determination. Nat Methods 14, 290–296 (2017). [DOI] [PubMed] [Google Scholar]
- 64.Kucukelbir A, Sigworth FJ & Tagare HD Quantifying the local resolution of cryo-EM density maps. Nat Methods 11, 63–65 (2014). [DOI] [PMC free article] [PubMed] [Google Scholar]
- 65.Tan YZ et al. Addressing preferred specimen orientation in single-particle cryo-EM through tilting. Nat Methods 14, 793–796 (2017). [DOI] [PMC free article] [PubMed] [Google Scholar]
- 66.Pettersen EF et al. UCSF Chimera--a visualization system for exploratory research and analysis. J Comput Chem 25, 1605–1612 (2004). [DOI] [PubMed] [Google Scholar]
- 67.Emsley P, Lohkamp B, Scott WG & Cowtan K Features and development of Coot. Acta Crystallogr D Biol Crystallogr 66, 486–501 (2010). [DOI] [PMC free article] [PubMed] [Google Scholar]
- 68.Jumper J et al. Highly accurate protein structure prediction with AlphaFold. Nature 596, 583–589 (2021). [DOI] [PMC free article] [PubMed] [Google Scholar]
- 69.Adams PD et al. PHENIX: a comprehensive Python-based system for macromolecular structure solution. Acta Crystallogr D Biol Crystallogr 66, 213–221 (2010). [DOI] [PMC free article] [PubMed] [Google Scholar]
- 70.Holm L Using Dali for Protein Structure Comparison. Structural Bioinformatics: Methods and Protocols 2112, 29–42 (2020). [DOI] [PubMed] [Google Scholar]
- 71.Waterhouse AM, Procter JB, Martin DM, Clamp M & Barton GJ Jalview Version 2--a multiple sequence alignment editor and analysis workbench. Bioinformatics 25, 1189–1191 (2009). [DOI] [PMC free article] [PubMed] [Google Scholar]
- 72.Goddard TD et al. UCSF ChimeraX: Meeting modern challenges in visualization and analysis. Protein Sci 27, 14–25 (2018). [DOI] [PMC free article] [PubMed] [Google Scholar]
- 73.Baranovskiy AG et al. Structural basis for inhibition of DNA replication by aphidicolin. Nucleic Acids Res 42, 14013–14021 (2014). [DOI] [PMC free article] [PubMed] [Google Scholar]
- 74.Perera RL et al. Mechanism for priming DNA synthesis by yeast DNA polymerase alpha. Elife 2, e00482 (2013). [DOI] [PMC free article] [PubMed] [Google Scholar]
Associated Data
This section collects any data citations, data availability statements, or supplementary materials included in this article.
Supplementary Materials
Data Availability Statement
Cryo-EM density maps have been deposited in the Electron Microscopy Data Bank under accession numbers EMD-26863 (telomerase with CST), EMD-26864 (telomerase with CST–PolαPrim), EMD-26865 (telomerase), EMD-26866 (CST–PolαPrim), EMD-26867 (PolαPrim platform), EMD-26868 (POLA2–POLA1CTD–PRIM2N), and EMD-26869 (PRIM2N–PRIM1). The atomic models have been deposited in the Protein Data Bank under accession codes 7UY5 (telomerase with CST), 7UY6 (telomerase), 7UY7 (CST–PolαPrim), and 7UY8 (PolαPrim platform). Backbone chemical shifts have been deposited in BMRB under accession codes 51441 (Ctc1 OB-A), 51442 (Ctc1 OB-A with p50 peptide 228–250), and 51443 (p50 peptide 228–250).