

ABSTRACT
BCL11B, an essential transcription factor for thymopoiesis, regulates also vital processes in post-thymic lymphocytes. Increased expression of BCL11B was recently correlated with the maturation of NK cells, whereas reduced BCL11B levels were observed in native and induced T cell subsets displaying NK cell features. We show that BCL11B-depleted CD8+ T cells stimulated with IL-15 acquired remarkable innate characteristics. These induced innate CD8+ (iiT8) cells expressed multiple innate receptors like NKp30, CD161, and CD16 as well as factors regulating migration and tissue homing while maintaining their T cell phenotype. The iiT8 cells effectively killed leukemic cells spontaneously and neuroblastoma spheroids in the presence of a tumor-specific monoclonal antibody mediated by CD16 receptor activation. These iiT8 cells integrate the innate natural killer cell activity with adaptive T cell longevity, promising an interesting therapeutic potential. Our study demonstrates that innate T cells, albeit of limited clinical applicability given their low frequency, can be efficiently generated from peripheral blood and applied for adoptive transfer, CAR therapy, or combined with therapeutic antibodies.
KEYWORDS: BCL11B, knock-out, IL-15, innateness, AICC, ADCC, CRISPR/Cas9, human, alpha-beta CD8+ T cells
Introduction
The multiple zinc finger (ZnF) transcription factor B-cell lymphoma/leukemia 11B (BCL11B) is known to be essential for the development and function of multiple tissues and organs, including skin,1 teeth,2 mammary gland,3 and central nervous system.4 In the immune system BCL11B promotes, on the one hand, T cell lineage while blocking alternative non-T cell fates5 and on the other, is involved in the differentiation of both canonical and adaptive NK cells.6 Numerous post-translational modifications determine its role as transcriptional activator or repressor,7 including (MAPK)-dependent phosphorylation at multiple positions and SUMOylation at Lysine 679, thereby facilitating binding of histone-acetyltransferase p300 to Bcl11b and converting Bcl11b into an activator.8 Additionally, the interaction with metastasis-associated protein (MTA) and retinoblastoma-binding protein 46/48 (RbAp46/48)9 is disturbed by phosphorylation at Serine 2, which disables the recruitment of nucleosome-remodeling deacetylase complex (NuRD) and de-represses the controlled genomic regions.
Described initially as a tumor suppressor,10,11 BCL11B is strongly expressed in human T cell leukemia and lymphoma cell lines and was proven essential for survival. Downregulation of BCL11B in these cells induces apoptosis accompanied by reduction of p27 and Bcl-xl, suggesting the activation of the mitochondrial apoptotic pathway.12 The viability of the fully differentiated and healthy T cells, in contrast, is not affected by the reduction of BCL11B.13 BCL11B is crucial for T cell development and is thus considered a “guardian of T cell fate”.14 Analysis of bulk RNA-seq datasets revealed a key role in preventing the development of alternative lineages during early thymopoiesis. Induction of BCL11B leads to the deactivation of a group of genes, including growth factor receptor gene Kit and the crucial NK cell-promoting factors Id2 and Zbtb16, and ensures the blocking of NK cell lineage.15,16 Additionally, the composition of the T cell population itself is determined by Bcl11b. Impaired Bcl11b activity in CD4+CD8+ double-positive thymocytes leads to the development of an increased number of CD8+ single positive T cells, which show a strongly elevated production of interferon gamma (IFNγ).17 Furthermore, Bcl11b prevents the untimely expression of genes related to the maturation of CD4+ and CD8+ single-positive T cells like Zbtb7b and Runx3.18 Although the embryonic loss of Bcl11b in a murine system leads to perinatal mortality due to multi-organ malfunction,19 the acute depletion in adult mice is not harmful. Instead, it induces NK cell-like properties and gene expression patterns in T cell progenitors and fully differentiated T-lymphocytes. These induced T-to-natural killer (ITNK) cells are morphologically and functionally similar to conventional NK cells, efficiently kill tumor cells in vitro, and prevent tumor metastasis in vivo.20
Although the development of NK cells requires de-repression of BCL11B target genes, low protein levels can still be detected in NK cells.21 Recently, the induction of BCL11B was demonstrated and correlated with NK cells maturation which was accompanied by activation of multiple T cell-related genes and adaptive features.6 In contrast, BCL11B’s expression inversely correlates with innate characteristics of the T lymphocyte populations. Low-input and single-cell RNA-seq revealed an innateness gradient with adaptive T cells on one side, followed by MAIT, TCRγδ T cells, and NK cells on the other.22 Besides these lymphocyte subsets, recent studies described TCRαβ+ T cell subpopulations exhibiting lower BCL11B levels. CD8+ T cells expressing the activating NK receptor NKp30 concurrently with low BCL11B were observed in the peripheral blood of healthy individuals as a tiny naturally occurring subpopulation of naïve cells. Furthermore, these NKp30+ T cells could be induced by IL-15 in vitro, showed high NK-like antitumor activity, and this transition was preceded by activation of the innate transcription factor PLZF.23 Exposure to human cytomegalovirus (HCMV), in turn, led to the appearance of NKG2C+TCRαβ+CD8+ T cells, resembling the CMV-associated NK cells. These unconventional T cells express several NK cell markers like CD56 and killer cell immunoglobulin-like receptor (KIR) and exhibit a strong effector function against leukemia cells in some individuals. As expected, BCL11B was identified in these cells as the most downregulated transcription factor compared to NKG2C− T cells.24 The most recent reports describing the consequences of clustered regularly interspaced short palindromic repeat (CRISPR)/Cas9-mediated BCL11B depletion confirm its essential role in limiting the innate traits within the T cell compartment.24,25 Conversely, the rather limited loss of typically adaptive profile upon BCL11B withdrawal indicates a certain level of BCL11B-independence at late T cell differentiation states. Noteworthy, the efficiency, direction, and depth of the NK-like transition vary for distinct T cell subsets and remain dependent on the type of stimulation.
Here, we demonstrate the effects of CRISPR/Cas9-mediated BCL11B knock-out (KO) in human TCRαβ+CD8+ T cells isolated from healthy individuals supplemented with IL-7 and IL-15. This led to the formation of induced innate CD8+ T (iiT8) cells characterized by NK cell-like gene expression and surface marker profile. Genes forming regulatory circuits associated with signal transduction in innate cells and transendothelial migration were enriched, whereas expression of HLA molecules was reduced. Interestingly, innate transcription factors like ID2, ZBTB16, HOPX, and ZFN683 were induced while, despite long-term stimulation, expression of T cell exhaustion markers PDCD1 and LAG3 among others remained low. The iiT8 cells exhibited strong direct stress receptor-mediated effector function against ligand-proficient tumor cells. In addition, unlike any other induced innate T lymphocytes described to date, iiT8 cells expressed the antibody receptor CD16 and eliminated their targets in an antibody-dependent manner. The accompanying induction of the CD161 receptor unique among induced human T-to-NK cells suggests the acquisition of memory and tissue homing characteristics. With their ability to effectively eradicate tumor cells via multiple TCR-independent mechanisms and the hybrid innate-adaptive characteristics, iiT8 cells combine preferred T- and NK cell features and fill the gap between NK- and T cell-based adoptive cellular therapies.
Methods
Cell isolation and cell culture
Buffy coats from healthy individuals were provided by the Department of Transfusion Medicine of the University Medicine Greifswald (Greifswald, Germany). Written informed consent was obtained from the blood donors, and ethical approval BB014/14 was granted by the local Ethics Committee. Peripheral blood mononuclear cells (PBMCs) were separated by density gradient centrifugation (Leucosep tube, Greiner Bio-One, Austria). CD8+CD56– T cells were isolated using the Human CD8+ T Cell Isolation Kit (Miltenyi, Germany), and cells from each donor were split into three experimental conditions (not transfected control nt, mock gRNA transfected control mock, BCL11B knock-out KO). Cells were cultivated in TexMACS medium (Miltenyi) supplemented with 1% MycoZap Prophylactic (Lonza, Switzerland). The KO and mock controls were electroporated directly after isolation, and all samples were cultivated without cytokines or stimulation for the first 48 hours. Afterward, 155 U/ml human IL-7 (Miltenyi) and 290 U/ml human IL-15 (Miltenyi) were added, and cells were stimulated with 1% (v/v) TransAct T cell stimulation reagent (Miltenyi). Cytokines were freshly added every two days, and a second TransAct stimulation with 0.2% (v/v) was performed 14 days after the first.
Cell lines and near-infrared iRFP680 (iRFP) transduction
K562 cell lines and the CHLA-136 cell line were cultivated in RPMI and IMDM medium with supplements, respectively (Supplementary Table 1). For recombinant lentivirus production, the second-generation lentiviral vector system was used. The transfection was performed using CalPhos Mammalian Transfection Kit (Takara Bio Europe, France) according to the manufacturer’s instructions. Further details on lentiviral vectors and transfection are given in Supplementary Table 1.
Gene targeting
For BCL11B locus targeting, CD8+CD56– T cells were electroporated with Ribonucleoprotein (RNP) complexes consisting of Cas9 protein and gRNA using the 4D-Nucleofector System (Lonza, Switzerland). Electroporation efficiency was determined 24 h after treatment via flow cytometric measurement of ATTO550 fluorescent signal. The genome-editing efficiency was determined with the Alt-R Genome Detection Kit (IDT Coralville, USA) and regular PCR.
For depletion of the NCR3LG1 locus, 1 × 10⁶ K562 cells were transfected by a similar protocol, and successful knock-out was determined by lack of detection of surface B7H6 72 hours after electroporation using flow cytometry.
Further details on crRNAs and electroporation protocol are described in Supplementary Table 1.
Flow cytometry
For each analysis, cells of 200 µl of suspension were washed with 2 ml phosphate-buffered saline (PBS) followed by 10 min centrifugation at 300 g. Antibodies (Supplementary Table 2) and 7-Amino-Actinomycin D (7-AAD) (ThermoFisher Scientific, USA) for dead cell exclusion were added and cells were incubated for 15 min at RT followed by a second washing step. Measurements were performed on a Navios EX flow cytometer (Beckman Coulter, USA). Data were analyzed using FlowJo software (v10.7.1, BD, USA), and doublets were excluded based on forward scatter width/forward scatter height.
Proteome analysis
Cell samples for proteome analysis were prepared from CD8+ T cells of three donors, including the conditions non-treated (nt), mock electroporated, and BCL11B KO 22 days after activation with TransAct. Whole protein was extracted, protein concentration was determined, and peptide solutions were prepared by an SP3 bead-based protocol26 and digestion with trypsin. LC-MS/MS analysis was performed on the peptides in data-independent acquisition (DIA) mode using an Ultimate 3000 UPLC system coupled to a QExactive Plus instrument (Thermo Scientific, USA). Further details on protein preparation and LC-MS/MS analysis can be found in Supplementary Table 1, and data acquisition details are compiled in Supplementary Table 3.
Analysis of mass spectrometric raw data was carried out using Spectronaut software (v14.9., Biognosys, Germany). Statistical data analysis was conducted using an in-house developed R tool. Further details on quantitation algorithms are provided in Supplementary Table 3 and on raw data analysis and statistical analysis in Supplementary Table 1.
Finally, differential abundant proteins (absolute fold change ≥ 1.5 and p ≤ 0.05) were identified by the statistical analysis using the ROPECA algorithm27 applied on peptide level.
Enrichment analysis
Data sets generated by global proteome and transcriptome analysis were characterized by Gene Set Enrichment Analysis (GSEA, http://www.gsea-msigdb.org/gsea/index.jsp,28,29) using the GSEA PreRanked approach. The omics data set with mappable identifiers was utilized without restriction to cutoff values of fold change, p-value, or other parameters. The ranking was generated by sorting according to the log2-values of the ratio BCL11B KO/mock, generated during the statistical analysis of the omics data. A set of 133 KEGG pathways (Supplementary Table 4) generated by removing all pathways related to cancer, development, disease, and organs from the canonical KEGG pathways was applied as a gene set database. Other settings included 1000 permutations on gene set data and size limits of a maximum of 500 and a minimum of 5. Results of GSEA were filtered for the top 20 positive and negative Normalized Enrichment Score (NES) values, for an FDR q-value < 0.2, and a nominal p-value < 0.05.
Bead-based functional assay
Anti-Biotin MACSiBead Particles (Miltenyi, Germany) were loaded with different activating antibodies. 1 × 10⁵ cells and 0.5 × 10⁵ antibody-loaded beads were added to a 96-well flat bottom plate (Cellstar, Greiner-Bio One, Austria) in a complete medium containing anti-CD107a (Supplementary Table 2). After 1 hour of incubation, monensin (Invitrogen, USA) was added to all wells, and incubation continued for 4 additional hours. Cells were harvested and washed, followed by intracellular staining with anti-IFNγ (Supplementary Table 2) using the Cytofix/Cytoperm Fixation/Permeabilization Kit (BD, USA) according to manufacturer’s protocol. Measurements were performed on a Navios EX flow cytometer (Beckman Coulter, USA). Data were analyzed using FlowJo software (v10.7.1, BD, USA).
Protein isolation and Western blot
Cells were lysed and fractionated with the Nuclear Extraction Kit (Active Motif Inc., USA), and the protein concentration was determined using the Micro BCA™ Protein-Assay-Kit (ThermoFisher Scientific, USA). The nuclear fraction proteins were separated using SDS-PAGE (4–15% Mini-PROTEAN® TGX Stain-Free™ Protein Gels, 10 well, 30 µl, BioRad, USA) and transferred to a PVDF membrane (Immobilon®-FL PVDF membrane, Merck, Germany). The membranes were first blocked in 5% 1X TBST containing 5% milk powder (Roth, Germany) for 1 h at RT, second incubated for 1 h at RT with primary antibodies (Supplementary Table 2), and third stained with a species-matched HRP-conjugated secondary antibody (Supplementary Table 2) for 1 h at RT. Proteins were detected using the Clarity™ Western ECL Substrate (BioRad, USA), a ChemiDoc XRS+ System (BioRad, USA), and the ImageLab Software (v4.1, BioRad, USA).
Library preparation and single-cell RNA sequencing
1 × 10⁴ cells of each experimental condition of a single donor were used for single-cell library preparation using the Chromium X Series (10X Genomics, USA) and the Chromium Next GEM Single Cell 3’ GEM, Library and Gel Bead Kit 3.1 (10X Genomics) according to manufacturer’s protocol (User Guide: Chromium Next GEM Single Cell 3’ Reagent Kits v3.1). Libraries were sequenced by the DRESDEN-concept Genome Center (DcGC) and analyzed using Cell Ranger (V 4.0.0; 10X Genomics). For downstream analysis of the scRNA-seq samples (Supplementary Table 5), the Seurat package (V 3.2.157,30) was used in R (V 3.6.358). An extended description of analysis settings is given in Supplementary Table 1. Free mRNA contamination was removed via SoupX (V 1.4.8),31 and doublets were identified using DoubletFinder 2.0.3;32 the loosest estimation referenced in the Chromium Single Cell 3’ Reagent Kits User Guide v3 Chemistry. Individual Seurat files were merged and normalized (SCT) to create an integrated dataset with Harmony 1.0.33 Human cell type markers from the Human Cell Atlas were assigned cluster identities. A total of 3000 randomly chosen high quality cells per experimental condition were taken for further analysis.
Scores of naivety and innateness were calculated by the average expression levels of related genes (Supplementary Table 6) on single cell level, subtracted by the aggregated expression of control feature sets (100).
RNA isolation, cDNA synthesis, and quantitative PCR (qPCR)
Total RNA was isolated using TRIzol™ Reagent (Invitrogen, ThermoFisher Scientific, USA), and the SuperScript™ II Reverse Transcriptase (ThermoFisher Scientific, USA) was used for reverse transcription and cDNA synthesis according to manufacturer’s protocol. Power™ SYBR™ Green Master Mix (Applied Biosystems, ThermoFisher Scientific, USA) was used for qPCR in a 7500 Real-Time PCR system (Applied Biosystems). Further information is included in Supplementary Table 1. The mRNA expression level of ZNF683 relative to β2 M was calculated, and the results for mock control and BCL11B knock-out samples are shown relative to nt control. Ten independent experiments were performed, and the data are shown as the mean ± standard error of the mean (SEM) values.
Genomic DNA (gDNA) isolation and regular PCR
Total gDNA was isolated using the innuPREP DNA Mini Kit (Analytik Jena, Germany) according to manufacturer’s protocol. Advantage® 2 Polymerase Mix (Takara Bio Europe, France) was used for PCR. The BCL11B exon 4 targeting primers and PCR conditions are described in Supplementary Table 1. PCR products were loaded to a 2% agarose (VWR, Germany) gel containing peqGREEN (VWR, Germany) and detected using a UV Solo gel documentation system (Analytik Jena, Germany).
Microarray
Cells were lysed in TRIzol™ Reagent (Invitrogen, ThermoFisher Scientific, USA) and short time stored at −20°C. Microarray analysis was performed by ATLAS Biolabs (Germany) using the Affymetrix Human Clariom™ S GeneChip (Applied Biosystems, ThermoFisher Scientific, USA). Data were analyzed with the “Signal Space Transformation-regular robust multiple-array average normalization method” (SST-RMA) algorithm by the Transcriptome Analysis Console (TAC) software (v4.0.2.15, ThermoFisher, USA).
Cell-mediated cytotoxicity assays
100 µl cell culture medium with 10,000 iRFP tumor cells were seeded in a 96 well ultra-low attachment U-bottom plate (S-BIO, USA) and centrifuged at 300 g. K562 cells were used immediately, and CHLA-136 cells were incubated for 72 h at 37°C and 5% CO2 to ensure proper spheroid formation. 50,000 T cells were added to achieve an effector to target (E:T) ratio of 5:1. For antibody-dependent cell-mediated cytotoxicity (ADCC) against CHLA-136, 10 µg/ml of an anti-GD2 antibody34 were added to the reaction at a final volume of 200 µl.
Tumor cell fluorescence intensity was measured every 3 h for 96 h at 37°C and 5% CO2 using the IncuCyte® SX5 live-cell analysis system (Sartorius, Germany). Spheroid viability was calculated as a ratio of total integrated fluorescence intensity of every time point to fluorescence at 0 h (baseline). Viability is reported as mean percentage ± SEM.
Statistical analysis
Normal (Gaussian) distribution was tested with the Shapiro–Wilk normality test. Unpaired t test was used for the comparison of two dependent and normally distributed groups. Mann–Whitney test was applied for the comparison of two independent and normally distributed groups. An ordinary one-way analysis of variance (ANOVA) with Tukey’s multiple comparisons test was used to analyze more than two normally distributed groups. Kruskal–Wallis test with Dunn’s multiple comparisons test was used to analyze more than two groups which were not normally distributed. To analyze time-dependent kinetics, an ordinary two-way ANOVA with Tukey’s multiple comparisons test was used. All tests are indicated in each individual figure legend. *P ≤ 0.05, **P ≤ 0.01, ***P ≤ 0.001, and ****P ≤ 0.0001 were used as significance levels. The analysis was performed using Prism 9 software (V 9.3.1, GraphPad, USA).
Results
CRISPR/Cas9-mediated BCL11B knock-out in human CD8 + T cells
It was shown that loss of Bcl11b in mature murine CD8+ T-lymphocytes leads to induction of NK cell features combined with the retention of T cell phenotype and functions.20 To investigate the impact of BCL11B depletion in human CD8+ T cells, we applied a CRISPR/Cas9 based knock-out targeting three loci at the beginning of exon 4 of BCL11B (Figure 1(a)). Signals of fluorescently-labeled trans-activating crRNA (tracrRNA), annealed with BCL11B- or nonspecific (mock) crRNAs, showed high transfection efficacy (Figure 1(b)). This triple-target approach led to all three predicted BCL11B deletions (Figure 1(c)). Moreover, by cloning the band not differing in size from non-edited controls into bacterial plasmids followed by sequencing, we confirmed a high frequency (80%) of point mutations (data not shown). The Cas9-induced point mutations and fragment deletions collectively led to highly efficient BCL11B depletion confirmed on the protein level (Figure 1(d,e)).
Figure 1.

Efficacy of BCL11B knock-out in CD8+ T cells enriched from PBMC. (a) BCL11B locus with magnified exon 4 including primer (arrows) and cRNA binding sites. Fragments are labeled with the predicted sizes of PCR products. (b) Flow cytometry histogram of fluorescence-labeled tracrRNA signal 24 h after transfection. (c) Representative agarose gel showing PCR products of genomic DNA templates with CRISPR/Cas9 target loci-spanning primers as indicated in (a). (d) Representative Western blot showing BCL11B levels in relation to HDCA1 in the nuclear fraction. (e) Normalized protein level to nt of mock condition and BCL11B knock-out, mean ±SEM. Statistical significance was calculated by unpaired t test. nt: not transfected control, trans: transfected-only control (no gRNA), mock: mock gRNA transfected, BCL11B KO: BCL11B knock-out, TSS: transcription start site. ****P ≤ 0.0001.
IL-15 induces NKp30 and CD56 expression in BCL11B knock-out cells
Untouched CD56–CD8+ T cells were isolated from buffy coats of healthy donors by negative selection with magnetic beads. The phenotype of freshly isolated CD56–CD8+ T cells excluded expression of NK cell-related surface markers (Supplementary Figure 1a). BCL11B knock-out was performed in non-stimulated cells directly after isolation, followed by CD3/CD28 activation (Transact, Miltenyi) and cytokine supplementation. It is well established that IL-2 leads to long-term proliferation and survival of T cells in vitro35 and in combination with loss of Bcl11b induced ITNK cells in a murine system.20 However, BCL11B knock-out in human CD8+ T cells combined with IL-2-supplementation led only to a minor induction of CD56 and NKp46 on the surface (Supplementary Figure 1b). Changing the cytokine regime to IL-7 combined with IL-15, previously proven to boost T cell fitness in vitro,36 gave rise to CD8+ T cells with multiple NK cell molecules on their surface. BCL11B-knock-out with IL-15 alone allowed the generation of this phenotype (data not shown), but since IL-7 was shown to enhance the survival of T cells in vitro,36 we did not exclude it from our studies. Visualization of cell population via dimension reduction of flow cytometry data by t-Distributed Stochastic Neighbor Embedding (t-SNE) revealed a clear separation of BCL11B knock-out CD8+ T cells. The BCL11B knock-out CD8+ T cells were primarily characterized by CD56 and NKp30 innate receptor expression and exhibited a higher frequency of NKp44- and NKp46-expressing cells compared to both controls (Figure 2(a)). Additionally, up to 30% of BCL11B knock-out CD8+ cells acquired the type III Fcγ receptor CD16 (Figure 2(a,b)). It was already reported that IL-15 supplementation leads to de novo expression of NKp30 and CD56 in human CD8+ T cells,23 and this effect was confirmed in our not transfected (nt) and mock controls. However, the frequency of NKp30+ and CD56+ cells and the corresponding mean fluorescence intensities (MFI) values were significantly higher in BCL11B-depleted cells (Figure 2(c)). Expression of NKp30 was acquired in all three experimental groups but was observed in BCL11B knock-out cells at the earliest 7 d after stimulation. On day 14, a significant percentage of BCL11B knock-out cells converted to NKp30+ CD56+ while this population was still barely detectable in controls. At the final analysis point (21 d), the majority of BCL11B knock-out cells were double positive for both innate receptors. In contrast, control cells mainly remained negative for NKp30, and only approximately 30% of them displayed CD56 on the cell surface (Figure 2(d)). Additionally, BCL11B knock-out led to an inversion of the CD45 isoforms profile. The amount of CD45RA+ cells was significantly higher, whereas expression levels and the number of CD45RO+ cells were reduced in the BCL11B-depleted cells compared to both nt and mock controls (Figure 2(e)). It was shown that expression of CD57 on human T cells is indicative of lymphocyte senescence and is associated with short telomeres, which collectively disable proliferation and expansion of CD57+ cells.37 Interestingly, in addition to acquired NK features, we observed strong reduction of surface CD57 upon BCL11B knock-out (Figure 2(f)). To test whether BCL11B depletion may lead to different outcomes in T cells at different maturation stages, we FACS-sorted naïve, memory, and effector cells based on the expression of CCR7 and CD45RA antigens. Due to limited numbers of purified memory and effector cells, increased toxicity of the electroporation procedure observed for these subpopulations, and culture conditions favoring more immature phenotypes, we failed to collect data meeting the statistical significance criteria. The naïve cells, in turn, were successfully electroporated and efficiently expanded until a full-blown effect could be observed (Supplementary Figure 1c). Because BCL11B depletion in naïve and non-fractionated CD8+ T cells populations resulted in comparable outcomes, all following experiments were performed without prior enrichment. Interestingly, depletion of BCL11B in CD4+ T cells induced expression of CD56 and NKp30, though at lower frequencies as observed on CD8+ T cells, but not expression of NKp44, NKp46, and CD16 (Supplementary Figure 1d).
Figure 2.
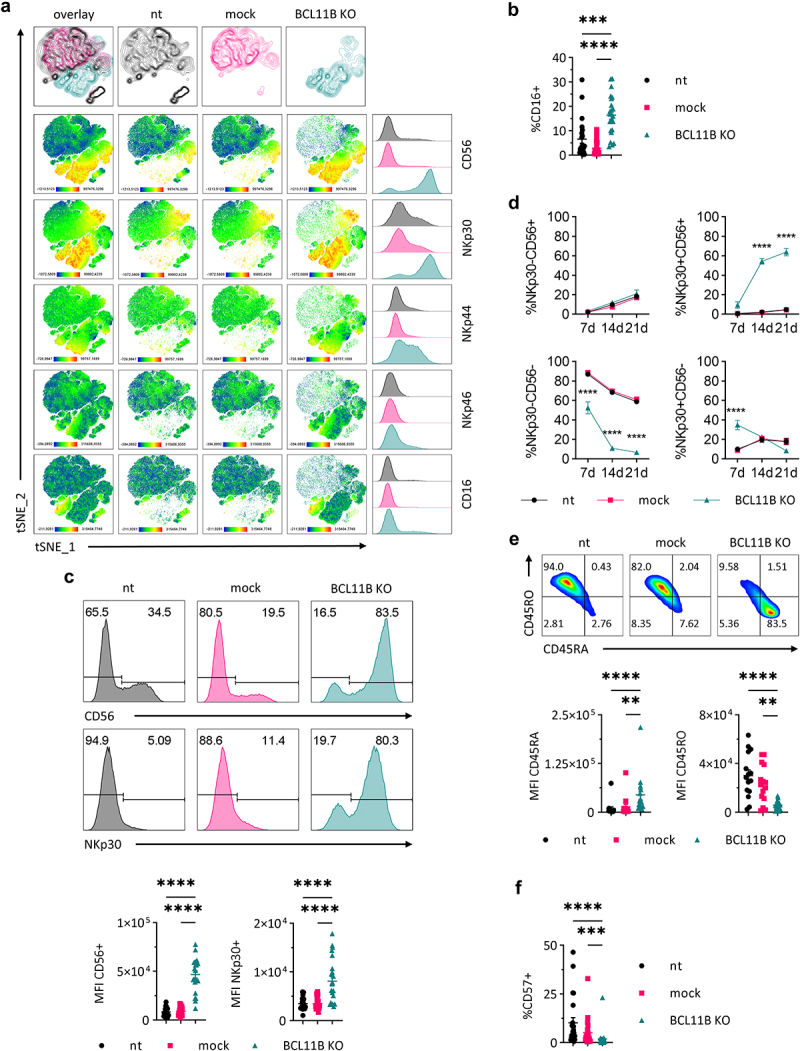
BCL11B deletion in CD8+ T cells results in altered immunophenotype (a) First row: tSNE plots showing clustering of the complete concatenated sample as an overlay of all conditions or separately for each experimental condition. Second till last row: tSNE plots showing the surface abundance of the indicated markers in a complete concatenated sample (overlay) or separately for each experimental condition. Last column: flow cytometry histograms show staining of the indicated markers separately for each experimental condition in the concatenated sample. All plots contain cumulative results of 16 different individuals. (b) Percentage of CD16+ cells in each experimental condition measured by flow cytometry, mean ± SEM. (c) Top: flow cytometric staining for CD56 and NKp30 in one representative individual. Bottom: MFI of CD56+ and NKp30+ cells in each experimental condition, mean ± SEM, n = 15. (d) Percentage of indicated populations over time measured by flow cytometry, mean ± SEM, n = 18–31. (e) Top: frequency of CD45RO and CD45RA cells in each experimental condition determined by flow cytometry in one representative individual. Bottom: MFI of CD45RA and CD45RO in each experimental condition, mean ± SEM, n = 15. (f) Percentage of CD57+ cells in each experimental condition measured by flow cytometry, mean ± SEM, n = 25. nt: not transfected control, mock: mock gRNA transfected control, BCL11B KO: BCL11B knock-out. MFI: mean fluorescence intensity. Statistical significance of not normally distributed data sets (b, c [MFI NKp30+], e [MFI CD45RA], f) was calculated by the Kruskal–Wallis test with Dunn’s multiple comparisons test correction and of normally distributed data sets (c [MFI CD56+], e [MFI CD45RO]) was calculated by the One-way ANOVA with Tukey’s multiple comparisons test correction. Statistical significance of time-dependent kinetics (d) was calculated by the Two-way ANOVA with Tukey’s multiple comparisons test correction. *P ≤ 0.05, **P ≤ 0.01, ***P ≤ 0.001, ****P ≤ 0.0001.
BCL11B knock-out CD8+ T cells exhibit a unique transcriptomic profile
Genome-wide microarray analysis was performed to investigate the impact of BCL11B knock-out on the transcriptome of CD8+ T cells. Hierarchical clustering of microarray samples revealed differences between mock and nt controls as well as a distinct expression profile of BCL11B knock-out CD8+ T cells (Figure 3(a), Supplementary Table 7). Although NKp30 was strongly upregulated on the cell surface of BCL11B knock-out cells compared to both nt and mock controls (Figure 2(a, c, d)), NCR3 expression was equally high for all three experimental groups (Supplementary Figure 2), indicating post-transcriptional processes being responsible for this phenomenon. On the other hand, the most upregulated gene observed in BCL11B knock-out CD8+ cells compared to controls in the microarray data was FCER1G, encoding for FcεRIγ. Besides CD3ζ, FcεRIγ functions as a signal transmitting adaptor for NKp30 and ensures its surface localization.39 The transduction of NKp30 signaling starts with phosphorylation of the immunoreceptor tyrosine-based activation motif (ITAM) encoded within the FcεRIγ cytoplasmatic tail. This step can, among others, be mediated by LYN kinase,40 and also, LYN transcription was significantly enhanced upon BCL11B knock-out, further signifying the induction of this innate signaling pathway. Along with LYN and FCER1G, multiple genes known to be highly expressed in NK cells but not in T cells, like CCNJL and PTGDR,41 were strongly activated upon BCL11B deletion suggesting a more general shift of the transcription program and phenotype toward innate-like cells. In contrast, downregulation of CD28, the T cell-related co-stimulatory receptor, was observed on the RNA level (Figure 3(b)), while the encoded protein remained unchanged on the surface. Additionally, Gene Set Enrichment Analysis (GSEA) revealed “NK cell-mediated Cytotoxicity” as the top significantly upregulated pathway in BCL11B knock-out CD8+ T cells (Kyoto Encyclopedia of Genes and Genomes – KEGG) (Figure 3(c)). The acquisition of an NK cell-like transcription profile was accompanied by downregulation of genes engaged in antigen processing and presentation, and here mainly HLA class II molecules: HLA-DP, HLA-DQ, and HLA-DR were strongly repressed in the knock-out transcriptome (Supplementary Table 7). Comparison of genes differentially expressed (DE) in BCL11B knock-out CD8+ T cells compared to mock control cells with gene lists derived from publicly available expression profiles of human T and NK cells (Supplementary Table 8, 9)38 uncovered upregulation of other genes associated with innate/NK cells like transcription factors ZBTB16 and HOPX, surface markers CD244 and FCGR3A, and effector molecule PRF1. Of note, although the majority of NK cell-associated genes were upregulated, knock-out of BCL11B led to repression of few effector molecules like GZMH (Figure 3(d)). Furthermore, a fraction of T cell-associated genes such as CCR7 and ICOS were downregulated (Figure 3(e)). On top of the lineage-related alterations, the BCL11B-deficient T cells induced genes like CTSW and CD247 (CD3ζ) normally engaged by both T cell and the NK cell to execute their effector functions (Figure 3(f)). Additionally, BCL11B-depleted CD8+ T cells induced ZNF683 (Figure 3(g)), the transcription factor described as a crucial regulator of human NK cell development and a marker for quiescent human effector-type CD8+ T cells.42,43
Figure 3.

Global transcriptome analysis of BCL11B knock-out CD8+ T cells exhibits a unique phenotype characterized by upregulation of various genes related to innate lymphocyte populations. (a) Heatmap of detected genes in BCL11B knock-out (KO) cells, not transfected (nt) control, and mock control cells. Hierarchical clustering of columns was performed using the Euclidean distance method. (b) Volcano plot showing differential gene expression in BCL11B knock-out compared to mock control cells. Genes significantly upregulated and downregulated are shown in magenta and teal, respectively. Dashed lines indicate cutoff at absolute log2 ratio ≥ 0.5 and −log10 false discovery rate (FDR) q-value < 0.05. (c) A combined bar and dot plot shows enriched KEGG pathways in BCL11B knock-out cells compared to mock control cells. The normalized enrichment score (NES) is shown as black bars. Positive NES values indicate enrichment in the BCL11B knock-out condition, while negative values result from enrichment in the mock condition. FDR q-values are plotted as magenta dots. (d, e, f) Heatmaps of NK, T, and overlapping cell identity genes which are curated by a public database38 and were detected in this dataset (g) Gene expression of ZNF683 in BCL11B knock-out cells and mock control relative to ZNF683 expression in nt control cells, mean ± SEM, n = 10 (dashed line set to 1). Statistical significance was calculated by the Mann–Whitney test. nt: not transfected control, mock: mock gRNA transfected control, BCL11B KO: BCL11B knock-out. **P ≤ 0.01.
Signal transduction and cytoskeleton are induced by BCL11B knock-out
To verify whether the differential expression of the identified genes triggered different protein abundances as well, we performed a proteome analysis using liquid chromatography-coupled tandem mass spectrometry. Gene Set Enrichment (GSEA) revealed significant differences in proteomes of BCL11B knock-out cells compared to mock controls. Multiple proteins associated with actin cytoskeleton regulation and related pathways like inositol phosphate metabolism, phosphatidylinositol signaling, and focal adhesion were found at higher levels in the BCL11B knock-out cells and seemed to be involved in converting the extracellular stimuli into intracellular signals.44–46 Furthermore, proteins of the leukocyte transendothelial migration pathway, which is closely related to the previously mentioned pathways, displayed higher abundances in BCL11B knock-out cells. In contrast, antigen processing and presentation were negatively regulated by BCL11B knock-out (Figure 4(a)). The processes significantly affected upon BCL11B excision contained multiple nodal proteins integrating various cellular responses. An example of such a core factor is paxillin, an adaptor crucial for shaping the interface between the plasma membrane and the actin cytoskeleton, engaged in actin cytoskeleton organization, focal adhesion, and transendothelial migration.47 Paxillin showed a 2.2-fold increase in the proteomics data set upon BCL11B knock-out. Besides, the integrin ITB1 and actin, related to various cell-to-cell and membrane-cytoskeleton interactions, were substantially upregulated in BCL11B-deficient cells (Figure 4(b)).
Figure 4.

Proteins with altered abundances after BCL11B knock-out in CD8+ T cells displayed enrichment in pathways related to signal transduction and actin cytoskeleton regulation. (a) A combined bar and dot plot shows KEGG pathways with enrichment of proteins displaying altered protein abundances in BCL11B knock-out cells compared to mock control cells. The normalized enrichment score (NES) from GSEA is shown as black bars. Positive NES values indicate increased abundances in the BCL11B knock-out condition, while negative values result from higher protein abundances in the mock condition. FDR q-values are plotted as magenta dots. (b) Selected proteins from KEGG pathways shown in Figure 4 A. Compared to mock control, the depicted proteins exhibited significantly changed abundances in the global proteome analysis (absolute fold change ≥ 1.5, P ≤ 0.05) in BCL11B knock-out CD8+ T cells. (c) Top: representative flow cytometry plots showing ITGA1 and ITGAX signals in each experimental condition. Bottom: percentage of ITGA+, ITAGX+, and ITGA1+ ITAGX+ cells detected by flow cytometry, mean ± SEM, n = 3. Statistical significance was calculated by the One-way ANOVA with Tukey’s multiple comparisons test correction. nt: not transfected control, mock: mock gRNA transfected control, BCL11B KO: BCL11B knock-out. *P ≤ 0.05, **P ≤ 0.01.
Moreover, the concomitant flow cytometry analysis showed upregulation of ITA1 and ITAX. Both integrins co-operate with other adhesome factors in forming bidirectional signaling hubs and play a critical role in NK cell activation48 (Figure 4(c)). We further observed the varying influence of BCL11B deletion on signaling events downstream of the membrane/cytoskeleton level. Phosphatidylinositol 4-kinase alpha (PI4KA) and the inositol polyphosphate-4-phosphatase type I A (INP4A), both participating in phosphatidylinositol signaling and inositol phosphate metabolism, were significantly upregulated in BCL11B knock-out cells. In contrast, kinases of the MAPK cascade system acting upstream of PAK1 were downregulated47 (Figure 4(b)). The downregulation of the antigen processing and presentation-related factors revealed earlier by expression profiling was confirmed on the proteome level: both HLA class I molecules (HLA-E) and HLA class II molecules (HLA-DR and HLA-DQ) were reduced due to BCL11B removal (Figure 4(a, b)).
BCL11B knock-out cells gain innate features on the cost of naïve phenotype
After extensive surface marker profiling, we observed other less frequent discrete subpopulations next to the dominating NKp30+CD56+ phenotype. Single-cell (sc)RNA sequencing of BCL11B knock-out and control cells was performed to pin down the source of the observed heterogeneity of the differentiated population. The analysis of the obtained expression data resulted in 16 distinct harmonized clusters (Supplementary Figure 3). The relative abundance of the cells in each cluster differed between the experimental conditions (Supplementary Table 10). Clusters containing DE genes (DEGs) related to an innate or NK cell phenotype like cluster 6 (marked by increased expression of XCL1, HOPX, and FCER1G genes, among others, Supplementary Table 11) contained a higher number of cells in BCL11B knock-out samples than in controls. On the other hand, cluster 0, grouping cells that displayed DEGs related to naivety like CCR7 and SELL, was relatively less abundant in BCL11B knock-out CD8+ T cells (Supplementary Table 10, 11). This initial observation prompted us to create simplified parameters that would cumulatively describe the “naïve-to-innate” conversion. The innateness and naivety scores, as we named them, were developed based on genes associated with naïve T cell or innate lymphocytes’ phenotypes (Supplementary Table 6).22,49 This approach confirmed decreased expression of genes associated with the naïve phenotype upon BCL11B knock-out (Figure 5(a)). In contrast, the parameter describing innateness showed an increase in the majority of BCL11B knock-out clusters but particularly in those demonstrating high naivety score values in control samples (Figure 5(b)).
Figure 5.

Single-cell transcriptome profiles of BCL11B knock-out in comparison to control T cells. Cells lacking BCL11B exhibited a partial loss of naivety and gain of innate-like phenotype. Dot plots show changes in (a) naivety score or (b) innateness score between the three experimental conditions. Scores were calculated by average expression of lineage-specific genes listed in Supplementary Table 6. (c) Heatmap generated from microarray results of global transcriptome analysis showing differential expression of PLCG1 and PLCG2 as well as LYN and FCER1G, n = 3. (d) Representative Western blot shows differential protein abundance of PLZF, ID2, and HOPX in relation to HDAC1 used as a nucleus-specific loading control. nt: not transfected control, mock: mock gRNA transfected control, BCL11B KO: BCL11B knock-out.
Besides changes in genes related to naivety and innateness in BCL11B knock-out, we observed a switch from PLCG1 to PLCG2 expression. Both genes encode for PLCγ enzymes, which are key nodes in cellular signal transduction and are of varying importance for different lymphocyte lineages.50 While PLCγ1 dominates in T lymphocytes, PLCγ2 is not expressed by human CD8+ T cells but is essential for NK cell cytotoxicity and innate immunity against malignant and virally infected cells.51 BCL11B knock-out led to a partial loss of PLCG1 and gain of PLCG2 expression accompanied by increased expression of FCER1G and LYN, two genes encoding proteins involved in the upstream events in the PLCγ signaling cascade (Figure 5(c)). The evidenced shift of transcriptome profile from naïve toward an innate phenotype was further supported by increased protein levels of the key innate transcription factors. The amount of PLZF protein encoded by the ZBTB16 gene was highly increased in BCL11B knock-out cells compared to controls. The helix-loop-helix inhibitor of differentiation ID2, essential for the normal development of NK cells,52 was also induced in BCL11B knock-out samples. Additionally, HOPX, a factor previously proven to be enriched in effector NK and effector CD8+ T cells compared to their naïve counterpart,53 demonstrated increased abundance after BCL11B knock-out in our study (Figure 5(d)).
Costimulatory but not inhibitory surface molecules are upregulated in CD8+ BCL11B knock-out T cells
The physiological response to TCR-mediated antigen recognition involves two opposing and equally important mechanisms: (i) signal amplification that ensures adequate response and (ii) termination of the signal transduction to avoid uncontrolled, permanent, and therefore potentially harmful activated state. The two control mechanisms employ several costimulatory and inhibitory factors that act in opposite directions to maintain T cell homeostasis.54 The BCL11B knock-out cells revealed upregulation of several genes encoding for receptors associated with co-activation of T cells like CD40LG and CD63,55,56 while the mRNA level of the main activating co-receptor CD28 markedly declined. These changes were accompanied by a downregulated expression of the inhibitory genes like PDCD1, CTLA4, TIGIT, and LAG3 (Figure 6(a)). The surface expression of CD63 was strongly induced in almost all, whereas CD40LG was upregulated in about 30% of BCL11B knock-out cells. We also observed elevated expression of CD161 (KLRB1), which is a marker for innateness in the T cell compartment57 and is enriched in less differentiated NK cell subpopulations.58 The upregulated TNFRSF18 (GITRL) cannot be definitely categorized as activating or inhibiting co-receptor in the presented context. This surface molecule plays opposing roles in NK and T lineages: it acts as an inhibitor in NK cells but increases the TCR-mediated proliferation of T cells59 (Figure 6(b)).
Figure 6.
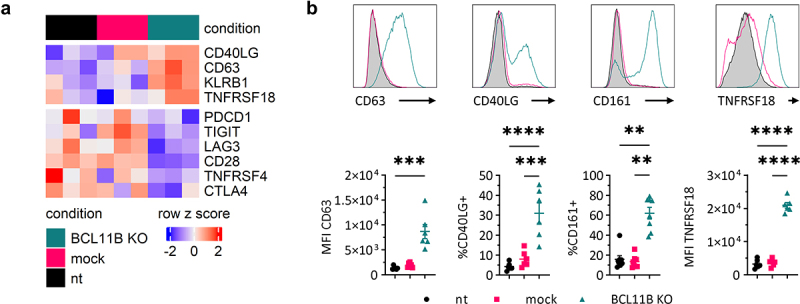
Gene expression and surface marker profile of costimulatory and inhibitory receptors upon BCL11B knock-out. (a) Gene expression heatmap of curated costimulatory and inhibitory receptor genes, n = 3. (b) Top: representative flow cytometry histograms showing surface expression of indicated markers in nt control (gray filled), mock control (magenta line), and BCL11B knock-out (teal line) cells. Bottom: MFI or percentage (as indicated) of CD63, CD40LG, CD161, and TNFRSF18. Mean ± SEM, n = 3. nt: not transfected control, mock: mock gRNA transfected control, BCL11B KO: BCL11B knock-out. Statistical significance was calculated by Kruskal–Wallis test with Dunn’s multiple comparisons test (CD63, CD161) or by One-way ANOVA with Tukey’s multiple comparisons test (CD40LG, TNFRSF18). **P ≤ 0.01, ***P ≤ 0.001, ****P ≤ 0.0001.
The innate receptor NKp30 triggers activation of BCL11B knock-out CD8+ T cells
To verify whether knock-out-induced innate receptors were functional, BCL11B-depleted CD8+ T cells and the corresponding controls were incubated with activating antibody-covered beads, followed by measurement of degranulation and interferon gamma (IFNγ) production. Interestingly, although knock-out cells evidently upregulated NKp44 and to a lesser extent NKp46, we could induce IFNγ production and degranulation only by stimulation with anti-NKp30 (Figure 7(a)). This surprising observation indicates the insufficiency of downstream signaling pathway components, like adaptor molecule DAP12,39 which was not upregulated along with NKp44 (data not shown). On the other hand, we observed a certain level of synergism between anti-NKp30 and anti-NKG2D treatments, though anti-NKG2D alone showed no induction of IFNγ production and degranulation. Combinations of anti-NKp44 and anti-NKp46 with anti-NKp30 did not show any synergistic effects (Figure 7(b)). As described earlier, we observed an upregulation of multiple innate features in BCL11B knock-out CD8+ T lymphocytes, which was associated with minor deficits of some T-lineage-related factors, both on the levels of transcriptome and cellular surface. To evaluate whether BCL11B knock-out cells retained their function as T cells, we incubated them and the corresponding controls with anti-CD3 or with a combination of anti-CD3 and anti-NKp30 activating antibodies. BCL11B knock-out CD8+ T cells produed IFNγ at levels comparable to controls. Staining the degranulation marker CD107a also did not reveal significant differences between nt, mock, and BCL11B knock-out cells. Unlike for NKG2D, no synergistic effect of the anti-CD3 and anti-NKp30 combination was observed (Figure 7(c)).
Figure 7.

Degranulation and IFNγ production by BCL11B knock-out CD8+ T cells compared to controls. (a–c) Representative flow cytometry plots (left) showing degranulation as CD107a induction and IFNγ production and percentage (right) of CD107a+ or IFNγ+ cells after stimulation with beads presenting (a) a single antibody, (b) a combination of two antibodies, and (c) anti-CD3 alone or in combination with anti-NKp30. Mean ± SEM, n = 5. Statistical significance was calculated by two-way ANOVA with Tukey’s multiple comparisons test. nt: not transfected control, mock: mock gRNA transfected control, BCL11B KO: BCL11B knock-out. *P ≤ 0.05, **P ≤ 0.01, ***P ≤ 0.001, ****P ≤ 0.0001.
BCLL1B knock-out CD8+ T cells kill leukemic cells and solid tumor-mimicking spheroids
The ability of NK cells to kill K562 tumor cells in vitro has been well established.60 We could demonstrate that knock-out of BCL11B in human CD8+ T cells gave rise to cells with high spontaneous, antibody-independent cytotoxic potential against K562 cells. Not only the growth of target cells was successfully inhibited, but also was the amount of target cells reduced to 20% of initially seeded numbers after 96 h by BCL11B knock-out CD8+ T cells-mediated target cell lysis (Figure 8(a)). To prove a dominant role of BCL11B excision-induced NKp30 in the observed antibody-independent cellular cytotoxicity (AICC), we generated a variant of K562 cell line deficient for the NKp30 ligand B7H6 (NCR3LG1) (Supplementary Figure 4). As expected, CD8+ BCL11B knock-out T cells were not effectively killing the B7H6-deficient K562 target cells, suggesting that AICC against K562 cells is mainly mediated via NKp30 (Figure 8(b)). The appearance of the Fc receptor CD16 on the surface of a fraction of BCL11B knock-out CD8+ T cells prompted us to investigate whether this innate receptor, typically not expressed on αβ T cells, can be productively activated. We incubated the BCL11B knock-out and control cells with an antibody against the tumor-associated antigen disialoganglioside (GD2) and the GD2+ NKp30-resistant neuroblastoma cell line CHLA-136 grown as spheroids.61 CD8+ BCL11B knock-out T cells reduced the size of tumor spheroids by 65% compared to initial size within 96 h, whereas expansion of tumor spheroids was only slightly limited by the addition of nt or mock control cells (Figure 8(c)). The observed antibody-dependent cellular cytotoxicity (ADCC) was mediated by anti-GD2 antibody and CD16 as incubation of BCL11B knock-out cells without or with an isotype control antibody did not affect CHLA-136 tumor growth (Figure 8(d)).
Figure 8.

Cytotoxic activity of BC11B knock-out CD8+ T cells against leukemic or neuroblastoma tumor cell lines. (a, b) Spontaneous cell-mediated cytotoxicity of BCL11B knock-out cells and controls against (a) K562 infrared fluorescent protein (iRFP) expressing or (b) K562 B7H6 knock-out (KO) iRFP target cells. (c) Antibody-dependent cell-mediated cytotoxicity of BCL11B knock-out cells and controls in presence of anti-GD2 against CHLA-136 iRFP target cells. (d) Cell-mediated cytotoxicity of BCL11B knock-out cells in the absence or presence of anti-GD2 or an isotype control antibody (ITC). Mean ± SEM, n = 5–6. nt: not transfected control, mock: mock gRNA transfected control, BCL11B KO: BCL11B knock-out. Statistical significance was calculated by Mann–Whitney test. **P ≤ 0.01.
Discussion
BCL11B plays an essential role during the differentiation of various T lymphocyte populations, mostly by restricting the development of innate lymphoid cells while promoting the development of T cells.5,14,16,19 Intriguingly, the NK cell lineage initially suppressed by BCL11B to enable adaptive T cell commitment also utilizes the gradient of BCL11B expression to control functions.6 Multiple studies postulate that borders between innate and adaptive lymphatic arms of the immune system are fluent. Many physiologically occurring lymphocyte subsets, like MAIT, γδ, iNKT cells, or adaptive NK cells with memory features, do not fit exactly into the binary classification.23,62 Moreover, plasticity and drifting of lymphocytes between innate and adaptive states can be observed in various diseases.24,63,64 This feature can also be induced by cytokines and signaling through surface receptors, both in vitro and in vivo.23,65 Here, we demonstrate that BCL11B depletion in human circulating CD8+ T lymphocytes activated via CD3/CD28 and IL-15 results in the generation of induced innate CD8+ T (iiT8) cells combining multiple innate and adaptive features. In addition to the innate-like transcription and surface marker profiles, these cells acquired TCR independent cytotoxicity against transformed cells. Interestingly, the NK-related proficiency was not accompanied by loss of T cell identity. Except for reduced naivety markers, the majority of iiT8 cells maintained their adaptive nature and expanded upon TCR/CD3 re-stimulation. Similar effects were observed in a murine system.20 Acute loss of Bcl11b led to the generation of Induced-T-to-NK (ITNK) cells that lost their T-lineage properties when treated at immature states or preserved T cell features if derived from fully differentiated lymphocytes.20 As described in mice, human CD4+ T cells could not be forced to the lineage “deviation” observed in the CD8+ compartment,20 but despite successful BCL11B depletion, the acquisition of innate phenotype was restricted to low expression of NKp30 compared to CD8+ T cells (Supplementary Figure 1d). BCL11B knock-out combined with a high concentration of IL-2 led to some level of “innateness” in CD4+ cells, though the magnitude of the effect was significantly compromised compared to CD8+ cells.25 Besides the naturally occurring innate T cell populations like γδ, MAIT, or iNKTs, CD8+ αβ T cells equipped with innate killing potential were described in individuals suffering from diverse diseases. Chronic cytomegalovirus infections, celiac disease, and distinct autoimmune conditions lead to the development of oligoclonal T/NK cell chimeras with strong TCR-independent cytotoxic potential. Of note, the frequencies of these cells correlated with serum IL-15 levels, which highlighted the importance of this cytokine for T-to-NK transition. This innateness-promoting features of IL-15 were ultimately confirmed by proving its potential to de novo generate innate-like NKp30+FCER1G+CD8+ cells from circulating αβ CD8+ T cells.23 Although a significant portion of the effects described here were in part induced by IL-15 supplementation, our data show that BCL11B loss but not IL-15 enables the appearance of NKp30 receptor on the cell surface. Although IL-15 replacement with IL-2 reduced the acquisition of some innate features and limited the expansion and longevity of BCL11B-depleted cells, a significant surface expression of NKp30 remained, a finding in line with a recent report by Peng et al.25 This indicated, in turn, that IL-15 signaling acted upstream of and was capable to, though incompletely, inhibit BCL11B expression in CD8+ T cells, as a prerequisite for their plasticity. Our data imply that direct BCL11B targeting to a great extent reproduced the IL-15-induced phenotype, which was enhanced and preserved by IL-15 supplementation. Interestingly, NKp30 seems not to represent a direct de-repressed target of BCL11B. In our experimental setting, the non- and mock-treated controls expressed NKp30 mRNA at levels similar to BCL11B-deficient cells (Supplementary Figure 2). It suggests the pivotal role of IL-15 in its induction and confirms the key role of the FcεRIγ adaptor for the surface expression of NKp30.23 Notably, the transcriptome profiling identified FCER1G mRNA as the most upregulated gene in BCL11B-depleted cells. Moreover, we show that genes encoding signaling molecules acting downstream of FcεRIγ, like PLCG2 and LYN, were significantly induced. The concomitant downregulation of PLCG1 further confirmed a shift toward the innate-like expression profile. Similar to other described innate T cell populations, the iiT8 cells upregulated the key innate transcription factors like ZBTB16, ID2, or HOPX, known to promote the NK cell development and invariant NKT cell differentiation.66,67 Sottile et al.24 recently characterized a cytomegalovirus-induced NKG2C+CD8+ T cell population with low BCL11B and innate-like features, demonstrating varying effects of different stimulation routes on BCL11B knock-out in human CD8+ T cells. The low rate of innateness induction compared to the approach presented here further supports the synergism between BCL11B depletion and IL-15. Regardless of the efficiency, a combination of CD3/CD28 stimulation and IL-2 induced NKp30 in our BCL11B-depleted iiT8 cells. Although the “IL-15-only” approach produced innate T cells resembling the IL-15-stimulated BCL11B knock-out iiT8 lymphocytes described here, some crucial differences could also be revealed between these two induced innate T cell subsets. In our setting, IL-15-mediated expression of CD56 or NKp30 was observed in a small fraction of control cells going in line with the results from Correia et al.23 Interestingly, in these controls, cells simultaneously expressing both NK cell markers occurred with barely detectable frequencies while iiT8 cells were characterized by a CD56+NKp30+ double-positive phenotype on the majority of cells next to a partial expression of NKp44 and low levels of NKp46. Despite the presence of the three NCR-encoded receptors, the functional analysis demonstrated that while signal transmission via NKp30 was productive, stimulation with anti-NKp44 and anti-NKp46 antibodies was not (Figure 7(a)), indicating missing or unavailable components of the signal transduction pathways for these two NK receptors. Indeed, we did not notice significant upregulation of DAP12 necessary for NKp44 signal transmission.39 Rather limited levels of this receptor might cause the defective NKp46 activation. Moreover, despite increased expression of CD247 encoding for the NKp46 adaptor CD3ζ, it may remain saturated by at least two more receptor complexes, the TCR and CD16. The “competition” between different natural killer receptors encoded by the NCR gene family was also demonstrated by the most recent BCL11B knock-out report. The preferential induction of NKp30 or NKp46 correlated with the differentiation status, with memory cells being mostly positive for the first and effectors expressing the second.25
Despite similarities to the formerly described innate CD8+ lymphocytes, the iiT8 cells were characterized by several unique features. First, they acquired the functional Fc-receptor CD16, efficiently mediating antibody-dependent cellular cytotoxicity (ADCC) in a spheroid neuroblastoma solid tumor model. Second, the iiT8 cells displayed a set of proteins related to signaling pathways relevant for migration through the vascular endothelium. This suggests iiT8 cells might be not only effective against hematological malignancies but also capable of infiltrating and eradicating solid tumors. Potential tissue homing and memory properties are supported by CD161 surface molecule expression. This KLRB1-encoded receptor was shown to be expressed on a fraction of naturally occurring T cells exhibiting varying levels of NK cell-like innate activity and is considered a marker of “innateness” among T cells.57 The co-expression of CD8 and CD161 was observed in some subsets of T cells like MAIT,68 a unique population of CD8+ memory cells with enhanced effector functions69,70 or defined as a marker for tissue-resident T cells.70 In principle, CD161+CD8+ cells were characterized by elevated effector molecules like granzymes and perforin, resulting in enhanced cytotoxicity, high proliferative capacity, and spontaneous, chemokine-independent tissue-homing. Moreover, this phenotype was strongly associated with memory and stem cell-like properties.71,72 An adoptive cellular therapy approach based on CD161+ T cells provided efficient and durable protection against pancreatic ductal adenocarcinoma in a murine model. Importantly, upregulation of KLRB1 followed by surface expression of CD161 seems to be unique for iiT8 cells. No differential KLRB1 expression was observed in CMV-induced CD8+NKG2C+ T cells.24 In the IL-15-only-induced CD8+NKp30+ cells, KLRB1 showed even reversed regulation and was identified as one of the most significantly down-regulated genes. No induction of CD161 was shown for the high IL-2-supplemented BCL11B knock-out cells.25
Taken together, enhanced cytotoxicity of the iiT8 cells combined with a lack of exhaustion markers make them ideal candidates for cell-based approaches against aggressive solid tumors that remain beyond the therapeutic range of the current cellular therapies efficient mostly against hematologic malignancies. Although the high IL-2 levels coupled with BCL11B depletion resulted in mild therapeutic effects in patients with advanced tumors,25 this could be due to the predominance of terminally differentiated effector cells, which preferentially develop under these conditions. Consequently, the IL-2-induced T-to-NK cells express CTLA-4, TIGIT, and PD-1 inhibitory receptors, which surely compromise their therapeutic potential. A finding in line with the observation that despite high cytotoxic activity these effector cells suffer from poor expansion and survival in vivo73 and are therefore rather undesirable in adoptive transfer approaches. In contrast, the iiT8 cells that arise from BCL11B-depleted and IL-15 stimulated CD8+ lymphocytes developed and preserved the more capable effector-memory characteristics lacking the inhibitory receptors which promise superior therapeutic effects. Moreover, as revealed by single-cell sequencing, the innate phenotype developed efficiently in naïve BCL11B knock-out cells predispose them to long-term survival resulting from short proliferative history.
Recently, the concept of exclusive innate or adaptive features of lymphoid cells was replaced by a dynamic gradient of innate and adaptive properties.22 The gradient reflects a compromise between effector and proliferative capacities, which could be reduced to a “kill-OR-expand” rule with native and induced innate T cells being constrained by employing either cytotoxicity or proliferation.22 From that perspective, the BCL11B-knock-out-IL-15 approach might overcome this limitation. The iiT8 cells showed a high capacity to respond to antigen stimulation, killed target cells efficiently, and proliferated rapidly without signs of exhaustion. The subtle but putatively relevant discrepancies between the innate CD8+ cells from various sources confirm the crucial role of BCL11B expression for innate-adaptive plasticity and imply further flexibility revealed by diverse routes of stimulation. The combination of easy access due to high CD8+ frequency among PBMCs, efficiency of innate transition, and the chimeric innate/effector/memory phenotype additionally armed with ADCC activity and enhanced migration and homing properties seem unique and favor for testing their intrinsic therapeutic potential alone or in a chimeric antigen receptor (CAR)-based approach in vivo. Furthermore, our findings also emphasize an immunomodulatory potential of a BCL11B-targeting drug-based strategy to be developed.
Supplementary Material
Acknowledgments
We thank Martin Delin, Anja Wiechert, Theodor Köpp, Kathrin Aßmus, and Maria Asmus for excellent technical support. As well thanks to the Deep Sequencing Team of the Dresden-concept Genome Center for sequencing of the scRNA libraries.
Funding Statement
The author(s) reported there is no funding associated with the work featured in this article.
Disclosure statement
The authors report there are no competing interests to declare.
Data availability statement
Proteome analysis. All data are available at the PRIDE Archive74 (http://www.ebi.ac.uk/pride/archive/) of the ProteomeXchange Consortium75 through accession number PXD033542.
Microarray. The data discussed in this publication have been deposited in NCBI’s Gene Expression Omnibus76 and are accessible through GEO Series accession number GSE200101 (https://www.ncbi.nlm.nih.gov/geo/query/acc.cgi?acc=GSE200101).
Single-cell RNA sequencing. All obtained data are available in the ArrayExpress database77 (http://www.ebi.ac.uk/arrayexpress) under accession number E-MTAB-12064.
Supplementary material
Supplemental data for this article can be accessed online at https://doi.org/10.1080/2162402X.2022.2148850
References
- 1.Golonzhka O, Leid M, Indra G, Indra AK.. Expression of COUP-TF-interacting protein 2 (CTIP2) in mouse skin during development and in adulthood. Gene Expression Patterns: GEP. 2007;7(7):754–18. doi: 10.1016/j.modgep.2007.06.002. [DOI] [PMC free article] [PubMed] [Google Scholar]
- 2.Golonzhka O, Metzger D, Bornert J-M, Bay BK, Gross MK, Kioussi, C, Leid, M. Ctip2/Bcl11b controls ameloblast formation during mammalian odontogenesis. Proceedings of the National Academy of Sciences of the United States of America. 2009;106 (11):4278–4283. doi: 10.1073/pnas.0900568106. [DOI] [PMC free article] [PubMed] [Google Scholar]
- 3.Cai S, Kalisky T, Sahoo D, Dalerba P, Feng W, Lin Y, Qian D, Kong A, Yu J, Wang F, et al. A quiescent Bcl11b high stem cell population is required for maintenance of the mammary gland. Cell Stem Cell. 2017;20(2):247–260.e5. doi: 10.1016/j.stem.2016.11.007. [DOI] [PMC free article] [PubMed] [Google Scholar]
- 4.Arlotta P, Molyneaux BJ, Jabaudon D, Yoshida Y, Macklis JD. Ctip2 controls the differentiation of medium spiny neurons and the establishment of the cellular architecture of the striatum. The Journal of Neuroscience: the Official Journal of the Society for Neuroscience. 2008;28(3):622–632. doi: 10.1523/JNEUROSCI.2986-07.2008. [DOI] [PMC free article] [PubMed] [Google Scholar]
- 5.Liu P, Li P, Burke S. Critical roles of Bcl11b in T-cell development and maintenance of T-cell identity. Immunological Reviews. 2010;238(1):138–149. doi: 10.1111/j.1600-065X.2010.00953.x. [DOI] [PubMed] [Google Scholar]
- 6.Holmes TD, Pandey RV, Helm EY, Schlums H, Han H, Campbell TM, Drashansky TT, Chiang S, Wu C-Y, Tao C, et al. The transcription factor Bcl11b promotes both canonical and adaptive NK cell differentiation. Science Immunology. 2021;6(57). doi: 10.1126/sciimmunol.abc9801. [DOI] [PMC free article] [PubMed] [Google Scholar]
- 7.Avram D, Fields A, Senawong T, Topark-Ngarm A, Leid M. COUP-TF (chicken ovalbumin upstream promoter transcription factor)-interacting protein 1 (CTIP1) is a sequence-specific DNA binding protein. The Biochemical Journal. 2002;368(2):555–563. doi: 10.1042/bj20020496. [DOI] [PMC free article] [PubMed] [Google Scholar]
- 8.Zhang L-J, Vogel WK, Liu X, Topark-Ngarm A, Arbogast BL, Maier CS, Filtz TM, Leid M. Coordinated regulation of transcription factor Bcl11b activity in thymocytes by the mitogen-activated protein kinase (MAPK) pathways and protein sumoylation. The Journal of Biological Chemistry. 2012;287(32):26971–26988. doi: 10.1074/jbc.M112.344176. [DOI] [PMC free article] [PubMed] [Google Scholar]
- 9.Dubuissez M, Loison I, Paget S, Vorng H, Ait-Yahia S, Rohr O, Tsicopoulos A, Leprince D. Protein Kinase C-Mediated Phosphorylation of BCL11B at Serine 2 Negatively Regulates Its Interaction with NuRD Complexes during CD4 + T-Cell Activation. Molecular and Cellular Biology. 2016;36(13):1881–1898. doi: 10.1128/MCB.00062-16. [DOI] [PMC free article] [PubMed] [Google Scholar]
- 10.Wakabayashi Y, Inoue J, Takahashi Y, Matsuki A, Kosugi-Okano H, Shinbo T, Mishima Y, Niwa O, Kominami R. Homozygous deletions and point mutations of the Rit1/Bcl11b gene in γ-ray induced mouse thymic lymphomas. Biochemical and Biophysical Research Communications. 2003;301(2):598–603. doi: 10.1016/S0006-291X(02)03069-3. [DOI] [PubMed] [Google Scholar]
- 11.Przybylski GK, Dik WA, Wanzeck J, Grabarczyk P, Majunke S, Martin-Subero JI, Siebert R, Dölken G, Ludwig W-D, Verhaaf B, et al. Disruption of the BCL11B gene through inv(14)(q11.2q32.31) results in the expression of BCL11B-TRDC fusion transcripts and is associated with the absence of wild-type BCL11B transcripts in T-ALL. Leukemia. 2005;19(2):201–208. doi: 10.1038/sj.leu.2403619. [DOI] [PubMed] [Google Scholar]
- 12.Kamimura K, Mishima Y, Obata M, Endo T, Aoyagi Y, Kominami R. Lack of Bcl11b tumor suppressor results in vulnerability to DNA replication stress and damages. Oncogene. 2007;26(40):5840–5850. doi: 10.1038/sj.onc.1210388. [DOI] [PubMed] [Google Scholar]
- 13.Grabarczyk P, Przybylski GK, Depke M, Völker U, Bahr J, Assmus K, Bröker BM, Walther R, Schmidt CA. Inhibition of BCL11B expression leads to apoptosis of malignant but not normal mature T cells. Oncogene. 2007;26(26):3797–3810. doi: 10.1038/sj.onc.1210152. [DOI] [PubMed] [Google Scholar]
- 14.Di Santo JP. Immunology. A guardian of T cell fate. Science. 2010;329(5987):44–45. doi: 10.1126/science.1191664. [DOI] [PubMed] [Google Scholar]
- 15.Longabaugh WJR, Zeng W, Zhang JA, Hosokawa H, Jansen CS. et al, (2017) Bcl11b and combinatorial resolution of cell fate in the T-cell gene regulatory network Proceedings of the National Academy of Sciences of the United States of America . 114 (23): 5800–5807 doi: 10.1073/pnas.1610617114. [DOI] [PMC free article] [PubMed] [Google Scholar]
- 16.Hosokawa H, Romero-Wolf M, Yui MA, Ungerbäck J, Quiloan MLG, Matsumoto M, Nakayama KI, Tanaka T, Rothenberg EV. Bcl11b sets pro-T cell fate by site-specific cofactor recruitment and by repressing Id2 and Zbtb16. Nature Immunology. 2018;19(12):1427–1440. doi: 10.1038/s41590-018-0238-4. [DOI] [PMC free article] [PubMed] [Google Scholar]
- 17.Hirose S, Touma M, Go R, Katsuragi Y, Sakuraba Y, Gondo Y, Abe M, Sakimura K, Mishima Y, Kominami R, et al. Bcl11b prevents the intrathymic development of innate CD8 T cells in a cell intrinsic manner. International Immunology. 2015;27(4):205–215. doi: 10.1093/intimm/dxu104. [DOI] [PubMed] [Google Scholar]
- 18.Kastner P, Chan S, Vogel WK, Zhang L-J, Topark-Ngarm A. et al . Bcl11b represses a mature T-cell gene expression program in immature CD4+CD8+ thymocytes. European Journal of Immunology. 2010;40(8):2143–2154. doi: 10.1002/eji.200940258. [DOI] [PMC free article] [PubMed] [Google Scholar]
- 19.Wakabayashi Y, Watanabe H, Inoue J, Takeda N, Sakata J. et al . Bcl11b is required for differentiation and survival of αβ T lymphocytes. Nature Immunology. 2003;4(6):533–539. doi: 10.1038/ni927. [DOI] [PubMed] [Google Scholar]
- 20.Li P, Burke S, Wang J, Chen X, Ortiz M, Lee S-C, Lu D, Campos L, Goulding D, Ng BL, et al. Reprogramming of T cells to natural Killer–like cells upon Bcl11b deletion. Science (New York, N.Y.). 2010;329(5987):85–89. doi: 10.1126/science.1188063. [DOI] [PMC free article] [PubMed] [Google Scholar]
- 21.Monaco G, Lee B, Xu W, Mustafah S, Hwang YY, Carré C, Burdin N, Visan L, Ceccarelli M, Poidinger M, et al. RNA-seq signatures normalized by mRNA abundance allow absolute deconvolution of human immune cell types. Cell Reports. 2019;26(6):1627–1640.e7. doi: 10.1016/j.celrep.2019.01.041. [DOI] [PMC free article] [PubMed] [Google Scholar]
- 22.Gutierrez-Arcelus M, Teslovich N, Mola AR, Polidoro RB, Nathan A, Kim H, Hannes S, Slowikowski K, Watts GFM, Korsunsky I, et al. Lymphocyte innateness defined by transcriptional states reflects a balance between proliferation and effector functions. Nature Communications. 2019;10(1):687. doi: 10.1038/s41467-019-08604-4. [DOI] [PMC free article] [PubMed] [Google Scholar]
- 23.Correia MP, Stojanovic A, Bauer K, Juraeva D, Tykocinski L-O. et al . (2018) Distinct human circulating NKp30+FcεRIγ+CD8+ T cell population exhibiting high natural killer-like antitumor potential Proceedings of the National Academy of Sciences of the United States of America . 115 (26): E5980–E5989 doi: 10.1073/pnas.1720564115. [DOI] [PMC free article] [PubMed] [Google Scholar]
- 24.Sottile R, Panjwani MK, Lau CM, Daniyan AF, Tanaka K, Barker JN, Brentjens RJ, Sun JC, Le Luduec J-B, Hsu KC, et al. Human cytomegalovirus expands a CD8 + T cell population with loss of BCL11B expression and gain of NK cell identity. Science Immunology. 2021;6(63):eabe6968. doi: 10.1126/sciimmunol.abe6968. [DOI] [PMC free article] [PubMed] [Google Scholar]
- 25.Jiang Z, Qin L, Tang Y, Liao R, Shi J, He B, Li S, Zheng D, Cui Y, Wu Q, et al. Human induced-T-to-natural killer cells have potent anti-tumour activities. Biomarker Research. 2022;10(1):13. doi: 10.1186/s40364-022-00358-4. [DOI] [PMC free article] [PubMed] [Google Scholar]
- 26.Blankenburg S, Hentschker C, Nagel A, Hildebrandt P, Michalik S, Dittmar D, Surmann K, Völker U. Improving proteome coverage for small sample amounts: an advanced method for proteomics approaches with low bacterial cell numbers. Proteomics. 2019;19(23):e1900192. doi: 10.1002/pmic.201900192. [DOI] [PubMed] [Google Scholar]
- 27.Suomi T, Elo LL. Enhanced differential expression statistics for data-independent acquisition proteomics. Scientific Reports. 2017;7(1):5869. doi: 10.1038/s41598-017-05949-y. [DOI] [PMC free article] [PubMed] [Google Scholar]
- 28.Mootha VK, Lindgren CM, Eriksson K-F, Subramanian A, Sihag S, Lehar J, Puigserver P, Carlsson E, Ridderstråle M, Laurila E, et al. PGC-1α-responsive genes involved in oxidative phosphorylation are coordinately downregulated in human diabetes. Nature Genetics. 2003;34(3):267–273. doi: 10.1038/ng1180. [DOI] [PubMed] [Google Scholar]
- 29.Subramanian A, Tamayo P, Mootha VK, Mukherjee S, Ebert BL. et al . (2005) Gene set enrichment analysis: a knowledge-based approach for interpreting genome-wide expression profiles Proceedings of the National Academy of Sciences of the United States of America . 102 (43): 15545–15550 doi: 10.1073/pnas.0506580102. [DOI] [PMC free article] [PubMed] [Google Scholar]
- 30.Stuart T, Butler A, Hoffman P, Hafemeister C, Papalexi E, Mauck WM, Hao Y, Stoeckius M, Smibert P, Satija R, et al. Comprehensive integration of single-cell data. Cell. 2019;177(7):1888–1902.e21. doi: 10.1016/j.cell.2019.05.031. [DOI] [PMC free article] [PubMed] [Google Scholar]
- 31.Young MD, Behjati S. SoupX removes ambient RNA contamination from droplet-based single-cell RNA sequencing data. GigaScience. 2020;9(12). doi: 10.1093/gigascience/giaa151. [DOI] [PMC free article] [PubMed] [Google Scholar]
- 32.McGinnis CS, Murrow LM, Gartner ZJ. DoubletFinder: doublet detection in single-cell RNA sequencing data using artificial nearest neighbors. Cell Systems. 2019;8(4):329–337.e4. doi: 10.1016/j.cels.2019.03.003. [DOI] [PMC free article] [PubMed] [Google Scholar]
- 33.Korsunsky I, Fan J, Slowikowski K, Zhang F, Wei K. et al . Fast, sensitive, and accurate integration of single cell data with Harmony Nature methods 16 12 1289–1296 doi: 10.1038/s41592-019-0619-0 . 2018. [DOI] [PMC free article] [PubMed] [Google Scholar]
- 34.Mueller BM, Romerdahl CA, Gillies SD, Reisfeld RA. Enhancement of antibody-dependent cytotoxicity with a chimeric anti-GD2 antibody. Journal of Immunology. 1990;144(4):1382–1386. Baltimore, Md.: 1950. [PubMed] [Google Scholar]
- 35.Hedfors IA, Brinchmann JE. Long-term proliferation and survival of in vitro-activated T cells is dependent on Interleukin-2 receptor signalling but not on the high-affinity IL-2R. Scandinavian Journal of Immunology. 2003;58(5):522–532. doi: 10.1046/j.1365-3083.2003.01338.x. [DOI] [PubMed] [Google Scholar]
- 36.Rathmell JC, Farkash EA, Gao W, Thompson CB. IL-7 enhances the survival and maintains the size of naive T cells. The Journal of Immunology. 2001;167(12):6869–6876. doi: 10.4049/jimmunol.167.12.6869. Baltimore, Md.: 1950. [DOI] [PubMed] [Google Scholar]
- 37.Brenchley JM, Karandikar NJ, Betts MR, Ambrozak DR, Hill BJ, Crotty LE, Casazza JP, Kuruppu J, Migueles SA, Connors M, et al. Expression of CD57 defines replicative senescence and antigen-induced apoptotic death of CD8+ T cells. Blood. 2003;101(7):2711–2720. doi: 10.1182/blood-2002-07-2103. [DOI] [PubMed] [Google Scholar]
- 38.Franzén O, Gan L-M, Björkegren JLM. PanglaoDB: a web server for exploration of mouse and human single-cell RNA sequencing data. Database: the Journal of Biological Databases and Curation. 2019;2019. doi: 10.1093/database/baz046. [DOI] [PMC free article] [PubMed] [Google Scholar]
- 39.Barrow AD, Martin CJ, Colonna M. The natural cytotoxicity receptors in health and disease. Frontiers in Immunology. 2019;10:909. doi: 10.3389/fimmu.2019.00909. [DOI] [PMC free article] [PubMed] [Google Scholar]
- 40.Quek LS, Pasquet J-M, Hers I, Cornall R, Knight G, Barnes M, Hibbs ML, Dunn AR, Lowell CA, Watson SP, et al. Fyn and Lyn phosphorylate the Fc receptor γ chain downstream of glycoprotein VI in murine platelets, and Lyn regulates a novel feedback pathway. Blood. 2000;96(13):4246–4253. doi: 10.1182/blood.V96.13.4246. [DOI] [PubMed] [Google Scholar]
- 41.Schmiedel BJ, Singh D, Madrigal A, Valdovino-Gonzalez AG, White BM, Zapardiel-Gonzalo J, Ha B, Altay G, Greenbaum JA, McVicker G, et al. Impact of Genetic Polymorphisms on Human Immune Cell Gene Expression. Cell. 2018;175(6):1701–1715.e16. doi: 10.1016/j.cell.2018.10.022. [DOI] [PMC free article] [PubMed] [Google Scholar]
- 42.Vieira Braga FA, Hertoghs KML, Kragten NAM, Doody GM, Barnes NA, Remmerswaal EBM, Hsiao -C-C, Moerland PD, Wouters D, Derks IAM, et al. Blimp-1 homolog hobit identifies effector-type lymphocytes in humans. European Journal of Immunology. 2015;45(10):2945–2958. doi: 10.1002/eji.201545650. [DOI] [PubMed] [Google Scholar]
- 43.Post M, Cuapio A, Osl M, Lehmann D, Resch U, Davies DM, Bilban M, Schlechta B, Eppel W, Nathwani A, et al. The transcription factor ZNF683/HOBIT regulates human NK-cell development. Frontiers in Immunology. 2017;8:535. doi: 10.3389/fimmu.2017.00535. [DOI] [PMC free article] [PubMed] [Google Scholar]
- 44.Zhang X, Majerus PW. Phosphatidylinositol signalling reactions. Seminars in Cell & Developmental Biology. 1998;9(2):153–160. doi: 10.1006/scdb.1997.0220. [DOI] [PubMed] [Google Scholar]
- 45.Grabon A, Bankaitis VA, McDermott MI. The interface between phosphatidylinositol transfer protein function and phosphoinositide signaling in higher eukaryotes. Journal of Lipid Research. 2019;60(2):242–268. doi: 10.1194/jlr.R089730. [DOI] [PMC free article] [PubMed] [Google Scholar]
- 46.Wu C. Focal adhesion: a focal point in current cell biology and molecular medicine. Cell Adhesion & Migration. 2007;1:13–18. [DOI] [PMC free article] [PubMed] [Google Scholar]
- 47.Turner CE. Paxillin and focal adhesion signalling. Nature Cell Biology. 2000;2(12):E231–6. doi: 10.1038/35046659. [DOI] [PubMed] [Google Scholar]
- 48.Hegewisch-Solloa E, Seo S, Mundy-Bosse BL, Mishra A, Waldman EH, Maurrasse S, Grunstein E, Connors TJ, Freud AG, Mace EM, et al. Differential integrin adhesome expression defines human NK cell residency and developmental stage. The Journal of Immunology. 2021;207(3):950–965. doi: 10.4049/jimmunol.2100162. Baltimore, Md.: 1950. [DOI] [PMC free article] [PubMed] [Google Scholar]
- 49.Appay V, Bosio A, Lokan S, Wiencek Y, Biervert C, Küsters D, Devevre E, Speiser D, Romero P, Rufer N, et al. Sensitive gene expression profiling of human T cell subsets reveals parallel post-thymic differentiation for CD4 + and CD8 + lineages. The Journal of Immunology. 2007;179(11):7406–7414. doi: 10.4049/jimmunol.179.11.7406. Baltimore, Md.: 1950. [DOI] [PubMed] [Google Scholar]
- 50.Wilde JI, Watson SP. Regulation of phospholipase C γ isoforms in haematopoietic cells. Cellular Signalling. 2001;13(10):691–701. doi: 10.1016/S0898-6568(01)00191-7. [DOI] [PubMed] [Google Scholar]
- 51.Caraux A, Kim N, Bell SE, Zompi S, Ranson T, Lesjean-Pottier S, Garcia-Ojeda ME, Turner M, Colucci F. Phospholipase C-γ2 is essential for NK cell cytotoxicity and innate immunity to malignant and virally infected cells. Blood. 2006;107(3):994–1002. doi: 10.1182/blood-2005-06-2428. [DOI] [PubMed] [Google Scholar]
- 52.Yokota Y, Mansouri A, Mori S, Sugawara S, Adachi S, Nishikawa S-I, Gruss P. Development of peripheral lymphoid organs and natural killer cells depends on the helix–loop–helix inhibitor Id2. Nature. 1999;397(6721):702–706. doi: 10.1038/17812. [DOI] [PubMed] [Google Scholar]
- 53.Bezman NA, Kim CC, Sun JC, Min-Oo G, Hendricks DW, Kamimura Y, Best JA, Goldrath AW, Lanier LL. Molecular definition of the identity and activation of natural killer cells. Nature Immunology. 2012;13(10):1000–1009. doi: 10.1038/ni.2395. [DOI] [PMC free article] [PubMed] [Google Scholar]
- 54.Carmo AM, Love PE, Marshall AJ. Editorial: inhibitory Receptors and Pathways of Lymphocytes. Frontiers in Immunology. 2020;11:1552. doi: 10.3389/fimmu.2020.01552. [DOI] [PMC free article] [PubMed] [Google Scholar]
- 55.Elgueta R, Benson MJ, de VVC, Wasiuk A, Guo Y, Noelle RJ. Molecular mechanism and function of CD40/CD40L engagement in the immune system. Immunological Reviews. 2009;229(1):152–172. doi: 10.1111/j.1600-065X.2009.00782.x. [DOI] [PMC free article] [PubMed] [Google Scholar]
- 56.Pfistershammer K, Majdic O, Stöckl J, Zlabinger G, Kirchberger S, Steinberger P, Knapp W. CD63 as an activation-linked T cell costimulatory element. The Journal of Immunology. 2004;173(10):6000–6008. doi: 10.4049/jimmunol.173.10.6000. Baltimore, Md.: 1950. [DOI] [PubMed] [Google Scholar]
- 57.Kurioka A, Klenerman P, Willberg CB. Innate-like CD8+ T-cells and NK cells: converging functions and phenotypes 154 4 547–556 doi: 10.1111/imm.12925. 2018. [DOI] [PMC free article] [PubMed] [Google Scholar]
- 58.Kurioka A, Cosgrove C, Simoni Y, van Wilgenburg B, Geremia A, Björkander S, Sverremark-Ekström E, Thurnheer C, Günthard HF, Khanna N, et al. CD161 defines a functionally distinct subset of pro-inflammatory natural killer cells. Frontiers in Immunology. 2018;9:486. doi: 10.3389/fimmu.2018.00486. [DOI] [PMC free article] [PubMed] [Google Scholar]
- 59.Barao I. The TNF receptor-ligands 4-1BB-4-1BBL and GITR-GITRL in NK cell responses. Frontiers in Immunology. 2012;3:402. doi: 10.3389/fimmu.2012.00402. [DOI] [PMC free article] [PubMed] [Google Scholar]
- 60.Zamai L, Mariani AR, Zauli G, Rodella L, Rezzani R, Manzoli FA, Vitale M. Kinetics of in vitro natural killer activity against K562 cells as detected by flow cytometry. Cytometry. 1998;32(4):280–285. doi: 10.1002/(SICI)1097-0320(19980801)32:4<280::AID-CYTO4>3.0.CO;2-M. [DOI] [PubMed] [Google Scholar]
- 61.Barry WE, Jackson JR, Asuelime GE, Wu H-W, Sun J, Wan Z, Malvar J, Sheard MA, Wang L, Seeger RC, et al. Activated natural killer cells in combination with Anti-GD2 antibody dinutuximab improve survival of mice after surgical resection of primary neuroblastoma. Clinical Cancer Research: an Official Journal of the American Association for Cancer Research. 2019;25(1):325–333. doi: 10.1158/1078-0432.CCR-18-1317. [DOI] [PMC free article] [PubMed] [Google Scholar]
- 62.Paust S, Blish CA, Reeves RK, Pierson TC. Redefining memory: building the case for adaptive NK cells. J Virol. 2017;91(20). doi: 10.1128/JVI.00169-17. [DOI] [PMC free article] [PubMed] [Google Scholar]
- 63.Wu Z, Lau CM, Sottile R, Le Luduec J-B, Panjwani MK. et al . Human cytomegalovirus infection promotes expansion of a functionally superior cytoplasmic CD3+ NK cell subset with a Bcl11b-regulated T cell signature. Journal of Immunology. 2021;207(10):2534–2544. doi: 10.4049/jimmunol.2001319. Baltimore, Md.: 1950. [DOI] [PMC free article] [PubMed] [Google Scholar]
- 64.Meresse B, Curran SA, Ciszewski C, Orbelyan G, Setty M, Bhagat G, Lee L, Tretiakova M, Semrad C, Kistner E, et al. Reprogramming of CTLs into natural killer–like cells in celiac disease. The Journal of Experimental Medicine. 2006;203(5):1343–1355. doi: 10.1084/jem.20060028. [DOI] [PMC free article] [PubMed] [Google Scholar]
- 65.Maluski M, Ghosh A, Herbst J, Scholl V, Baumann R. et al . Chimeric antigen receptor-induced BCL11B suppression propagates NK-like cell development. The Journal of Clinical Investigation. 2019;129(12):5108–5122. doi: 10.1172/JCI126350. [DOI] [PMC free article] [PubMed] [Google Scholar]
- 66.Savage AK, Constantinides MG, Han J, Picard D, Martin E. et al , . The transcription factor PLZF directs the effector program of the NKT cell lineage. Immunity. 2008;29(3):391–403. doi: 10.1016/j.immuni.2008.07.011. [DOI] [PMC free article] [PubMed] [Google Scholar]
- 67.Delconte RB, Shi W, Sathe P, Ushiki T, Seillet C, Minnich M, Kolesnik T, Rankin L, Mielke L, Zhang J-G, et al. The helix-loop-helix protein ID2 governs NK cell fate by tuning their sensitivity to interleukin-15. Immunity. 2016;44(1):103–115. doi: 10.1016/j.immuni.2015.12.007. [DOI] [PubMed] [Google Scholar]
- 68.Le Bourhis L, Martin E, Péguillet I, Guihot A, Froux N. et al . Antimicrobial activity of mucosal-associated invariant T cells. Nature Immunology. 2010;11(8):701–708. doi: 10.1038/ni.1890. [DOI] [PubMed] [Google Scholar]
- 69.Billerbeck E, Kang Y-H, Walker L, Lockstone H, Grafmueller S. et al . (2010) Analysis of CD161 expression on human CD8+ T cells defines a distinct functional subset with tissue-homing properties Proceedings of the National Academy of Sciences of the United States of America. 107(7): 3006–3011 doi: 10.1073/pnas.0914839107. [DOI] [PMC free article] [PubMed] [Google Scholar]
- 70.Fergusson JR, Hühn MH, Swadling L, Walker LJ, Kurioka A, Llibre A, Bertoletti A, Holländer G, Newell EW, Davis MM, et al. CD161(int)CD8+ T cells: a novel population of highly functional, memory CD8+ T cells enriched within the gut. Mucosal Immunology. 2016;9(2):401–413. doi: 10.1038/mi.2015.69. [DOI] [PMC free article] [PubMed] [Google Scholar]
- 71.Konduri V, Oyewole-Said D, Vazquez-Perez J, Weldon SA, Halpert MM, Levitt JM, Decker WK. CD8+CD161+ T-Cells: cytotoxic memory cells with high therapeutic potential. Frontiers in Immunology. 2021;11:613204. doi: 10.3389/fimmu.2020.613204. [DOI] [PMC free article] [PubMed] [Google Scholar]
- 72.Fergusson JR, Fleming VM, Klenerman P. CD161-expressing human T cells. Frontiers in Immunology. 2011;2:36. doi: 10.3389/fimmu.2011.00036. [DOI] [PMC free article] [PubMed] [Google Scholar]
- 73.Liu Y, Zhou N, Zhou L, Wang J, Zhou Y, Zhang T, Fang Y, Deng J, Gao Y, Liang X, et al. IL-2 regulates tumor-reactive CD8+ T cell exhaustion by activating the aryl hydrocarbon receptor. Nature Immunology. 2021;22(3):358–369. doi: 10.1038/s41590-020-00850-9. [DOI] [PubMed] [Google Scholar]
- 74.Perez-Riverol Y, Bai J, Bandla C, García-Seisdedos D, Hewapathirana S, Kamatchinathan S, Kundu D, Prakash A, Frericks-Zipper A, Eisenacher M, et al. The PRIDE database resources in 2022: a hub for mass spectrometry-based proteomics evidences. Nucleic Acids Research. 2022;50(D1):D543–D552. doi: 10.1093/nar/gkab1038. [DOI] [PMC free article] [PubMed] [Google Scholar]
- 75.Deutsch EW, Bandeira N, Sharma V, Perez-Riverol Y, Carver JJ, Kundu DJ, García-Seisdedos D, Jarnuczak AF, Hewapathirana S, Pullman BS, et al. The ProteomeXchange consortium in 2020: enabling ‘big data‘ approaches in proteomics. Nucleic Acids Research. 2020;48(D1):D1145–D1152. doi: 10.1093/nar/gkz984. [DOI] [PMC free article] [PubMed] [Google Scholar]
- 76.Edgar R, Domrachev M, Lash AE. Gene expression omnibus: NCBI gene expression and hybridization array data repository. Nucleic Acids Research. 2002;30(1):207–210. doi: 10.1093/nar/30.1.207. [DOI] [PMC free article] [PubMed] [Google Scholar]
- 77.Athar A, Füllgrabe A, George N, Iqbal H, Huerta L, Ali A, Snow C, Fonseca NA, Petryszak R, Papatheodorou I, et al. ArrayExpress update – from bulk to single-cell expression data. Nucleic Acids Research. 2019;47(D1):D711–D715. doi: 10.1093/nar/gky964. [DOI] [PMC free article] [PubMed] [Google Scholar]
Associated Data
This section collects any data citations, data availability statements, or supplementary materials included in this article.
Supplementary Materials
Data Availability Statement
Proteome analysis. All data are available at the PRIDE Archive74 (http://www.ebi.ac.uk/pride/archive/) of the ProteomeXchange Consortium75 through accession number PXD033542.
Microarray. The data discussed in this publication have been deposited in NCBI’s Gene Expression Omnibus76 and are accessible through GEO Series accession number GSE200101 (https://www.ncbi.nlm.nih.gov/geo/query/acc.cgi?acc=GSE200101).
Single-cell RNA sequencing. All obtained data are available in the ArrayExpress database77 (http://www.ebi.ac.uk/arrayexpress) under accession number E-MTAB-12064.