

Abstract
Small ruler tapes are commonly placed on the surface of the human body as a simple and efficient reference for capturing on images the physical size of a lesion. In this paper, we describe our proposed approach for automatically extracting the measurement information from a ruler in oral cavity images which are taken during oral cancer screening and follow up. The images were taken during a study that aims to investigate the natural history of histologically defined oral cancer precursor lesions and identify epidemiologic factors and molecular markers associated with disease progression. Compared to similar work in the literature proposed for other applications where images are captured with greater consistency and in more controlled situations, we address additional challenges that our application faces in real world use and with analysis of retrospectively collected data. Our approach considers several conditions with respect to ruler style, ruler visibility completeness, and image quality. Further, we provide multiple ways of extracting ruler markings and measurement calculation based on specific conditions. We evaluated the proposed method on two datasets obtained from different sources and examined cross-dataset performance.
Keywords: Oral images, ruler measurement, ruler segmentation, digits detection, cross-dataset evaluation, deep learning
I. Introduction
Oral cancer is one of the most common cancers in Asia and the Pacific region. Worldwide, its incidence and mortality are estimated to be around 380,000 and 180,000, respectively [1]. Main etiological factors for oral cancer are tobacco and alcohol consumptions (particularly the use of smokeless tobacco and betel quid) which are the major carcinogenic exposures in many low- and middle-income countries [2]. National Cancer Institute (NCI), part of the U.S. National Institutes of Health (NIH), and collaborators at five hospitals in Taiwan have been conducting a prospective cohort study to investigate the natural history of histologically defined oral cancer precursor lesions and identify epidemiologic factors and molecular markers associated with disease progression. The NIH does not have direct participant contact. Therefore, per the Common Rule, it is exempt from IRB, however local Institutional Review Boards at the National Taiwan University, Chang Gung Memorial Hospital, and China Medical University Hospital approved the study protocol and informed consent. Participants with and without clinically defined precursor lesions were recruited over 3 years. Subjects with clinical precursors are followed-up every 6 months for a period of 5 years, while controls and invasive cancer cases were discharged after just one visit. Biopsies were collected from patients with visible clinical precursor lesions at the annual study visit. Other data including exfoliated cells, oral rinse, saliva, and venous blood are also collected. In addition, at each visit, multi-field digital images are taken from different anatomical sites of the oral cavity, viz., the right buccal mucosa, the left buccal mucosa, the top of the mouth, the dorsal tongue, the ventral tongue, and the floor of the mouth.
Lesion size measurement and monitoring the change in its sizes over time are important for oral cancer assessment, diagnosis, and treatment. Lesion size on the accessible surface of the human body is measured using a simple and inexpensive method by placing a ruler adjacent to the lesion. Images with a reference ruler can also help examine the relative size of lesions among different subjects and over time. In the NCI-Taiwan Oral Cancer Study, pictures of the mouth with and without the ruler are taken.
Human prediction of dysplastic oral lesions and oral squamous cell carcinomas (SCC) through visual inspection has been observed to be very challenging and requires significant training and expertise [3]. Given the recent advance of deep learning in applications in both general domain and medical domain, it is of interest and importance to investigate the potential of automated visual evaluation (AVE), i.e., applying deep learning, image processing, computer-aided diagnosis techniques, to improve the performance of visual assessment.
As a part of the preprocessing steps in our oral cancer AVE pipeline, we have made efforts to develop methods for classifying images into six categories of anatomical sites [4], as well as extracting images containing a ruler (henceforth called “ruler images”) [5]. In this paper, we present a new method to automatically segment the ruler region and extract measurement information from the ruler (depending on whether it is fully visible in the image or not). Based on the measurement information, the correspondence between the physical size and pixel size of the ruler can be established, and the physical size of a lesion to be detected in another module of the AVE pipeline can be estimated.
In literature, there is limited research work on automatic object physical size calculation from images. To include a measuring ruler in the photographed scene and use it to estimate the size or length of object of interest, there are several applications, such as wound area and skin lesion measurement, fish size estimation, and forensic object measurement. In [6], the authors applied a technique based on structure tensor filter [7] to extract the ruler skeleton and identify the checkboard points attached on the ruler. In [8], the authors developed an algorithm based on the Fourier transform to automatically locate a section of a ruler in an image of a fish. In [9], the authors estimated the direction and graduation spacing of rulers in forensic photographs using spectral analysis and wavelength of the ruler graduations.
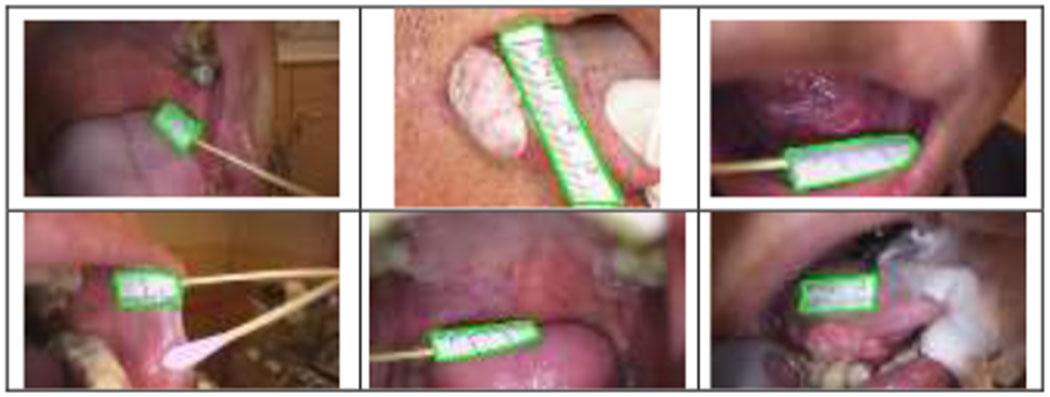
Compared to these applications, the challenges our application faces can be demonstrated by the sample images from the two batches of images that we have received and were collected by different providers from two different hospitals. As shown by these images in Figure 1 and 2, the rulers used by different hospitals may be of different styles; the ruler may or may not have digits on it and the digits may be different from ruler to ruler; a ruler may not be fully captured or visible in the image; and the lines on the rulers may be of different styles. Besides these varieties, unlike other applications in literature that also investigated extracting ruler measurement automatically such as dermatologic images and fish images, the entire ruler usually cannot be positioned on a plane that is orthogonal to the camera axis since lesions are inside an oral cavity. Therefore, the rulers have a large variance of angles and perspectives. In addition, the ruler usually cannot be put on the oral surfaces and kept immobile without being held by hand. Therefore, there might be blur and low contrast in the captured images. Also, in our application, rather than being the single and dominant object of interest (such as wound or fish in other applications) with a relatively uniform background, the lesions (and the rulers) can appear in various locations within mouth and may be quite smaller than the other regions, and the background has a variety of appearance.
Fig. 1.

Example images in 1st batch (from hospital A) that contain a ruler
Fig. 2.

Example images in 2nd batch (from hospital B) that contain a ruler
Aiming to develop a robust method that addresses/considers all above issues/challenges, we proposed a method that consists of four main components: 1) ruler segmentation; 2) detection of ruler digits; 3) detection and extraction of the ruler side that has the hash marks (the ruler could be placed in all directions); and 4) locating ruler scale lines. To examine the issue of domain/data shift that is often encountered in real world use, we designed the experiments to not only evaluate the performance within the dataset from a single source but also the performance across datasets (or data sources). Specifically, we not only used the images from the first batch (from hospital A) to train, validate, and test the algorithms, but also tested and evaluated the algorithms on the images from the second batch (from hospital B).
In summary, our main contributions in this paper include:
Propose a new automatic approach to extract measurement information from small ruler tapes for the estimation of the physical size of lesions in the oral cavity.
The proposed method considers several conditions of rulers with respect to ruler style, ruler completeness, and image quality and provides multiple ways of measurement calculation based on what the condition might be.
The method is evaluated on two datasets obtained from different sources and the cross-dataset performance is examined.
Our method or some components of the method can be extended to other medical images in which a ruler is used as a reference. The rest of the paper is organized as follows: Section II describes the specific method used in each of the main components; Section III provides information on datasets, results obtained from each component, and discussions on experimental results and analysis; Section IV concludes the paper and discuss possible future work.
II. Methods
The proposed method contains the following modules: 1) ruler segmentation; 2) ruler digits detection; 3) ruler measuring side extraction; and 4) ruler scale lines locating. The details on each module are described below.
A. Ruler Segmentation
Segmenting the ruler in the image is an important step for ruler measurement calculation and its accuracy affects the performance of other three modules. To segment the ruler, we employed Mask R-CNN [10], a network that adds a branch of an object mask prediction to the existing branch of the object detection network (Faster R-CNN) for bounding box recognition. To train, validate, and test Mask R-CNN for ruler segmentation, we manually marked the rulers with polygons in the ruler images in the first batch. Since the ruler only takes a small portion of the image compared to the background (as shown in Figure 1 and 2), we did not include images that do not contain a ruler (named as non-ruler images) in the training and validation sets (consist of images in the 1st batch only). However, the test set of the 1st batch contains both ruler images and non-ruler images. We also used all the images in the 2nd batch (which contains a lot of non-ruler images and ruler images in which the style of rulers can be quite different from that of the 1st batch) to evaluate the model. In our previous work [5], we had compared two classification networks for separating ruler images from non-ruler images as well as the heatmaps of the two classification models generated using three saliency methods. Ruler segmentation results obtained by current work can also be used to identify ruler images, and we will discuss and compare on this aspect with the results in [5].
B. Ruler Digits Detection
The rulers in the 1st batch may have digits 0 to 4. The distance between those digits can be used as a measurement of length. Using digits to calculate measurement suits for a ruler regardless of whether the ruler is fully visible/segmented, as long as the ruler has digits. To detect digits, we employed the object detection network RetinaNet [11]. RetinaNet is a one stage detector that uses the focal loss to alleviate the high imbalance between object regions and background regions. Often, object detection networks are initialized using the weights of COCO dataset [12] pretrained models. For our application, we also considered fine-tuning the RetinaNet model pretrained with the Street View House Numbers (SVHN) Dataset [13]. SVHN dataset was obtained from house numbers in Google Street View images dataset and it contains more than 600,000 digits of house numbers in natural scenes. Figure 3 shows a few examples of SVHN dataset images with each digit box marked in blue. Compared to the well-known MNIST dataset which consists of images of each individual handwritten digit, SVHN is more suitable for object detection work. We conducted a pilot test with the SVHN trained RetinaNet model on our dataset, but the results were not satisfactory. As a result, we fine-tuned the model with our data.
Fig. 3.

Sample images from SVHN dataset (obtained from [12])
One characteristic of ruler digits is that the digits are not independent from each other. They are in an ordered sequence on a line and there should be at most one digit of a class on a ruler. However, like other state-of-the-art object detection networks, RetinaNet treats each object of interest independently and does not explicitly consider the spatial relation of objects, since it was designed to deal with general scenario in which there may be a varied number of objects of each category locating at various locations in the image and having various sizes. Therefore, considering the characteristics of our own application, we did the following post-processing to improve detection performance: among the detections of each image that had score higher than a specified threshold, 1) remove the detections that are outside of the ruler segmentation area; 2) select the one that has the highest score if more than one region returned for a digit class. The distance between digits were calculated from the center of the detection box of each digit.
C. Ruler Measuring Side Extraction
For the situation when a ruler is fully visible (which is a case for most images in both data batches), the ruler generally belongs to the shape category of quadrilateral, although it’s orientation, shape, and perspective can vary greatly across images. It should be noted that, although the manual markings of the rulers in the training/validation set are polygons, the boundaries of Mask R-CNN segmentation outputs are not polygons but contours. So, we proposed to find the minimum bounding quadrilateral (MBQ) from the segmented ruler region first. To obtain the MBQ of the ruler segmentation region, we applied the method implemented in [14] whose steps can be summarized as follows: 1) getting the convex hull of the segmented region (it is much more computation effective to work on the convex hull than on the segmented region directly); 2) sorting the edges based on their angles; 3) removing the redundant edges of the convex hull polygon that have the same angle; 4) sorting all edges in counter-clockwise order and obtaining all possible combinations of four edges out of all the edges; 5) removing those combinations in which the angle of the last edge minus that of the first edge is less than 180 degree; 6) getting one set from the remaining combinations in which none of the differences between consecutive angles is larger than 180 degree; and 7) finding the intersections of the edges in the set. Figure 4 (a) shows an example of a fully visible ruler in which the segmentation result is outlined in green color and the obtained MBQ is in red color.
Fig. 4.

Extraction of ruler measuring side
There are several reasons to extract the ruler side that has scale lines (called ruler measuring side): 1) It is generally closer to the lesion (compared to the opposite side), although this is not always true; 2) it can be used for the work of ruler scale lines identification; and, 3) its length can be used as a measurement when the physical length of a fully visible ruler is known. We proposed the following steps to extract the ruler measuring side after getting the ruler MBQ, as illustrated by Figure 4 (b)–(e) for the example ruler segmentation shown in Figure 4(a):
Generate line segments between the edges of MBQ by dividing each edge of the quadrilateral into 10 segments equally and connecting the corresponding points on the opposite edges (Figure 4(b) and the image was cropped using the minimum bounding quadrilateral for better illustration)
Obtain an intensity profile along each line segment in the grayscale image after applying the median filter to the grayscale image to remove noise (Figure 4(c))
Find the line segment that has the maximum number of sign changes (in magenta color in Figure 4(e)) after subtracting the median value from the profile values and only considering those profile values that are not too close to the median value (for example, using a threshold value of 10) (Figure 4(d)).
Extract the edge of the quadrilateral whose end points have the closest distance to the end points of the line segment obtained by step (3) among all edges of the quadrilateral (shown in cyan color in Figure 4(e))
The above approach can also be applied to rulers that are not fully visible, which are going to be discussed in Section III.
D. Ruler Scale Lines Locating
When the ruler is only partially captured in the image or the ruler is not fully segmented, the distances between ruler scale lines can be used for measurement given the physical distance between the adjacent two lines on the ruler is known. As shown by Figure 4 (c) and (e), the intensity profile of the line segment obtained by step 3 in Section 2C (i.e. the line of magenta color in Figure 4(e)) can be used to find the distances between adjacent ruler scale lines. We used the following simple steps to extract the intersection points between that line segment and the ruler scale lines: 1) extracting the peaks and valleys of the intensity profile of that extracted line segment; and 2) removing the valleys whose value is too close to its adjacent peaks. The remaining valley points are the extracted points whose locations indicating where the scale lines are. An example is shown in Figure 5. Figure 5(b) is the intensity profile of the line segment shown in magenta color in Figure 5(a), in which the extracted valleys are indicated with green triangle. In Figure 5(c), the points that correspond to the extracted valleys of intensity profile are denoted with green color.
Fig. 5.

Locations of ruler scale lines
III. Experimental Results and Discussions
A. Data
As stated previously, in the experiments, we used two batches of images we have received: one was from hospital A and the other was from hospital B. Table I lists the number of subjects and images in each batch, respectively. As shown in Table I, the 1st batch contains 250 subjects and the 2nd batch contains 168 subjects, respectively. In addition, there are 436 and 548 ruler images in the 1st batch and the 2nd batch, respectively. We manually marked the boundary of the ruler (with polygon) in each 1st batch ruler image. We also manually annotated the digits on the ruler (with rectangle). We used the imageLabeler tool in Matlab for the manual annotation. In our previous work on ruler image classification [5], we labeled the images with respect to containing a ruler or not. In that work, we divided the 1st batch of dataset into training, validation, and test set at patient level (with 180, 20, and 50 patients, respectively). We used the same split among the ruler images (after correcting few images mislabeled back then) for the current task. The number of images in each set among the 1st batch ruler images is given in Table II. Please note, for all the ruler images in the 1st batch, there is only one ruler in each image. Also, ruler digits are from 0 to 4 but some digits may not be visible on a ruler. We used the same split that corresponds to this split of training/validation/test sets of ruler images in the 1st batch for the experiments of all the components (ruler segmentation, ruler digit detection and ruler line extraction). In addition to the specified 1st batch ruler image test set listed in Table II, we also tested the models and evaluated each method using non-ruler images in the 1st batch and all the images in the 2nd batch. Because the total number of the digit “4” in the 1st batch is only 10, which is too small, we excluded it from the experiments of digit detection. Table III lists the corresponding number of each digit in each set, respectively.
Table I.
Number of Patients/Images in the two batches
| 1st Batch (Hospital A) | 2nd Batch(Hospital B) | |
|---|---|---|
| # of Patients | 250 | 168 |
| # of ruler images | 436 | 548 |
| # of non-ruler images | 2381 | 3783 |
Table II.
Data split in the ruler images of 1st batch
| 1st batch | Train | Val | Test |
|---|---|---|---|
| ruler images | 305 | 40 | 91 |
| Non-ruler images | 462 |
Table III.
Number of digits in training/validation/test set of the 1st batch ruler images
| Digit | Train | Val | Test |
|---|---|---|---|
| 0 | 241 | 32 | 73 |
| 1 | 288 | 39 | 85 |
| 2 | 299 | 40 | 88 |
| 3 | 294 | 38 | 89 |
B. Ruler Segmentation
For ruler segmentation, we used only ruler images to train and validate the model as there are significantly large background regions. However, we tested the model on both ruler images and non-ruler images. We fine-tuned the Mask R-CNN model pretrained with COCO dataset on our dataset. It used ResNet50-FPN (feature pyramid network) as the backbone network. The optimizer was SGD with learning rate set as 0.0025, momentum set as 0.9, and weight decay set as 0.0001. During training, the input images were resized, normalized, and applied random flip augmentation. The model was selected based on its performance on the validation set. In testing, based on the assumption there is at most one ruler in the image, the one with the maximum score among all the output segmentations (threshold was 0.5) for an input image would be selected as the final output. The Dice score and Jaccard score were calculated for all the segmentations in the test set. The mean and median values of Dice score are 0.960 and 0.974, respectively. The mean and median values of Jaccard score are 0.934 and 0.950, respectively. Figure 6 shows some segmentation results (green color is the segmentation result while red color is the manual marking).
Fig.6.

Ruler segmentation results (Green:predicted, Red:manual) in 1st batch
In addition to testing the model on the ruler images in the 1st batch, we also evaluated the fixed model on all the non-ruler images in the 1st batch and all the images (including both ruler images and non-ruler images) in the 2nd batch. For all the non-ruler images in the test set of the 1st batch, the model had no output segmentations. Hence, there were no false positives for the test set of the 1st batch. For all the images in the 2nd batch, we first checked the classification performance (if there is an output segmentation for an image, then that image is predicted as a ruler image) and compared to that of the two classification networks (ResNeSt and ViT) we used in [5]. As listed in Table V, it achieved comparably high sensitivity as the other two classification networks but with a much higher specificity (99.2%) and lower number of false positives. We visually and quantitatively examined the segmentation results of all the correctly classified ruler images. As demonstrated by the samples shown in Figure 7, the segmentation results for the 547 ruler images in the 2nd batch images are satisfactory, although the rulers in the 2nd batch have different styles and a larger variance than those in the 1st batch. The mean and median Dice (Jaccard) scores of all the ruler images are 0.958 (0.925) and 0.970 (0.941), respectively.
Table V.
Classification results on the 2nd batch
| ResNeSt | ViT | Mask R-CNN | ||||||
|---|---|---|---|---|---|---|---|---|
| GT→ | R | N | GT→ | R | N | GT→ | R | N |
| R | 548 | 69 | R | 548 | 142 | R | 547 | 29 |
| N | 0 | 3714 | N | 0 | 3641 | N | 1 | 3754 |
Fig.7.
Ruler segmentation example results in 2nd batch
C. Ruler Digits Detection
We trained two RetinaNet models to detect digits on the rulers. The models were initialized with the weights from the COCO dataset pretrained model and the SVHN dataset pretrained model, respectively. Both models used ResNet50 as the backbone network. The input images were resized to have the minimum side to be 900. Augmentation methods applied include random slight modification in rotation, flip, shift, shear, contrast, brightness, hue, and saturation. The Adam optimizer with learning rate of 10−5 and gradient norm scaling of 10−3 was used. The batch size was set to be 4. For inference, we kept the top five detections among those with confidence scores higher than 0.1. We aimed to reduce missing rates in this step given we will reduce false positives by the post processing. In the post-processing, any boxes outside the ruler segmentation region were removed. In addition, for each digit class, the one with the highest score was selected if there are more than one detection box for that class. Table VI lists the AP50 (average precision at IoU = 0.50) value in each digit class for the detection results on the test set in Table III. The performance of the model fine-tuned from the SVHN pretrained model is shown to be significantly better than that of the model fine-tuned from the COCO pretrained model (for both with and without augmentation). Figure 8 shows several images with predicted and manual digit boxes being marked in solid and dash lines, respectively (0: red, 1: green, 2: blue, 3: yellow).
Table VI.
Digit detection performance (AP50)
| Digit | 0 | 1 | 2 | 3 |
|---|---|---|---|---|
| Model (COCO pretrained) | 0.92 | 0.94 | 0.98 | 0.96 |
| Model (SVHN pretrained) | 0.96 | 0.97 | 0.98 | 0.98 |
| Model (COCO pretrained, no augmentation) | 0.84 | 0.84 | 0.93 | 0.83 |
| Model (SVHN pretrained, no augmentation) | 0.89 | 0.93 | 0.98 | 0.99 |
Fig.8.

Ruler digits extraction results in 1st batch images
D. Ruler Measuring Side Extraction
Some example results of ruler measuring side extraction are shown in Figure 9. In these images, like shown by Figure 4 (e), the ruler segmentation, the ruler MBQ, the line segment across the ruler scale lines, and the ruler measuring side, are displayed in green, red, magenta, and cyan color, respectively. As demonstrated by Figure 9, the proposed method can automatically identify the measuring side very well regardless of whether the ruler is fully visible or not, although for a partially visible ruler, the length difference between the extracted ruler measuring side and the true one may be larger, since the shape of the partial ruler may not be quadrilateral anymore. With visual inspection, the measuring side in all the test ruler images in 1st batch were correctly identified. We also applied the same method to the 2nd batch images and visually examined the results. Figure 10 shows several result examples from images in the 2nd batch. Given the effectiveness of the ruler measuring side extraction, in the future, we will consider using it to improve the digit detection results further, for example, based on the assumption that the ruler measuring side should approximately be parallel to the lines between the digits.
Fig.9.

Ruler measuring side extraction results in 1st batch images
Fig.10.

Ruler measuring side extraction results in 2nd batch images
E. Ruler Scale Lines Locating
The locations of ruler scale lines are identified based on the valleys of the intensity profile of the line segment that is crossing the scale lines and is extracted in a step of ruler measuring side extraction. The key parameter in this simple method is the threshold value that is used to filter out noisy valleys (i.e., removing those valleys that has small distance from neighboring peaks). Its value controls the tradeoff between missing detection of some blurry scale lines and including points that may be noise. In the experiment, we set it to be 30 empirically. Figure 11 shows several example results, in which (a) and (b) identify all the scale line locations correctly while (c) misses several blurry scale lines. In the literature, there are works on using deep learning networks for line segment detection or wireframe parsing [17–19]. We have tested several such available models on our dataset, but none produced satisfactory results (missing many scale lines). It may be due to the models were all trained by the datasets of general indoor or outdoor scenes. In the future, we can consider generating manual marking of those ruler scale lines (which requires a significant amount of labor) in order to train or fine-tune a line segment detection network and compare the results with current simple method.
Fig.11.

Ruler scale lines locating results.
IV. Conclusions and Future Work
In conclusion, we proposed a new approach for automatically extract the physical measurement information from a ruler in oral cavity images. Compared to other applications that images can be taken in a more controlled situation with higher consistency, there are additional challenges our application faces. We aimed to address those challenges by extracting several measurement clues and considering different scenarios. The proposed method consists of four main components: ruler segmentation, ruler digits detection, ruler measuring side extraction, and ruler scale line locations identification. Each component was examined and tested on two batches of images collected from different providers and promising performance has been demonstrated. Limitations of the method were also discussed. Future work includes considering the spatial relationship of digits for digit detection and deep learning approach for ruler scale lines extraction as well as automatic image quality analysis.
Table IV.
Ruler segmentation quantitative results for 1st batch
| Dice | Jaccard | ||
|---|---|---|---|
| Ruler images | mean | 0.960 | 0.934 |
| median | 0.974 | 0.950 | |
| Non-ruler images | No false positives | ||
Acknowledgment
This research was supported by the Intramural Research Program of the National Library of Medicine and the National Cancer Institute, both part of the National Institutes of Health (NIH).
Contributor Information
Zhiyun Xue, National Library of Medicine, National Institutes of Health, Bethesda, MD, USA.
Kelly Yu, National Cancer Institute, National Institutes of Health, Rockville, MD, USA.
Paul Pearlman, National Cancer Institute, National Institutes of Health, Rockville, MD, USA.
Tseng-Cheng Chen, National Taiwan University Hospital, Taipei, Taiwan.
Chun-Hung Hua, China Medical University Hospital, Taichung, Taiwan.
Chung Jan Kang, Chang Gung Memorial Hospital, Linkou, Taiwan.
Chih-Yen Chien, Chang Gung Memorial Hospital, Kaohsiung, Taiwan.
Ming-Hsui Tsai, China Medical University Hospital, Taichung, Taiwan.
Cheng-Ping Wang, National Taiwan University Hospital, Taipei, Taiwan.
Anil Chaturvedi, National Cancer Institute, National Institutes of Health, Rockville, MD, USA.
Sameer Antani, National Library of Medicine, National Institutes of Health, Bethesda, MD, USA.
References
- [1]. https://www.cancer.org/cancer/oral-cavity-and-oropharyngeal-cancer/about/key-statistics.html .
- [2]. https://www.who.int/news-room/fact-sheets/detail/oral-health .
- [3].Epstein JB, et al. “The limitations of the clinical oral examination in detecting dysplastic oral lesions and oral squamous cell carcinoma,” J Am Dent Assoc, 2012. 143(12): p. 1332–42. [DOI] [PubMed] [Google Scholar]
- [4].Xue Z, Pearlman P, Yu K, et al. “Oral cavity anatomical site image classification and analysis”, SPIE Medical Imaging conference 2022. [DOI] [PMC free article] [PubMed] [Google Scholar]
- [5].Xue Z, Yu K, Pearlman P, et al. “Automatic detection of oral lesion measurement ruler toward computer-aided image-based oral cancer screening”, accepted by IEEE EMBC conference 2022. [DOI] [PMC free article] [PubMed] [Google Scholar]
- [6].Dastjerdi HM, Töpfer D, Rupitsch SJ, and Maier A, “Measuring surface area of skin lesions with 2d and 3d algorithms,” International Journal of Biomedical Imaging, vol 2019, Article ID 4035148, 9 pages [DOI] [PMC free article] [PubMed] [Google Scholar]
- [7].Baghaie A and Yu Z, “Structure tensor based image interpolation method,” AEÜ - International Journal of Electronics and Communications, vol. 69, no. 2, pp. 515–522, 2015. [Google Scholar]
- [8].Konovalov D, Domingos J, Bajema C, White R, and Jerry D, “Ruler detection for automatic scaling of fish images,” in Proceedings of the International Conference on Advances in Image Processing. ACM, 2017, pp. 90–95. [Google Scholar]
- [9].Bhalerao A, Reynolds G, “Ruler detection for autoscaling forensic images,” International Journal of Digital Crime and Forensics, vol. 6, issue 1, January 2014 [Google Scholar]
- [10].He K, Gkioxari G, Dollár P and Girshick R, “Mask R-CNN,” 2017 IEEE International Conference on Computer Vision (ICCV), 2017, pp. 2980–2988, doi: 10.1109/ICCV.2017.322. [DOI] [Google Scholar]
- [11].Lin T-Y, Goyal P, Girshick R, He K and Dollár P, “Focal loss for dense object detection,” 2020. IEEE Transactions on Pattern Analysis and Machine Intelligence Volume: 42, Issue: 2, pp 318–327 DOI: 10.1109/TPAMI.2018.2858826 [DOI] [PubMed] [Google Scholar]
- [12]. https://cocodataset.org/#home .
- [13]. http://ufldl.stanford.edu/housenumbers/
- [14].D’Errico John. “A suite of minimum bounding objects” Matlab File Exchange. http://www.mathworks.com/matlabcentral/fileexchange/34767-a-suite-of-minimal-bounding-objects
- [15].Netzer Yuval, Wang Tao, Coates Adam, Bissacco Alessandro, Wu Bo, Andrew Y. Ng Reading Digits in Natural Images with Unsupervised Feature Learning NIPS Workshop on Deep Learning and Unsupervised Feature Learning 2011 [Google Scholar]
- [16]. http://ufldl.stanford.edu/housenumbers/
- [17].Gu G, Ko B, Go S, Lee S-H, Lee Ji. and Shin M, “Towards real-time and light-weight line segment detection,” Proceedings of the AAAI Conference on Artificial Intelligence, 2022 [Google Scholar]
- [18].Xue N, Wu T, Bai S, Wang FD, Xia G-S, Zhang L, Torr PHS, “Holistically-attracted wireframe parsing,” IEEE Conference on Computer Vision and Pattern Recognition (CVPR), 2020. [Google Scholar]
- [19].Huang K, Wang Y, Zhou Z, Ding T, Gao S, and Ma Y, “Learning to parse wireframes in images of man-made environments,” In Proceedings of the IEEE Conference on Computer Vision and Pattern Recognition, pages 626–635, 2018 [Google Scholar]