

Abstract
BACKGROUND:
The Ethiopian Government has identified efficiency of TB services as a key priority in planning and budgeting. Understanding the magnitude and sources of inefficiencies is key to ensuring value for money and improved service provision, and a requirement from donors to justify resource needs. This study identifies the cost of providing a wide range of TB services in public and private facilities in Ethiopia.
METHODS:
Financial and economic unit costs were estimated from a health provider’s perspective, and collected retrospectively in 26 health facilities using both top-down (TD) and bottom-up (BU) costing approaches for each TB service output. Capacity inefficiency was assessed by investigating the variation between TD and BU unit costs where the factor was 2.0 or more.
RESULTS:
Overall, TD unit costs were two times higher than BU unit costs. There was some variation across facility ownership and level of care. Unit costs in urban facilities were on average 3.8 times higher than in rural facilities.
CONCLUSION:
We identified some substantial inefficiencies in staff, consumable and capital inputs. Addressing these inefficiencies and rearranging the TB service delivery modality would be important in ensuring the achievement of the country’s End TB strategy.
Keywords: tuberculosis, unit costs, efficiency, Ethiopia
Abstract
CONTEXTE
Le gouvernement éthiopien estime que l’efficacité des services antituberculeux est une priorité essentielle en matière d’organisation et de prévisions budgétaires. Il est essentiel de comprendre l’étendue et l’origine de ce qui ne fonctionne pas afin de garantir un bon rapport coût-avantages, d’améliorer la fourniture des services et de répondre aux exigences des donneurs afin de justifier les besoins en ressources. Cette étude a identifié les coûts de la fourniture d’une vaste gamme de services antituberculeux dans les établissements privés et publiques d’Éthiopie.
MÉTHODES
Les coûts unitaires financiers et économiques ont été estimés du point de vue du prestataire de services, et recueillis de manière rétrospective dans 26 centres de soins en utilisant l’approche descendante (TD) et ascendante (BU) d’évaluation des coûts pour le rendement de chaque service antituberculeux fourni. L’inefficacité des capacités a été évaluée en analysant la variation entre les coûts unitaires TD et BU associée à un facteur de 2,0 ou plus.
RÉSULTATS
Dans l’ensemble, les coûts unitaires TD étaient deux fois plus élevés que les coûts unitaires BU. Une certaine variation a été observée en fonction des propriétaires des centres et du niveau de soins. Les coûts unitaires dans les centres de soins urbains étaient en moyenne 3,8 fois plus élevés que ceux dans les centres ruraux.
CONCLUSION
Nous avons identifié d’importants points d’inefficacité au niveau du personnel, des consommables et de l’apport en capital. Il serait important de remédier à ces points d’inefficacités et de redéfinir les modalités de fourniture des soins antituberculeux afin de pouvoir satisfaire les objectifs fixés pour le pays par la stratégie de l’OMS pour mettre fin à la TB.
Ethiopia is embarking upon a process of enhancing coverage and delivery of TB services in both the public and private sectors.1 As part of this process, the Ethiopia Tuberculosis and Leprosy Prevention and Control Programme (TBL) has identified efficiency improvement as a crucial component of their planning and budgeting exercises given scarce resources nationally, and a key priority for the Ethiopian Federal Ministry of Health (FMOH).2 This is also a requirement from donors to justify resource needs.1
There is a paucity of current data on the cost of TB services in Ethiopia. There are some recent estimates for unit costs of specific TB treatment regimens,3,4 and programme-level costing is done by the FMOH through each successive 5-year health sector transformation plan.5 However, cost data needed to inform national strategic planning around TB vaccination, case-finding, and prevention are largely unavailable, outdated or of insufficient quality, and often omit key cost components such as staff time, capital and recurrent overhead costs.6,7
There is also insufficient data to understand efficiency in Ethiopian TB services. There are several different potential sources for inefficiencies in health service delivery. Production process inefficiency results from differences in care practices between facilities or inclusion of extra services such as laboratory tests or visits per patient episode of care.8 Capacity inefficiency is a result of unused capacity within a facility (e.g., staff time, building space or equipment) and one approach for assessing this is by estimating the difference in top-down (TD) and bottom-up (BU) provider costs.9,10 There is currently very little evidence on either form of inefficiency in TB services, and none from Ethiopia.10,11
The objective of the present study is to determine unit costs of TB services using both TD and BU approaches, and to use these values to identify inefficiencies within the TB services provided in Ethiopia.
METHODS
The methods for the Value TB costing study are described in detail elsewhere.12 Briefly, Value TB estimated the costs of all TB services (service outputs and interventions) in a selection of Ethiopian health facilities. Methods for provider cost data collection were adapted from the Global Health Cost Consortium’s reference case,13 and followed the Costing Guidelines for Tuberculosis Interventions8 and the Value TB protocol template. Full financial and economic costs were collected retrospectively, and reflected ‘real-world’ implementation of interventions (Supplementary Data 1). The time-horizon was one patient episode of care (Supplementary Data 1). No start-up costs or costs of supporting change were included (e.g., for pilots or technical assistance). Estimation of future savings, above service-level, research and other unrelated costs were excluded. Interventions which were not fully implemented in health facilities at the time of data collection and incomplete treatment were removed from the analysis.
Sampling
The sampling unit was the health facility and the sampling frame was created from a national list of TB service providers (n = 4,016), with information on location (region/urban/rural), facility characteristics (level and ownership) and facility size, which was estimated using the number of bacteriologically-confirmed pulmonary TB (PTB) cases.
Three logistically feasible regions were purposively sampled: Addis Ababa; Afar; and Southern Nations, Nationalities and Peoples’ Region (SNNPR). The inclusion criterion was health facilities that were providing TB treatment during the Ethiopian fiscal year (EFY) 2007 (Gregorian fiscal year 2014/2015); prison health facilities were excluded. Thirty facilities were randomly selected within the strata of facility level, ownership, diagnostic intervention available (GeneXpert [Cepheid, Sunnyvale, CA, USA], acid-fast bacilli microscopy or none) and facility size. Due to budget and time constraints, data were collected from 26 of the sampled health facilities (Table 1).
Table 1.
Characteristics of facilities included in the Value TB costing study in Ethiopia
| Region | Sampled facilities | Facility type and ownership | ||||||||
|---|---|---|---|---|---|---|---|---|---|---|
|
| ||||||||||
| NGO health centre | Private-for-profit health centre | Private-for-profit secondary hospital | Public health centre | Public primary hospital | Public secondary hospital | Public tertiary hospital | Regional laboratory | |||
| Urban | Addis Ababa | 12 | 1 | 2 | 3 | 4 | — | — | 2 | — |
| Afar | 7 | — | — | — | 3 | — | 3 | — | 1 | |
| SNNP | 2 | — | — | — | 1 | 1 | — | — | — | |
| Total | 21 | 1 | 2 | 3 | 8 | 1 | 3 | 2 | 1 | |
| Rural | Addis Ababa | 0 | — | — | — | — | — | — | — | — |
| Afar | 4 | — | — | — | 4 | — | — | — | — | |
| SNNP | 1 | — | — | — | 1 | — | — | — | — | |
| Total | 5 | 0 | 0 | 0 | 5 | 0 | 0 | 0 | 0 | |
SNNPR = Southern Nations, Nationalities, and Peoples; NGO = non-governmental organisation.
Data collection
Service outputs and interventions available at Ethiopian health facilities were defined through consultation with TB experts from the TBL and other stakeholders, in addition to the national TB guidelines.1,2 Data for EFY 2010 (Gregorian calendar 2017–2018) were collected retrospectively from May 2018 to August 2019. The TB focal person at each of the 26 health facilities was interviewed about TB services available in that facility, with confirmation obtained during interviews with or observations of at least one staff member from each cadre of health professional providing each TB service output. The interviews and observations were conducted to obtain the resource list and quantities (for staff time, equipment time, consumables, drugs and building space), along with any associated training. The interview and observation tools are available in the Value TB data collection tool v2.2.14
For each sampled facility, the mean unit cost was estimated using both TD and BU costing approaches for each TB service output. These costs comprised of service-level direct costs, as well as overhead costs (see Supplementary Data 1 for list).
Medical and non-medical consumable prices were sourced from the FMOH’s Integrated Pharmaceutical Logistic System and the Ethiopian Pharmaceutical Supply Agency. Consumable quantities for the BU approach were obtained by observing or interviewing relevant staff (Supplementary Data 10). For the TD approach, annual facility order quantities were proportionally allocated to TB services by asking for proportion estimates during interviews. Drug utilisation was obtained from the TB patient registration book, incorporating wastage (Supplementary Data 1). The average number of inpatient bed-days was estimated by population and regimen through interviews with facility staff. For patient support during treatment, we estimated the value of a standard food package and transportation reimbursement. Estimates of BU staff time for TB services were obtained through observation of (gold standard) or interviews with (if observation was not possible, such as for inpatient stays, as we did not have ethical approval to observe patients in that setting, low volume tests that were not performed during the data collection period at the facility or test analysis that occurred over many days such as sputum culture) staff involved in the activities (Supplementary Data 10). For TD estimates, staff timesheets were used.14 Capital costs were obtained through document review and interviews with administrative staff, and annuitized at 3%. Annual service statistics for all services and TB services at the facilities were obtained from the Health Management Information System database at the facility.
The interventions for which unit costs were generated include active case-finding (ACF), passive case-finding (PCF) and intensified case-finding (ICF), treatment of drug-susceptible (DS) and multidrug-resistant (MDR) TB, TB disease prevention and bacilli Calmette–Guérin (BCG) vaccination, defined in Supplementary Data 2, along with the average quantities of service outputs included in each intervention type. To inform TBL decision-making, we include the cost of diagnostic tests and outpatient visits in unit cost estimates of prevention, case-finding and treatment interventions in the main text of this paper. These unit costs were generated using diagnostic algorithms as defined by TBL. Additional cost estimates are provided in Supplementary Data 4–9 to facilitate other potential uses of this data; the costs of diagnostic tests and outpatient visits are removed from case-finding unit cost estimates in those tables.
Data were collected and initially cleaned in Microsoft Excel (Microsoft, Redmond, WA, USA) using the publicly available Value TB suite of tools .14 The data were then imported into Stata v16.0 (Stata, College Station, TX, USA), where they were pooled, cleaned further and analysed.
Analysis
We estimated the mean service provider unit costs of TB services in Ethiopia by taking the unweighted average across all facilities and reporting in United States dollars (USD). Cost data obtained for EFY 2010 (Gregorian calendar 2017–2018) were collected in Ethiopian birr (ETB) and converted into USD using the mid-market exchange rate for the year of cost data collection (1 USD:27.34 ETB).15
Where TB services were provided in multifunctional departments or clinics (e.g., outpatient departments or Maternal and Child Health [MCH] clinics), the TD unit cost estimates for shared costs (including overhead costs, building, general equipment and furniture) were calculated by dividing the total costs by the utilisation for the entire department or clinic (for example, total outpatient visits).
Overhead costs were allocated proportionally to each output based on the TB vs. total facility outpatient visits. Other recurrent and capital costs, including shared and TB-specific inputs, were allocated to TB service outputs through estimates from staff timesheets, observations, interviews or service utilisation, again based on TB vs. total facility statistics. The disaggregated mean unit costs of the service outputs by input category were also presented to highlight the cost drivers for different service outputs. The TD and BU unit costs were compared for each output and intervention, and assessed by facility level and ownership, as well as geography (urban/rural) to identify inefficiencies in service delivery; defined as TD unit costs greater than BU by a factor of 2.0 or more.
Ethics and informed consent
Ethics approval was obtained from the Armauer Hansen Research Institute/ALERT Ethics Review Committee, Addis Ababa, Ethiopia (PO01/18), the WHO Regional Office for Africa Ethics Review Committee, Cairo, Egypt (AFR/ERC/2018/03/01), and the London School of Hygiene & Tropical Medicine Research Ethics Committee, London, UK (14605). Permission to conduct research in each sampled facility was obtained by official correspondence with the facilities from the FMOH and the respective Regional Health Bureaus. Written informed consent was sought from each study participant before conducting interviews, observations and distributing staff time sheets.
RESULTS
Overall, the costs estimated using the TD costing approach were an average of twice those estimated using the BU approach. This varied by output and intervention type. TD intervention costs ranged from 146% of BU costs for second-line (that is, drug-resistant TB) treatment-short regimen, to 246% of BU costs for BCG vaccination (Table 2). This variation was driven by substantial differences in the capacity inefficiency in some direct and ancillary services that constituted each intervention. For these service outputs (Figures 1 and 2), the TD unit costs were between 111% and 819% of the BU unit costs (outpatient monitoring visit and HIV confirmatory test, respectively).
Table 2.
Mean unit costs of TB interventions in Ethiopia, 2018 USD
| Intervention type | Facilities costed n | BU approach Mean ± SD | TD approach Mean ± SD | TD/BU proportion % |
|---|---|---|---|---|
| BCG vaccination: infant | 22 | 2.33 ± 1.66 | 5.72 ± 4.16 | 246 |
| TB case detection and diagnosis* | ||||
| Passive case-finding | 25 | 27.69 ± 21.38 | 60.55 ± 68.47 | 219 |
| Intensified case-finding: cough triage | 20 | 24.83 ±19.75 | 56.47 ± 69.83 | 227 |
| Intensified case-finding: screening | 20 | 23.16 ± 18.59 | 53.54 ± 68.51 | 231 |
| Active case-finding: household | 11 | 16.59 ± 10.50 | 28.16 ± 17.93 | 170 |
| TB treatment† | ||||
| First-line treatment: new and relapse | 20 | 279.22 ± 177.97 | 567.36 ± 436.76 | 203 |
| First-line treatment: previously treated | 18 | 300.13 ± 181.81 | 602.80 ± 457.12 | 201 |
| Second-line‡ treatment: long§ | 2 | 3,215.85 ± 291.57 | 4,871.89 ± 718.12 | 151 |
| Second-line‡ treatment: short¶ | 2 | 2,033.88 ± 117.70 | 2,979.30 ± 501.81 | 146 |
| TB prevention: 6H# | 21 | 42.67 ± 30.81 | 89.21 ± 89.21 | 209 |
* Unit costs for TB case detection and diagnosis include tests and outpatient diagnostic visits, along with any other outpatient visits or inpatient bed-days.
† Facilities where full treatment was provided (n = 21).
‡ Second-line treatment = treatment for drug-resistant TB.
§ Long regimen: intensive phase = 8 months; continuation phase = 12 months.
¶ Short regimen: intensive phase = 4–5 months; continuation phase = 6 months.
# HIV-positive adults, high-risk adults or children aged <5 years and household contacts of DS-TB persons.
USD = US dollar; BU = bottom-up; TD = top-down; SD = standard deviation; BCG = bacille Calmette-Guérin; 6H = 6-month isoniazid therapy.
Figure 1.
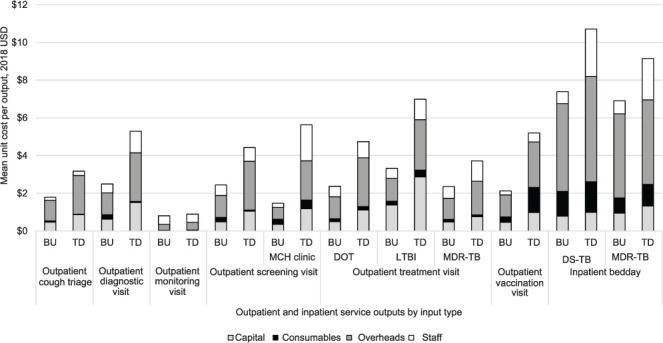
Graphs showing TD vs. BU unit costs for inpatient bed days and outpatient visits by input type. USD = US dollar; BU = bottom-up; TD = top-down; MCH = Maternal and Child Health; DOT = directly observed therapy; LTBI = latent TB infection; MDR-TB = multidrug-resistant TB; DS-TB = drug-susceptible TB.
Figure 2.
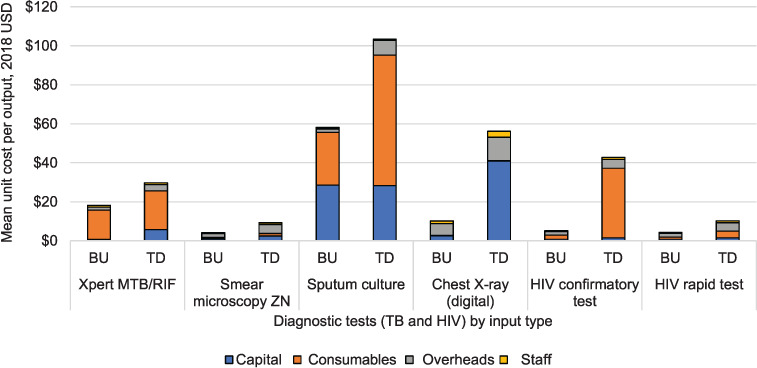
Graph showing TD vs. BU unit costs for TB and HIV diagnostic tests by input type. USD = US dollar; BU = bottom-up; TD = top-down; MTB = Mycobacterium tuberculosis; RIF = rifampicin; ZN = Ziehl-Neelsen; CXR = chest X-ray.
Composition of unit costs for service outputs
The disaggregated unit costs by input type are presented in Figures 1 and 2 for selected service outputs, and the complete list of disaggregated unit costs is in Supplementary Data 5. Overhead costs constituted the greatest proportion of unit costs for most outputs, but was particularly evident for outpatient and inpatient visits (43–65%). The only exception in those services was the outpatient monitoring visit where staff was the main cost driver (57% and 48% for BU and TD, respectively). Consumables were the main cost driver for laboratory tests such as HIV confirmatory (39% BU and 83% TD), sputum culture (74% BU and 48% TD) and Xpert (83% BU and 66% TD). Capital costs were the main cost driver for LPA (51% BU and 55% TD), patient support (60% BU and 55% TD) and TD digital chest X-ray (CXR) (73%).
Across all diagnostic tests, there is some variation between TD and BU unit costs, largely driven by inefficiencies in consumable and capital inputs (Figure 2). The difference was largest for the HIV confirmatory test, with mean TD costs ($42.74) at 819% of the mean BU costs ($5.22). This was largely driven by a large number of unused test cartridges. TD consumable cost for culture tests (liquid media) is more than 340% of the BU counterpart, at respectively $120 and $35. There is also considerable variation between the TD and BU capital unit costs for Xpert ($6.85 and $0.79), culture solid ($29.64 and $6.59) and digital CXR ($48.39 and $3.00) than for other diagnostic tests; a result of substantial downtime for some specialised equipment and building space.
The TD staff unit costs for inpatient bed-days (DSTB and MDR-TB) (Figure 1) and outpatient screening visits at MCH clinics (Figure 1) were considerably higher than BU staff unit costs (392%, 317% and 910%, respectively). This suggests substantial staff downtime in these departments. The difference in staff costs between TD and BU approaches was less for services in other outpatient departments. It was not possible to establish whether staff time for each service output was any different when assessed using interviews vs. observations as no individual service output was assessed using both methods across or within facilities.
Unit cost patterns by facility owner and level, and geography
The unit costs of TB interventions per patient also varied considerably when comparing costing approach by facility ownership, facility level (Figure 3) and urban vs. rural unit costs (Supplementary Data 3). The BU and TD unit costs for ICF-cough triage, ICF-screening and PCF was lowest in public health centres, with private-for profit health centres and non-governmental organisation (NGO) health centres costing 1.4 (NGO PCF) to 2.8 (private-for profit PCF) times greater than public health centres on average (Figure 3A).
Figure 3.
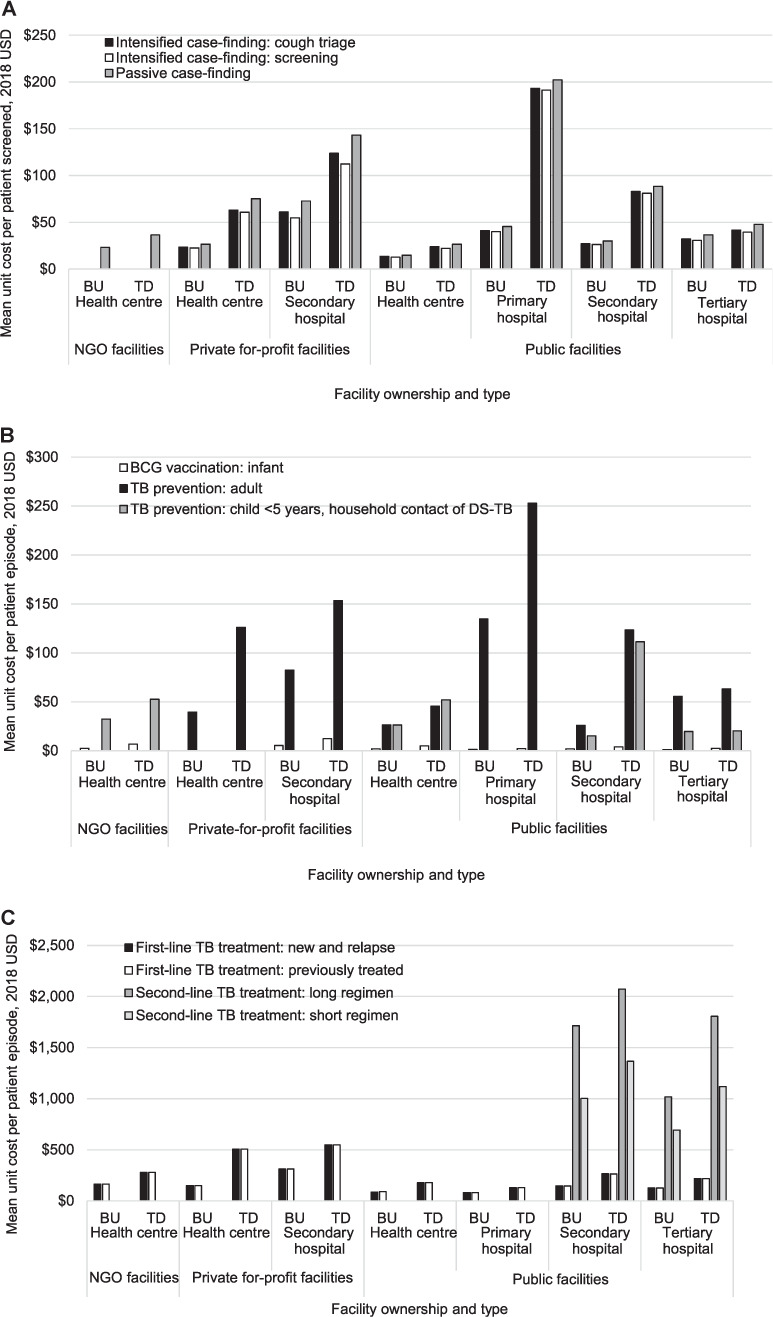
Top-down and bottom-up unit costs of vaccination, prevention, detection & diagnosis and treatment types, populations, and regimens by facility types and costing approach. 2nd Line TB treatment = treatment for drug-resistant tuberculosis. USD: United States dollars; BU: bottom-up; TD: top-down; NGO: non-governmental organisation.
The TD unit cost for both ICFs and PCF was approximately four times greater than the BU unit cost in public primary hospitals, and around three times greater in public secondary hospitals and private for-profit health centres (Figure 3A). In contrast, at public health centres, public tertiary hospitals and private for-profit secondary hospitals, there is no substantial variation (less than twice) between TD and BU unit cost values for any case detection or diagnosis. For TB prevention in child household contacts of people with DS-TB, the TD unit cost was more than five times higher in public secondary hospitals than other facilities, and more than seven times greater than the BU unit costs (Figure 3B). TB prevention for adults is most costly at public primary hospitals ($252.86), at around twice as much as at other facility types, except for public health centres ($45.54), where the public primary hospital unit cost was more than five times as expensive.
Full treatment for second-line TB is available at public secondary and tertiary hospitals only, with 15–68% higher unit costs at public secondary facilities for short and long regimens using TD and BU approaches, respectively (Figure 3C). On average, private for-profit health centres and private for-profit secondary hospitals have the highest TD unit costs for first-line treatment (Figure 3C), although BU costs at these health centres are similar to the unit costs at public facilities.
Overall, unit costs for TB interventions were most consistently least expensive at public health centres, with public tertiary hospitals also providing services at low costs. TB interventions were most expensive at private-for-profit secondary hospitals, with the exception of ICF-cough triage, ICF-screening, PCF and adult TB prevention being most costly at public primary hospitals.
The unit costs in urban facilities were consistently higher than in rural facilities by as little as 1.6 times (ACF-household) to as much as 3.9 times (TB prevention in HIV-positive or high-risk adults) (Supplementary Data 3).
DISCUSSION
We found substantial equipment, staff and consumable inefficiency within TB services provided in Ethiopia characterised by variation between TD and BU cost estimates, and between facility type and ownership. While our approach does not give a complete picture of why inefficiencies are occurring, our findings have several potential policy implications and could be used to improve efficiencies in the delivery of key TB interventions in this high TB burden country.
We observed substantial capacity inefficiency in capital costs for digital CXR and Xpert tests. The higher TD costs for these tests is suggestive of downtime of the costly equipment used to perform them, which could be scaled up if the facilities offering these tests were to expand their services to nearby facilities that are currently unable to provide them. Moreover, the Xpert test can also be shared for services within HIV but with the acknowledgement that different testing kits would be needed. The intervention with the most variation in unit costs between facilities was adult TB prevention. This occurred due to two key factors: first, there was capacity inefficiency in some facilities where staff assigned to MCH or HIV departments served very few patients per day. Second, in some facilities there was a large over-supply of HIV confirmatory tests. This can be traced to one-off events, such as donation of HIV testing kits directly to a facility, where a proportion of all tests were then allocated to TB services by the facility. Improved allocation of donated goods through the centralised distribution system can help to prevent future wastage of consumables by allocating based on patient volume at facilities.
Capacity inefficiency was also observed in staff costs for inpatient bed-days. This suggests that there may be substantial staff downtime at facilities offering inpatient services. However, as most other outpatient services had very little variation, it is possible that within some facilities there may be the capacity to reduce the burden of overstretched staff delivering outpatient care by task-sharing within outpatient services, or to inpatient services.
When assessing the variation in unit costs between facilities, NGOs and private facilities have consistently higher unit costs than public facilities for first-line TB treatment, which is not unexpected, and likely due to the absence of economies of scale. However, public primary and secondary hospitals and private-for-profit secondary hospitals have the highest values for TD case detection and diagnosis costs, suggesting some inefficiencies for diagnosis in larger facilities, particularly where the population served is smaller or spread over a larger geographic area.
This study has identified some key inefficiencies where adjustments in service provision should further be explored. A strength of this study is the large number of facilities included, enabling a more robust estimate of unit costs of a wide range of interventions. Another strength is the application of a rigorous data collection tool and analysis method.
Study limitations
As the sample was not fully representative of facility size, ownership and geography (urban and rural) of all facilities in Ethiopia, the generalisability of our unit costs beyond the three sampled regions is unknown. The data collection tool required extensive data for the calculations, thereby making the process long and prohibitive in circumstances where unit cost values are needed quickly. Further efforts to streamline the costing process for frequent repetition would be beneficial.
Four of the 30 health facilities sampled were ultimately not included in this costing. One of the omitted facilities was a national reference laboratory, two were general hospitals and one was a health centre. Overall, the mean unit costs across all facilities, if these followed the trend of the facilities included in the costing, would likely have been slightly higher for most service outputs, as three of the four facilities were higher-level facilities.
As the calculation of the mean unit costs was not weighted by patient volume across sites, any difference in unit cost due to patient volume was lost, and this variation could not be incorporated in the budgeting for facilities with different patient profiles. Above-service level costs, such as TB supervisory visits and strategic planning activities, were not included in the unit costs for these outputs and interventions, nor was any variation in unit costs due to service quality quantified in this analysis. Finally, non-traded goods, such as labour, were converted to USD from ETB using market exchange rates instead of purchasing power parity, and therefore salary comparisons for TB service provision with other countries need to take this into account.
The data generated for this study are important for realistic planning and budgeting. The TD and BU costing approaches have both strengths and weaknesses. While a comparison of the two can be useful when attempting to identify unused capacity, they may not always be a direct indicator of efficiency where estimates are based on assumptions. For example, our TD estimates were based on interviews with laboratory staff, as exact use of reagents throughout the year for each test was not recorded. It is possible that for some consumables which are common to many other tests (e.g., culture), annual expenditure for the TB test may have been overestimated. On the other hand, our BU costs reflect a detailed representation of the production process for the culture samples, which could likely not have been accurately measured using a TD approach. In our judgement, the use of TD costs is more appropriate for strategic planning to ensure sufficient funds for service provision; however, BU costs can help to minimise inefficiencies in the provision of TB services, with the potential for cost savings that can be redirected to other services or diseases within the health system.
CONCLUSION
In the sampled Ethiopian facilities, the degree of unit cost variation observed within (TD vs. BU) and between facilities for the full range of TB services available is dependent on several factors, including facility ownership, patient volume, service utilisation and inefficient allocation of inputs such as staff, equipment and consumables. This examination of variation between TD and BU unit costs is only one approach for exploring capacity inefficiency but highlights the need to appropriately align the costing approach to its intended use. TD unit costs are more suitable for budgeting and resource allocation purposes, whereas more precise BU costs are better suited to economic evaluations where service outputs and interventions are being compared and incorporating capacity inefficiencies can cloud the interpretation of their potential cost-effectiveness across various settings.
Supplementary Material
Acknowledgements
The authors would like to thank the Federal Ministry of Health of Ethiopia, the Ethiopia Tuberculosis and Leprosy Prevention and Control Programme (T Letta, E Negussie, B A Kebede, L F Assebe) and the Armauer Hansen Research Institute, Addis Ababa, Ethiopia (A Genetu, A Abdissa, K Bobosha, T T Balcha) for their oversight, coordination and facilitation of the data collection; the Regional Health Bureaus and health facility-level TB focal persons for providing access to health facilities and their staff; all staff interviewed for their time and willingness to participate in this study; Members of the National Technical Advisory Group who provided invaluable guidance, insight and support throughout the study; the additional research assistants involved in the data collection at the facilities for their diligence, including T Tumebo, B Tedla, A Dessalegn, G Tadese and D Tadesse; G B Gomez for technical support with the facility sampling; N Kitson, N Saadi and E Bergen for their meticulous efforts in preparing the cost datasets; and T P J Capeding and I Chikovani for their input on the initial draft manuscript.
Funding Statement
The Value TB Ethiopia study was funded by the Bill and Melinda Gates Foundation, Seattle, WA, USA, as part of the Value TB project (reference number: OPP1158747).
Footnotes
Conflicts of interest: none declared.
References
- 1.Federal Ministry of Health Addis Ababa, Ethiopia: Federal Democratic Republic of Ethiopia Ministry of Health; 2013. Guidelines for clinical and programmatic management of TB, TB/HIV and leprosy in Ethiopia. [Google Scholar]
- 2.Federal Ministry of Health Addis Ababa, Ethiopia: Federal Ministry of Health; 2013. Revised strategic plan: tuberculosis, TB/HIV, MDR-TB, and leprosy prevention and control 2006–2013 EC (2013/2014–2020) [Google Scholar]
- 3.Madan JJ, et al. Economic evaluation of short treatment for multidrug-resistant tuberculosis, Ethiopia and South Africa: the STREAM trial. Bull World Health Organ. 2020;98(5):306–314. doi: 10.2471/BLT.19.243584. [DOI] [PMC free article] [PubMed] [Google Scholar]
- 4.Adelman MW, et al. Cost-effectiveness of WHO-Recommended Algorithms for TB Case Finding at Ethiopian HIV Clinics. Open Forum Infect Dis. 2018;5(1):ofx269. doi: 10.1093/ofid/ofx269. [DOI] [PMC free article] [PubMed] [Google Scholar]
- 5.Federal Ministry of Health Addis Ababa, Ethiopia: Federal Democratic Republic of Ethiopia Ministry of Health; 2015. Health Sector Transformation Plan 2015/16–2019/20 (2008–2012 EFY) [Google Scholar]
- 6.Cunnama L, et al. A systematic review of methodological variation in healthcare provider perspective tuberculosis costing papers conducted in low- and middle-income settings, using an intervention-standardised unit cost typology. Pharmacoeconomics. 2020;38(8):819–837. doi: 10.1007/s40273-020-00910-w. [DOI] [PMC free article] [PubMed] [Google Scholar]
- 7.Laurence YV, Griffiths UK, Vassall A. Costs to health services and the patient of treating tuberculosis: a systematic literature review. Pharmacoeconomics. 2015;33(9):939–955. doi: 10.1007/s40273-015-0279-6. [DOI] [PMC free article] [PubMed] [Google Scholar]
- 8.World Health Organization Geneva, Switzerland: WHO; 2019. Costing guidelines for tuberculosis interventions. [Google Scholar]
- 9.Tucker A, et al. Redefining and revisiting cost estimates of routine ART care in Zambia: an analysis of ten clinics. J Int AIDS Soc. 2020;23(2):e25431. doi: 10.1002/jia2.25431. [DOI] [PMC free article] [PubMed] [Google Scholar]
- 10.Cunnama L, et al. Using top-down and bottom-up costing approaches in LMICs: the case for using both to assess the incremental costs of new technologies at scale. Health Econ. 2016;25 Suppl 1(Suppl Suppl 1):53–66. doi: 10.1002/hec.3295. [DOI] [PMC free article] [PubMed] [Google Scholar]
- 11.Datiko DG, Lindtjørn B. Cost and cost-effectiveness of smear-positive tuberculosis treatment by health extension workers in Southern Ethiopia: a community randomized trial. PLoS One. 2010;5(2):e9158. doi: 10.1371/journal.pone.0009158. [DOI] [PMC free article] [PubMed] [Google Scholar]
- 12.Sweeney S, et al. Int J Tuberc Lung Dis. 2022. Costs of TB services: approach and selected findings of a multicountry study (Value TB) [In press] [DOI] [PMC free article] [PubMed] [Google Scholar]
- 13.Vassall A, et al. Global Health Cost Consortium; 2017. Reference case for estimating the costs of global health services and interventions.https://ghcosting.org/pages/standards/reference_case [Google Scholar]
- 14.World Health Organization Geneva, Switzerland: WHO; 2019. Costing guidelines for tuberculosis interventions.https://www.who.int/publications/i/item/9789240000094 [Google Scholar]
- 15.XE Business London, UK: XE Business; 2021. Currency Tables.https://www.xe.com/currencytables/?from=ETB&date=2018-01-01 [Google Scholar]
Associated Data
This section collects any data citations, data availability statements, or supplementary materials included in this article.