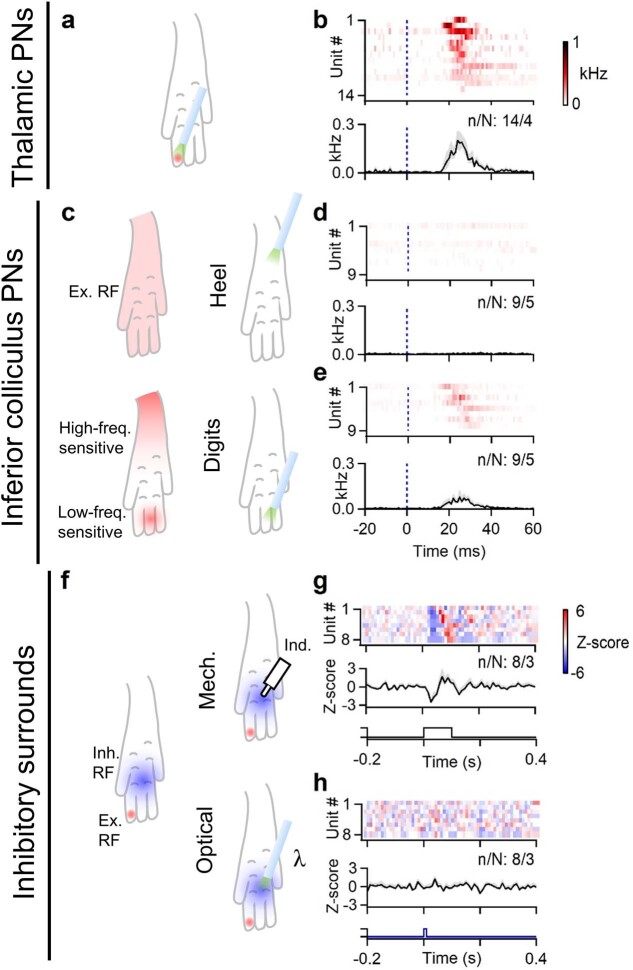
Extended Data Fig. 9. Calca+ HTMRs can drive IC-PNs, but not inhibitory surrounds.
All experiments were performed in Calca-FlpE; Rosa26FSF-ReaChR animals. a, Schematic representation of a typical VPL-PN excitatory receptive field and location of light stimulus delivered. b, Average firing rate of identified VPL-PNs in response to optical activation of Calca+ endings in the skin (top). Average evoked firing rate across all VPL neurons following optical stimulation of Calca+ cutaneous endings (bottom). Bins are 1 ms. Color scale for firing rate shown at right. Histogram shown as mean ± s.e.m. c, The receptive fields of vibration-tuned IC-PNs typically span the entire paw (top left). However, with very low stimulus intensities, it was revealed that the heel is more sensitive to high-frequency vibration, whereas the toes are more sensitive to low frequency vibration (bottom left; see Extended Data Fig. 2). Light was thus delivered to either the heel (top right), or the most sensitive area of the digits (bottom right). d, Response of individual vibration-tuned IC-PNs in response to optical stimulation of Calca+ afferents in the heel (top), and average response across units (bottom). Bins are 1 ms. Color scale for firing rate same as in b. Histogram shown as mean ± s.e.m. e, Response of individual vibration-tuned IC-PNs in response to optical stimulation of the digits (top), and average response across units (bottom). Units are the same as those shown in d. Histogram shown as mean ± s.e.m. f, The inhibitory surround of a DCN unit was stimulated mechanically using 10–20 mN indentation (top right). The same part of the inhibitory surround was then also stimulated optically (bottom right). g, Average responses of individual DCN units to 10–20 mN indentation delivered to their inhibitory surrounds (top), and average inhibitory response across all units (bottom). Bins are 10 ms. Color scale Z-score shown at right. Histogram shown as mean ± s.e.m. h, Average responses of individual DCN units to optical pulse delivered to their inhibitory surrounds (top), and average response across all units (bottom). Units are the same as those shown in g. Histogram shown as mean ± s.e.m. Data shown as n units in N animals (n/N).

