Abstract
Biomolecular condensates inside cells contain dozens to hundreds of macromolecular components and are surrounded by many others. Our computational studies predicted that macromolecular regulators have matching effects on the phase equilibrium and interfacial tension of condensates. Here we validate this prediction experimentally and characterize the effects of macromolecular regulators on other material properties, including viscoelasticity and fusion speed. Local melting due to the heating of a laser beam and turbidity assay both show that Ficoll70 raises the melting temperature of condensates formed by polylysine:heparin mixtures, whereas optical-tweezer measurements reveal parallel increases in interfacial tension. Additional optical-tweezer experiments report elevations in viscosity and shear relaxation time but also fusion speed by Ficoll70. The fusion speed is higher than predicted by modeling the condensates as purely viscous, demonstrating viscoelasticity and shear thinning. These results illustrate the ample opportunities for macromolecular regulators to tune material properties for proper functions of biomolecular condensates.
Keywords: phase separation, biomolecular condensates, melting temperature, interfacial tension, viscoelasticity, droplet fusion
Graphical Abstract
Biomolecular condensates such as nucleoli and stress granules contain dozens to hundreds of macromolecular components 1-2. Condensate formation is driven by a few key components, which are known as “scaffolds” and recruit other “client” components 3-5. There is much attention on how clients in turn regulate the phase equilibrium 6-7. Macromolecular regulators of phase equilibrium can be divided into three archetypes 8-9. The first represents the numerous surrounding macromolecular species excluded from condensates due to steric (and additional) repulsion, which nevertheless promote condensate formation by displacing scaffold molecules from the bulk phase to the condensed phase. The second and third archetypes are client molecules, which either promote or suppress condensate formation, depending on whether scaffold-client attraction is stronger or weaker than inter-scaffold attraction.
In addition to an appropriate phase equilibrium, condensates must also have appropriate material properties in order to function properly. In stress granules and many other cases, a dynamic, liquid state allows for rapid assembly and disassembly, localization, or clearance in response to biochemical or environmental cues and for easy exchange of macromolecular components with the bulk phase 7, 10-11. Condensate solidification leads to neurodegeneration and other pathologies 10-12. In the bacterium Caulobacter crescentus, an optimum in the fluidity of PopZ condensates was required for condensate localization and for cellular fitness 13. Differences in interfacial tension among separate subcompartments are crucial for the proper organization of the nucleolus 5.
Macromolecular regulators of phase equilibrium must also tune the material properties of condensates, but quantitative data on such effects, let alone mechanistic understanding, are still limited. When RNA was added to LAF-1 droplets, the condensate viscosity was reduced by 3-fold 14. The presence of 150 g/L PEG8000 decreased the molecular diffusivity in FUS droplets by 4-fold; this crowding agent had even greater effects on droplet fusion, with a 10-fold slowdown in fusion speed at 25 g/L and arrested fusion at 150 g/L 15. In a recent computational study, we predicted that macromolecular regulators have matching effects on the critical temperature (Tc) for condensate formation and on the interfacial tension (γ) 16. Here we test this prediction experimentally and characterize the effects of a macromolecular regulator on other material properties, including viscoelasticity and fusion speed.
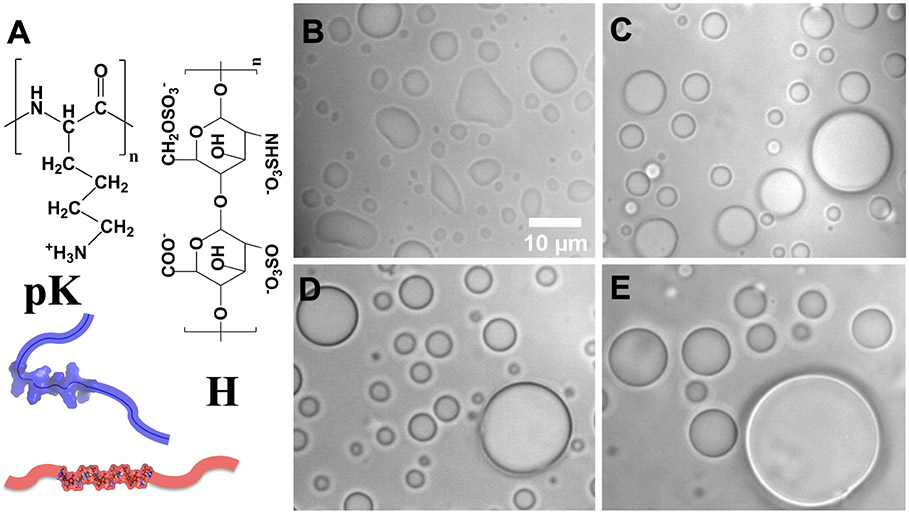
The condensates studied here are formed by an equimolar mixture (100 μM each) of polylysine (pK) and heparin (H), which are oppositely charged polymers (Figure 1A). The condensates fuse, fall under gravity, and appear collapsed upon settling on a coverslip (Figure 1B). However, when Ficoll70, an uncharged, highly branched polymer, is added to the mixture, settled condensates appear as standing spherical droplets (Figure 1C-E). The spherical shape indicates an elevation in interfacial tension. With increasing Ficoll70 concentrations, droplets grow in size, due to a higher tendency or speed for droplet fusion, which will be specifically examined below.
Figure 1.
The components and morphologies of pK:H condensates. (A) The molecular structures of polylysine (pK) and heparin (H). (B-E) Morphologies of settled pK:H condensates at 0, 50, 100, and 200 g/L Ficoll70. Condensates appear collapsed without but as standing spherical droplets with Ficoll70.
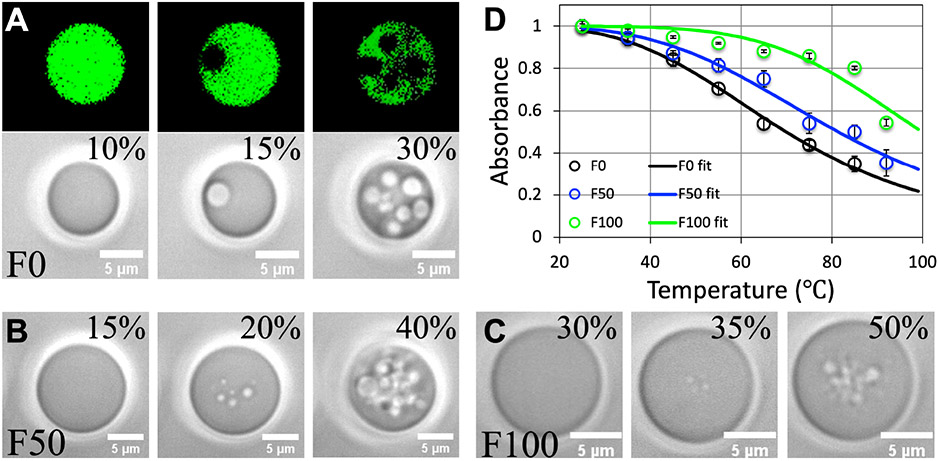
A focused laser beam (beam waist ~1 μm; wavelength 1064 nm) can trap and suspend a larger droplet above the coverslip. When the laser power is elevated above a threshold (Wth, measured as a percentage of the full laser power of ~1.7 W in each of the two beams in a LUMICKS C-Trap™ dual-trap optical tweezers instrument), bubbles emerged from within the laser beam (Supporting Information, Movies 1-3). We interpreted the bubbling as local condensate melting, due to the heating of the trapping laser. Fluorescence imaging confirmed that the bubbles are similar to the dilute phase outside the droplet (Figure 2A, top row). In the absence of Ficoll70, the threshold laser power is 15% (Figure 2A and Supporting Information, Movie 1). As the laser power is increased further, greater numbers of bubbles are produced. The bubbles rush into regions around the laser beam, where they fuse and pop upon hitting the rim of the droplet, reminiscent of air bubbles emerging from the bottom of a pot of boiling water. Also, the entire droplet undergoes vigorous shaking at the higher levels of laser power. At 50 g/L Ficoll70, the threshold laser power rises to 20% (Figure 2B and Supporting Information, Movie 2). Again greater numbers of bubbles are produced with further increase in laser power, but this time the bubbles pop in the surrounding regions instead of at the rim of a droplet. The same can be said about the case at 100 g/L Ficoll70, except that the threshold laser power rises to 35%, and the bubbles pop even more quickly (Figure 2C and Supporting Information, Movie 3). The threshold laser power further rises at 200 g/L Ficoll70, but the vigorous shaking of droplets precluded a precise determination of Wth.
Figure 2.
Increase in pK:H condensate melting temperature by Ficoll70. (A) Fluorescence and brightfield images showing condensate local melting above a 15% threshold of laser power at 0 Ficoll70. (B) Melting starts at 20% laser power in the presence of 50 g/L Ficoll70. (C) The threshold laser power increases to 35% at 100 g/L Ficoll70. For (A-C), the laser power was evenly split between two beams and each was used to trap a droplet (see Supporting Information, Movies 1-3); images of only one droplet are shown. (D) Melting curves from turbidity assay. Data are presented as mean ± standard error of the mean (N = 3-6 replicate measurements); curves show fits.
Increasingly elevated laser power results in greater local heating and temperature jump (Supporting Information, Figure S1). Therefore the rise in threshold laser power at higher Ficoll70 concentrations reflects a rise in condensate melting temperature. Based on turbidity assay, we obtained the melting curves of pK:H condensates at increasing Ficoll70 concentrations (Figure 2D). The resulting melting temperatures (Tm) are 69.9 ± 0.8 °C, 81.4 ± 1.7 °C, and 99.9 ± 5.3 °C at 0, 50, and 100 g/L Ficoll70 (Supporting Information, Figure S2A). Condensate melting in bulk, leading to the disappearance of entire droplets, evidently occurs at temperatures much higher than local melting inside condensates as triggered by the trapping laser. The Tm value at 200 g/L Ficoll70 is even higher but could not be precisely determined because melting was still incomplete at the highest temperature of 92 °C. For pK:H condensates prepared at fixed component concentrations (100 μM each), the steady rise in Tm with increasing Ficol70 concentration corresponds to an upshift of the binodal and hence increase of the critical temperature. Ficol70 is mostly excluded from pK:H condensates, with a partition coefficient of 0.15 ± 0.01 (N = 6) at 100 g/L (Supporting Information, Figure S3). These observations confirm that Ficoll70 acts as a volume-exclusion promotor 8 of pK:H condensate formation.
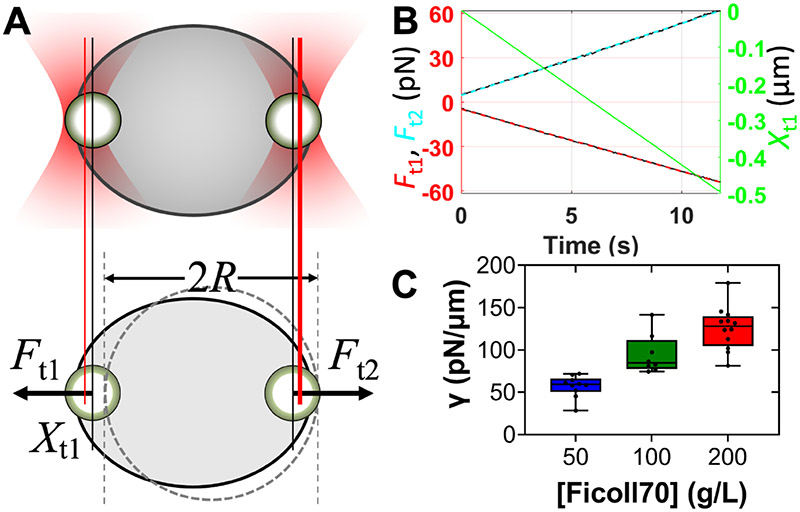
Previously we determined the interfacial tension of pK:H condensates at 50 g/L Ficoll70 to be 57.1 ± 3.8 pN/μm, by using two optically trapped polystyrene beads to suspend and slowly stretch droplets (Figure 3A) 17. To fully characterize the effects of Ficoll70, here we measured the interfacial tensions of pK:H condensates at higher concentrations of this macromolecular regulator. The measurement involved monitoring the displacement between the two traps and the trapping forces on the two beads (Figure 3B) 17-18. As Figure 3C shows, the interfacial tensions rise steadily, to 94.5 ± 7.7 pN/μm at 100 g/L Ficoll70 and 125.6 ± 7.0 pN/μm at 200 g/L Ficoll70. The beads used were 2 μm in diameter and coated with carboxylates. To verify that bead surface chemistry did not affect measured material properties, we repeated the interfacial tension measurement of pK:H condensates at 100 g/L Ficoll70 using 2.26-μm uncoated beads. The result is 95.2 ± 8.0 pN/μm (N = 5), essentially the same as that measured using carboxylate-coated beads. The parallel increases in melting temperature and in interfacial tension at increasing Ficoll70 concentrations (Supporting Information, Figure S2A) validate our computational prediction for the matching effects of macromolecular regulators on Tc and γ 16.
Figure 3.
Increase in pK:H condensate interfacial tension by Ficoll70. (A) Measurement of interfacial tension by using two optically trapped beads to suspend and stretch a droplet. Trap 2 was fixed in place while trap 1 was pulled to the left at a speed of ~0.05 μm/s. (B) Sample traces of the trap 1 displacement (Xt1; green) and traps 1 and 2 forces (Ft1 and Ft2; raw data, black; linear fits, red and cyan), from a droplet at 200 g/L Ficoll70. The laser power was evenly split between two beams and set at 20%. (C) Interfacial tensions at 50, 100, and 200 g/L Ficoll70, presented as box plots. The raw data are also displayed as filled circles (N = 10, 8, and 12, respectively). Data at 50 g/L Ficoll70 were published previously 17.
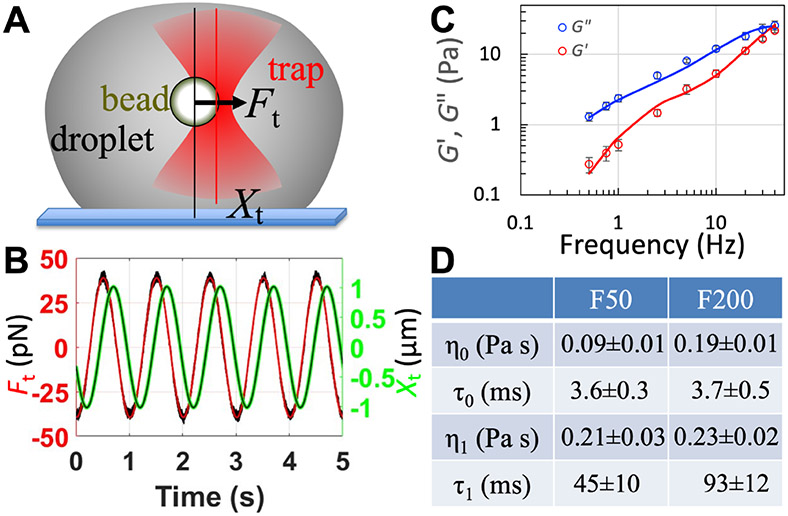
pK:H condensates at 50 g/L Ficoll70 are viscoelastic, with a zero-shear viscosity (η) of 0.30 ± 0.03 Pa s and two relaxation times at 3.6 ± 0.3 ms and 45 ± 11 ms, for macromolecular conformational dynamics and network reconfiguration, respectively 17. The determination of viscoelasticity entailed oscillating a trapped bead inside a settled droplet over a range of frequencies (Figure 4A). The regulatory effect of Ficoll70 can be uncovered by comparing the viscoelastic properties of pK:H condensates at two Ficoll70 concentrations. To that end we measured the viscoelasticity at 200 g/L Ficoll70. From the traces of the trap position and trapping force (Figure 4B), we obtained the viscous (G") and elastic (G′) moduli (Figure 4C). Fitting the dependences of G′ and G" on oscillation frequency (ω/2π) to the Burgers model
| [1a] |
| [1b] |
yields the zero-shear viscosity (η0 + η1) and the two relaxation times (τ0 and τ1). As listed in Figure 4D, the increase in Ficoll70 concentration from 50 to 200 g/L results in both a moderate elevation of the zero-shear viscosity to 0.42 ± 0.02 Pa s and doubling of the network reconfiguration time to 93 ± 12 ms. We cross-validated the zero-shear viscosity by single particle tracking, which yielded a viscosity of 0.426 Pa s (Supporting Information, Figure S4).
Figure 4.
Increase in pK:H droplet zero-shear viscosity and shear relaxation time by Ficoll70. (A) Measurement of viscoelasticity by oscillating an optically trapped bead inside a settled droplet. (B) Sample traces of the trap position (Xt; green) and trapping force (Ft; raw data, black; fit to a sinusoidal function, red), at 200 g/L Ficoll70. The laser power was given to a single beam and set at 10%. (C) Viscous (G") and elastic (G′) moduli over the frequency range of 0.5 to 40 Hz. Data are for 200 g/L Ficoll70 and presented as mean ± standard error of the mean (N = 6 replicate measurements); curves show fits to the Burgers model. (D) Amplitudes and relaxation times of the shear relaxation moduli at 50 and 200 g/L Ficoll70. Results are presented as fitted value ± standard error of the fit; those at 50 g/L Ficoll70 were published previously 17.
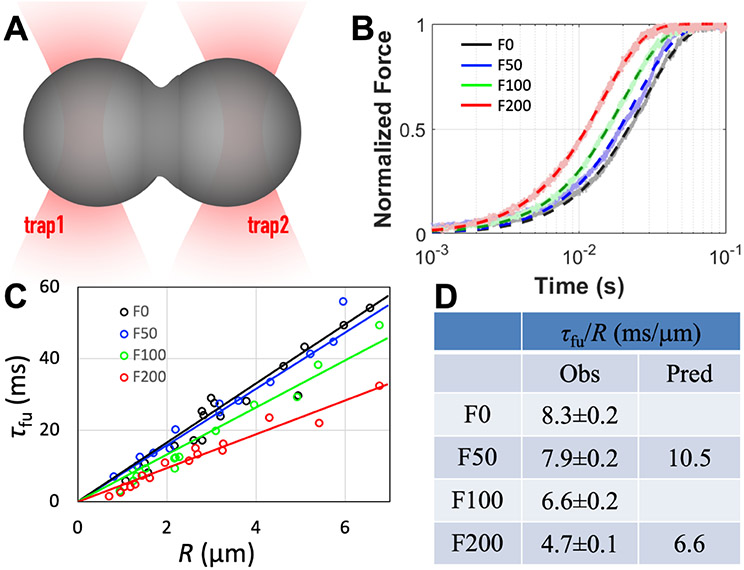
The speed of droplet fusion is a direct indicator of condensate liquidity and dictated by interfacial tension and viscoelasticity 17, 19. We trapped two equal-sized pK:H droplets using minimal laser power (3%) and brought them into contact to start the fusion process (Figure 5A) 19. The fusion process was monitored by the trapping force (Figure 5B). The time (t) dependence of the normalized trapping force was fit to a stretched exponential,
| [2] |
with β fixed at 1.5, to yield the fusion time τfu. For droplets of approximately the same initial radius (R), the progress curves show faster fusion at increasing Ficoll70 concentrations. The speedup in fusion is more robustly seen when fusion times at each Ficoll70 concentration are obtained as a function of the initial droplet radius (Figure 5B). There is a clear proportional relation between τfu and R. The slope τfu/R, representing the inverse fusion speed, decreases nearly linearly with Ficol70 concentration (Figure 5D and Supporting Information, Figure S2B).
Figure 5.
Increase in pK:H droplet fusion speed over the Ficoll70 concentration range of 0 to 200 g/L. (A) Fusion dynamics monitored by dual optical traps. The laser power was evenly split between two beams and set at 3%. (B) Traces of normalized trap 2 forces from pairs of fusing droplets with a ~3 mm initial radius. Raw data are shown as dots while fits are shown as dashed curves. (C) Dependences of fusion time (τfu) on droplet radius (R). Circles show data from individual pairs of fusing droplets while lines show fits. The slope, τfu/R, of each line is the inverse fusion speed. (D) Inverse fusion speed. Observed results are presented as fitted value ± standard error of the fit; predicted values are according to eq [3]. The result at 50 g/L Ficoll70 was reported previously 17 but was redetermined here.
For purely viscous droplets, the inverse fusion speed is given by 19
| [3] |
The speedup in droplet fusion at increasing Ficoll70 concentrations can be qualitatively understood by a greater elevation in γ than in η. Indeed, when the Ficoll70 concentration is increased from 50 g/L to 200 g/L, the interfacial tension rises by 120% but the zero-shear viscosity rises only 38%.
However, the predicted fusion speed by modeling pK:H condensates as purely viscous does not agree quantitatively with the measured result (Figure 5D). The predicted fusion times are longer than the observed results by 32% at 50 g/L Ficoll70 and by 39% at 200 g/L Ficoll70. The over-prediction demonstrates that pK:H condensates are viscoelastic rather than purely viscous, and indicates shear thinning, i.e., the effective viscosity during the fusion process is lower than the zero-shear viscosity 17. Previously we have shown that shear thinning can occur when droplet shape dynamics occurs on a timescale shorter than the shear relaxation time 17, 20. The data at 200 g/L Ficoll70 further support this conclusion.
The fact that the trapping laser results in local heating and temperature jump (Supporting Information, Figure S1) raises potential concern that the material properties determined are not those at room temperature but at an elevated temperature. However, we have kept the laser power in each experiment to the minimum required to make the measurement possible. With this protocol, the effects of any temperature jump on the measured properties are negligible. For measuring droplet fusion speed, we used only 3% of laser power, which our calibration of laser heating (Supporting Information, Figure S1F) indicates a maximum temperature jump of only 0.3 °C, at the center of a laser beam. When beads are trapped in the laser beams, as in our experiments for measuring interfacial tension and viscoelasticity, the temperature jump is reduced (Supporting Information, Figure S1F), because the regions where the laser beams are most intense is occupied by polystyrene beads, which unlike water do not absorb energy from the infrared laser beams. With beads trapped, the dual laser beams at 20% power produce a maximum temperature jump of 2.0 °C, at the surface of a trapped bead. We verified that bead trapping reduces laser heating by conducting local condensate melting, but this time with beads trapped. Compared to the 20% threshold laser power at 50 g/L Ficoll70 reported above, local melting starts at 30% laser power when beads are trapped (Supporting Information, Figure S5). In interfacial tension measurements, the tension force is generated in the droplet interface, which for the most part is away from the laser beams at the poles of the droplet and thus unaffected by the local heating. While we made most of the interfacial tension measurements at 20% laser power, we also took some measurements at 10% laser power and the results did not show significant difference. For viscoelasticity measurements, the laser was given to a single beam, but the power was reduced to 10%, making it equivalent to the 20% laser power when split between two beams. The zero-shear viscosity measured using trapped beads is validated by single particle tracking, which is not affected by a trapping laser.
The present study thus reveals that, in addition to the melting temperature, Ficoll70 as a macromolecular regulator also affects a host of material properties: interfacial tension, zero-shear viscosity, shear relaxation time, and fusion speed. Among these, the greatest effect is on interfacial tension, with a 120% rise upon a Ficoll70 concentration increase from 50 g/L to 200 g/L. The rise in γ is matched by an equally substantial elevation in Tm (Supporting Information, Figure S2A), precisely as we predicted 16. Ficoll70 as a volume-exclusion regulator (Supporting Information, Figure S3) promotes condensate formation (manifested by the rise in Tm) by displacing the scaffold molecules (pK and H) into the condensed phase, thereby raising the macromolecular packing density and correspondingly making macromolecular interactions more extensive inside condensates 8-9. The same factor also leads to higher interfacial tension, hence the matching effects on Tm and γ 16. The dependence of interfacial tension on the extensiveness or strength of macromolecular interactions has been demonstrated by comparing condensates formed by different macromolecular species 17. In addition, decreases in interfacial tension have been observed at a higher salt concentration or pH 21-22, presumably by weakening electrostatic attraction or increasing electrostatic repulsion 23.
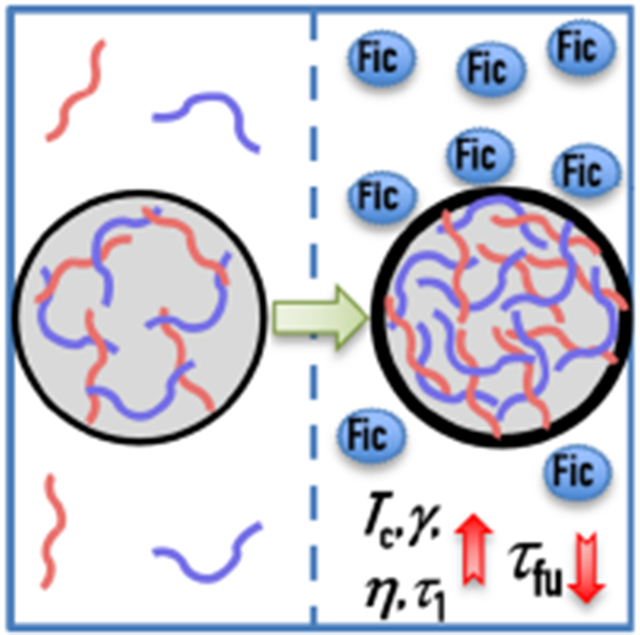
The increase in the pK:H zero-shear viscosity by Ficoll70 can also be explained by the more extensive macromolecular interactions. Comparisons among condensates of different macromolecular species have also demonstrated the extensiveness and strength of macromolecular interactions as key determinants of zero-shear viscosity 17, 24. This explanation is further supported by decreases in zero-shear viscosity at increasing salt concentrations 17, 21. An increase in Ficoll70 concentration from 50 to 200 g/L also doubles the shear relaxation time (τ1). We have suggested τ1 as the time constant for macromolecular network reconfiguration 17, which naturally is dictated by extensiveness and strength of macromolecular interactions. The increase in τ1 thus reflects the more extensive macromolecular interactions at a higher Ficoll70 concentration. This interpretation is consistent with effects of salt concentration and point mutations on shear relaxation time 24-25. Note that we should expect Tc (or Tm), γ, η and τ1 to all change in the same direction, because the extensiveness and strength of macromolecular interactions are the common determinants for all these properties.
The speedup of pK:H fusion by Ficoll70 reported here stands in contrast to a significant slowdown of FUS fusion by PEG8000 15. By also measuring the effects of Ficoll70 on pK:H interfacial tension and zero-shear viscosity, we are able to qualitatively rationalize the speedup of pK:H fusion as due to a greater elevation in γ than in η by Ficoll70. A proportional relation between fusion speed and γ/η (eq [3]) is often used to deduce interfacial tension from fusion speed and zero-shear viscosity 26. We emphasize, however, that eq [3] is unreliable, as biomolecular condensates are viscoelastic rather than purely viscous. As shown previously 17 and now here, biomolecular condensates exhibit shear thinning and thickening, such that the effective viscosity can differ significantly from the zero-shear viscosity. Therefore the interfacial tension deduced from eq [3] can be in serious error.
In conclusion, we have demonstrated that a macromolecular regulator exerts significant effects on a host of material properties, in addition to the phase equilibrium of biomolecular condensates. Different macromolecular regulators have been seen to influence phase equilibrium in diverse ways. We can now anticipate that they have ample opportunities to tune the material properties of condensates for proper functions.
Supplementary Material
ACKNOWLEDGMENT
This work was supported by National Institutes of Health Grant GM118091. We thank Dr. Anjum Ansari for the use of a spectrofluorometer and Viktoriya Zvoda and Ramesh Prasad for technical assistance.
Footnotes
The authors declare no competing financial interests.
Supporting Information. The following file is available free of charge.
Experimental section; five supporting figures; and captions of three supporting movies (PDF)
REFERENCES
- 1.Boisvert FM; van Koningsbruggen S; Navascues J; Lamond AI The Multifunctional Nucleolus. Nat Rev Mol Cell Biol 2007, 8, 574–85. [DOI] [PubMed] [Google Scholar]
- 2.Jain S; Wheeler JR; Walters RW; Agrawal A; Barsic A; Parker R ATPase-Modulated Stress Granules Contain a Diverse Proteome and Substructure. Cell 2016, 164, 487–98. [DOI] [PMC free article] [PubMed] [Google Scholar]
- 3.Li P; Banjade S; Cheng HC; Kim S; Chen B; Guo L; Llaguno M; Hollingsworth JV; King DS; Banani SF, et al. Phase Transitions in the Assembly of Multivalent Signalling Proteins. Nature 2012, 483, 336–40. [DOI] [PMC free article] [PubMed] [Google Scholar]
- 4.Banani SF; Rice AM; Peeples WB; Lin Y; Jain S; Parker R; Rosen MK Compositional Control of Phase-Separated Cellular Bodies. Cell 2016, 166, 651–663. [DOI] [PMC free article] [PubMed] [Google Scholar]
- 5.Feric M; Vaidya N; Harmon TS; Mitrea DM; Zhu L; Richardson TM; Kriwacki RW; Pappu RV; Brangwynne CP Coexisting Liquid Phases Underlie Nucleolar Subcompartments. Cell 2016, 165, 1686–1697. [DOI] [PMC free article] [PubMed] [Google Scholar]
- 6.Maharana S; Wang J; Papadopoulos DK; Richter D; Pozniakovsky A; Poser I; Bickle M; Rizk S; Guillen-Boixet J; Franzmann TM, et al. RNA Buffers the Phase Separation Behavior of Prion-Like RNA Binding Proteins. Science 2018, 360, 918–921. [DOI] [PMC free article] [PubMed] [Google Scholar]
- 7.Brangwynne CP; Eckmann CR; Courson DS; Rybarska A; Hoege C; Gharakhani J; Julicher F; Hyman AA Germline P Pranules Are Liquid Droplets That Localize by Controlled Dissolution/Condensation. Science 2009, 324, 1729–32. [DOI] [PubMed] [Google Scholar]
- 8.Ghosh A; Mazarakos K; Zhou HX Three Archetypical Classes of Macromolecular Regulators of Protein Liquid-Liquid Phase Separation. Proc Natl Acad Sci U S A 2019, 116, 19474–19483. [DOI] [PMC free article] [PubMed] [Google Scholar]
- 9.Nguemaha V; Zhou HX Liquid-Liquid Phase Separation of Patchy Particles Illuminates Diverse Effects of Regulatory Components on Protein Droplet Formation. Sci Rep 2018, 8, 6728. [DOI] [PMC free article] [PubMed] [Google Scholar]
- 10.Mateju D; Franzmann TM; Patel A; Kopach A; Boczek EE; Maharana S; Lee HO; Carra S; Hyman AA; Alberti S An Aberrant Phase Transition of Stress Granules Triggered by Misfolded Protein and Prevented by Chaperone Function. EMBO J 2017, 36, 1669–1687. [DOI] [PMC free article] [PubMed] [Google Scholar]
- 11.Yamasaki A; Alam JM; Noshiro D; Hirata E; Fujioka Y; Suzuki K; Ohsumi Y; Noda NN Liquidity Is a Critical Determinant for Selective Autophagy of Protein Condensates. Mol Cell 2020, 77, 1163–1175. [DOI] [PubMed] [Google Scholar]
- 12.Alberti S; Dormann D Liquid-Liquid Phase Separation in Disease. Annu Rev Genet 2019, 53, 171–194. [DOI] [PubMed] [Google Scholar]
- 13.Lasker K; Boeynaems S; Lam V; Stainton E; Jacquemyn M; Daelemans D; Villa E; Holehouse AS; Gitler AD; Shapiro L A Modular Platform for Engineering Function of Natural and Synthetic Biomolecular Condensates. bioRxiv 2021, 2021.02.03.429226. [Google Scholar]
- 14.Elbaum-Garfinkle S; Kim Y; Szczepaniak K; Chen CC; Eckmann CR; Myong S; Brangwynne CP The Disordered P Granule Protein LAF-1 Drives Phase Separation Into Droplets with Tunable Ciscosity and Dynamics. Proc Natl Acad Sci U S A 2015, 112, 7189–94. [DOI] [PMC free article] [PubMed] [Google Scholar]
- 15.Kaur T; Alshareedah I; Wang W; Ngo J; Moosa MM; Banerjee PR Molecular Crowding Tunes Material States of Ribonucleoprotein Condensates. Biomolecules 2019, 9. [DOI] [PMC free article] [PubMed] [Google Scholar]
- 16.Mazarakos K; Zhou HX Macromolecular Regulators Have Matching Effects on the Phase Equilibrium and Interfacial Tension of Biomolecular Condensates. Protein Sci 2021, 30, 1360–1370. [DOI] [PMC free article] [PubMed] [Google Scholar]
- 17.Ghosh A; Kota D; Zhou HX Shear Relaxation Governs Fusion Dynamics of Biomolecular Condensates. Nat Commun 2021, 12, 5995. [DOI] [PMC free article] [PubMed] [Google Scholar]
- 18.Zhou HX Determination of Condensate Material Properties from Droplet Deformation. J Phys Chem B 2020, 124, 8372–8379. [DOI] [PMC free article] [PubMed] [Google Scholar]
- 19.Ghosh A; Zhou HX Determinants for Fusion Speed of Biomolecular Droplets. Angew Chem Int Ed 2020, 59, 20837–20840. [DOI] [PMC free article] [PubMed] [Google Scholar]
- 20.Zhou HX Shape Recovery of Deformed Biomolecular Droplets: Dependence on Condensate Viscoelasticity. J Chem Phys 2021, 155, 145102. [DOI] [PMC free article] [PubMed] [Google Scholar]
- 21.Jawerth LM; Ijavi M; Ruer M; Saha S; Jahnel M; Hyman AA; Julicher F; Fischer-Friedrich E Salt-Dependent Rheology and Surface Tension of Protein Condensates Using Optical Traps. Phys Rev Lett 2018, 121, 258101. See also Erratum 125, 229901 (2020). [DOI] [PubMed] [Google Scholar]
- 22.Testa A; Dindo M; Rebane AA; Nasouri B; Style RW; Golestanian R; Dufresne ER; Laurino P Sustained Enzymatic Activity and Flow in Crowded Protein Droplets. Nat Commun 2021, 12, 6293. [DOI] [PMC free article] [PubMed] [Google Scholar]
- 23.Qin S; Zhou HX Calculation of Second Virial Coefficients of Atomistic Proteins Using Fast Fourier Transform. J Phys Chem B 2019, 123, 8203–8215. [DOI] [PMC free article] [PubMed] [Google Scholar]
- 24.Alshareedah I; Moosa MM; Pham M; Potoyan DA; Banerjee PR Programmable Viscoelasticity in Protein-RNA Condensates with Disordered Sticker-Spacer Polypeptides. Nat Commun 2021, 12, 6620. [DOI] [PMC free article] [PubMed] [Google Scholar]
- 25.Zhou HX Viscoelasticity of Biomolecular Condensates Conforms to the Jeffreys Model. J Chem Phys 2021, 154, 041103. [DOI] [PMC free article] [PubMed] [Google Scholar]
- 26.Wang H; Kelley FM; Milovanovic D; Schuster BS; Shi Z Surface Tension and Viscosity of Protein Condensates Quantified by Micropipette Aspiration. Biophys Rep 2021, 1, 100011. [DOI] [PMC free article] [PubMed] [Google Scholar]
Associated Data
This section collects any data citations, data availability statements, or supplementary materials included in this article.


