

Abstract
Background:
Pre-transplant nutritional status may impact outcome after allogeneic hematopoietic cell transplantation (HCT). Various simple screening tools have been developed and used to identify patients at risk of malnutrition. However, how best to use these screening tools is unclear, and their accuracy for the prediction of adverse outcomes is unknown.
Objective:
To investigate how these different measures contribute to outcome prediction, we examined a large cohort of adults with AML who underwent allogeneic HCT in first or second remission at our institution between April 2006 and May 2021.
Results:
Here, we assessed the prognostic role of the nutrition risk index (NRI), which combines weight loss and serum albumin, in 970 adults with acute myeloid leukemia (AML) in first or second remission who underwent allogeneic HCT between 2006 and 2021 and had usual body weight information available at AML diagnosis or relapse and before HCT. A low NRI at the time of conditioning for HCT was associated with higher non-relapse mortality (NRM, HR=0.97 [0.95–0.98], P<0.001) and relapse risk (hazard ratio [HR]=0.98 [95% confidence interval: 0.96–0.99], P<0.001) and decreased relapse-free survival (RFS, HR=0.97 [0.96–0.98], P<0.001) and overall survival (OS, HR=0.97 [0.96–0.98], P<0.001), as were pre-HCT albumin levels. After multivariable adjustment, the NRI but not weight loss alone was associated with outcome. The predictive ability of the NRI was overall relatively low and comparable to serum albumin, with C-statistics not exceeding 0.59.
Conclusion:
Together, our data indicate that pre-HCT levels of serum albumin, an acute-phase protein recognized to reflect more the severity of the inflammatory response than poor nutritional status, but not weight loss, are independently associated with post-HCT outcomes in AML patients.
Keywords: Acute myeloid leukemia (AML), allogeneic hematopoietic cell transplantation (HCT), malnutrition, nutritional risk index, nutritional status, weight loss
INTRODUCTION
Malnutrition is common in patients with cancer and associated with poor survival.1–8 Consistent with this, evidence has accumulated that malnutrition might negatively impact the outcome of adults undergoing allogeneic hematopoietic cell transplantation (HCT), including those with acute myeloid leukemia (AML).9–16 Because its prognostic relevance is well recognized, there is great interest in reliably diagnosing malnutrition. The use of comprehensive, multidimensional nutritional assessments for this purpose has been recommended.17–19 Nonetheless, various simpler screening tools have been developed and used in an attempt to identify malnourished patients at risk of adverse outcome. For individuals undergoing allografting, low body mass index (BMI), BMI loss between diagnosis or relapse and HCT, or the Nutrition Risk Index (NRI), a score that incorporates weight loss and serum albumin levels, have been utilized, among others, as malnutrition screening tools at the time of the pre-HCT evaluation.10,11,14,20–23 In several studies, such measures have been associated with shorter survival due to an increase in non-relapse mortality (NRM) and/or higher relapse risk.10,14,20–23 However, how best to use these screening tools is unclear, and their accuracy for the prediction of adverse outcomes is unknown. To investigate how these different measures contribute to outcome prediction, we examined a large cohort of adults with AML who underwent allogeneic HCT in first or second remission at our institution between April 2006 and May 2021. We chose to restrict our analysis to AML because a large proportion of the patients affected by this hematological malignancy will undergo allogeneic HCT as part of their treatment course and because many are older than 60 years; therefore, nutritional status might be of particular importance to these individuals.
PATIENTS AND METHODS
Study cohort
We identified all adults ≥18 years of age with AML (2016 WHO criteria)24 who underwent a first allogeneic HCT while in first or second remission (i.e. <5% blasts in bone marrow) between 4/2006 and 5/2021. Related or unrelated donors were selected by high resolution HLA-typing. Information on post-HCT outcomes was captured via the Long-Term Follow-Up Program through medical records from our outpatient clinic and local clinics that provided primary care for patients in addition to records obtained on patients on research studies. All patients were treated on Institutional Review Board-approved research protocols (all registered with ClinicalTrials.gov) or standard treatment protocols and gave consent in accordance with the Declaration of Helsinki. Follow-up was current as of February 10, 2022.
Data collection
The BMI at diagnosis (for patients transplanted in first remission) or relapse (for patients transplanted in second remission) and up to 28 days prior to the start of allogeneic HCT conditioning regimens were calculated by dividing the patient’s weight (in kilograms) by the square of the patient’s height (in meters). Information on weights at diagnosis or relapse (here denoted as “usual body weight”, UBW) was collected from medical records or from the patient’s reporting on usual weight during the pre-HCT evaluation; if both were available, the weight stated in medical records was used. Pre-HCT weights were available for all patients. According to the WHO classification, patients were classified as underweight (BMI <18.5 kg/m2), normal weight (BMI 18.5–25 kg/m2), overweight (BMI 25–29.9 kg/m2), or obese (BMI ≥30 kg/m2). The NRI (1.519 × serum albumin + 41.7 × pre-HCT weight/UBW) was calculated as previously described, with a score >100 denoting not malnourished, 97.5–100 denoting borderline malnourished, 83.5–97.5 denoting mildly malnourished, and <83.5 denoting severely malnourished.25,26 As information on weight at diagnosis is not always available, ideal body weight (IBW=height – 100 – ((height – 150)/4) for men and IBW=height – 100 – ((height – 150)/2.5) for women), rather than UBW, was used in some of the previously reported studies.11,22,27 In sensitivity analyses, we therefore investigated how using IBW rather than UBW would change association between the NRI and outcomes of interest. Because the significance of any given weight loss may differ for individuals depending on their actual weight, we chose to study changes in BMI, rather than absolute weight loss. Since different approaches for measuring weight loss have been used in previous studies, we explored two measurement techniques, namely by calculating the BMI difference from diagnosis/relapse to allogeneic HCT (ΔBMI = BMI at allogeneic HCT – BMI at diagnosis or relapse) or by calculating the percent reduction in BMI from diagnosis or relapse to allogeneic HCT (%BMI loss = (BMI at diagnosis or relapse / BMI at allogeneic HCT) - 1).
The refined MRC/NCRI criteria were used to assign cytogenetic risk at diagnosis.28 The karyotype analysis was based on 20 metaphases for most samples as a routine procedure; FISH studies were performed according to standard procedures at the time of diagnosis and pre-HCT assessment in a subset of patients. The presence of any clonal abnormality by either karyotyping or FISH was considered an abnormal cytogenetic result.29–31 Since molecular data at time of diagnosis were lacking in many patients, only cytogenetic risk could be used to classify patients. Secondary AML was defined as disease following an antecedent hematologic disorder or treatment with systemic chemotherapy and/or radiotherapy for a different disorder. The HCT-specific comorbidity index (HCT-CI) and the Treatment Related Mortality (TRM) score were calculated as described.32,33 Treatment responses were categorized as proposed by the European LeukemiaNet (2017), except that post-HCT relapse was defined as emergence >5% blasts by morphology or multiparameter flow cytometry (MFC) in blood or bone marrow, emergence of cytogenetic abnormalities seen previously, or presence/emergence of any level of disease if leading to a therapeutic intervention.34
Statistical analysis
Categorical variables were presented as numbers with proportions and compared using the Chi2 test or the Fisher’s exact test, for small samples (expected values <5). Continuous variables were presented as medians with interquartile range (IQR) and compared using the Welch two sample t-test. Linear correlation, with the Pearson correlation test, was used to analyze the correlation between UBW and IBW. Unadjusted probabilities of relapse-free survival (RFS; events: relapse and death) and overall survival (OS; event: death) were estimated using the Kaplan-Meier method and compared with the Log-Rank test; associations with RFS and OS were assessed using Cox regression. Probabilities of relapse (with non-relapse mortality [NRM] as a competing event) and NRM (death without prior relapse, with relapse as a competing risk) were summarized using cumulative incidence estimates; associations with cumulative incidence of relapse and NRM were assessed using cause-specific regression models. Multivariable Cox regression models were computed by entering all variables with a P<0.10 for OS in the univariable models. All tests were two-sided with a significant level of P<0.05. Statistical analyses were performed with R (R Foundation for Statistical Computing, Vienna, Austria; http://www.r-project.org).
RESULTS
Patient characteristics
Of 1,011 adults undergoing allogeneic HCT for AML, 21 did not agree to data use for research and pre-HCT evaluations for measurable residual disease (MRD) by MFC were not done in 11 patients. Of the remaining 979 patients, 970 patients (96%) had weight information at diagnosis or relapse, as well as before HCT, available and were included in our analyses. The characteristics of these 970 patients are summarized in Table 1. Only 1% and 3% of patients were underweight at diagnosis/relapse or before HCT, respectively. Patients with any level of malnutrition as evaluated by the NRI were older (P=0.001) and had a shorter interval between last remission and HCT (P=0.023). With increasing degree of malnutrition, as indicated by decreasing NRI, patients had a worse ECOG performance status (P<0.001), a higher TRM scores (P<0.001), and a higher HCT-CI (P=0.003). Patients considered to be severely malnourished based on the NRI were more likely to have a higher BMI at diagnosis/relapse (P<0.001) but not before HCT (P=0.14). As pre-HCT serum albumin levels and weight loss are used to calculate the NRI, decreasing levels of albumin and greater BMI loss were observed with decreasing NRI (Table 1).
TABLE 1.
Pre-HCT demographic and clinical characteristics of study cohort (n=970), stratified according to Nutrition Risk Index categories.
| Characteristic | All patients (n=970) | No malnutrition (n=425) | Borderline malnutrition (n=147) | Mild malnutrition (n=365) | Severe malnutrition (n=33) |
|---|---|---|---|---|---|
| Age at HCT (IQR), years | 55 (42 – 64) | 52 (39 – 62) | 57 (45 – 66) | 57 (46 – 65) | 58 (51 – 63) |
| Female gender, n (%) | 450 (46%) | 181 (43%) | 69 (47%) | 187 (51%) | 13 (39%) |
| WBC count at diagnosis (IQR), G/l | 8 (2 – 39) | 7 (2 – 35) | 7 (2 – 35) | 9 (2 – 45) | 5 (3 – 24) |
| Secondary AML, n (%) | 255 (26%) | 98 (23%) | 40 (27%) | 106 (29%) | 11 (33%) |
| Cytogenetic risk (MRC), n (%) | |||||
| Favorable | 72 (8%) | 33 (8%) | 15 (11%) | 21 (6%) | 3 (9%) |
| Intermediate | 652 (70%) | 296 (72%) | 99 (70%) | 234 (67%) | 23 (70%) |
| Adverse | 209 (22%) | 82 (20%) | 28 (20%) | 92 (27%) | 7 (21%) |
| Time from last remission to HCT (IQR), days | 98 (68 – 145) | 105 (73 – 151) | 91 (62 – 129) | 95 (64 – 132) | 92 (35 – 183) |
| Disease status at HCT, n (%) | |||||
| First remission | 739 (76%) | 331 (78%) | 104 (71%) | 279 (76%) | 25 (76%) |
| Second remission | 231 (24%) | 94 (22%) | 43 (29%) | 86 (24%) | 8 (24%) |
| MFC MRD status before HCT, n (%) | |||||
| MRD-negative | 780 (80%) | 355 (84%) | 119 (81%) | 281 (77%) | 25 (76%) |
| MRD-positive | 190 (20%) | 70 (16%) | 28 (19%) | 84 (23%) | 8 (24%) |
| HCT-CI (IQR) | 2 (1 – 4) | 2.00 (1.00 – 4.00) | 2.00 (1.00 – 4.00) | 3.00 (1.00 – 4.00) | 3.00 (2.00 – 4.00) |
| HCT-CI category, n (%) | |||||
| Low | 336 (35%) | 175 (41%) | 51 (35%) | 102 (28%) | 8 (24%) |
| Intermediate | 345 (36%) | 142 (33%) | 51 (35%) | 140 (38%) | 12 (36%) |
| High | 289 (30%) | 108 (25%) | 45 (31%) | 123 (34%) | 13 (39%) |
| ECOG performance status at HCT, n (%) | |||||
| 0 | 164 (17%) | 95 (22%) | 23 (16%) | 43 (12%) | 3 (9.1%) |
| 1 | 730 (75%) | 312 (73%) | 114 (78%) | 283 (78%) | 21 (64%) |
| 2–3 | 76 (8%) | 18 (4%) | 10 (7%) | 39 (10%) | 9 (27%) |
| Albumin levels at HCT (IQR), g/dl | 3.90 (3.60, 4.10) | 4.10 (4.00 – 4.30) | 3.90 (3.70 – 4.00) | 3.60 (3.50 – 3.80) | 3.10 (2.77 – 3.20) |
| TRM score at HCT (IQR) | 1.75 (0.80, 3.39) | 1.07 (0.61 – 2.43) | 1.98 (1.04 – 3.31) | 2.37 (1.22 – 4.14) | 4.96 (2.65 – 9.04) |
| Stem cell source, n (%) | |||||
| BM | 81 (8%) | 36 (9%) | 7 (5%) | 36 (10%) | 2 (6%) |
| PBSC | 760 (78%) | 320 (75%) | 123 (84%) | 290 (79%) | 27 (82%) |
| Cord blood | 129 (13%) | 69 (16%) | 17 (12%) | 39 (11%) | 4 (12%) |
| HLA matching, n (%) | |||||
| Identical related donor | 226 (23%) | 81 (19%) | 37 (25%) | 100 (27%) | 8 (24%) |
| Matched unrelated donor | 479 (49%) | 214 (50%) | 81 (55%) | 166 (45%) | 18 (55%) |
| 1–2 allele mismatch | 99 (10%) | 44 (10%) | 9 (6%) | 43 (12%) | 3 (9%) |
| Haplo-identical | 37 (4%) | 17 (4%) | 3 (2%) | 17 (5%) | 0 (0%) |
| Cord blood | 129 (13%) | 69 (16%) | 17 (12%) | 39 (11%) | 4 (12%) |
| Conditioning regimen intensity, n (%) | |||||
| MAC | 577 (59%) | 262 (62%) | 88 (60%) | 206 (56%) | 21 (64%) |
| Non-MAC | 393 (41%) | 163 (38%) | 59 (40%) | 159 (44%) | 12 (36%) |
| BMI at diagnosis/relapse (IQR), kg/m2 | 28 (24 – 33) | 27 (24 – 31) | 28 (25 – 32) | 29 (25 – 33) | 32 (27 – 40) |
| BMI at HCT (IQR), kg/m2 | 27 (23 – 31) | 27 (24 – 31) | 27 (24 – 30) | 26 (23 – 30) | 25 (23 – 29) |
| Delta BMI (IQR) | −1.12 (−2.83 – 0.25) | 0.00 (−1.24 – 1.08) | −1.15 (−2.74 – 0.11) | −2.35 (−4.03 – −1.03) | −6.82 (−8.49 – −4.66) |
| BMI loss (IQR) | 0.04 (−0.01 – 0.11) | 0.00 (−0.04, 0.05) | 0.04 (0.00 – 0.10) | 0.09 (0.04 – 0.15) | 0.24 (0.20 – 0.29) |
Abbreviations: AML, acute myeloid leukemia; BM, bone marrow; BMI, body mass index; ECOG, Easter Cooperative Oncology Group; HCT, hematopoietic cell transplantation; HCT-CI, HCT comorbidity index; HLA, human leukocyte antigen; MAC, myeloablative conditioning; MFC, multiparameter flow cytometry; MRC, U.K. Medical Research Council; MRD, measurable residual disease; NRI, Nutritional Risk Index; PB, peripheral blood; TRM, treatment-related mortality; WBC, white blood cell count.
In some of the previously reported retrospective studies, information on weight at diagnosis was not available and as a result, IBW rather than UBW was used to calculate weight loss.11,22 We therefore investigated how using IBW, rather than UBW, would change the stratification of patients according to the NRI. Although there was a significant relationship between UBW and IBW, the correlation coefficient was low (r=0.42, P<0.001; Supplementary Figure 1A). Similarly, the correlation coefficient for the NRI was low when calculated with either UBW or IBW (r=0.37, P<0.001; Supplementary Figure 1B). However, using IBW lowered the number of patients identified has being severely malnourished based on the NRI as only 6/33 (18%) of patients classified as severely malnourished using UBW were classified as such when IBW was used instead.
Relationship between NRI and post-HCT outcomes
With a median follow-up of 5.13 years after HCT among survivors (IQR: 2.30–9.01), there were 308 relapses, 460 deaths, and 193 NRM events contributing to the probability estimates for relapse, RFS, OS, and NRM. The cumulative incidence of NRM was primarily increased in the subgroup of patients considered as severely malnourished according to the NRI (33% [95% confidence interval: 17–50%] vs. 19% [15–23%] vs. 15% [9–21%] vs. 13% [10–17%] at three years for patients categorized as having severe malnutrition, mild malnutrition, borderline malnutrition, or no malnutrition, respectively, P=0.004; Figure 1). On the other hand, the risk of relapse was increased in all three subgroups of patients with malnutrition compared to patients not considered to be malnourished (33% [17–50%] vs. 33% [28–38%] vs. 39% [30–47%] vs. 25% [21–29%], P=0.002). This translated into a stepwise decrease in RFS and OS with increasing degree of malnutrition based on the NRI (3-year RFS: 33% [21–54%] vs. 48% [43–53%] vs. 46% [39–55%] vs. 62% [57–67%] for patients with severe, mild, borderline, or no malnutrition, respectively, P<0.001, and 3-year OS, 36% [23–57%] vs. 54% [49–60%] vs. 52% [44–61%] vs. 67% [62–72%], respectively, P<0.001). If IBW was used to compute the NRI (NRIIBW), this index was no longer significantly associated with NRM, relapse, RFS, or OS (Supplementary Figure 2).
FIGURE 1.
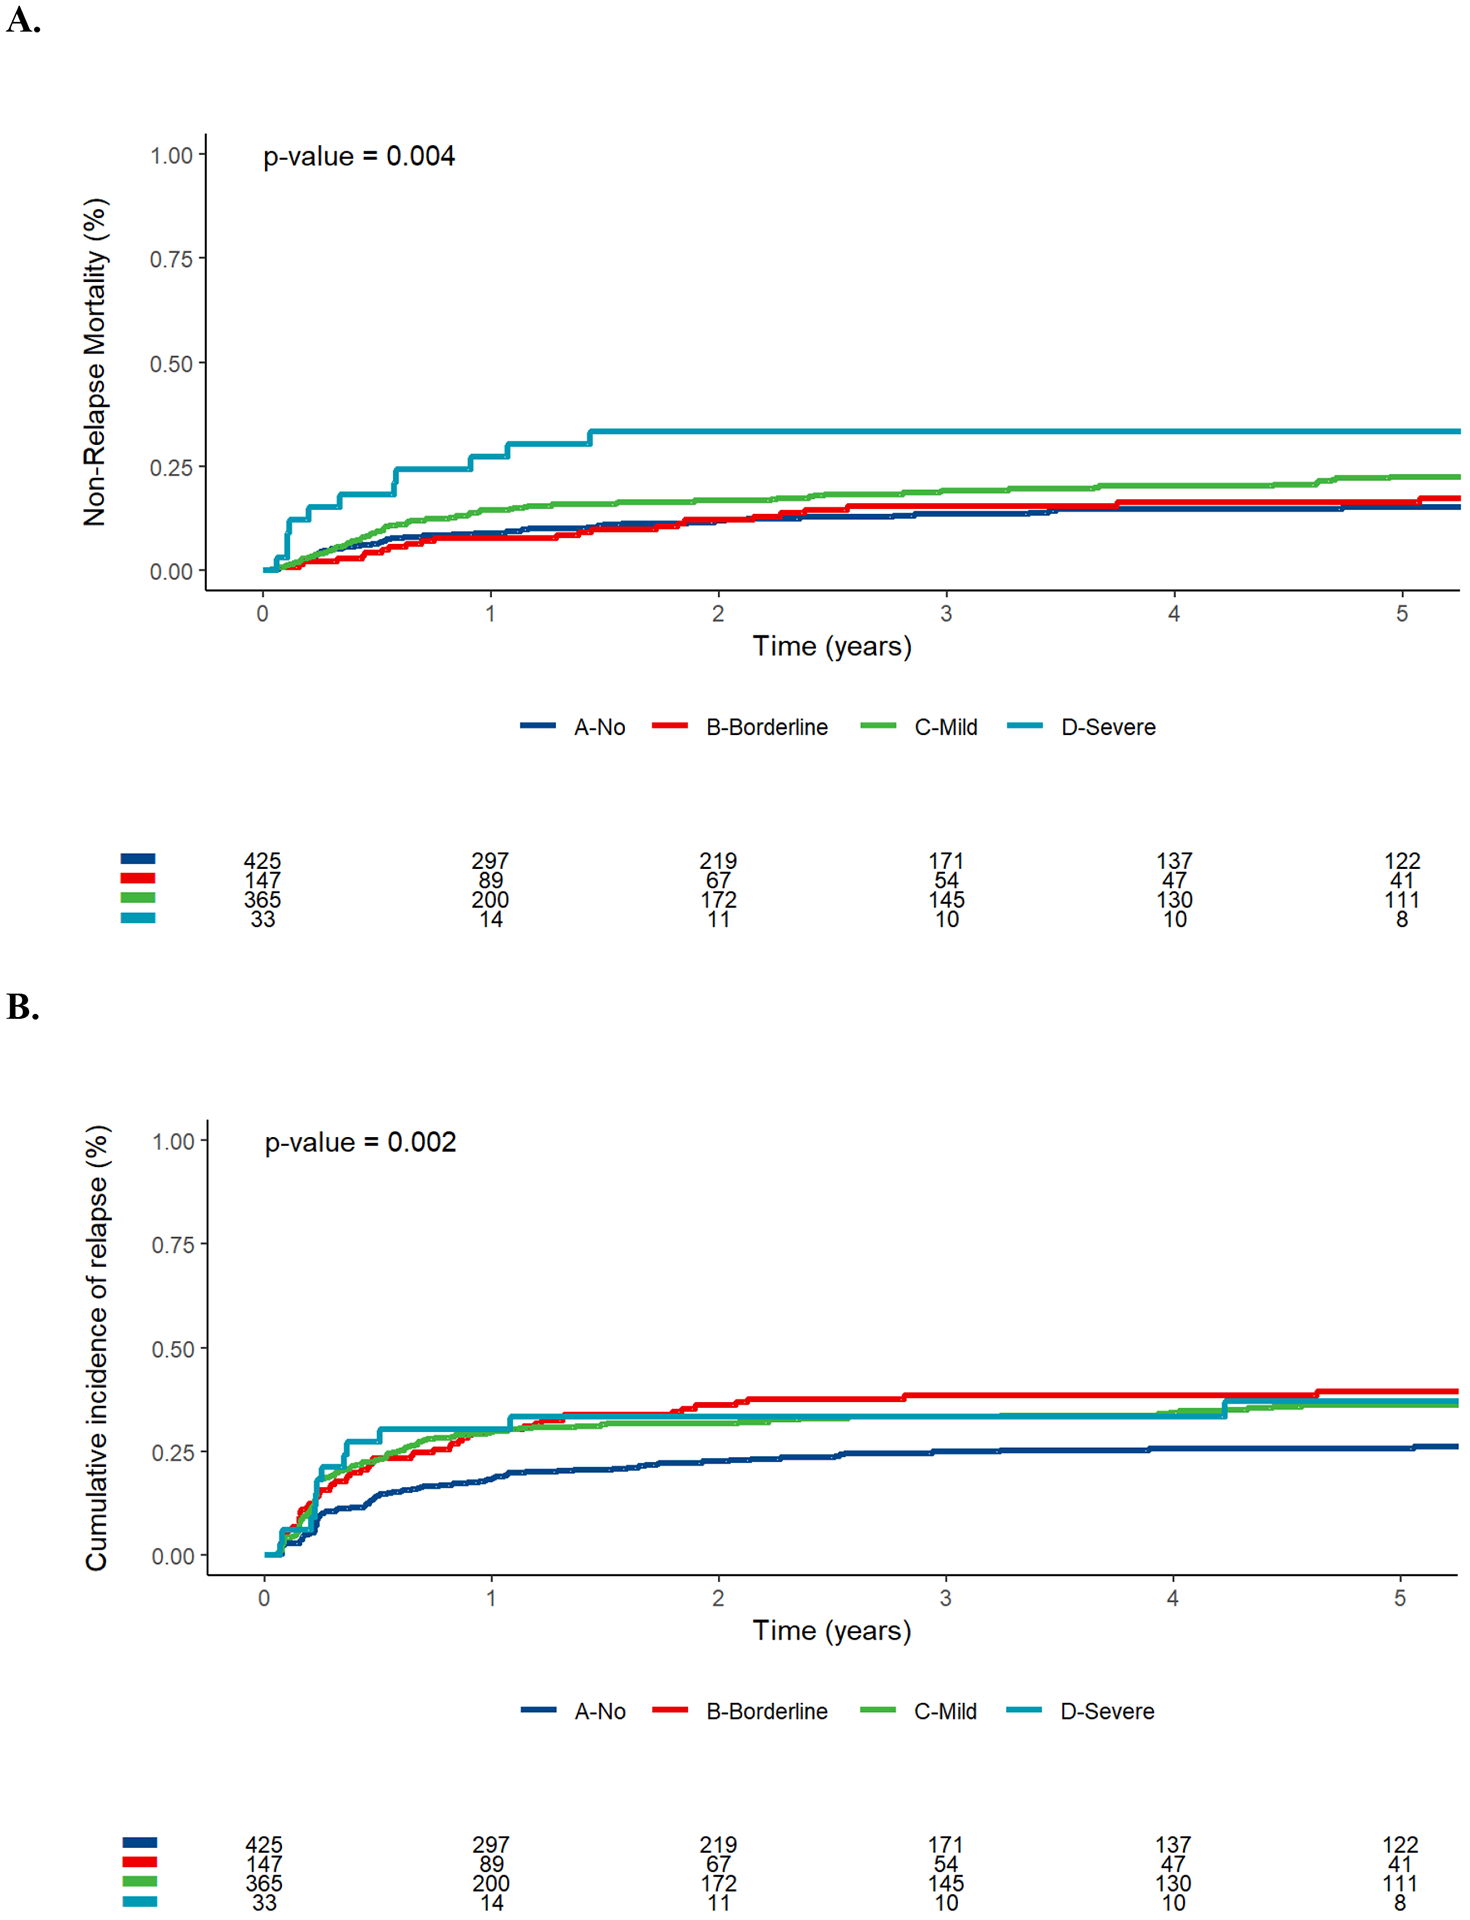
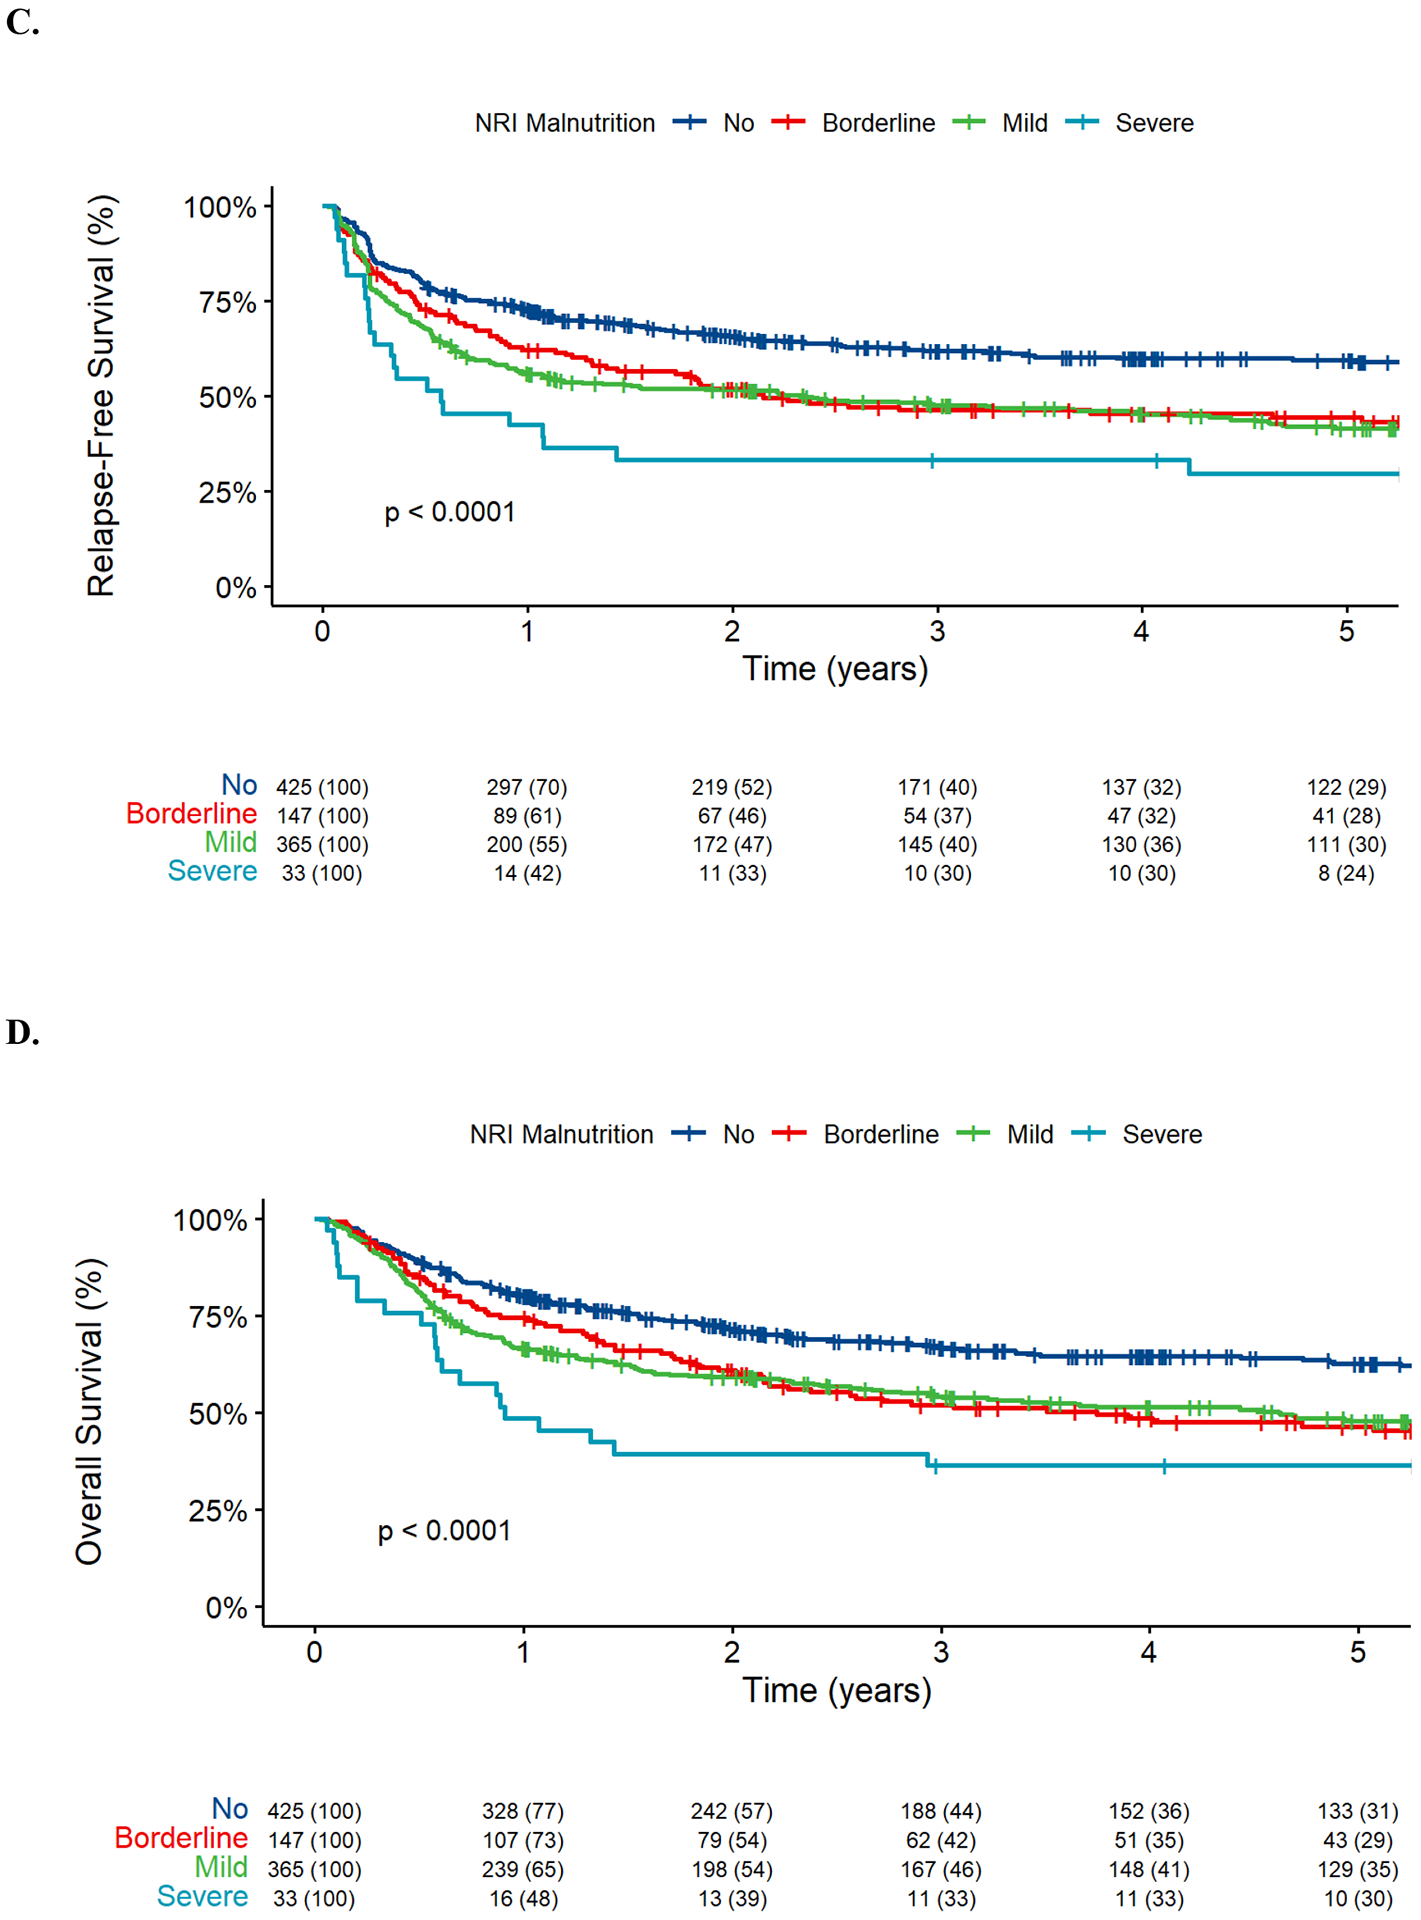
Post-HCT outcomes for 970 adults with AML undergoing allogeneic HCT while in first or second morphologic remission, stratified by nutritional risk index (NRI, no vs. borderline vs. mild vs. severe). (A) Cumulative incidence of non-relapse mortality, (B) cumulative incidence of relapse, (C) relapse-free survival, and (D) overall survival.
NRI as an independent prognostic factor for post-HCT outcome
To study the relationship between the pre-HCT NRI and post-HCT outcomes in more detail, we evaluated univariable and multivariable regression models for the endpoints of NRM, relapse, RFS, and OS, using the NRI either as a continuous or as a categorical variable. Univariable analyses showed statistically significant associations between the NRI as a continuous variable and NRM (hazard ratio [HR]=0.89 [0.83–0.97], P=0.005), relapse (HR=0.92 [0.86–0.99], P=0.022), RFS (HR=0.91 [0.86–0.96], P<0.001), and OS (HR=0.92 [0.87–0.97], P=0.002) (Table 2). Likewise, there were statistically significant associations between the NRI as a categorical variable and each of the four post-HCT outcomes. This was true for patients considered to be borderline malnourished (except for NRM), mildly malnourished, or severely malnourished (Table 2). The prediction accuracy of the NRI was very similar regardless of whether the index was used as a continuous or a categorical variable with C-statistics of 0.59 and 0.58 for NRM, 0.57 and 0.57 for relapse, 0.57 and 0.57 for RFS, and 0.57 and 0.57 for OS, respectively. On the other hand, if IBW was used to compute the NRI (NRIIBW), there was only a significant association with relapse (HR=0.89 [0.81–0.97], P=0.010) but not NRM (HR=1.05 [0.94–1.16], P=0.4), RFS (HR=0.95 [0.89–1.02], P=0.13), or OS (HR=0.97 [0.90–1.04], P=0.4). Moreover, the prediction accuracy was very low with C-statistics ranging from 0.51 to 0.54 for these outcomes for the NRIIBW.
TABLE 2.
Univariable regression models of study cohort.
| Non-relapse mortality | Relapse | RFS | OS | |||||||||
|---|---|---|---|---|---|---|---|---|---|---|---|---|
| HR (95% CI) | P | C-statistic | HR (95% CI) | P | C-statistic | HR (95% CI) | P | C-statistic | HR (95% CI) | P | C-statistic | |
| Age at transplantation, years | 1.04 (1.02 – 1.05) | <0.001 | 0.62 | 1.01 (1.00 – 1.02) | 0.035 | 0.55 | 1.02 (1.01 – 1.03) | <0.001 | 0.57 | 1.02 (1.01 – 1.03) | <0.001 | 0.57 |
| Female gender | 0.71 (0.54 – 0.95) | 0.022 | 0.55 | 0.85 (0.68 – 1.06) | 0.2 | 0.52 | 0.79 (0.67 – 0.95) | 0.011 | 0.53 | 0.81 (0.67 – 0.97) | 0.022 | 0.53 |
| WBC count at diagnosis, G/l | 1.00 (1.00 – 1.00) | 0.3 | 0.51 | 1.00 (1.00 – 1.00) | 0.5 | 0.52 | 1.00 (1.00 – 1.00) | 0.3 | 0.51 | 1.00 (1.00 – 1.00) | 0.2 | 0.51 |
| Secondary AML | 1.41 (1.05 – 1.91) | 0.024 | 0.53 | 1.22 (0.95 – 1.56) | 0.11 | 0.52 | 1.29 (1.07 – 1.56) | 0.008 | 0.52 | 1.26 (1.03 – 1.54) | 0.022 | 0.52 |
| Cytogenetic risk (MRC) | 0.54 | 0.58 | 0.55 | 0.54 | ||||||||
| Favorable | Ref. | Ref. | Ref. | Ref. | ||||||||
| Intermediate | 1.43 (0.81 – 2.52) | 0.2 | 1.75 (0.99 – 3.06) | 0.052 | 1.59 (1.06 – 2.37) | 0.024 | 1.74 (1.13 – 2.69) | 0.012 | ||||
| Adverse | 0.98 (0.51 – 1.89) | >0.9 | 3.20 (1.79 – 5.71) | <0.001 | 2.11 (1.38 – 3.21) | <0.001 | 2.22 (1.40 – 3.50) | <0.001 | ||||
| Time from last remission to HCT, days | 1.00 (1.00 – 1.00) | 0.5 | 0.51 | 1.00 (1.00 – 1.00) | 0.034 | 0.55 | 1.00 (1.00 – 1.00) | 0.2 | 0.53 | 1.00 (1.00 – 1.00) | 0.3 | 0.52 |
| Disease status at HCT | 0.51 | 0.53 | 0.53 | 0.53 | ||||||||
| First remission | Ref. | Ref. | Ref. | Ref. | ||||||||
| Second remission | 1.20 (0.87 – 1.66) | 0.3 | 1.36 (1.06 – 1.74) | 0.016 | 1.30 (1.06 – 1.58) | 0.010 | 1.34 (1.09 – 1.64) | 0.005 | ||||
| MFC MRD status before HCT | 0.53 | 0.64 | 0.60 | 0.59 | ||||||||
| MRD-negative | Ref. | Ref. | Ref. | Ref. | ||||||||
| MRD-positive | 1.60 (1.10 – 2.32) | 0.014 | 4.28 (3.40 – 5.40) | <0.001 | 3.11 (2.57 – 3.76) | <0.001 | 2.65 (2.18 – 3.23) | <0.001 | ||||
| HCT-CI | 1.13 (1.06 – 1.21) | <0.001 | 0.58 | 1.02 (0.97 – 1.08) | 0.4 | 0.52 | 1.07 (1.02 – 1.11) | 0.004 | 0.54 | 1.08 (1.03 – 1.13) | <0.001 | 0.55 |
| HCT-CI category | 0.57 | 0.52 | 0.54 | |||||||||
| Low | Ref. | Ref. | Ref. | Ref. | 0.54 | |||||||
| Intermediate | 1.25 (0.87 – 1.79) | 0.2 | 1.10 (0.84 – 1.44) | 0.5 | 1.15 (0.93 – 1.43) | 0.2 | 1.17 (0.93 – 1.46) | 0.2 | ||||
| High | 1.70 (1.19 – 2.42) | 0.003 | 1.16 (0.87 – 1.53) | 0.3 | 1.34 (1.08 – 1.67) | 0.008 | 1.41 (1.12 – 1.77) | 0.003 | ||||
| ECOG performance status at HCT | 2.94 (2.17 – 3.97) | <0.001 | 0.61 | 1.72 (1.35 – 2.19) | <0.001 | 0.56 | 2.11 (1.75 – 2.55) | <0.001 | 0.58 | 2.29 (1.87 – 2.79) | <0.001 | 0.59 |
| Albumin levels at HCT, g/dl | 0.36 (0.25 – 0.53) | <0.001 | 0.59 | 0.62 (0.46 – 0.85) | 0.002 | 0.56 | 0.51 (0.40 – 0.65) | <0.001 | 0.57 | 0.51 (0.39 – 0.65) | <0.001 | 0.57 |
| TRM score at HCT | 1.13 (1.10 – 1.15) | <0.001 | 0.66 | 1.08 (1.05 – 1.10) | <0.001 | 0.59 | 1.10 (1.08 – 1.12) | <0.001 | 0.61 | 1.12 (1.10 – 1.14) | <0.001 | 0.62 |
| Stem cell source | 0.53 | 0.51 | 0.52 | |||||||||
| BM | Ref. | Ref. | 0.52 | Ref. | Ref. | |||||||
| PBSC | 1.91 (0.97 – 3.74) | 0.060 | 0.69 (0.48 – 0.98) | 0.036 | 0.93 (0.68 – 1.27) | 0.6 | 0.93 (0.67 – 1.27) | 0.6 | ||||
| Cord blood | 2.03 (0.96 – 4.30) | 0.065 | 0.56 (0.35 – 0.90) | 0.017 | 0.85 (0.58 – 1.25) | 0.4 | 0.94 (0.63 – 1.39) | 0.7 | ||||
| HLA matching | 0.58 | 0.52 | 0.53 | 0.55 | ||||||||
| Identical related donor | Ref. | Ref. | Ref. | Ref. | ||||||||
| Matched unrelated donor | 1.09 (0.75 – 1.59) | 0.6 | 0.97 (0.74 – 1.28) | 0.8 | 1.02 (0.81 – 1.27) | 0.9 | 1.04 (0.82 – 1.32) | 0.7 | ||||
| 1–2 allele mismatch | 2.53 (1.61 – 3.96) | <0.001 | 1.15 (0.77 – 1.73) | 0.5 | 1.61 (1.20 – 2.17) | 0.002 | 1.80 (1.32 – 2.44) | <0.001 | ||||
| Haplo-identical | 1.48 (0.63 – 3.50) | 0.4 | 1.74 (1.02 – 2.94) | 0.040 | 1.68 (1.08 – 2.64) | 0.023 | 1.75 (1.08 – 2.82) | 0.022 | ||||
| Cord blood | 1.37 (0.85 – 2.22) | 0.2 | 0.81 (0.54 – 1.22) | 0.3 | 1.00 (0.73 – 1.36) | >0.9 | 1.13 (0.82 – 1.56) | 0.4 | ||||
| Conditioning regimen intensity | 0.59 | 0.55 | 0.56 | 0.55 | ||||||||
| MAC | Ref. | Ref. | Ref. | Ref. | ||||||||
| Non-MAC | 2.28 (1.72 – 3.04) | <0.001 | 1.36 (1.08 – 1.70) | 0.008 | 1.66 (1.39 – 1.98) | <0.001 | 1.60 (1.33 – 1.92) | <0.001 | ||||
| BMI at diagnosis/relapse, kg/m2 | 1.03 (1.01 – 1.04) | <0.001 | 0.57 | 0.99 (0.98 – 1.01) | 0.5 | 0.52 | 1.01 (1.00 – 1.02) | 0.10 | 0.54 | 1.01 (1.00 – 1.02) | 0.045 | 0.54 |
| BMI category at diagnosis/relapse | 0.55 | 0.52 | 0.53 | 0.53 | ||||||||
| Underweight | 0 | >0.9 | 0 | >0.9 | 0 | >0.9 | 0 | >0.9 | ||||
| Normal | Ref. | Ref. | Ref. | Ref. | ||||||||
| Overweight | 1.20 (0.82 – 1.75) | 0.3 | 1.09 (0.82 – 1.45) | 0.6 | 1.13 (0.90 – 1.42) | 0.3 | 1.13 (0.89 – 1.43) | 0.3 | ||||
| Obesity | 1.64 (1.14 – 2.35) | 0.008 | 1.10 (0.83 – 1.46) | 0.5 | 1.28 (1.03 – 1.61) | 0.027 | 1.32 (1.04 – 1.66) | 0.02 | ||||
| BMI at HCT, kg/m2 | 1.03 (1.01 – 1.05) | 0.002 | 0.56 | 0.98 (0.97 – 1.00) | 0.11 | 0.50 | 1.00 (0.99 – 1.02) | 0.5 | 0.52 | 1.01 (0.99 – 1.02) | 0.2 | 0.52 |
| BMI category at HCT | 0.54 | 0.53 | 0.52 | 0.52 | ||||||||
| Underweight | 0.69 (0.10 – 5.00) | 0.7 | 1.02 (0.32 – 3.20) | >0.9 | 0.91 (0.34 – 2.46) | 0.9 | 0.74 (0.24 – 2.32) | 0.6 | ||||
| Normal | Ref. | Ref. | Ref. | Ref. | ||||||||
| Overweight | 1.27 (0.89 – 2.13) | 0.2 | 1.06 (0.82 – 1.37) | 0.7 | 1.13 (0.92 – 1.39) | 0.3 | 1.21 (0.98 – 1.50) | 0.08 | ||||
| Obesity | 1.50 (1.06 – 2.13) | 0.024 | 0.81 (0.61 – 1.09) | 0.2 | 1.04 (0.83 – 1.30) | 0.7 | 1.09 (0.86 – 1.38) | 0.5 | ||||
| Delta BMI | 0.96 (0.93 – 1.00) | 0.040 | 0.54 | 0.97 (0.95 – 1.01) | 0.11 | 0.54 | 0.97 (0.95 – 0.99) | 0.011 | 0.54 | 0.97 (0.95 – 1.00) | 0.030 | 0.53 |
| BMI loss | 2.46 (0.93 – 6.54) | 0.071 | 0.53 | 2.24 (0.99 – 5.05) | 0.053 | 0.54 | 2.32 (1.24 – 4.35) | 0.008 | 0.54 | 2.07 (1.05 – 4.08) | 0.036 | 0.53 |
| NRI/10 (continuous) | 0.89 (0.83 – 0.97) | 0.005 | 0.59 | 0.92 (0.86 – 0.99) | 0.022 | 0.57 | 0.91 (0.86 – 0.96) | <0.001 | 0.57 | 0.92 (0.87 – 0.97) | 0.002 | 0.57 |
| NRI (categorical) | ||||||||||||
| No malnutrition | Ref. | 0.58 | Ref. | 0.57 | Ref. | 0.57 | Ref. | 0.57 | ||||
| Bordeline malnutrition | 1.19 (0.75 – 1.88) | 0.5 | 1.68 (1.22 – 2.33) | 0.002 | 1.49 (1.15 – 1.94) | 0.003 | 1.51 (1.15 – 1.98) | 0.003 | ||||
| Mild malnutrition | 1.66 (1.20 – 2.28) | 0.002 | 1.60 (1.24 – 2.07) | <0.001 | 1.62 (1.33 – 1.98) | <0.001 | 1.54 (1.25 – 1.90) | <0.001 | ||||
| Severe malnutrition | 3.61 (1.99 – 6.55) | <0.001 | 1.95 (1.07 – 3.54) | 0.028 | 2.56 (1.68 – 3.90) | <0.001 | 2.46 (1.59 – 3.81) | <0.001 | ||||
Abbreviations: AML, acute myeloid leukemia; BM, bone marrow; BMI, body mass index; ECOG, Easter Cooperative Oncology Group; HCT, hematopoietic cell transplantation; HCT-CI, HCT comorbidity index; HLA, human leukocyte antigen; MAC, myeloablative conditioning; MFC, multiparameter flow cytometry; MRC, U.K. Medical Research Council; MRD, measurable residual disease; NRI, Nutritional Risk Index; PB, peripheral blood; TRM, treatment-related mortality; WBC, white blood cell count.
Given the associations of the NRI with post-HCT outcomes, we were interested in determining the relative importance of the individual components of the NRI, i.e., weight loss and serum albumin, as contributors to these associations. When used as a continuous variable, decreasing pre-HCT albumin levels were associated with NRM (HR=0.36 [0.25–0.53], P<0.001), relapse (HR=0.62 [0.46–0.85], P=0.002), RFS (HR=0.51 [0.40–0.65], P<0.001), and OS (HR=0.51 [0.39–0.65], P<0.001). The difference in BMI from diagnosis/relapse to HCT (ΔBMI) was associated with increased NRM (HR=0.96 [0.93–1.00], P=0.04) whereas the proportion of BMI loss (%BMI) was associated with a non-significant increase in NRM (HR=2.46 [0.93–6.54], P=0.071) and relapse (HR=2.24 [0.99–5.05], P=0.053). Both measures were associated with decreased RFS and OS (Table 2). Importantly, the predictive ability of the NRI was similar to that of pre-HCT serum albumin levels alone (C-statistics, 0.59 vs. 0.59 for NRM, 0.56 vs. 0.57 for relapse, 0.57 vs. 0.57 for RFS, and 0.57 vs. 0.57 for OS, respectively; Table 2). In contrast, the C-statistics were slightly higher for the NRI compared to weight loss alone, estimated either as ΔBMI or as %BMI; for the latter, C-statistics were equally low for NRM, relapse risk, RFS, or OS, ranging from 0.53 to 0.54. Other measures used to evaluate the nutritional status such as obesity at diagnosis/relapse or at the time of HCT were associated with NRM (HR=1.64 [1.14–2.35], P=0.008 and HR=1.50 [1.06–2.13], P=0.024, respectively). However, this only translated into decreased RFS and OS in patients with obesity at diagnosis/relapse (HR=1.28 [1.03–1.61), P=0.027 and HR=1.32 [1.04–1.66], P=0.02, respectively).
In multivariable analyses in which we excluded pre-HCT serum albumin levels and weight loss due to collinearity with the NRI, the NRI as a continuous variable was independently associated with relapse (HR=0.76 [0.63–0.91], P=0.002), RFS (HR=0.78 [0.68–0.90], P<0.001), and OS (HR=0.83 [0.72–0.96], P=0.013), but not NRM (HR=0.82 [0.66–1.02], P=0.070) (Table 3). Weight loss alone, either measured as ΔBMI or %BMI, was not independently associated with NRM (HR=1.02 [0.97–1.07], P=0.5, and HR=0.79 [0.21–2.99], P=0.7, respectively), relapse (HR=0.97 [0.93–1.01), P=0.11, and HR=2.08 [0.76–5.69], P=0.2, respectively), RFS (HR=0.99 [0.96–1.02], P=0.4, and HR=1.47 [0.67–3.26], P=0.3, respectively), or OS (HR=1.00 [0.97–1.03], P>0.9, and HR=0.97 [0.40–2.35], P>0.9, respectively), in multivariable models (Supplementary Tables 1 and 2). Similar results were obtained for models that included serum albumin levels and those that did not (data not shown).
TABLE 3.
Multivariable regression models of study cohort assessing NRI.
| Non-relapse mortality | Relapse | RFS | OS | |||||
|---|---|---|---|---|---|---|---|---|
| HR (95% CI) | P | HR (95% CI) | P | HR (95% CI) | P | HR (95% CI) | P | |
| Age at transplantation, years | 1.02 (1.00 – 1.03) | 0.025 | 0.99 (0.98 – 1.00) | 0.2 | 1.00 (0.99 – 1.01) | >0.9 | 1.00 (0.99 – 1.01) | 0.7 |
| Female gender | 0.71 (0.52 – 0.98) | 0.036 | 0.97 (0.76 – 1.24) | 0.8 | 0.88 (0.72 – 1.06) | 0.2 | 0.87 (0.71 – 1.06) | 0.2 |
| Secondary AML | 1.02 (0.71 – 1.46) | >0.9 | 0.86 (0.64 – 1.16) | 0.3 | 0.90 (0.72 – 1.13) | 0.4 | 0.90 (0.71 – 1.15) | 0.4 |
| Cytogenetic risk (MRC) | ||||||||
| Favorable | Ref. | Ref. | Ref. | Ref. | ||||
| Intermediate | 1.31 (0.72 – 1.39) | 0.4 | 1.93 (1.07 – 3.47) | 0.029 | 1.65 (1.08 – 2.52) | 0.02 | 1.72 (1.10 – 2.69) | 0.018 |
| Adverse | 0.86 (0.42 – 1.74) | 0.7 | 3.10 (1.66 – 5.79) | <0.001 | 1.96 (1.24 – 3.10) | 0.004 | 2.03 (1.25 – 3.30) | 0.004 |
| Disease status at HCT | ||||||||
| First remission | Ref. | Ref. | Ref. | Ref. | ||||
| Second remission | 1.09 (0.75 – 1.58) | 0.7 | 1.44 (1.08 – 1.93) | 0.014 | 1.24 (0.99 – 1.56) | 0.064 | 1.24 (0.98 – 1.57) | 0.068 |
| MFC MRD status before HCT | ||||||||
| MRD-negative | Ref. | Ref. | Ref. | Ref. | ||||
| MRD-positive | 1.35 (0.88 – 2.07) | 0.2 | 3.91 (3.01 – 5.09) | <0.001 | 2.79 (2.24 – 3.47) | <0.001 | 2.19 (1.75 – 2.73) | <0.001 |
| HCT–CI | 1.06 (0.98 – 1.14) | 0.2 | 1.00 (0.94 – 1.07) | 0.9 | 1.02 (0.98 – 1.07) | 0.3 | 1.04 (0.99 – 1.09) | 0.13 |
| ECOG performance status at HCT | 1.93 (1.30 – 2.87) | 0.001 | 1.42 (1.05 – 1.91) | 0.023 | 1.57 (1.24 – 1.99) | <0.001 | 1.59 (1.24 – 2.04) | <0.001 |
| TRM score at HCT | 1.03 (0.98 – 1.08) | 0.2 | 0.99 (0.94 – 1.05) | 0.7 | 1.01 (0.98 – 1.05) | 0.5 | 1.03 (0.99 – 1.07) | 0.12 |
| HLA matching | ||||||||
| Identical related donor | Ref. | Ref. | Ref. | Ref. | ||||
| Matched unrelated donor | 1.01 (0.68 – 1.50) | >0.9 | 0.91 (0.68 – 1.22) | 0.5 | 0.94 (0.74 – 1.18) | 0.6 | 0.93 (0.73 – 1.19) | 0.6 |
| 1–2 allele mismatch | 2.03 (1.25 – 3.27) | 0.004 | 0.94 (0.61 – 1.44) | 0.8 | 1.34 (0.98 – 1.83) | 0.065 | 1.52 (1.10 – 2.11) | 0.011 |
| Haplo-identical | 1.12 (0.45 – 2.80) | 0.8 | 1.20 (0.68 – 2.11) | 0.5 | 1.16 (0.71 – 1.88) | 0.6 | 1.26 (0.76 – 2.10) | 0.4 |
| Cord blood | 1.44 (0.85 – 2.41) | 0.2 | 0.74 (0.48 – 1.14) | 0.2 | 0.97 (0.70 – 1.35) | 0.9 | 1.10 (0.78 – 1.54) | 0.6 |
| Conditioning regimen intensity | ||||||||
| MAC | Ref. | Ref. | Ref. | Ref. | ||||
| Non-MAC | 1.41 (0.97 – 2.04) | 0.074 | 1.66 (1.25 – 2.21) | <0.001 | 1.61 (1.29 – 2.02) | <0.001 | 1.44 (1.14 – 1.82) | 0.002 |
| BMI at diagnosis/relapse, kg/m2 | 1.01 (0.99 – 1.04) | 0.2 | 0.99 (0.97 – 1.01) | 0.4 | 1.00 (0.99 – 1.02) | 0.6 | 1.00 (0.99 – 1.02) | 0.7 |
| NRI/10 | 0.82 (0.66 – 1.02) | 0.070 | 0.76 (0.63 – 0.91) | 0.002 | 0.78 (0.68 – 0.90) | <0.001 | 0.83 (0.72 – 0.96) | 0.013 |
Abbreviations: AML, acute myeloid leukemia; ECOG, Easter Cooperative Oncology Group; HCT, hematopoietic cell transplantation; HCT-CI, HCT comorbidity index; HLA, human leukocyte antigen; MAC, myeloablative conditioning; MFC, multiparameter flow cytometry; MRC, U.K. Medical Research Council; MRD, measurable residual disease; NRI, Nutritional Risk Index; TRM, treatment-related mortality.
Relationship between the NRI, BMI category at diagnosis, conditioning intensity, and post-HCT outcomes
To further explore the relationship between the NRI and post-HCT outcomes, we performed subset analyses in which we studied patients who had a normal BMI, were overweight, or were obese at diagnosis/relapse as separate groups. The NRI was associated with NRM in patients with normal UBW (P=0.018), but not in overweight and obese patients, whereas it was associated with relapse exclusively in overweight patients (P=0.044; Supplementary Figures 3–5). On the other hand, the NRI was associated with RFS in all three groups (P=0.005, P=0.016, and P=0.008, respectively) and with OS in normal weight (P=0.026) patients and those with obesity at diagnosis (P<0.001) but not in overweight patients (P=0.31). Moreover, the NRI was associated with NRM in patients receiving non-MAC regimens (P=0.017) and with relapse in patients receiving MAC (P=0.014; Supplementary Figure 6, Supplementary Figure 7). As in the whole cohort, the NRI was associated with RFS and OS in both the MAC and non-MAC groups (RFS, P<0.001 and P=0.003; OS, P=0.004 and P=0.005, respectively).
DISCUSSION
A larger number of patient series have suggested that the nutritional status has a significant impact on the outcome after allogeneic HCT, with some of these including patients with AML. Consistent with this notion, we found an association between poor nutritional status, as estimated by a lower NRI, and adverse outcomes, namely an increase in NRM as well as relapse risk, in adults with AML undergoing allografting in the analyses presented herein. These increased risks translated into inferior RFS and OS compared to patients with higher NRI. Importantly, however, the two components contained in the NRI, weight loss and albumin levels, contributed unevenly to the predictive information conveyed by the NRI. Specifically, while low pre-HCT albumin levels were independently associated with survival, pre-HCT weight loss was not, and weight loss did not improve the predictive performance of pre-HCT albumin levels, indicating that the prognostic information of the NRI is provided by serum albumin levels.
In line with findings reported by others,11,14,20,22 we found that weight loss, measured either as BMI reduction (ΔBMI), proportion of BMI loss (%BMI), or via the NRI, is associated with higher NRM. While our study was not designed to identify the reasons for this association, previous investigations have indicated that AML patients who lose weight before allogeneic HCT are more likely to develop life-threatening infections or graft-versus-host disease and have longer hospital stays than others.10,11,14,20 Most previous reports showed that weight loss is more informative than BMI before HCT when evaluating the risk of toxicity,10,20,22,35,36 with some but not all studies identifying an association between being underweight before HCT and increased NRM.10,22,35 As in previous studies,22,35,37,38 obesity was associated with increased NRM. Due to the very small proportion of underweight patients before HCT in our cohort relative to previously reported cohorts,10,20,35 we could not evaluate the possible relationship between pre-HCT weight loss or BMI with post-HCT outcomes.
At first glance perhaps surprising, our study unraveled a statistically significant association between a low NRI and an increased relapse risk. While poorly understood, this association was also observed in some previous studies, with data from some studies35,36 (but not others22,23) suggesting that patients experiencing weight loss may have higher-risk disease features. In our cohort, patients with a lower NRI indeed had higher disease risk features. Still, a lower NRI remained statistically significantly associated with an increased risk of relapse even after adjustment for disease characteristics. Alternative explanations considered for this association in underweight patients include chemotherapy underdosing, energy deprivation that could result in some leukemic stem cells entering a quiescent state, thereby escaping chemotherapy, and suppression of immune responses, including a reduction in the graft-versus-leukemia effects.14,23,35,36
In contrast to some previous studies,20,22 weight loss was not independently associated with post-HCT outcomes in our cohort after multivariable adjustment, suggesting that pre-HCT weight loss provides limited prognostic information when used alone. Furthermore, the association of the NRI with post-HCT outcomes was only observed when weight loss was calculated using UBW but not IBW. Indeed, UBW is a more precise reflection of the patient’s actual weight before treatment whereas IBW can underestimate weight loss, especially in patients with initial obesity.
Our observation that the prognostic role and predictive ability of the NRI is largely due to the contribution of serum albumin (and not due to weight loss) and is similar to serum albumin alone, highlights the significance of serum albumin measured at the time of HCT as a prognostic biomarker. Consistent with our findings, previous studies have shown pre-HCT albumin levels to be independently associated with post-HCT outcomes leading to their integration in the augmented HCT-CI.39–43 However, serum albumin – while traditionally used as biochemical laboratory value in nutrition assessments – is an acute-phase protein now recognized to reflect better the severity of an inflammatory response than a poor nutritional status or protein-energy malnutrition.18,44 Together, our data suggest that the NRI may be useful, at least to some degree (see below), in outcome prognostication/prediction for adults with AML undergoing allogeneic HCT, but we may speculate that this prognostic/predictive information may be primarily due to an increased inflammatory state/response in patients with lower NRI. This notion would argue against use of the NRI as a screening tool to identify patients at risk for malnutrition.
Several limitations of our study must be acknowledged. First, due to its retrospective nature, we could only use weights at discrete time points (AML diagnosis/relapse, before HCT) to estimate the patients’ UBW rather obtaining their stable weights for at least 6–12 months prior to AML diagnosis or relapse as is done in a detailed nutritional assessment by dietitians. Second, we were unable to assess the reason(s) for weight loss before HCT (e.g., secondary to AML or other diseases, treatment received and its potential complications, intentional loss). Third, potential interventions in case of weight loss were not systematically recorded. Fourth, weight at diagnosis/relapse was not available for all patients. However, most underwent nutritional evaluation before HCT during which information about their UBW was obtained and recorded. We observed that when both parameters were available (recorded and reported weight at diagnosis/relapse), the reported weight tended to be lower, thus potentially minimizing weight loss in patients for whom only the reported weight at diagnosis/relapse was available. Fifth, adjusting our analyses for performance status and HCT-CI may not have been sufficient to fully capture poor health status and pre-existing organ dysfunctions in patients. Sixth, the single center setting of this analysis may limit its generalizability as patient characteristics may differ in other institutions and/or different parts of the world. Finally, to what extent our findings could be extrapolated to other patient populations, e.g., different diseases, is unknown.
In conclusion, although the NRI, a relatively simple index that combines weight loss (using UBW) and albumin levels, calculated pre-HCT, is associated with post-HCT outcomes, it does not provide prognostic/predictive information that goes beyond that provided by serum albumin alone, a measure that may reflect better the severity of an inflammatory response than a poor nutritional status. Moreover, we found the predictive accuracy of the NRI to be low, strongly arguing against over-reliance on this tool for patient assessment. Because of that observation, our findings highlight the need to examine the value of other tools to assess the nutritional status of adults with AML undergoing allogeneic HCT, including one or several of the comprehensive, multidimensional assessments that have been developed for this purpose.17–19
Supplementary Material
HIGHLIGHTS.
A low Nutritional Risk Index (NRI), an index that includes weight loss and serum albumin, was associated with higher non-relapse mortality and relapse risk and decreased relapse-free and overall survival.
After multivariable adjustment, the NRI but not weight loss alone was associated with outcome.
The predictive ability of the NRI was overall relatively low and comparable to serum albumin, while the addition of weight loss did not improve prediction.
ACKNOWLEDGMENTS
Research reported in this publication was supported by grants P01-CA078902, P01-CA018029, and P30-CA015704 from the National Cancer Institute/National Institutes of Health (NCI/NIH), Bethesda, MD, USA. The authors acknowledge the excellent care provided by the physicians and nurses of the HCT teams, the staff in the Long-Term Follow-up office at the Fred Hutchinson Cancer Center, and the patients for participating in our research protocols.
DISCLOSURE OF CONFLICTS OF INTEREST
Employment or Leadership Position: none; Consultant or Advisory Role: none: Stock Ownership: none; Honoraria: CO, Novartis; Research Funding: none; Expert Testimony: none; Patents: none; Other Remuneration: none.
Footnotes
Publisher's Disclaimer: This is a PDF file of an unedited manuscript that has been accepted for publication. As a service to our customers we are providing this early version of the manuscript. The manuscript will undergo copyediting, typesetting, and review of the resulting proof before it is published in its final form. Please note that during the production process errors may be discovered which could affect the content, and all legal disclaimers that apply to the journal pertain.
REFERENCES
- 1.Dewys WD, Begg C, Lavin PT, Band PR, Bennett JM, Bertino JR et al. Prognostic effect of weight loss prior tochemotherapy in cancer patients. Am J Med 1980; 69: 491–497. [DOI] [PubMed] [Google Scholar]
- 2.Fearon K, Strasser F, Anker SD, Bosaeus I, Bruera E, Fainsinger RL et al. Definition and classification of cancer cachexia: an international consensus. Lancet Oncol 2011; 12: 489–495. [DOI] [PubMed] [Google Scholar]
- 3.Aapro M, Arends J, Bozzetti F, Fearon K, Grunberg SM, Herrstedt J et al. Early recognition of malnutrition and cachexia in the cancer patient: a position paper of a European School of Oncology Task Force. Ann Oncol 2014; 25: 1492–1499. [DOI] [PubMed] [Google Scholar]
- 4.Arends J, Baracos V, Bertz H, Bozzetti F, Calder PC, Deutz NEP et al. ESPEN expert group recommendations for action against cancer-related malnutrition. Clin Nutr 2017; 36: 1187–1196. [DOI] [PubMed] [Google Scholar]
- 5.Bullock AF, Greenley SL, McKenzie GAG, Paton LW, Johnson MJ. Relationship between markers of malnutrition and clinical outcomes in older adults with cancer: systematic review, narrative synthesis and meta-analysis. Eur J Clin Nutr 2020; 74: 1519–1535. [DOI] [PMC free article] [PubMed] [Google Scholar]
- 6.Richards J, Arensberg MB, Thomas S, Kerr KW, Hegazi R, Bastasch M. Impact of Early Incorporation of Nutrition Interventions as a Component of Cancer Therapy in Adults: A Review. Nutrients 2020; 12: 3403. [DOI] [PMC free article] [PubMed] [Google Scholar]
- 7.Bossi P, Delrio P, Mascheroni A, Zanetti M. The Spectrum of Malnutrition/Cachexia/Sarcopenia in Oncology According to Different Cancer Types and Settings: A Narrative Review. Nutrients 2021; 13: 1980. [DOI] [PMC free article] [PubMed] [Google Scholar]
- 8.Prado CM, Laviano A, Gillis C, Sung AD, Gardner M, Yalcin S et al. Examining guidelines and new evidence in oncology nutrition: a position paper on gaps and opportunities in multimodal approaches to improve patient care. Support Care Cancer 2022; 30: 3073–3083. [DOI] [PMC free article] [PubMed] [Google Scholar]
- 9.Urbain P, Birlinger J, Ihorst G, Biesalski H-K, Finke J, Bertz H. Body mass index and bioelectrical impedance phase angle as potentially modifiable nutritional markers are independent risk factors for outcome in allogeneic hematopoietic cell transplantation. Ann Hematol 2013; 92: 111–119. [DOI] [PubMed] [Google Scholar]
- 10.Baumgartner A, Zueger N, Bargetzi A, Medinger M, Passweg JR, Stanga Z et al. Association of Nutritional Parameters with Clinical Outcomes in Patients with Acute Myeloid Leukemia Undergoing Haematopoietic Stem Cell Transplantation. Ann Nutr Metab 2016; 69: 89–98. [DOI] [PubMed] [Google Scholar]
- 11.Sagou K, Ozeki K, Ukai S, Adachi Y, Fukushima N, Kohno A. Impact of a Nutritional Risk Index on Clinical Outcomes after Allogeneic Hematopoietic Cell Transplantation. Biol Blood Marrow Transplant 2019; 25: 2287–2296. [DOI] [PubMed] [Google Scholar]
- 12.Araie H, Kawaguchi Y, Okabe M, Lee Y, Ohbiki M, Osaki M et al. Prediction of clinical outcome by controlling nutritional status (CONUT) before allogeneic hematopoietic stem cell transplantation in myeloid malignancies. Int J Hematol 2019; 110: 599–605. [DOI] [PubMed] [Google Scholar]
- 13.Kaito S, Wada A, Adachi H, Konuma R, Kishida Y, Nagata A et al. Geriatric nutritional risk index as a useful prognostic factor in second allogeneic hematopoietic stem cell transplantation. Ann Hematol 2020; 99: 1655–1665. [DOI] [PubMed] [Google Scholar]
- 14.Tamaki M, Nakasone H, Nakamura Y, Kawamura M, Kawamura S, Takeshita J et al. Body Weight Loss Before Allogeneic Hematopoietic Stem Cell Transplantation Predicts Survival Outcomes in Acute Leukemia Patients. Transplant Cell Ther 2021; 27: 340.e1–340.e6. [DOI] [PubMed] [Google Scholar]
- 15.Eglseer D, Bauer S, Huber-Kraßnitzer B, Greinix H. Malnutrition risk prior to hematopoietic stem cell transplantation predicts mortality in adults. Bone Marrow Transplant 2021; 56: 2268–2271. [DOI] [PubMed] [Google Scholar]
- 16.Cioce M, Botti S, Lohmeyer FM, Galli E, Magini M, Giraldi A et al. Nutritional status and quality of life in adults undergoing allogeneic hematopoietic stem cell transplantation. Int J Hematol 2022. doi: 10.1007/s12185-022-03351-7. [DOI] [PMC free article] [PubMed] [Google Scholar]
- 17.Duerksen DR, Laporte M, Jeejeebhoy K. Evaluation of Nutrition Status Using the Subjective Global Assessment: Malnutrition, Cachexia, and Sarcopenia. Nutr Clin Pract 2021; 36: 942–956. [DOI] [PubMed] [Google Scholar]
- 18.White JV, Guenter P, Jensen G, Malone A, Schofield M. Consensus Statement of the Academy of Nutrition and Dietetics/American Society for Parenteral and Enteral Nutrition: Characteristics Recommended for the Identification and Documentation of Adult Malnutrition (Undernutrition). J Acad Nutr Diet 2012; 112: 730–738. [DOI] [PubMed] [Google Scholar]
- 19.Jensen GL, Cederholm T, Correia MITD, Gonzalez MC, Fukushima R, Higashiguchi T et al. GLIM Criteria for the Diagnosis of Malnutrition: A Consensus Report From the Global Clinical Nutrition Community. J Parenter Enter Nutr 2019; 43: 32–40. [DOI] [PubMed] [Google Scholar]
- 20.Ando T, Fujisawa S, Teshigawara H, Ogusa E, Ishii Y, Miyashita K et al. Impact of treatment-related weight changes from diagnosis to hematopoietic stem-cell transplantation on clinical outcome of acute myeloid leukemia. Int J Hematol 2019; 109: 673–683. [DOI] [PubMed] [Google Scholar]
- 21.Navarro WH, Agovi M-A, Logan BR, Ballen K, Bolwell BJ, Frangoul H et al. Obesity Does Not Preclude Safe and Effective Myeloablative Hematopoietic Cell Transplantation (HCT) for Acute Myelogenous Leukemia (AML) in Adults. Biol Blood Marrow Transplant 2010; 16: 1442–1450. [DOI] [PMC free article] [PubMed] [Google Scholar]
- 22.Brauer D, Backhaus D, Pointner R, Vucinic V, Niederwieser D, Platzbecker U et al. Nutritional Status at Diagnosis and Pre-transplant Weight Loss Impact Outcomes of Acute Myeloid Leukemia Patients Following Allogeneic Stem Cell Transplantation. HemaSphere 2021; 5: e532. [DOI] [PMC free article] [PubMed] [Google Scholar]
- 23.Dietrich S, Radujkovic A, Stölzel F, Falk CS, Benner A, Schaich M et al. Pretransplant Metabolic Distress Predicts Relapse of Acute Myeloid Leukemia After Allogeneic Stem Cell Transplantation. Transplantation 2015; 99: 1065–1071. [DOI] [PubMed] [Google Scholar]
- 24.Arber DA, Orazi A, Hasserjian R, Thiele J, Borowitz MJ, Le Beau MM et al. The 2016 revision to the World Health Organization classification of myeloid neoplasms and acute leukemia. Blood 2016; 127: 2391–2405. [DOI] [PubMed] [Google Scholar]
- 25.Veterans Affairs Total Parenteral Nutrition Cooperative Study Group. Perioperative Total Parenteral Nutrition in Surgical Patients. N Engl J Med 1991; 325: 525–532. [DOI] [PubMed] [Google Scholar]
- 26.Buzby GP, Knox LS, Crosby LO, Eisenberg JM, Haakenson CM, McNeal GE et al. Study protocol: a randomized clinical trial of total parenteral nutrition in malnourished surgical patients. Am J Clin Nutr 1988; 47: 366–381. [DOI] [PubMed] [Google Scholar]
- 27.Bouillanne O, Morineau G, Dupont C, Coulombel I, Vincent J-P, Nicolis I et al. Geriatric Nutritional Risk Index: a new index for evaluating at-risk elderly medical patients. Am J Clin Nutr 2005; 82: 777–783. [DOI] [PubMed] [Google Scholar]
- 28.Grimwade D, Hills RK, Moorman AV, Walker H, Chatters S, Goldstone AH et al. Refinement of cytogenetic classification in acute myeloid leukemia: determination of prognostic significance of rare recurring chromosomal abnormalities among 5876 younger adult patients treated in the United Kingdom Medical Research Council trials. Blood 2010; 116: 354–365. [DOI] [PubMed] [Google Scholar]
- 29.Breems DA, Van Putten WLJ, De Greef GE, Van Zelderen-Bhola SL, Gerssen-Schoorl KBJ, Mellink CHM et al. Monosomal Karyotype in Acute Myeloid Leukemia: A Better Indicator of Poor Prognosis Than a Complex Karyotype. J Clin Oncol 2008; 26: 4791–4797. [DOI] [PubMed] [Google Scholar]
- 30.Paras G, Morsink LM, Othus M, Milano F, Sandmaier BM, Zarling LC et al. Conditioning intensity and peritransplant flow cytometric MRD dynamics in adult AML. Blood 2022; 139: 1694–1706. [DOI] [PMC free article] [PubMed] [Google Scholar]
- 31.Morsink LM, Sandmaier BM, Othus M, Palmieri R, Granot N, Bezerra ED et al. Conditioning Intensity, Pre-Transplant Flow Cytometric Measurable Residual Disease, and Outcome in Adults with Acute Myeloid Leukemia Undergoing Allogeneic Hematopoietic Cell Transplantation. Cancers 2020; 12: 2339. [DOI] [PMC free article] [PubMed] [Google Scholar]
- 32.Sorror ML, Maris MB, Storb R, Baron F, Sandmaier BM, Maloney DG et al. Hematopoietic cell transplantation (HCT)-specific comorbidity index: a new tool for risk assessment before allogeneic HCT. Blood 2005; 106: 2912–2919. [DOI] [PMC free article] [PubMed] [Google Scholar]
- 33.Walter RB, Othus M, Borthakur G, Ravandi F, Cortes JE, Pierce SA et al. Prediction of Early Death After Induction Therapy for Newly Diagnosed Acute Myeloid Leukemia With Pretreatment Risk Scores: A Novel Paradigm for Treatment Assignment. J Clin Oncol 2011; 29: 4417–4424. [DOI] [PMC free article] [PubMed] [Google Scholar]
- 34.Döhner H, Estey E, Grimwade D, Amadori S, Appelbaum FR, Büchner T et al. Diagnosis and management of AML in adults: 2017 ELN recommendations from an international expert panel. Blood 2017; 129: 424–447. [DOI] [PMC free article] [PubMed] [Google Scholar]
- 35.Fuji S, Takano K, Mori T, Eto T, Taniguchi S, Ohashi K et al. Impact of pretransplant body mass index on the clinical outcome after allogeneic hematopoietic SCT. Bone Marrow Transplant 2014; 49: 1505–1512. [DOI] [PubMed] [Google Scholar]
- 36.Radujkovic A, Becker N, Benner A, Penack O, Platzbecker U, Stölzel F et al. Pre-transplant weight loss predicts inferior outcome after allogeneic stem cell transplantation in patients with myelodysplastic syndrome. Oncotarget 2015; 6: 35095–35106. [DOI] [PMC free article] [PubMed] [Google Scholar]
- 37.Doney K, McMillen K, Buono L, Deeg HJ, Gooley T. Impact of Body Mass Index on Outcomes of Hematopoietic Stem Cell Transplantation in Adults. Biol Blood Marrow Transplant 2019; 25: 613–620. [DOI] [PubMed] [Google Scholar]
- 38.Nakao M, Chihara D, Niimi A, Ueda R, Tanaka H, Morishima Y et al. Impact of being overweight on outcomes of hematopoietic SCT: a meta-analysis. Bone Marrow Transplant 2014; 49: 66–72. [DOI] [PubMed] [Google Scholar]
- 39.Vaughn JE, Storer BE, Armand P, Raimondi R, Gibson C, Rambaldi A et al. Design and Validation of an Augmented Hematopoietic Cell Transplantation-Comorbidity Index Comprising Pretransplant Ferritin, Albumin, and Platelet Count for Prediction of Outcomes after Allogeneic Transplantation. Biol Blood Marrow Transplant 2015; 21: 1418–1424. [DOI] [PMC free article] [PubMed] [Google Scholar]
- 40.Artz AS, Logan B, Zhu X, Akpek G, Bufarull RM, Gupta V et al. The prognostic value of serum C-reactive protein, ferritin, and albumin prior to allogeneic transplantation for acute myeloid leukemia and myelodysplastic syndromes. Haematologica 2016; 101: 1426–1433. [DOI] [PMC free article] [PubMed] [Google Scholar]
- 41.Chee L, Tacey M, Lim B, Lim A, Szer J, Ritchie D. Pre-transplant ferritin, albumin and haemoglobin are predictive of survival outcome independent of disease risk index following allogeneic stem cell transplantation. Bone Marrow Transplant 2017; 52: 870–877. [DOI] [PubMed] [Google Scholar]
- 42.Shouval R, de Jong CN, Fein J, Broers AEC, Danylesko I, Shimoni A et al. Baseline Renal Function and Albumin are Powerful Predictors for Allogeneic Transplantation-Related Mortality. Biol Blood Marrow Transplant 2018; 24: 1685–1691. [DOI] [PubMed] [Google Scholar]
- 43.Schaffrath J, Diederichs T, Unverzagt S, Wass M, Gläser U, Weber T et al. Correlation of nutrition-associated parameters with non-relapse mortality in allogeneic hematopoietic stem cell transplantation. Ann Hematol 2022; 101: 681–691. [DOI] [PMC free article] [PubMed] [Google Scholar]
- 44.Evans DC, Corkins MR, Malone A, Miller S, Mogensen KM, Guenter P et al. The Use of Visceral Proteins as Nutrition Markers: An ASPEN Position Paper. Nutr Clin Pract Off Publ Am Soc Parenter Enter Nutr 2021; 36: 22–28. [DOI] [PubMed] [Google Scholar]
Associated Data
This section collects any data citations, data availability statements, or supplementary materials included in this article.