

Abstract
Cancer is one of the main causes of death in humans worldwide, the development of more effective anticancer drugs that can inhibit the malignant progression of cancer cells is of great significance. Aiphanol is a natural product identified from the seeds of Arecaceae and the rhizome of Smilax glabra Roxb. Our preliminary studies revealed that it had potential antiangiogenic and antilymphangiogenic activity by directly targeting VEGFR2/3 and COX2 in endothelial cells. However, the influence of aiphanol on cancer cells per se remains largely undefined. In this study, the effects and related mechanisms of aiphanol on cancer growth and metastasis were evaluated in vitro and in vivo. Acute toxicity assay and pharmacokinetic analysis were utilized to investigate the safety profile and metabolism characteristics of aiphanol. We revealed that aiphanol inhibited the proliferation of various types of cancer cells and the growth of xenograft tumors in mice and zebrafish models. The possible mechanism was associated with the inactivation of multiple kinases, including FAK, AKT and ERK, and the upregulation of BAX and cleaved caspase-3 to promote cancer cell apoptosis. Aiphanol significantly inhibited cancer cell migration and invasion, which was related to the inhibition of epithelial-mesenchymal transition (EMT) and F-actin aggregation. Aiphanol effectively attenuated the metastasis of several types of cancer cells in vivo. In addition, aiphanol exerted no significant toxicity and had fast metabolism. Collectively, we demonstrated the anticancer effects of aiphanol and suggested that aiphanol has potential as a safe and effective therapeutic agent to treat cancer.
Keywords: Aiphanol, anticancer growth and metastasis, apoptosis, EMT, kinase
Introduction
Global cancer statistics display an estimated 19.3 million new cancer cases, and nearly 10.0 million cancer deaths occurred in 2020 [1]. Despite massive endeavors to improve therapeutic interventions, the 5-year survival rate for certain types of cancers has not gained momentum.
The high degree of mortality related to cancer is largely owing to the inadequate efficacy of current treatments and severe adverse effects. This plight has encouraged growing research to focus on the development of multi-targeting drugs, because multi-targeting inhibitors are capable of solving limited therapeutic benefits and poor safety of single-targeting inhibitors in the face of cancer complexity and heterogeneity [2].
In the past few years, many multi-targeting anticancer drugs have been recognized from natural compounds. For instance, ruscogenin significantly decreased the expression of MMP2, MMP9, VEGF, uPA and HIF-1α to suppress hepatocellular carcinoma metastasis [3]. Plumbagin restrained the growth of cancer cells through the PI3K/AKT/mTOR pathways and the motility of cancer cells by EMT inhibition, and promoted ROS generation to cause cell apoptosis [4]. Aiphanol, (chemical name 5-((E)-2-((2S,3S)-3-(4-hydroxy-3,5-dimethoxyphenyl)-2-(hydroxymethyl)-2,3-dihydrobenzo[b][1,4]dioxin-6-yl)vinyl)benzene-1,3-diol)), is a naturally cyclooxygenase-1 and -2-inhibitory stilbenolignan originally isolated from Arecaceae [5]. We also identified aiphanol from the herbal medicine Smilax glabra Roxb [6], and further demonstrated that it inhibited angiogenesis via dual-targeting VEGFR2 and COX2, thus reducing cancer growth [7]. In addition, aiphanol suppressed lymphangiogenesis and lymphatic metastasis by blunting VEGFR3 activity and blocking COX2-PGE2-VEGF-C and COX2-PGE2-MMP2/9 signaling axes [8]. Nevertheless, the relationship between aiphanol and cancer cells per se has not been elucidated.
Kinases are important elements of cancer cellular signaling networks. Intensive studies have revealed that focal adhesion kinase (FAK), protein kinase B (AKT) and extracellular signal-regulated kinase (ERK) play essential roles in governing growth, differentiation, apoptosis, and metastasis in many types of cancer cell lines [9,10]. For instance, pectolinarigenin significantly inhibited viability and motility, and induced apoptosis and G2/M phase arrest in hepatocellular carcinoma cell lines by downregulating the PI3K/AKT/mTOR/ERK pathway [11]. We found that aiphanol inhibited growth factor-induced phosphorylation of VEGFR/FAK/AKT/ERK signaling, while VEGFR2 or VEGFR3 is mainly expressed in vascular endothelial cells or lymphatic endothelial cells, rarely in cancer cells. The direct effect of aiphanol on FAK, AKT and ERK kinase activity remains to be determined.
Presently, most anticancer drugs achieve anticancer growth potential by triggering cancer cell apoptosis, cell cycle blockade, autophagy and/or other types of cell death. Apoptosis is a type of programmed cell death process, which is divided into the intrinsic pathway (i.e., mitochondrial pathway) and the extrinsic pathway [12]. The proapoptotic protein BAX is a crucial regulator of mitochondrial apoptosis. Upon apoptotic stimuli, for example, therapeutic agents, BAX is activated and oligomerizes to form pores on the mitochondrial outer membrane, and initiates downstream caspase cascades that mediate the cleavage of target proteins and ultimately cell death [13]. Therefore, the development of BAX agonists as novel anticancer drugs to trigger apoptosis, is regarded as an effective therapeutic approach for cancer.
Regional and distal disseminations of cancer cells are closely related to poor prognosis and mortality. EMT is regarded as a critical process for the initiation of dramatic cellular movements. Cancer cells can restart EMT program, which decreases intercellular adhesion and increases motility [14]. Therefore, inhibiting or reversing EMT is a promising method of controlling the dissemination of various cancers. For example, kaempferol effectively inhibited the protein expression of EMT to prevent the metastatic behavior of breast cancer [15]. Quercetin antagonized EMT by upregulating TGF-β1, N-Cadherin and Vimentin levels and downregulating E-Cadherin expression, which inhibited pancreatic cancer cell migration and invasion [16]. We have already reported that aiphanol can inhibit the invasion of 4T1 mouse breast cancer cells [8]. However, whether aiphanol is able to inhibit the motility of human cancer cells and, if so, whether it is related to EMT or other mechanisms has remained unexplored.
In the present study, the direct effects of aiphanol treatment on human cancer cells were examined, and the underlying mechanisms were investigated. Our results illustrated that aiphanol could be a promising and safe multi-targeting inhibitor for cancer treatment.
Material and methods
Chemical reagent
Aiphanol and biotin-aiphanol were synthesized by Huatian Inc. (Chengdu, China) and Professor Jia Yanxing’s laboratory at the School of Pharmaceutical Sciences, Peking University, with purity greater than 99.9% by high-performance liquid chromatography (HPLC). 3-Methyladenine (3-MA), N-acetylcysteine (NAC) and phalloidin, fluorescein isothiocyanate labeled (Phalloidin-FITC) were purchased from Sigma-Aldrich (St. Louis, USA). 5,5’,6,6’-Tetrachloro-1,1’,3,3’-tetraethyl-imidacarbocyanine iodide (JC-1), Fluo-4 AM, DCFH-DA and 4’,6-diamidino-2-phenylindole dihydrochloride (DAPI) were obtained from Beyotime (Shanghai, China). Taxol (with purity ≥ 98%) was purchased from Solarbio (Beijing, China). 5-FU was purchased from Aladdin (Shanghai, China). Cell Counting Kit-8 (CCK-8) was obtained from Dojindo Laboratories (Kumamoto, Japan). Z-VAD-FMK (with a purity of 99.79%) was purchased from Selleck (Houston, USA). BIPV5 (with a purity of 98.12%) was purchased from MedChemExpress (Monmouth Junction, USA). The cell cycle and apoptosis detection kit was from Gene-Protein Link (Beijing, China).
Antibodies
Anti-AKT (#4691), anti-BAX (#5023), anti-caspase3 (#9668), anti-COX2 (#12282), anti-phospho-AKT (Ser473) (#4060), anti-ERK (#4696), anti-FAK (#71433), anti-LC3 (#3868), anti-MMP2 (#40994), anti-PARP (#9532), anti-phospho-ERK (Tyr202/Tyr204) (#4370), antiphospho-EGFR (Tyr1068) (#3777), anti-VEGFR2 (#2479), anti-VEGFR3 (#33566), anti-SIRT1 (#8469), Alexa Fluor 488-conjugated secondary antibody (#8494) and the EMT antibody sampler kit were purchased from Cell Signaling Technology (Danvers, USA). Anti-VEGFR1 (TA303515) was purchased from OriGene (Rockville, USA). Anti-Beclin 1 (MAB5295) was from R&D Systems (Minnesota, USA). Anti-phosphotyrosine and anti-phosphoserine/threonine were obtained from BD. Anti-MMP9 (10375-2-AP) was from Proteintech (Rosemont, USA). Anti-phospho-FAK (Tyr397) (sc-11765-R) and anti-phospho-NFκB p65 (Ser536) (sc-33020) were purchased from Santa Cruz (Dallas, USA). Anti-VRK1 (ab171933) and anti-TOPK (ab236872) were obtained from Abcam (Cambridge, UK). Anti-GAPDH and horseradish peroxidase (HRP)-labeled secondary antibodies were obtained from ZSGB (Beijing, China).
Cells and animals
Cells were cultured in 5% CO2 at 37°C. Reagents for culture were obtained from Thermo Fisher Scientific (Madison, USA). All cells used in the study were listed in Table 1.
Table 1.
All cells used in the study
| Types | Cell lines | Source | Culture condition |
|---|---|---|---|
| Gastric cancer | AGS | ATCC | RPMI-1640+10% FBS |
| Lung cancer | PG | Gifted by Dr. Zhang Zhiqian (Peking University) | RPMI-1640+10% FBS |
| A549 | ATCC | RPMI-1640+10% FBS | |
| H1299 | ATCC | RPMI-1640+10% FBS | |
| GLC-82 | ATCC | RPMI-1640+10% FBS | |
| Colon cancer | LoVo | ATCC | RPMI-1640+10% FBS |
| SW620 | ATCC | RPMI-1640+10% FBS | |
| HCT116 | ATCC | RPMI-1640+10% FBS | |
| HT29 | ATCC | RPMI-1640+10% FBS | |
| DLD1 | ATCC | RPMI-1640+10% FBS | |
| SW480 | ATCC | RPMI-1640+10% FBS | |
| MC38 | ATCC | RPMI-1640+10% FBS | |
| Liver cancer | SMMC-7221 | ATCC | RPMI-1640+10% FBS |
| BEL-7402 | ATCC | RPMI-1640+10% FBS | |
| HepG2 | ATCC | DMEM+10% FBS | |
| Bladder cancer | T24 | ATCC | RPMI-1640+10% FBS |
| EJ | ATCC | RPMI-1640+10% FBS | |
| Pancreatic cancer | PANC1 | Provided by Dr. Zhao Xiaohang (Chinese Academy of Medical Sciences and Peking Union Medical College) | DMEM+10% FBS |
| SW1990 | DMEM+10% FBS | ||
| Esophagus cancer | EC9706 | ATCC | RPMI-1640+10% FBS |
| KYSE70 | Gifted by Dr. Liu Zhihua (Chinese Academy of Medical Sciences and Peking Union Medical College) | RPMI-1640+10% FBS | |
| Breast cancer | MCF7 | ATCC | RPMI-1640+10% FBS |
| BICR | ATCC | RPMI-1640+10% FBS | |
| MDA-MB-231 | ATCC | RPMI-1640+10% FBS | |
| 4T1 | ATCC | RPMI-1640+10% FBS | |
| Nasopharyngeal cancer | CNE | Provided by Dr. Wang naijing (Peking University) | RPMI-1640+10% FBS |
| Cervical cancer | HeLa | ATCC | RPMI-1640+10% FBS |
| Blood vessel | HUVEC | Umbilical cord | EGM-2 BulletKit |
| HMEC | ATCC | DMEM+10% FBS | |
| Lymphatic vessel | HDLEC | Gifted by Dr. Xing Rui (Peking University) | DMEM+10% FBS |
Zebrafish models were assessed by Hunter Biotechnology Corporation (Hangzhou, China). All mice were purchased from HFK Bioscience (Beijing, China) and raised by the Experimental Animal Facility of Peking University Cancer Institute. All animal experiments were approved by the Ethics Committee of Peking University Cancer Hospital & Institute (license number: Animal-2012-01). All experimental procedures involving mice were carried out in line with the guidelines of the animal welfare institution (NIH #85-23).
Cell viability
Cells were seeded at 1,500 cells per well in 96-well plates, and then treated with vehicle or the indicated chemicals for different times. 10 μL Cell Counting Kit-8 (CCK-8) was added to each well for 1 h. The optical density (OD) was measured at a wavelength of 450 nm under a microplate reader (Bio-Rad, Hercules, USA). Alternatively, cell confluence rates were evaluated by a CloneSelect Imager (Molecular Devices, San Jose, USA) every 24 h.
Cell-cycle distribution analysis
Cells were cultured in 6-well plates and collected after treatment with 30 µM aiphanol for 24 h. The cells were collected by trypsinization and stained with the PI mixture following immobilization in 75% ethanol overnight at 4°C. The cell-cycle distribution was measured by flow cytometry and the profile was analyzed with ModFit LT 3.0 (Verity Software House Inc.).
Autophagy analysis by fluorescence
HT-29 and HCT116 cells were seeded onto glass coverslips in a 24-well culture plate. After treatment with 30 μM Aiphanol with or without 250 μM 3-MA for 24 h, cells were fixed with 4% paraformaldehyde for 10 min, incubated with anti-LC3 primary antibody overnight and then probed with Alexa Fluor 488-conjugated secondary antibody. DAPI (1 μg/mL) was used to stain the nuclei. The cells were observed and analyzed under the LSM780 confocal microscope (Zeiss, Oberkochen, Germany).
FITC-Annexin-V/PI staining
Cells were cultured in 12-well plates, harvested after treatment with indicated aiphanol for 24 h, and then stained with Annexin V-FITC and PI according to the manufacturer’s protocol. Apoptotic cells were analyzed by flow cytometry.
Measurement of reactive oxygen species (ROS) generation
Cells were seeded into 6-well plates and treated with a range of aiphanol or 5 mM NAC for 24 h. The cells were washed once with PBS and stained with 5 µg/ml DCF-DA in serum-free medium for 30 min. ROS generation was analyzed using the LSM780 confocal microscope.
Assays for intracellular [Ca2+] ([Ca2+]i) and mitochondrial membrane potential (ΔΨm)
For [Ca2+]i measurement, cells were stained with 1 μM Fluo-4 AM for 30 min, washed three times with PBS and detected via the LSM780 confocal microscope. To measure ΔΨm, cells were probed with 10 μg/mL JC-1 at 37°C for 20 min, and the fluorescence was recorded by fluorescence microscopy. JC-1 red fluorescence represents energized mitochondrial membrane potential, whereas JC-1 green fluorescence indicates lower membrane potential.
Cell-ELISA
The cells were treated with 30 μM aiphanol for the indicated time, fixed in 2.5% glutaraldehyde and blocked in 5% slim milk for 1 h. The cells were incubated with anti-phosphoserine/threonine or anti-phosphotyrosine antibody for 2 h. After washing thrice with TBST, HRP-conjugated anti-mouse-IgG was added to the wells for 1 h. The plates were incubated with 3,3’,5,5’-Tetramethylbenzidine (TMB) solution (Cloud-Clone Corp, Wuhan, China), and 12.5% H2SO4 was allowed to stop the reaction. The optical density at 450 nm was measured under a microplate reader.
Wound healing assay
Cells were seeded in 6-well plates and cultured to full confluence. Two parallel lines were drawn on the cell surface with sterile pipette tips. Cells were washed twice with PBS and cultured in 0.5% FBS/RPMI 1640 medium with or without different concentrations of aiphanol. Images of wound closure at the indicated time points were captured with a Nikon TiU microscope (Nikon, Tokyo, Japan) and quantified using Nikon software.
Transwell migration and invasion assay
For the migration assay, 200 μL of cell suspension and the indicated aiphanol were added to the upper well of the Corning Transwell insert (NY, USA) at a density of 4 × 10⁴ (for LoVo cells) or 2 × 10⁴ (for SW620 cells) per well. For the invasion assay, Corning BioCoat Matrigel Invasion Chambers were filled with 500 μL serum-free medium for 2 h to hydrate in humidified culture incubator. Then, 500 μL of cell suspension and indicated aiphanol were seeded into the upper well of the Corning BioCoat Matrigel Invasion Chambers at a density of 1 × 10⁵ (for LoVo cells) or 4 × 10⁴ (for SW620 cells). These chambers were transferred into the upper chamber of each well of 24-well plates, where the lower well was filled with 800 μL medium containing 10% FBS. After 24 h, the chambers were fixed with ice-cold methanol and stained with 0.1% crystal violet for 30 min. Then, the cells in the top surface of each membrane were removed and the cells penetrated into bottom side of the membrane were calculated in 6 randomly selected microscopic fields.
Immunofluorescence staining
Cells were cultured on sterile slides and treated with the indicated chemicals. The cells were fixed with 4% paraformaldehyde for 20 min and permeabilized with 0.1% Triton X-100 for 5 min. After two additional washing steps with PBS, nuclei were stained with DAPI before capturing pictures through the LSM780 confocal microscope.
Western blot
Cells were collected in lysis buffer containing 50 mM Tris-HCl pH 7.4, 150 mM NaCl, 1% SDS, 2 mM EDTA, 1% NP-40, 10% glycerol, 2 mM dithiothreitol (DTT) and 1 × protease inhibitor cocktail for 30 min on ice. The protein concentration was determined using a Thermo Fisher Scientific BCA kit. Samples (30 μg per lane) were separated by 8%-12% SDS-PAGE, electrotransferred to nitrocellulose membranes and blocked with 5% skim milk in 0.1% Tween 20/TBS (TBST). The membranes were incubated with the indicated primary antibodies overnight at 4°C, and then reprobed with HRP-conjugated secondary antibodies for 1 h at room temperature (RT). Signals were detected by an Enhanced Chemiluminescence Detection Kit-HRP (Biological Industrials, Israel).
Small interfering RNA (siRNA) interference assay
SiRNA and RNAi-Mate were synthesized by GenePharma (Suzhou, China). The siRNA sequences were as follows: small interfering negative control (siNC) sequence: 5’-UUCUCCGAACGUGUCACGUTT-3’. Human COX2 siRNA 5’-GCAGCUUCCUGAUUCAAAUTT-3’. Human VRK1 siRNA 5’-GAAAGAGAGTCCAGAAGTATT-3’. Human TOPK siRNA 5’-CUUCUCUGUAUGCACUAAUTT-3’. Human SIRT1 siRNA 5’-CCCUGUAAAGCUUUCAGAATT-3’. Cells were seeded on 6-well plates and transfected with 35 nM siRNA plus RNAi-Mate for 48 h.
Coupling surface plasmon resonance and high performance liquid chromatography-mass spectrometry to identify ligands
HT29, HCT116 and SW480 cells were collected and homogenized in lysis buffer containing 100 mM Tris-HCl (pH 7.0), 150 mM NaCl, 20 mM NaF, 1 mM Na3VO4, 2 mM EDTA, and 1 × protease inhibitor cocktail. Protein concentration was quantified by a BCA Protein Assay Kit (Thermo Fisher Scientific, Tewksbury, MA, USA). The small molecule sample, negative control, and positive control were overlaid on the 3D photocrosslinking sensor chip. The chip was placed in a 365 nm UV crosslinker for the photocrosslinking reaction, and washed with N,N-dimethylformamide, 100% ethanol and ultrapure water in sequence for 15 min each. The chip was assembled into a FlowCell flow path and labeled after drying with nitrogen. The chip was installed on the PlexArrayUT device and regenerated 3 times after adjusting the test baseline. The chip surface was blocked with 100 μg/mL BSA. The sample injection step was started, during which the target protein capture progress was monitored by the resonance unit intensity and the chip surface scan. Targeted proteins captured by aiphanol on the chip were enzymolyzed in-situ, freeze-dried into peptide solid powder, and separated by liquid chromatography. The peptides were analyzed using reversed-phase nanoscale liquid chromatography. Full-scan mass spectrometry (MS) scans with Orbitrap, High-energy collisional dissociation shattered the precursor ions that met the tandem (MS/MS) fragmentation conditions and scanned with the Orbitrap. MS data were collected by Xcalibur software and retrieved by the Mascot algorithm using Proteome Discoverer analysis software on the UniProtKB/Swiss-Prot protein database. A bait database containing all protein reverse sequences was added to the database to reduce false positive results. The Percolator algorithm was used to control the false positive rate of peptides to less than 1%. Bioinformatics analysis and data integration were performed to annotate the function of targeted proteins.
Tumor xenograft and metastasis models in zebrafish
For the tumor growth study, CM-Dil-labeled HCT116 and HT29 cells were microinjected into the yolk sac of 2 days postfertilization (dpf) wild type AB zebrafish (200 cells per tail). Tails of tumors growing well were selected and randomly assigned to 5 groups (30 tails/group), including the control group, aiphanol group (1.5, 5 and 15 μM) and 5-FU (1 mM) group. Each group was cultured for 2 d after exposure to the indicated agents and photographed under a multipurpose zoom microscope system (Nikon, Tokyo, Japan). The sum of the fluorescence intensity of xenograft tumors in zebrafish was calculated with Nikon NIS-Elements D 3.10 Advanced image processing software.
In the metastasis study, CM-Dil-tagged MDA-MB-231 cells were microinjected into the yolk sac of 2 dpf wild type AB zebrafish (800 cells per tail), and zebrafish were continuously cultured to 3 dpf. Fish embryos underwent selection under fluorescence to ensure consistency of tumor transplantation. Then, zebrafish (30 tails/group) were exposed to different doses of aiphanol (1.5, 5 and 15 μM) by dissolving in culture solution. Taxol, as a positive control drug, was delivered to zebrafish intravenously at 2.5 ng/tail. After 3 days, zebrafish embryos were used to evaluate cancer cell dissemination. Fluorescence intensity proportional to the number of cancer cells that had migrated away from the yolk sac to the tail of zebrafish was measured with the Nikon NIS-Elements D 3.10 Advanced image processing software.
Tumor xenograft and pneumonic metastasis models in mice
For the tumor growth study, 7-8 weeks old female BALB/c nude mice were housed under specific pathogen-free conditions. A total of 5 × 10⁵ HCT116 cells or 5 × 10⁶ HT29 cells were subcutaneously injected into the right armpit region of mice. After the tumor reached approximately 100 mm3 in size, the mice were grouped randomly and orally administered with or without different doses of aiphanol daily. CTX (80 mg/kg/7 d) was used as the positive control. The body weights and tumor volumes of the mice were monitored twice a week. After 12 days (for HCT116) or 14 days (for HT29), the mice were sacrificed, and tumor weights were measured.
In the metastasis assay, 7-8 weeks old female BALB/c nude mice were injected with 5 × 10⁵ LoVo cells or 1 × 10⁶ B16 cells via the tail vein. The next day, mice (n = 6 for each group) were randomly divided into different groups, and the indicated concentrations of aiphanol were delivered daily by oral administration for 2 weeks. After drug withdrawal, mice (for B16) were sacrificed for lung collection, or mice (for LoVo) were observed for another 12 weeks before being sacrificed for lung collection. The numbers of cancer nodules in the lung were calculated, and the metastatic foci were confirmed by hematoxylin and eosin (HE) staining.
Acute toxicity assay
7-8 weeks old female BALB/c mice were randomly allocated into four groups as follows: the control group (n = 3); aiphanol-300 mg/kg group (n = 3); aiphanol-600 mg/kg group (n = 4); aiphanol-900 mg/kg group (n = 4). Aiphanol was dissolved in the solvent (10% DMSO, 40% PEG300, 3% Tween-80 and 47% saline), and the mice received a single oral administration. Then, the mice were monitored for signs of death, body weight, and behavioral abnormalities for 14 days. At the end of the observation period, the mice were fasted overnight and sacrificed. Blood samples were harvested and serum was separated by centrifugation at 825 g for 20 min to determine analytical targets. Heart, liver, spleen, lung and kidney tissues were subjected to HE staining for microscopic examination.
Biochemical analysis of blood
Serums of the mice in the acute toxicity assay were detected using a BS-350E biochemistry analyzer (Mindray Medical, Shenzhen, China). The biochemistry of blood items, including alanine transferase (ALT), aspartate transferase (AST), creatinine (CREA) and triglyceride (TG), were analyzed with the corresponding assay kit (IFCC method) supplied by Mindray Medical.
Analysis of aiphanol pharmacokinetics in rats
Aiphanol was prepared at 1 mg/mL in working solution (10% DMSO+1% PEG300+89% PBS). 6-7 weeks old male SD rats were administered aiphanol intravenously (5 mg/kg, n = 3). Blood samples from the vein canthus prior to dosing (0) and 5, 15, 30, 60, 120, 240, 360, 480, and 1440 min after aiphanol administration were collected in heparin sodium anticoagulation tubes and maintained on ice within 2 h. Plasma was kept after centrifuging at 8000 rpm for 5 min at 4°C. 50 µL internal standard working solution (10 ng/mL propranolol) and 50 µL methanol were added to 50 µL plasma sample, the tubes were vortexed, and centrifuged at 3040 g for 10 min at 4°C. Then, 150 µL supernatant was taken and mixed with 150 µL of methanol fully before centrifuging at 3040 g for 10 min at 4°C. 5 µL supernatant was taken for liquid chromatography-tandem mass spectrometry (LC-MS/MS) analysis. The pharmacokinetic parameters, including time to reach peak plasma concentration (Tmax), maximum plasma concentration (Cmax), and the curve of plasma concentration time (AUC(0-t)) were calculated by the statistical moment method in DAS 3.2.8 software.
Statistical analysis
GraphPad Prism 8.0 software was utilized to perform the two-tailed Student’s t test and ANOVA analysis. Values are shown as the means ± standard error of the mean (SEM). A P value of less than 0.05 was considered statistically significant. *P < 0.05; **P < 0.01; ***P < 0.001; n.s., no significance.
Results
Aiphanol has anticancer capacity in vitro
To investigate the cytotoxicity of aiphanol on different cancer cells and stromal cells, 30 cell lines representing diverse organ derivations (including colon, breast, lung, pancreas, esophagus, stomach, liver, nasopharynx, bladder, cervix, blood vessel and lymphatic vessel) were exposed to different concentrations of aiphanol for 24 h, 48 h and 72 h. The cell viability was determined with the CCK-8 method, and the IC50 value was calculated (Table 2). The results showed that aiphanol had various degrees of inhibitory effects on the proliferation of cells. Among these cell lines, colon cancer cells HCT116 and HT29 were more sensitive to aiphanol. Plate colony formation assay (Figure 1A) and soft agar formation assay (Figure 1B) showed that aiphanol dose-dependently antagonized the tumorigenic potential of colon cancer cells.
Table 2.
Determination of aiphanol IC50 in different tumor cells and stromal cells
| Types | IC50 (μM) | 24 h | 48 h | 72 h |
|---|---|---|---|---|
| Gastric cancer | AGS | 78.83 | 46.81 | 33.32 |
| Lung cancer | PG | 223.2 | 35.28 | 20.66 |
| A549 | 53.8 | 27.55 | 23.19 | |
| H1299 | 198.58 | 93.03 | 62 | |
| GLC-82 | 204.33 | 160.1 | 41.29 | |
| Colon cancer | LoVo | 192.6 | 85.91 | 34.18 |
| SW620 | 58.28 | 29.94 | 23.25 | |
| HCT116 | 49.35 | 24.63 | 16.54 | |
| HT29 | 53.13 | 15.93 | 8.34 | |
| DLD1 | 209 | 31 | 25.02 | |
| SW480 | 154.21 | 76.17 | 37.47 | |
| MC38 | 195.54 | 123.6 | 83.19 | |
| Liver cancer | SMMC-7221 | 93.45 | 66.48 | 41.54 |
| BEL-7402 | 74.77 | 28.21 | 23.89 | |
| HepG2 | 97.44 | 49.71 | 31.35 | |
| Bladder cancer | T24 | 92.88 | 30.27 | 20.39 |
| EJ | 51.01 | 29.81 | 17.09 | |
| Pancreatic cancer | PANC1 | 103.56 | 75 | 33.96 |
| SW1990 | 92.45 | 50 | 41.27 | |
| Esophagus cancer | EC9706 | 46.47 | 25.66 | 23.37 |
| KYSE70 | 140 | 39.9 | 23.86 | |
| Breast cancer | MCF7 | 97.28 | 55.59 | 35.46 |
| BICR | 43.06 | 27.91 | 18.17 | |
| MDA-MB-231 | 48.8 | 29.73 | 18.45 | |
| 4T1 | 173.11 | 152.44 | 93.89 | |
| Nasopharyngeal cancer | CNE | 49.78 | 36.52 | 32.1 |
| Cervical cancer | HeLa | 89.86 | 41.27 | 37.38 |
| Blood vessel | HUVEC | 89.57 | 54.95 | 39.88 |
| HMEC | 92.73 | 55.72 | 34.98 | |
| Lymphatic vessel | HDLEC | 94.55 | 42.71 | 31.6 |
Figure 1.

Aiphanol inhibits cancer cell growth in vitro. A. Plate colony formation abilities of HCT116, HT29, LoVo and SW480 cells after treatment with different concentrations of aiphanol (0, 7.5, 15 and 30 µM) for 14 d. B. The soft agar colony formation assay was used to determine the anchorage-independent growth abilities of HCT116, HT29, LoVo and SW480 cells upon aiphanol treatment (0, 7.5, 15 and 30 µM) for 14 d. Scale bar, 100 μm. Data represent as mean ± SEM. *P < 0.05; **P < 0.01; ***P < 0.001.
Apoptosis partially contributes to the antiproliferative effects of aiphanol
Inhibition of proliferation can be triggered by multiple modes, such as cell cycle arrest, autophagy and apoptosis [17]. Aiphanol treatment caused the accumulation of HCT116 and HT29 cells in G2/M phase (Figure 2A). In addition, aiphanol increased the levels of Beclin 1 and LC3-II in HCT116 and HT29 cells (Figure 2B). The autophagy inhibitor 3MA obviously decreased the percentage of LC3-positive cells induced by aiphanol (Figure 2C), but 3MA or chloroquine (CQ), another autophagy inhibitor, failed to counteract aiphanol-inhibited proliferation (Figure 2D, 2E), indicating that autophagy might not be the key determinant of aiphanol’s antiproliferative potency.
Figure 2.

Aiphanol induces cell cycle arrest and autophagy, and autophagy inhibitors failed to reverse the inhibitory effect of aiphanol on cell proliferation. (A) Cell cycle analysis of HCT116 and HT29 cells after treatment with the indicated aiphanol for 24 h. (B) HCT116 and HT29 cells were administered the indicated aiphanol for 24 h. Western blot was used to assess the levels of proteins. (C) HCT116 and HT29 cells were treated with 30 μM Aiphanol alone or in combination with 500 μM 3-MA for 24 h, the expression of LC3 (green) and DAPI (blue) was detected by immunofluorescence assay, and the LC3 dots were quantified. The white arrow indicated the LC3 protein; scale bar, 100 μm. (D, E) HCT116 and HT29 cells were treated with aiphanol and different doses of 3-MA (D) or chloroquine (CQ) (E) for the indicated time, and the cell confluence rate was evaluated every 24 h by the CloneSelect Imager (n = 4 per group). Data represent the mean ± SEM. ***P < 0.001.
The proportion of apoptotic cells was augmented in HCT116 and HT29 cells after aiphanol treatment at different doses for 24 h (Figure 3A). Similar to flow cytometric analysis, aiphanol increased the levels of proapoptotic factors, including BAX, cleaved caspase-9, cleaved caspase-3, and cleaved PARP, in a time- and dose-dependent fashion (Figure 3B). We further confirmed that Z-VAD-FMK, an inhibitor of caspases, partially reversed the proapoptotic function of aiphanol (Figure 3C). BAX is one of the core regulators of apoptosis in health and diseases [18]. We applied the BAX inhibitor BIPV5, and found that aiphanol-induced apoptosis level was decreased by BIPV5 (Figure 3D). Consistently, both Z-VAD-FMK and BIPV5 antagonized the enhancement of caspase-9 and caspase-3 cleavage by aiphanol (Figure 3E). More importantly, Z-VAD-FMK partially mitigated the inhibition of aiphanol on the proliferation of HT29 cells (Figure 3F). These results indicated that aiphanol-inhibited proliferation was partly related to apoptosis induction.
Figure 3.

Aiphanol promotes apoptosis, and apoptosis inhibitors partially alleviate the proapoptotic and antiproliferative effects of aiphanol. (A) HCT116 and HT29 cells after aiphanol treatment were used for flow cytometric analysis to assess the percentage of apoptosis. (B) Western blot was performed to assess the levels of the indicated proteins in HCT116 and HT29 cells following treatment with different concentrations of aiphanol for 24 h and 48 h. (C, D) HCT116 and HT29 cells were preincubated with 2.5 μM Z-VAD-FMK (C) or 20 μM BIPV5 (D) for 2 h, followed by the addition of 30 μM aiphanol for 24 h, and the apoptotic cells were evaluated by flow cytometric assay. (E) HCT116 and HT29 cells were treated with Z-VAD-FMK or BIPV5 before aiphanol treatment, and Western blot was utilized to investigate the expression of the indicated proteins. (F) Cell viability of HT29 cells following treatment with aiphanol or in combination with Z-VAD-FMK was quantified for 24-96 h by the CloneSelect Imager (n = 4 per group). Data represent the mean ± SEM. *P < 0.05; **P < 0.01; ***P < 0.001.
Aiphanol promotes the production of cytoplasmic ROS and Ca2+, and the decline in mitochondrial membrane potential, induces mitochondrial apoptosis
It is believed that mitochondrial dysfunction plays a strong role in the upstream of intrinsic apoptosis. Superfluous ROS and alterations in Ca2+ homeostasis are involved in forming caspase-dependent or caspase-independent activation of the mitochondria-mediated internal apoptotic pathway [19]. We respectively used the fluorescent probes DCFH-DA, JC-1 and Fluo-4 AM to investigate the changes in ROS, mitochondrial membrane potential and Ca2+ after aiphanol treatment. The production of ROS in HCT116 and HT29 cells enhanced by aiphanol was inhibited by pretreatment with NAC, a scavenger of ROS (Figure 4A). As shown in Figure 4B, aiphanol dose-dependently caused a decrease in red fluorescence and an increase in green fluorescence, demonstrating that aiphanol contributed to the decline in mitochondrial membrane potential. We also observed that aiphanol promoted intracellular Ca2+ accumulation (Figure 4C). Collectively, these findings further suggested that aiphanol triggered mitochondrial apoptosis in colon cancer cells.
Figure 4.

Aiphanol increases cytoplasmic ROS and Ca2+, and decreases mitochondrial membrane potential. A. HCT116 and HT29 cells were preincubated with 2.5 mM NAC for 2 h before 30 μM aiphanol treatment for 24 h. Intracellular ROS (green) was imaged by confocal microscopy. Scale bar, 100 μm. B. HCT116 and HT29 cells were treated with aiphanol for 24 h, and alterations in the mitochondrial membrane potential were probed by JC-1 staining. Scale bar, 100 μm. C. HCT116 and HT29 cells were exposed to aiphanol for 24 h, and the level of cytoplasmic Ca2+ was analyzed by confocal microscopy. Scale bar, 100 μm. Data represent the mean ± SEM. *P < 0.05; **P < 0.01; ***P < 0.001.
Aiphanol inhibits the migration and invasion of colon cancer cells, and prevents EMT and filament aggregation
To assess the effect of aiphanol on cell motility, we selected the colon cancer cell lines LoVo and SW620, which possess relatively strong motility according to the results of the pretest study, as the research object. A wound healing assay was employed and showed that aiphanol inhibited the migration of LoVo and SW620 cells in a concentration-dependent fashion (Figure 5A). We used transwell chamber assay and found that the migration and invasion capacities of LoVo and SW620 cells were diminished by aiphanol treatment (Figure 5B).
Figure 5.

Aiphanol inhibits the migration and invasion of cancer cells, and prevents EMT and filament aggregation. A. The effect of aiphanol on the migration of LoVo and SW620 cells was determined using a wound healing assay. Scale bar, 200 μm. B. Transwell migration and invasion assays were utilized to evaluate the migratory and invasive capacities of LoVo and SW620 cells treated with the indicated aiphanol for 24 h. Scale bar, 100 μm. C. LoVo and SW620 cells were administered the indicated concentrations of aiphanol for 24 h, and the cell lysates were subjected to Western blot analysis. D. LoVo and SW620 cells were treated with 30 μM aiphanol for 2-4 h, and representative images of the F-actin structure were obtained by immunofluorescence assay. Scale bar, 20 μm. Data represent as mean ± SEM. *P < 0.05; **P < 0.01; ***P < 0.001.
EMT is closely implicated in cancer cell migration and invasion. We observed that aiphanol decreased the protein levels of the mesenchymal markers N-Cadherin, Snail, Slug, MMP2 and MMP9, and increased the levels of the epithelial proteins E-Cadherin, ZO-1 and Claudin-1 (Figure 5C), indicating that aiphanol could prevent EMT. Moreover, cell motility is largely governed by precise actin dynamics, because actin networks directly determine cellular morphologic changes and mechanical force generation [20]. LoVo and SW620 cells exhibited cytoplasmic retraction, partial disappearance of stress fibers, and the destruction of F-actin polymerization upon aiphanol treatment (Figure 5D). These results suggested that aiphanol suppressed EMT and filament aggregation, which may contribute to its inhibitory effect on the motility of cancer cells.
Aiphanol downregulates global tyrosine kinase and serine/threonine kinase activity in colon cancer cells
Aberrant expression and activation of kinases are critical for the development and progression of cancer. Prompted by the finding that aiphanol could diminish phospho-tyrosine and phospho-serine/threonine signals in vascular endothelial cells [7], we sought to examine whether aiphanol has a similar effect in cancer cells. The results of the cell-ELISA showed decreased phospho-tyrosine and phospho-serine/threonine levels in HCT116 and HT29 cells after aiphanol treatment (Figure 6A, 6B). Conformably, Western blot analysis showed that the levels of phosphorylated FAK, AKT and ERK kinase were decreased after aiphanol administration in a dose- and time-dependent manner (Figure 6C, 6D). Aiphanol also decreased the phosphorylation of EGFR and NF-κB (Figure 6D), further validating its activity in blocking several critical kinases.
Figure 6.

Aiphanol downregulates global tyrosine kinase and serine/threonine kinase phosphorylation in colon cancer cells. (A, B) HCT116 and HT29 cells were treated with 30 μM aiphanol for different time, and ELISA was used to evaluate the levels of phospho-tyrosine (A) and phospho-serine/threonine (B) proteins. (C) HCT116 and HT29 cells were exposed to 30 μM aiphanol for the indicated time, and Western blot was performed to assess the expression of the indicated proteins. (D) HCT116 and HT29 cells were administered different doses of aiphanol for 1 h, and subjected to Western blot with the indicated antibodies. Data represent as mean ± SEM. *P < 0.05; **P < 0.01; ***P < 0.001.
Aiphanol’s effects on colon cancer cells in vitro are independent of VEGFR2, VEGFR3 or COX2
Aiphanol could directly inhibit the enzymatic activity of VEGFR2, VEGFR3, and COX2 [7,8]. However, we found that SW620, HCT116, HT29 and LoVo cells were deficient in VEGFR2 and VEGFR3 expression, while varying levels of COX2 could be detected in these colon cancer cells (Figure 7A). COX2 knockdown did not ameliorate the antiproliferative action of aiphanol on COX2-rich LoVo and SW620 cells (Figure 7B-D), indicating that the inhibition of aiphanol on cancer cell proliferation was not related to COX2.
Figure 7.

COX2 depletion doesn’t mitigate the inhibition of cell proliferation by aiphanol. (A) Levels of the indicated proteins in SW620, HCT116, HT29 and LoVo cells. (B) Western blot analysis of COX2 expression in SW620 and LoVo cells after transfection with COX2 siRNA or scrambled siRNA for 48 h. (C, D) SW620 (C) and LoVo (D) cells were treated with or without 30 μM aiphanol for 24 h and 48 h after transfection with COX2 siRNA or scrambled siRNA, and cell viability was analyzed with the CCK-8 method (n = 3 per group).
The multi-targeting characteristic of aiphanol is associated with a broad spectrum of interacting proteins
To further explore the possible mechanism by which aiphanol exerts its anticancer activity, we performed surface plasmon resonance (SPR) in combination with high performance liquid chromatography-mass spectrometry (HPLC-MS) to identify the interactome of aiphanol with lysates from sensitive cell lines (HCT116 and HT29) and insensitive cell line (SW480), based on the IC50 calculation. The experimental procedure was shown in Figure 8A. The SPR signals between control and aiphanol-treated samples confirmed the specificity (Figure 8B-D). 100 binding proteins were identified in HCT116 and HT29 cells, of which 24 binding proteins were only present in HCT116 and HT29 cells, but not in SW480 cells (Figure 8E). The score of binding proteins was proportional to the mass of bound proteins and the affinity of proteins to aiphanol (Table 3); the higher the protein score was, the more likely the protein was the target. Potential binding proteins include 23 tyrosine kinases and serine/threonine kinases, for instance, serine/threonine-protein kinase (VRK1, STK4), tyrosine protein kinase Syk, lymphokine-activated killer T-cell-originated protein kinase TOPK, mitogen-activated protein kinase MAPK family (MK01, MK03, M3K5), cyclin-dependent protein kinase (CDK16, CDK5), supporting aiphanol’s inhibition on global tyrosine kinase and serine/threonine kinase activity (Figure 6A, 6B). Moreover, transcription factors P53 and NF-κB, and epigenetic regulators SIRT1 and IDH1, were identified as binding proteins of aiphanol. Based on the related anticancer phenotypes of aiphanol and the affinity between binding proteins and aiphanol, we silenced the expression of VRK1 (Figure 9A, 9B), TOPK (Figure 9C, 9D), and SIRT1 (Figure 9E, 9F) in HCT116 and SW620 cells by siRNA transfection to evaluate the effect of aiphanol on cancer cell viability. However, individual depletion of these binding proteins failed to alleviate the inhibitory effects of aiphanol on cell proliferation. Therefore, aiphanol, as a multi-targeting agent, may exert its anticancer activity through targeting multiple factors and diverse signaling pathways.
Figure 8.

Analysis of potential binding proteins of aiphanol by SPR coupling mass spectrometry. (A) Schematic diagram of target protein capture and identification by SPR in conjunction with mass spectrometry. (B-D) SPR analysis of aiphanol and HCT116 (B), HT29 (C) and SW480 (D) cell lysates. (E) Venn diagram containing captured proteins from three cell lines.
Table 3.
100 potential binding proteins of aiphanol from SPR in combination with HPLC-MS
| Protein | Score | Protein | Score | Protein | Score |
|---|---|---|---|---|---|
| STK4 | 1894 | SIRT1* | 1180 | CP19A | 606 |
| Syk | 1872 | NF1* | 1158 | GEMI | 579 |
| VRK1* | 1808 | ANDR* | 1147 | M3K5 | 553 |
| GCR* | 1781 | KMT2A* | 1125 | ATF6A | 528 |
| PGDH | 1769 | NEUR2 | 1122 | IMPA1* | 502 |
| NEK2 | 1730 | OPRM | 1094 | ACES | 477 |
| AAPK2 | 1708 | FYN | 1090 | OXSR1 | 469 |
| BACE1 | 1700 | MK01 | 1063 | SMN | 463 |
| TSHR | 1685 | NR1H4 | 1057 | POLH* | 456 |
| ABCG2 | 1684 | SENP6 | 1054 | ACE | 394 |
| KGP1* | 1677 | HD | 1044 | P53 | 375 |
| GLCM | 1663 | TNFA* | 1015 | PRKN | 371 |
| UD110 | 1646 | IDHC | 1002 | ATX2 | 317 |
| MRP2 | 1645 | RIOK2 | 996 | LOX15 | 317 |
| TOPK* | 1562 | JUN | 988 | PIN1 | 293 |
| PPBI | 1559 | AL1A1 | 977 | DAPK1 | 286 |
| AA1R* | 1514 | SMAD3 | 927 | NR0B1 | 282 |
| COX1* | 1487 | CDK5 | 890 | CP3A4 | 282 |
| GSTO1 | 1462 | ERR1 | 877 | RS4X | 281 |
| AK1C4 | 1457 | GNAI1* | 874 | TCPG | 274 |
| KPCA* | 1457 | NF2L2* | 870 | MBNL1* | 265 |
| TF65 | 1436 | KC1G1 | 866 | RL27 | 259 |
| IL1B | 1419 | LMNA* | 850 | K1C14 | 255 |
| NFKB1* | 1403 | CTIP* | 837 | CPSM | 250 |
| KCC1D | 1402 | CLK1 | 800 | RS14 | 231 |
| CDK16 | 1398 | CFTR | 777 | GRP75 | 188 |
| CHLE* | 1388 | STK16 | 774 | ACTB | 187 |
| ALR | 1381 | ERK1* | 725 | FLNA | 175 |
| PIM3 | 1287 | AHR | 689 | GRP78 | 159 |
| KCMA1 | 1281 | HBB | 664 | MATR3 | 105 |
| UD11 | 1251 | HIF1A | 648 | K2C6A | 75 |
| FLT3 | 1224 | DHB2* | 639 | CSRP1 | 54 |
| GEM | 1207 | GBRA1* | 627 | IQGA1 | 17 |
| FEN1 | 1195 |
The binding protein was only present in HCT116 and HT29 cells, but not in SW480 cells.
Figure 9.
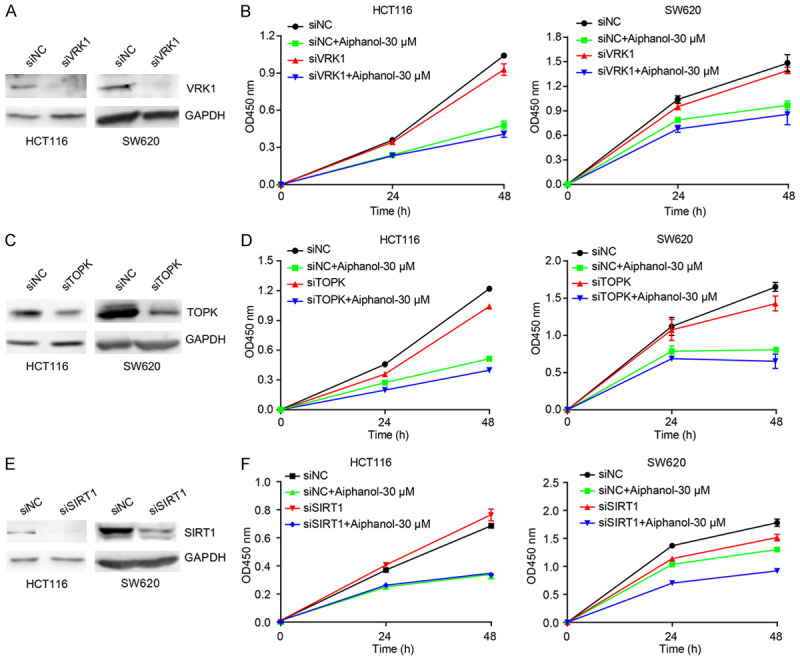
VRK1, TOPK or SIRT1 knockdown did not affect the suppressive efficacy of aiphanol on cell proliferation. (A, C, E) The effect of VRK1 siRNA (A), TOPK siRNA (C) or SIRT1 siRNA (E) on indicated protein expression in HCT116 and SW620 cells was analyzed. (B, D, F) HCT116 and SW620 cells were exposed to 30 μM aiphanol for 24 h and 48 h after transfection with VRK1 siRNA (B), TOPK siRNA (D) or SIRT1 siRNA (F) respectively, and the cell viability was measured using CCK-8 (n = 3 per group).
Aiphanol inhibits xenograft tumor growth
To evaluate the anticancer efficacy of aiphanol in vivo, we utilized the zebrafish xenograft model and found that the growth of CM-Dil-labeled HCT116 and HT29 tumors was significantly inhibited by aiphanol, and the inhibition rate was comparable to that of 5-FU (Figure 10A). In BALB/c nude mice, aiphanol dose-dependently decreased HT29 and HCT116 tumor growth, meanwhile with no obvious effect on body weight (Figure 10B, 10C). These results further supported the in vitro antiproliferative potential of aiphanol. Western blot analysis of HCT116 xenograft cancer tissue lysates demonstrated that aiphanol decreased the phosphorylation of AKT and ERK, and increased the levels of BAX and cleaved caspase-3 (Figure 10D). These results supported that the antitumor growth capacity of aiphanol was correlated with the induction of apoptosis and the inactivation of the AKT and ERK pathways.
Figure 10.

The inhibition of aiphanol on cancer growth is correlated with apoptosis induction and the blockade of AKT and ERK pathways. A. CM-Dil-labeled HCT116 and HT29 cells were injected into the yolk sac of 2 d postfertilization zebrafish. Representative images of the tumor-bearing zebrafish after treatment with 1 mM 5-FU or the indicated aiphanol were visualized (up), and the growth inhibition rate was quantified as a percentage relative to the control (down) (n = 10 per group). Scale bar, 200 μm. B. BALB/c-nude mice implanted with HT29 cells were administered with PBS, CTX (80 mg/kg/7 d) or aiphanol (5 and 50 mg/kg daily) for 14 d. Dissected tumors, tumor weight, and mice weight were displayed (n = 6 per group). Scale bar, 1 cm. C. BALB/c-nude mice inoculated with HCT116 cells were treated with PBS or aiphanol (10 and 50 mg/kg daily) for 12 d. Dissected tumors, tumor volume, and mice weight were shown (n = 8 per group). Scale bar, 1 cm. D. Western blot analysis of the indicated protein expression in HCT116 tumor tissues. Data represent the mean ± SEM. *P < 0.05; **P < 0.01; ***P < 0.001.
Aiphanol inhibits metastasis in vivo
To assess the influence of aiphanol on metastasis in vivo, we microinjected CM-Dil-tagged MDA-MB-231 breast cancer cells into the perivitelline space of zebrafish embryos to establish a tumor transplantation model. Aiphanol (15 μM) led to reduction of disseminated cancer foci (Figure 11A). Alternatively, we injected LoVo cells into BALB/c nude mice via the tail vein. Aiphanol dose-dependently decreased metastatic nodules in the lung, which was confirmed by HE staining (Figure 11B). In addition, we observed that aiphanol significantly inhibited the lung metastasis of murine melanoma cell line B16 in C57BL/6 mice (Figure 11C). These results demonstrated the antimetastatic function of aiphanol in vivo.
Figure 11.

Aiphanol inhibits metastasis in vivo. A. The effect of aiphanol on the metastasis of MDA-MB-231 breast cancer cells in the zebrafish model (n = 20 per group). Taxol (0.25 mg/mL) was used as a positive control. Scale bar, 100 μm. B. The effect of aiphanol on the metastasis of LoVo cells in BALB/c nude mice (n = 6 per group). Left, macroscopic observation of lungs from mice and HE staining of the lung tissues of mice, the red arrows indicate pulmonary metastatic nodules. Scale bar, 50 μm. Right, quantification of the metastatic foci number per lung. C. The impact of aiphanol on the metastasis of murine melanoma B16 cells in C57BL/6 mice (n = 6 per group). Left, representative images of lungs from each group and HE staining of the lung tissues, the red arrows pointed to pulmonary metastatic nodules. Scale bar, 100 μm. Right, graph summarizing the number of metastatic nodules in each group. Data represent as mean ± SEM. *P < 0.05; **P < 0.01; ***P < 0.001.
Toxicity and pharmacokinetic analysis of aiphanol
Our previous study showed that aiphanol at a therapeutic dose (30 mg/kg) had no obvious impact on the weight or major organs of mice [7]. To further evaluate the safety profile of aiphanol, the acute toxicity of aiphanol at doses of 0, 300, 600 and 900 mg/kg in BALB/c mice was determined by single gavage. During the acute toxicity experiment, there were no mortalities or any signs of clinical abnormalities observed. The body weight showed no significant difference between the control group and aiphanol-treated groups (Figure 12A). Aiphanol caused no significant changes in the serum biochemical indexes, including ALT and AST (indicators of liver function), CREA (sign of kidney function), and TG (related to lipid metabolism) (Figure 12B). In addition, HE staining did not reveal any morphological or pathological alterations in the heart, liver, spleen, lung or kidney tissues (Figure 12C). These results emphasized the safety of aiphanol as a potential anticancer agent.
Figure 12.
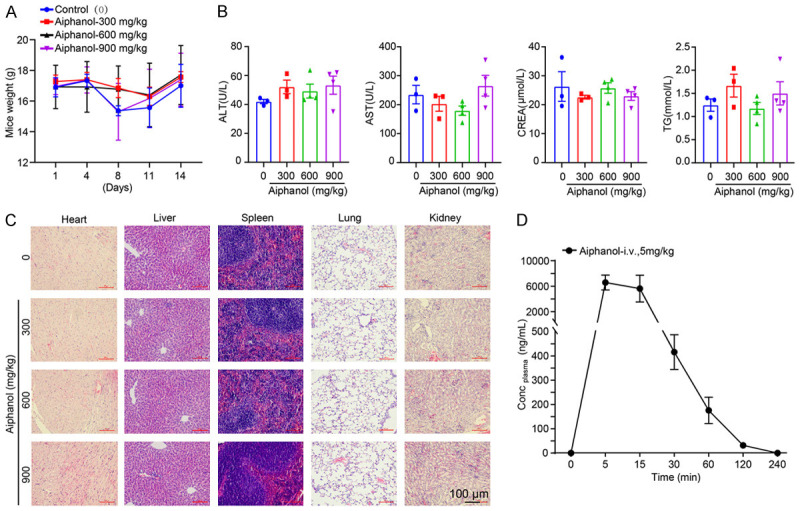
Toxicity and pharmacokinetic analysis of aiphanol. A. The effect of aiphanol (0, 300, 600 and 900 mg/kg) on the body weight of BALB/c mice. B. The impact of the aiphanol on the biochemical parameters of BALB/c mice. C. HE staining of the heart, liver, spleen, lung and kidney of mice after aiphanol administration. Scale bar, 100 μm. D. Aiphanol disposition in rat plasma following intravenous administration at 5 mg/kg (n = 3).
To provide an experimental basis for the pharmacokinetics of aiphanol, we performed the pharmacokinetic study of aiphanol in vivo. After intravenous administration of 5 mg/kg aiphanol in SD rats, aiphanol was absorbed rapidly into the systemic circulation with an average Tmax of 0.139 h and an average Cmax of 7050 μg/L, followed by elimination, in which plasma concentrations were lower than the detection limit (2 ng/mL) at 2-4 h, and the terminal half-life (T1/2) was 0.368±0.068 h. The curve of plasma concentration time (AUC(0-t)) of aiphanol was 2605.111±636.793 μg/L*h (Figure 12D).
Discussion
Emerging evidence has shown paramount interest in natural products with potent chemopreventive and chemotherapeutic activity and minimal side effects. Plant-derived products for example, apigenin, matrine, oridonin, and sinomenine, have been reported to control malignant cancer progression through various mechanisms [21,22]. In the present study, we demonstrated that aiphanol, a natural product identified from Arecaceae and Smilax glabra Roxb, exerted significant inhibitory effects on tumor growth and metastasis through diverse pathways, including enhanced apoptosis, decreased kinase activity, suppressive EMT and F-actin polymerization, which is in accordance with the fact that natural products target multiple molecules to block cancer development and progression. For example, artemisinin showed cytotoxicity in cancer cells by inducing the expression of the apoptotic drivers BAX, caspase-3 and cell cycle regulators [23]. Cardamonin strongly promoted apoptosis and reversed EMT process by suppressing PI3K/AKT pathway in cancer cells [24]. Eriodictyol effectively inhibited cancer cell proliferation and metastasis and provoked apoptosis via blockade of the PI3K, AKT, and NF-κB signaling pathways [25].
We revealed that aiphanol could significantly antagonize many different kinds of cancer cell proliferation in a time- and concentration-dependent fashion, which showed that aiphanol had a broad spectrum of anticancer activity. The anticancer activity of aiphanol was further validated in vivo by using zebrafish and murine models. It should be noted that herein we utilized cancer cells sensitive to aiphanol, such as HT29, HCT116, SW620, and LoVo, for in vitro and in vivo studies. For the MC38 and 4T1 cells, which were relatively insensitive to aiphanol in vitro (Table 2), we previously found that aiphanol could still significantly reduce xenograft growth through antiangiogenesis (for MC38 cells) and block metastasis through antilymphangiogenesis (for 4T1 cells) [7,8]. These results also reflected that aiphanol treatment was equal to combination therapy of multiple single-targeting agents that can simultaneously target many of the pivotal molecules, pathways or mechanisms.
SPR sensors coupled with MS techniques, which furnish quantitative, real-time binding data, have been used to detect biomolecular interactions with a broad range of applications [26]. We divided 100 binding proteins into 4 categories by average score: (I) The protein with score > 1000: high affinity and rapid binding, suggesting that such proteins are usually related to acute drug efficacy, acute toxicity and drug metabolism; (II) The protein with 200 < score < 1000: moderate affinity and moderate binding speed, such proteins are usually associated with chronic drug effects; (III) The protein with 100 < Score < 200: low affinity and slow coupling. Such proteins are usually involved in drug transport, blood drug concentration, and bypass efficacy. These may not be the main targets of the therapeutic effects of aiphanol, however, preclinical drug side effects are likely correlated with such proteins; (IV) The protein with score < 100: nonspecific binding, most of which are carrier proteins and cytoskeletal proteins, can be excluded. Among high-affinity potential proteins only found in sensitive cells, serine/threonine kinase VRK1 played a vital role in promoting tumorigenesis and viability of cancer cells by regulating specific proteins such as P53BP1 [27]. TOPK promoted the tumorigenic properties of HCT116 cells by phosphorylating downstream substrates of ERK2 [28]. The NAD-dependent deacetylase SIRT1 acted as a tumor suppressor in colon cancer, and SIRT1 overexpression suppressed tumor formation by HCT116 cells [29]. Our results revealed that VRK1, TOPK or SIRT1 depletion did not affect the suppressive efficacy of aiphanol on cancer cell viability (Figure 9), indicating that the activity of aiphanol might not be solely mediated by each binding protein. Based on complex signaling pathways and superfluous molecular alterations of cancer cells [30], the real targets of aiphanol have yet to be found. Alternatively, aiphanol functions as a multi-targeting compound, thus knockdown of one protein alone is not enough to reverse the effect of aiphanol. Clinical experience has demonstrated that developing multi-targeting drugs that simultaneously modulate multiple oncogenic pathways is beneficial. For instance, pazopanib, a multikinase inhibitor with targets including VEGFR1/2/3, PDGFRα/β and KIT, was approved by the US Food and Drug Administration (FDA) for advanced renal cell carcinoma treatment [31]. Curcumin inhibited the crucial phases of tumorigenesis, including angiogenesis, cell viability, survival and metastasis, by blocking important signaling axes, for example, the PI3K/AKT/mTOR pathway, NF-κB pathway, MAPK pathway, p53 pathway, and apoptotic and cell cycle pathways [32].
Escaping apoptosis is a typical characteristic of cancer that results in excessive proliferation [33]. Therefore, the development of therapeutic agents to initiate apoptosis in cancer cells is an attractive and effective strategy. In this study, the apoptotic rates were substantially elicited in HCT116 and HT29 cells upon aiphanol stimulation. The proapoptotic proteins BAX and BAK regulate mitochondrial membrane permeability and instigate the mitochondria to release proteins including, cytochrome C, that activate the downstream caspase-3 to initiate apoptosis [34]. In both HCT116 and HT29 cells, the protein expression levels of BAX, cleaved caspase-9, cleaved caspase-3 and its downstream substrate cleaved PARP were enhanced with aiphanol treatment. In addition, flow cytometry and western blot analysis demonstrated that the BAX inhibitor BIPV5 and the caspase inhibitor Z-VAD-FMK significantly antagonized apoptosis and the antiproliferative effect induced by aiphanol. These results suggested that aiphanol boosted apoptosis to contribute to cell proliferation suppression. Our data were in accordance with previous reports.
FAK accelerates cancer progression and dissemination via supporting cancer cell motility and survival. The natural product lycorine repressed cancer cell migration and invasion by inhibiting the FAK pathway [35]. AKT can be stimulated by phosphorylation and further facilitates cell survival via restraining apoptosis [36]. ERK is vital for cell proliferation and survival, and can activate caspase-9, controlling the cleavage of caspases [37]. Aiphanol exerted inhibitory effects on the basal phosphorylation of FAK, AKT and ERK, which might activate crucial executioner proteins of apoptosis, including caspase-3, by enhancing the levels of cleaved caspase-9, and further synergistically augmenting apoptosis in HCT116 and HT29 cells. Bayberry leaves flavonoids (BLF) treatment triggered apoptosis by ERK-dependent caspase-9 phosphorylation [38]. ERK/NF-κB inactivation was associated with magnolol-inhibited apoptosis to disrupt cancer progression in vivo [39].
Toxicity analysis revealed that administration with aiphanol did not result in significant toxicity to mice, further confirming the superior safety of natural products derived from plants. Aiphanol was rapidly metabolized, and its plasma concentration was below quantifiable concentrations (2 ng/mL) at 2-4 h, which may be associated with the fact that aiphanol contains multiple phenolic groups. After administration, aiphanol is easily oxidatively degraded in the presence of metabolic enzymes in the body, acetylated or glycosylated, leading to an undetectable concentration of aiphanol in plasma. We hypothesized that aiphanol metabolites may continue to perform its efficacy. Aspirin, one of the most extensively used drugs, plays anti-inflammatory, analgesic and antipyretic roles as the acetylated form of salicylic acid [40].
Overall, this study demonstrated that aiphanol functions as a naturally existing multi-targeting agent that antagonizes tumor growth and metastasis. Therefore, we proposed that aiphanol might be a promising and safe lead compound for cancer treatment.
Acknowledgements
This study was supported by the National Natural Science Foundation of China (81773219), National Basic Research Program of China (2015CB553906), the Digestive Medical Coordinated Development Center of Beijing Hospitals Authority (XXT21, China), Clinical Medicine Plus X-Young Scholars Project, Peking University, the Fundamental Research Funds for the Central Universities (PKU2022LCXQ021) and the PKU-Baidu Fund (2019BD015, China).
Disclosure of conflict of interest
None.
References
- 1.Sung H, Ferlay J, Siegel RL, Laversanne M, Soerjomataram I, Jemal A, Bray F. Global cancer statistics 2020: GLOBOCAN estimates of incidence and mortality worldwide for 36 cancers in 185 countries. CA Cancer J Clin. 2021;71:209–249. doi: 10.3322/caac.21660. [DOI] [PubMed] [Google Scholar]
- 2.Raghavendra NM, Pingili D, Kadasi S, Mettu A, Prasad SVUM. Dual or multi-targeting inhibitors: the next generation anticancer agents. Eur J Med Chem. 2018;143:1277–1300. doi: 10.1016/j.ejmech.2017.10.021. [DOI] [PubMed] [Google Scholar]
- 3.Hua H, Zhu Y, Song YH. Ruscogenin suppressed the hepatocellular carcinoma metastasis via PI3K/Akt/mTOR signaling pathway. Biomed Pharmacother. 2018;101:115–122. doi: 10.1016/j.biopha.2018.02.031. [DOI] [PubMed] [Google Scholar]
- 4.Zhang R, Wang Z, You W, Zhou F, Guo Z, Qian K, Xiao Y, Wang X. Suppressive effects of plumbagin on the growth of human bladder cancer cells via PI3K/AKT/mTOR signaling pathways and EMT. Cancer Cell Int. 2020;20:520. doi: 10.1186/s12935-020-01607-y. [DOI] [PMC free article] [PubMed] [Google Scholar]
- 5.Lee D, Cuendet M, Vigo JS, Graham JG, Cabieses F, Fong HH, Pezzuto JM, Kinghorn AD. A novel cyclooxygenase-inhibitory stilbenolignan from the seeds of aiphanes aculeata. Org Lett. 2001;3:2169–2171. doi: 10.1021/ol015985j. [DOI] [PubMed] [Google Scholar]
- 6.Xu S, Shang MY, Liu GX, Xu F, Wang X, Shou CC, Cai SQ. Chemical constituents from the rhizomes of smilax glabra and their antimicrobial activity. Molecules. 2013;18:5265–5287. doi: 10.3390/molecules18055265. [DOI] [PMC free article] [PubMed] [Google Scholar]
- 7.Chen S, Feng J, Zhao C, Wang L, Meng L, Liu C, Cai S, Jia Y, Qu L, Shou C. Aiphanol, a native compound, suppresses angiogenesis via dual-targeting VEGFR2 and COX2. Signal Transduct Target Ther. 2021;6:413. doi: 10.1038/s41392-021-00739-5. [DOI] [PMC free article] [PubMed] [Google Scholar]
- 8.Chen SM, Zhao CK, Yao LC, Wang LX, Ma YN, Meng L, Cai SQ, Liu CY, Qu LK, Jia YX, Shou CC. Aiphanol, a multi-targeting stilbenolignan, potently suppresses mouse lymphangiogenesis and lymphatic metastasis. Acta Pharmacol Sin. 2022 doi: 10.1038/s41401-022-00940-4. [Epub ahead of print] [DOI] [PMC free article] [PubMed] [Google Scholar]
- 9.Zhao J, Ou B, Han D, Wang P, Zong Y, Zhu C, Liu D, Zheng M, Sun J, Feng H, Lu A. Tumor-derived CXCL5 promotes human colorectal cancer metastasis through activation of the ERK/Elk-1/Snail and AKT/GSK3beta/beta-catenin pathways. Mol Cancer. 2017;16:70. doi: 10.1186/s12943-017-0629-4. [DOI] [PMC free article] [PubMed] [Google Scholar]
- 10.Qiao D, Jin J, Xing J, Zhang Y, Jia N, Ren X, Lin Z, Jin N, Chen L, Piao Y. Baicalein inhibits gastric cancer cell proliferation and migration through a FAK interaction via AKT/mTOR signaling. Am J Chin Med. 2021;49:525–541. doi: 10.1142/S0192415X21500245. [DOI] [PubMed] [Google Scholar]
- 11.Wu T, Dong X, Yu D, Shen Z, Yu J, Yan S. Natural product pectolinarigenin inhibits proliferation, induces apoptosis, and causes G2/M phase arrest of HCC via PI3K/AKT/mTOR/ERK signaling pathway. Onco Targets Ther. 2018;11:8633–8642. doi: 10.2147/OTT.S186186. [DOI] [PMC free article] [PubMed] [Google Scholar]
- 12.Carneiro BA, El-Deiry WS. Targeting apoptosis in cancer therapy. Nat Rev Clin Oncol. 2020;17:395–417. doi: 10.1038/s41571-020-0341-y. [DOI] [PMC free article] [PubMed] [Google Scholar]
- 13.Luo Y, Fu X, Ru R, Han B, Zhang F, Yuan L, Men H, Zhang S, Tian S, Dong B, Meng M. CpG oligodeoxynucleotides induces apoptosis of human bladder cancer cells via caspase-3-Bax/Bcl-2-p53 axis. Arch Med Res. 2020;51:233–244. doi: 10.1016/j.arcmed.2020.02.005. [DOI] [PubMed] [Google Scholar]
- 14.Aiello NM, Kang Y. Context-dependent EMT programs in cancer metastasis. J Exp Med. 2019;216:1016–1026. doi: 10.1084/jem.20181827. [DOI] [PMC free article] [PubMed] [Google Scholar]
- 15.Lee GA, Choi KC, Hwang KA. Kaempferol, a phytoestrogen, suppressed triclosan-induced epithelial-mesenchymal transition and metastatic-related behaviors of MCF-7 breast cancer cells. Environ Toxicol Pharmacol. 2017;49:48–57. doi: 10.1016/j.etap.2016.11.016. [DOI] [PubMed] [Google Scholar]
- 16.Guo Y, Tong Y, Zhu H, Xiao Y, Guo H, Shang L, Zheng W, Ma S, Liu X, Bai Y. Quercetin suppresses pancreatic ductal adenocarcinoma progression via inhibition of SHH and TGF-beta/Smad signaling pathways. Cell Biol Toxicol. 2021;37:479–496. doi: 10.1007/s10565-020-09562-0. [DOI] [PubMed] [Google Scholar]
- 17.Li B, Zhou P, Xu K, Chen T, Jiao J, Wei H, Yang X, Xu W, Wan W, Xiao J. Metformin induces cell cycle arrest, apoptosis and autophagy through ROS/JNK signaling pathway in human osteosarcoma. Int J Biol Sci. 2020;16:74–84. doi: 10.7150/ijbs.33787. [DOI] [PMC free article] [PubMed] [Google Scholar]
- 18.Spitz AZ, Zacharioudakis E, Reyna DE, Garner TP, Gavathiotis E. Eltrombopag directly inhibits BAX and prevents cell death. Nat Commun. 2021;12:1134. doi: 10.1038/s41467-021-21224-1. [DOI] [PMC free article] [PubMed] [Google Scholar]
- 19.Wang L, Hu T, Shen J, Zhang L, Li LF, Chan RL, Li MX, Wu WK, Cho CH. Miltirone induced mitochondrial dysfunction and ROS-dependent apoptosis in colon cancer cells. Life Sci. 2016;151:224–234. doi: 10.1016/j.lfs.2016.02.083. [DOI] [PubMed] [Google Scholar]
- 20.Kadzik RS, Homa KE, Kovar DR. F-Actin cytoskeleton network self-organization through competition and cooperation. Annu Rev Cell Dev Biol. 2020;36:35–60. doi: 10.1146/annurev-cellbio-032320-094706. [DOI] [PMC free article] [PubMed] [Google Scholar]
- 21.Ying J, Zhang M, Qiu X, Lu Y. The potential of herb medicines in the treatment of esophageal cancer. Biomed Pharmacother. 2018;103:381–390. doi: 10.1016/j.biopha.2018.04.088. [DOI] [PubMed] [Google Scholar]
- 22.Abbasi BA, Iqbal J, Ahmad R, Bibi S, Mahmood T, Kanwal S, Bashir S, Gul F, Hameed S. Potential phytochemicals in the prevention and treatment of esophagus cancer: a green therapeutic approach. Pharmacol Rep. 2019;71:644–652. doi: 10.1016/j.pharep.2019.03.001. [DOI] [PubMed] [Google Scholar]
- 23.Hou J, Wang D, Zhang R, Wang H. Experimental therapy of hepatoma with artemisinin and its derivatives: in vitro and in vivo activity, chemosensitization, and mechanisms of action. Clin Cancer Res. 2008;14:5519–5530. doi: 10.1158/1078-0432.CCR-08-0197. [DOI] [PubMed] [Google Scholar]
- 24.Wang Z, Liu H, Hu Q, Shi L, Lü M, Deng M, Luo G. Cardamonin inhibits the progression of oesophageal cancer by inhibiting the PI3K/AKT signalling pathway. J Cancer. 2021;12:3597–3610. doi: 10.7150/jca.55519. [DOI] [PMC free article] [PubMed] [Google Scholar]
- 25.Li W, Du Q, Li X, Zheng X, Lv F, Xi X, Huang G, Yang J, Liu S. Eriodictyol inhibits proliferation, metastasis and induces apoptosis of glioma cells via PI3K/Akt/NF-kappaB signaling pathway. Front Pharmacol. 2020;11:114. doi: 10.3389/fphar.2020.00114. [DOI] [PMC free article] [PubMed] [Google Scholar]
- 26.Wang W, Li M, Wei Z, Wang Z, Bu X, Lai W, Yang S, Gong H, Zheng H, Wang Y, Liu Y, Li Q, Fang Q, Hu Z. Bimodal imprint chips for peptide screening: integration of high-throughput sequencing by MS and affinity analyses by surface plasmon resonance imaging. Anal Chem. 2014;86:3703–3707. doi: 10.1021/ac500465e. [DOI] [PubMed] [Google Scholar]
- 27.Liu T, Zuo L, Guo D, Chai X, Xu J, Cui Z, Wang Z, Hou C. Ginsenoside Rg3 regulates DNA damage in non-small cell lung cancer cells by activating VRK1/P53BP1 pathway. Biomed Pharmacother. 2019;120:109483. doi: 10.1016/j.biopha.2019.109483. [DOI] [PubMed] [Google Scholar]
- 28.Zhu F, Zykova TA, Kang BS, Wang Z, Ebeling MC, Abe Y, Ma WY, Bode AM, Dong Z. Bidirectional signals transduced by TOPK-ERK interaction increase tumorigenesis of HCT116 colorectal cancer cells. Gastroenterology. 2007;133:219–231. doi: 10.1053/j.gastro.2007.04.048. [DOI] [PubMed] [Google Scholar]
- 29.Kabra N, Li Z, Chen L, Li B, Zhang X, Wang C, Yeatman T, Coppola D, Chen J. SirT1 is an inhibitor of proliferation and tumor formation in colon cancer. J Biol Chem. 2009;284:18210–18217. doi: 10.1074/jbc.M109.000034. [DOI] [PMC free article] [PubMed] [Google Scholar]
- 30.Hanahan D, Weinberg RA. Hallmarks of cancer: the next generation. Cell. 2011;144:646–674. doi: 10.1016/j.cell.2011.02.013. [DOI] [PubMed] [Google Scholar]
- 31.Bukowski RM, Yasothan U, Kirkpatrick P. Pazopanib. Nat Rev Drug Discov. 2010;9:17–18. doi: 10.1038/nrd3073. [DOI] [PubMed] [Google Scholar]
- 32.Farghadani R, Naidu R. Curcumin: modulator of key molecular signaling pathways in hormone-independent breast cancer. Cancers (Basel) 2021;13:3427. doi: 10.3390/cancers13143427. [DOI] [PMC free article] [PubMed] [Google Scholar]
- 33.Koh M, Takahashi T, Kurokawa Y, Kobayashi T, Saito T, Ishida T, Serada S, Fujimoto M, Naka T, Wada N, Yamashita K, Tanaka K, Miyazaki Y, Makino T, Nakajima K, Yamasaki M, Eguchi H, Doki Y. Propranolol suppresses gastric cancer cell growth by regulating proliferation and apoptosis. Gastric Cancer. 2021;24:1037–1049. doi: 10.1007/s10120-021-01184-7. [DOI] [PubMed] [Google Scholar]
- 34.Wei MC, Zong WX, Cheng EH, Lindsten T, Panoutsakopoulou V, Ross AJ, Roth KA, MacGregor GR, Thompson CB, Korsmeyer SJ. Proapoptotic BAX and BAK: a requisite gateway to mitochondrial dysfunction and death. Science. 2001;292:727–730. doi: 10.1126/science.1059108. [DOI] [PMC free article] [PubMed] [Google Scholar]
- 35.Ying X, Huang A, Xing Y, Lan L, Yi Z, He P. Lycorine inhibits breast cancer growth and metastasis via inducing apoptosis and blocking Src/FAK-involved pathway. Sci China Life Sci. 2017;60:417–428. doi: 10.1007/s11427-016-0368-y. [DOI] [PubMed] [Google Scholar]
- 36.Franke TF, Kaplan DR, Cantley LC. PI3K: downstream AKTion blocks apoptosis. Cell. 1997;88:435–437. doi: 10.1016/s0092-8674(00)81883-8. [DOI] [PubMed] [Google Scholar]
- 37.Allan LA, Morrice N, Brady S, Magee G, Pathak S, Clarke PR. Inhibition of caspase-9 through phosphorylation at Thr 125 by ERK MAPK. Nat Cell Biol. 2003;5:647–654. doi: 10.1038/ncb1005. [DOI] [PubMed] [Google Scholar]
- 38.Zhang Y, Chen S, Wei C, Rankin GO, Ye X, Chen YC. Flavonoids from Chinese bayberry leaves induced apoptosis and G1 cell cycle arrest via Erk pathway in ovarian cancer cells. Eur J Med Chem. 2018;147:218–226. doi: 10.1016/j.ejmech.2018.01.084. [DOI] [PMC free article] [PubMed] [Google Scholar]
- 39.Tsai JJ, Chen JH, Chen CH, Chung JG, Hsu FT. Apoptosis induction and ERK/NF-kappaB inactivation are associated with magnolol-inhibited tumor progression in hepatocellular carcinoma in vivo. Environ Toxicol. 2020;35:167–175. doi: 10.1002/tox.22853. [DOI] [PubMed] [Google Scholar]
- 40.Vane JR, Botting RM. The mechanism of action of aspirin. Thromb Res. 2003;110:255–258. doi: 10.1016/s0049-3848(03)00379-7. [DOI] [PubMed] [Google Scholar]