

Abstract
Most malignant hepatic nodules (MHNs) eventually progress to hepatocellular carcinoma (HCC). However, assessment of the risk of malignancy in high-risk groups of patients with hepatic nodules remains a challenge. This study aimed to develop and validate a simple scoring system to predict the risk of development of MHNs. 1144 patients with primary nodular lesions of hepatic were divided into training cohort and validation cohort. The nomogram model for predicting the risk of MHNs was established according to age, sex, nodule size, prothrombin time (PT), alpha-fetoprotein (AFP), protein induced by vitamin K absence or antagonist-II (PIVKA-II), γ-glutamine acyltransferase isoenzyme (γ-GT), alanine aminotransferase (ALT), total bile acid (TBA), and total bilirubin (TBIL) in training cohort by logistic regression and validated in validation cohort. The area under receiver operating characteristic curve (AUC) of the predictive model for diagnosing MHNs in training cohort was 0.969 (95% CI: 0.959-0.979), with sensitivity 93.38% and specificity 90.75%, and the AUC in the validation cohort was 0.986 (95% CI: 0.975-0.996), with sensitivity 90.81% and specificity 94.26%. The AUC, sensitivity, and specificity of this model for the diagnosis of early-stage HCC were 0.942, 88.64% and 87.35% in training cohort, and 0.956, 87.04% and 91.85% in validation cohort, respectively. We established a nomogram model that used intuitive data for reliably predicting the risk of MHNs, and this model also showed good diagnostic accuracy in predicting early-stage HCC.
Keywords: Malignant hepatic nodules, hepatocellular carcinoma, early stage, NSMC-ASIL, nomogram
Introduction
Hepatocellular carcinoma (HCC) is the most common primary malignant tumour of the hepatic and the third-leading cause of cancer-related deaths in humans [1]. China is a major country with respect to the incidence of hepatic cancer, and approximately 50% of the HCC cases worldwide occur in China [2]. The average annual incidence of HCC in the world over the past five years was 995,000, of which approximately 423,000 cases were from China, accounting for 42.5% of the global incidence [3,4]. Early-stage HCC is characterized by an insidious onset, rapid disease progression, middle-late-stage diagnosis, and high mortality, and is associated with a substantial social and economic burden [5]. If HCC can be effectively diagnosed at an asymptomatic early stage, more patients would receive potentially curative treatments, including hepatic resection and hepatic transplantation [6-8]. Therefore, early detection and early treatment are the most effective approaches to improve the clinical treatment effect in cases of HCC.
Several recent studies incorporating pathological, molecular biological and imaging assessments have shown that approximately 80% of HCCs originate from malignant hepatic nodules (MHNs), with dysplastic nodules (DNs) gradually developing into HCC [9,10]. Therefore, identification of high-risk patients with MHNs is very important and will allow more early-stage HCC patients to receive timely intervention. At present, the clinical differential diagnosis of benign hepatic nodules (BHNs) and MHNs mainly relies on imaging methods [ultrasound (US), computed tomography (CT), magnetic resonance imaging (MRI)], but the diagnostic efficiency of these methods shows certain limitations. For patients with MHNs or with the potential for further deterioration, the lack of effective quantitative parameters for BHNs and MHNs in the early stage leads to unsatisfactory diagnostic sensitivity and specificity. The sensitivity and specificity of US, CT, and MRI for the diagnosis of MHNs have been confirmed approximately 63.0%, 40.8% and 94.6%, and 45.0%, 73.2%, and 64.9%, respectively [3,11,12]. False-positive and uncertain findings, which are common in US screening, can cause anxiety and panic among patients [4]. Serological diagnostic indicators used in clinical laboratories are based on biochemical and immunological principles as well as the evaluation of specific molecules and processes such as coagulation. Examinations based on these indicators are simple, practical, minimally invasive, easy to repeat, and highly sensitive, and are often used to facilitate the differential diagnosis of BHNs and MHNs. However, serum markers also have certain shortcomings; for example, since they show a limited increase in malignant tumours, the sensitivity of diagnosis in the early stage is not high, and because they also show an increase in benign hepatic diseases, their specificity is not high either, causing diagnostic difficulties. Therefore, a more convenient, objective, and accurate monitoring method for MHNs is needed.
Risk assessment is a risk prediction method used to improve the awareness of diseases with high morbidity and high mortality. It can help promote the selection of high-risk groups for a certain disease who can then receive active treatment and has been used in clinical diagnosis and treatment as well as monitoring of patients with cardiovascular disease [13]. Over the past few decades, several HCC risk scores have been developed and validated to stratify the risk of HCC development, including the ASAP model used to predict the risk of HCC development in HBV-infected patients [8]; hepatocarcinogenesis in the context of cirrhosis Toronto HCC risk index (THRI) [14]; REACH-B risk model for hepatic cancer in hepatitis B virus (HBV) infected patients who did not receive antiviral therapy [15]; PAGE-B model for predicting the risk of hepatic cancer after HBV antiviral therapy [16]; a risk model for hepatic cancer in untreated hepatitis C virus (HCV) infected patients [17], a risk model for hepatic cancer after anti-HCV therapy [18]; and the aMAP model for multi-causal hepatic cancer risk analysis [19]. These risk-scoring models based on disease risk factors have made extremely important contributions to the screening of high-risk HCC populations. However, they are all predictive models based on laboratory diagnostic indicators and do not include data from imaging indicators. Therefore, this study identified and used all reliable, easily accessible, and accurate risk factors for predicting the occurrence of malignant hepatic nodules, including imaging diagnostic indicators, to facilitate timely identification and screening of high-risk patients with malignant hepatic nodules, thereby achieving timely diagnosis and improving the prognosis of patients. The development of the nomographic model for risk prediction of MHNs in this study was aimed to identify the influencing factors associated with the occurrence of malignant nodules in the hepatic and to create and validate a simple, clinically useful long-term predictive scoring model to predict an individual’s risk of MHNs in a population of patients with primary hepatic nodules.
Materials and methods
Research participants
A total of 1144 patients with hepatic nodules were initially diagnosed from January 2016 to December 2020 at the Affiliated Hospital of North Sichuan Medical College. The cases collected from January 2016 to December 2019 constituted the training cohort, which include 499 patients with MHNs and 325 patients with BHNs, while the cases collected from January 2020 to December 2020 constituted the validation cohort, which include 185 patients with MHNs and 135 patients with BHNs. MHNs were diagnosed in patients who met at least one of the following criteria: (1) patients diagnosed with MHNs by pathological (hepatic biopsy) biopsy or surgical pathology; (2) patients with no history of radical surgery or anti-tumour treatments such as radiotherapy and chemotherapy; (3) patients with complete clinical general information, imaging data, and hepatic serological test results. On the other hand, patients with BHNs identified by needle biopsy, postoperative pathological assessments, or follow-up assessments over more than 6 months were classified into the control group, which included patients with chronic hepatitis B (CHB), hepatic cirrhosis (LC), and other benign hepatic tumours, such as hepatic cysts, hepatic hemangiomas, and hepatic abscess. Patients who met any of the following criteria were excluded: (1) history of surgery, radiotherapy, or chemotherapy; (2) serious concurrent diseases or major trauma, burns, etc. seven days before sampling; (3) pregnancy, reproductive embryonic tumors; (4) recent history of treatment with vitamin K or vitamin K antagonists such as warfarin; (5) hepatic metastases from other tumors; (6) incomplete clinical information and examination indicators. This study was approved by the hospital ethics committee, the research data were obtained anonymously; and the ethics committee approved the request for an informed consent waiver for this study.
The included risk factors were predictors of long-term risk that have been shown to influence hepatic function classification and promote the development of HCC. The selected factors were also readily measurable by widely available clinical trials. Thus, to maximize clinical application, the design of this risk nomogram model includes factors that are simple, non-invasive, and routinely measured.
The China hepatic cancer staging scheme was used to define early-stage HCC, which was characterized as a single tumor ≤ 5 cm in diameter showing no evidence of vascular invasion and extrahepatic metastasis and Child-Pugh A/B [20].
Determination of laboratory diagnostic indicators
Blood samples were collected from all participants within 3 days after admission, and 3-5 mL of fasting venous blood was collected and placed in immunological, biochemical, and coagulation test tubes, fully mixed, and centrifuged at 2,583 × g for 5 min to separate serum and plasma. Serum levels of alpha-fetoprotein (AFP) were measured using an electrochemiluminescence immunoassay (Cobas E602, Roche, Inc., Germany). Serum levels of protein induced by vitamin K absence or antagonist-II (PIVKA-II) were determined using a chemiluminescent microparticle immunoassay (Architect i1000; Abbott Laboratories, USA). Serum levels of γ-glutamine acy1transferase isoenzyme (γ-GT), alanine aminotransferase (ALT), and aspartate transaminase (AST) were determined using a biochemical rate-assay (ADVIA-2400, Siemens, Germany). Serum levels of total bilirubin (TBIL) were measured using a vanadate oxidation method (ADVIA-2400, Siemens, Germany). Serum levels of total bile acid (TBA) were measured using an enzyme recycling method (ADVIA-2400, Siemens, Germany). Serum levels of albumin (Alb) were measured using BCG staining (ADVIA-2400, Siemens, Germany). Prothrombin time (PT) was measured using a coagulation assay (CP3000; SEKISUI, Japan).
Imaging diagnostic indicators
All study participants completed hepatic imaging-related examinations within 3 days after admission. The diagnostic indicators included the number and size of hepatic nodules, the presence or absence of metastasis, the presence or absence of ascites, and the amount of ascites.
Other relevant influencing factors
The general clinical data of the research subjects were collected including age, sex, length of hospital stay, family history of hepatic cancer, and the presence or absence of hepatic encephalopathy.
Statistical analysis
The data were sorted and imported into the SPSS 26.0 (US, IBM SPSS) software package for statistical analysis. Normally distributed data were expressed as mean (standard deviation), and the t-test was used for comparisons between groups. Data showing a non-normal distribution were described as median (interquartile range), and analyzed by logarithmic (ln) transformation, followed by the Mann-Whitney U test for comparisons between groups. Count data were expressed as number (%), and Pearson Chi-square test was used for comparisons between groups. On the basis of the data for the experimental group, a multivariate risk prediction model of MHNs was established by binary logistic regression, and independent variables were screened by the stepwise method. Odds ratios (OR), 95% confidence intervals for OR values, and P values were obtained. The receiver operating characteristic (ROC) curve was used to determine the critical diagnostic value, area under the curve (AUC), diagnostic sensitivity, and diagnostic specificity. The AUCs were compared using Delong test in MedCalc, version 20.0 (Solvu soft Corporation, American). On the basis of the data obtained for the experimental group, a nomogram, which was named NSMC-ASIL, was developed using the multivariate analysis results of the rms package of the R Studio (Math Soft, USA) software. The inspection level was P = 0.05. The diagnostic performance and fit of the constructed model were evaluated in the validation group by applying calibration, discrimination and Hosmer-Lemeshow (H-L) tests.
Results
Basic clinical characteristics of the research participants
A total of 1144 patients with hepatic nodules were divided into 824 cases in the training cohort to construct the risk prediction model and 320 cases in the validation cohort to verify the predictive ability of the risk prediction model. The age of patients with MHNs in the training and validation cohorts were significantly higher than that of patients with BHNs (P < 0.001). In terms of gender composition, the patients with MHNs and BHNs were mainly male, but the proportion was different, and there was a statistical difference between them (P < 0.001). In addition, the incidence of MHNs in the training and validation cohorts were similar (60.56% vs 57.81%). Thus, the participant population selected in this study met the experimental requirements and could be used the construction and verification of the prediction model. The basic clinical characteristics of the study population are shown in Table 1.
Table 1.
Characteristics of the study population (n = 1144)
| Characteristic | Training cohort | Validation cohort | ||
|---|---|---|---|---|
|
|
|
|||
| Positive group (n = 499) | Control group (n = 325) | Positive group (n = 185) | Control group (n = 135) | |
| Age, years | 58.1 (12.3)* | 54.0 (12.9) | 57.8 (10.9)# | 52.0 (11.4) |
| Sex, n (%) | ||||
| Male | 411 (82.4%) | 206 (63.4%) | 158 (85.4%) | 96 (71.1%) |
| Female | 88 (17.6%) | 119 (36.6%) | 27 (14.6%) | 39 (28.9%) |
| Child-Pugh class, n (%) | ||||
| A | 331 (66.3%) | 157 (48.3%) | 102 (55.1%) | 86 (63.7%) |
| B | 140 (28.1%) | 110 (33.8%) | 67 (36.2%) | 39 (28.9%) |
| C | 28 (5.6%) | 58 (17.9%) | 16 (8.7%) | 10 (7.4%) |
| AFP, ng/mL | 142.9 (7.4-4527.5)* | 4.7 (2.4-20.8) | 333.1 (11.4-8786.1)# | 3.1 (1.8-5.3) |
| PIVKA-II, mAU/mL | 1020.7 (82.7-9033.1)* | 22.3 (16.6-32.6) | 2290.0 (290.3-15199.8)# | 27.3 (20.9-33.7) |
| Nodule size, cm | 6.7 (4.1-10.2)* | 1.4 (0.8-3.0) | 7.5 (4.5-10.1)# | 1.2 (0.7-2.3) |
| TBIL, µmol/L | 21.1 (15.0-32.6)* | 28.2 (15.1-87.9) | 21.1 (15.7-31.6)# | 18.3 (13.9-26.2) |
| GGT, IU/L | 130.0 (57.0-279.0)* | 78.0 (29.3-162.3) | 144.0 (72-1271.5)# | 30.0 (19.0-60.0) |
| AST, U/L | 61.2 (37.1-109.3) | 54.0 (26.5-177.0) | 63.4 (41.1-117.5)# | 28.0 (23.0-41.0) |
| ALT, U/L | 41.4 (25.1-70.0) | 42.0 (20.5-209.8) | 45.0 (28.0-74.0)# | 29.0 (19.0-45.0) |
| TBA, µmol/L | 11.3 (5.2-27.6)* | 18.5 (3.9-101.6) | 9.3 (4.0-24.8)# | 3.9 (2.1-8.5) |
| Alb, g/L | 37.3 (32.6-41.3)* | 35.5 (30.0-42.0) | 37.9 (33.1-41.9)# | 44.0 (40.4-46.5) |
| PT, s | 14.2 (13.4-15.2)* | 14.6 (13.3-17.4) | 14.1 (13.3-15.3)# | 14.3 (12.9-15.6) |
Data are expressed as mean (standard deviation), median (interquartile range) or number (%);
P < 0.05, in comparison with the control group in the training cohort;
P < 0.05, in comparison with the control group in the validation cohort.
Nomographic model for risk prediction of malignant nodules in the hepatic
Data correction and transformation: evaluation of the distribution of the data obtained for the experimental group, showed that the data of nodule size, PT, AFP, PIVKA-II, TBIL, γ-GT, ALT, AST, TBA, and Alb were skewed distribution. Therefore, these data underwent natural logarithm transformation.
Using the presence of MHNs as a dependent variable, age, sex, Child-Pugh score, ln (nodule size), ln (AFP), ln (PIVKA-II), ln (γ-GT), ln (TBIL), ln (AST), ln (ALT), ln (TBA), ln (Alb), and ln (PT) were used as independent variables for binary logistic regression analysis, with the codes for sex was male = 1, female = 2. Multivariate logistic regression analysis showed that the age, sex, ln (nodule size), ln (AFP), ln (PIVKA-II), ln (γ-GT), ln (PT) were independent risk factors for MHNs, while the ln (TBIL), ln (ALT), and ln (TBA) were independent protective factors for MHNs (Figure 1).
Figure 1.
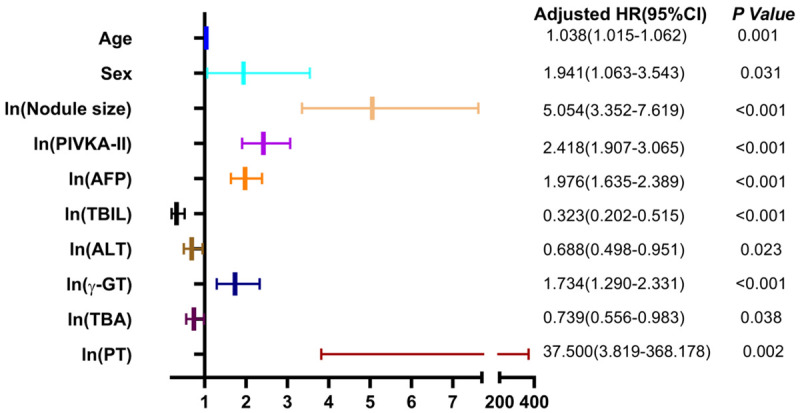
Forest plot of variables in the diagnosis of MHNs.
On the basis of these findings, the NSMC-ASIL, a multi-factor risk prediction model for MHNs (Figure 2), was established using the experimental group data and used to predict the risk of MHNs. The nomogram is based on the following formula: ln (P/1-P) = -15.595 + 0.037 × age (years) + 0.663 × sex (male = 1, female = 2) + 1.620 × ln (nodule-size) + 0.883 × ln (PIVKA-II) + 0.681 × ln (AFP) - 1.131 × ln (TBIL) + 0.550 × ln (γ-GT) - 0.374 × ln (ALT) - 0.302 × ln (TBA) + 3.624 × ln (PT).
Figure 2.

Nomogram to predict the presence of MHNs.
Evaluation of the diagnostic efficacy of NSMC-ASIL
Using the data of the training cohort, we explored the diagnostic efficacy of NSMC-ASIL in comparison with AFP and PIVKA-II alone or in combination for diagnosing MHNs. Considering the 325 patients with BHNs as the control group, the ROC curve showed that the best cut-off value of NSMC-ASIL for diagnosing the 499 patients with MHNs was 0.495, with diagnostic AUC, sensitivity, specificity, and accuracy values of 0.969 (95% CI: 0.959-0.979), 93.38%, 90.75%, and 92.35%, respectively. On the other hand, the best cut-off value for the AFP level was 156.5 ng/mL, with the AUC, sensitivity, specificity, and accuracy values of 0.775 (95% CI: 0.744-0.806), 49.49%, 93.54%, 66.86%, respectively, while the best cut-off value for the PIVKA-II level was 82.14 mAU/mL, with diagnostic AUC, sensitivity, specificity, and accuracy values of 0.878 (95% CI: 0.855-0.902), 75.15%, 91.38%, 81.55%, respectively. Similarly, the best cut-off value for the combination of AFP and PIVKA-II levels was 0.6467, with diagnostic AUC, sensitivity, specificity, and accuracy values of 0.884 (95% CI: 0.861-0.906), 73.75%, 93.85%, 81.67%, respectively (Figure 3A). The AUC value of NSMC-ASIL was significantly different from those of the other three diagnostic methods (P < 0.001), and the diagnostic sensitivity improved from 73.75% for the combination of AFP and PIVKA-II to 93.38% for NSMC-ASIL.
Figure 3.

A, C: Receiver-operating characteristic curves of PIVKA-II, AFP, PIVKA-II combined with AFP, and the NSMC-ASIL model in MHNs and early-stage HCC patients of training cohort. B, D: Receiver-operating characteristic curves of the NSMC-ASIL model in MHNs and early-stage HCC patients of training cohort and validation cohort.
We used the data of the validation cohort to verify the diagnostic performance of the risk prediction model in diagnosing MHNs. Using the data for the 135 patients with BHNs in the validation cohort as the control group, the optimal cut-off value of the risk prediction model for diagnosing 185 patients with MHNs was 0.495, with AUC, sensitivity, specificity, and accuracy values of 0.986 (95% CI: 0.975-0.996), 97.30%, 97.30%, 86.67%, 92.81%, respectively (Figure 3B). In comparison with the AUC of the training cohort, the difference was statistically significant (P = 0.007).
Discrimination ability of NSMC-ASIL for early-stage HCC
Using the data of the training cohort, we also explored the diagnostic effectiveness of NSMC-ASIL for early-stage HCC in comparison with those of AFP and PIVKA-II levels alone or in combination (Figure 3C), while the data of the validation cohort were used to verify the diagnostic efficacy of NSMC-ASIL for early-stage HCC (Figure 3D). In the training cohort, using the 325 patients with BHNs as the control group, the ROC curve showed that the best cut-off value of NSMC-ASIL to diagnose the 176 patients with early-stage HCC was 0.379, with AUC, sensitivity, specificity, and accuracy values of 0.942 (95% CI: 0.922-0.962), 88.64%, 87.35%, and 87.82%, respectively. The best cut-off value for diagnosis of early-stage HCC on the basis of AFP levels was 6.35 ng/mL, with AUC, sensitivity, specificity, and accuracy values of 0.728 (95% CI: 0.680-0.775), 74.43%, 60.31%, and 65.27%, respectively. The best cut-off value for diagnosis of early-stage HCC on the basis of PIVKA-II levels was 41.27 mAU/mL, with AUC, sensitivity, specificity, and accuracy values of 0.821 (95% CI: 0.777-0.864), 76.14%, 83.69%, and 81.04%, respectively. The best cut-off value for diagnosis of early-stage HCC using the combination of AFP and PIVKA-II levels was 0.284, with AUC, sensitivity, specificity, and accuracy values of 0.892 (95% CI: 0.862-0.921), 80.68%, 79.94%, and 80.20%, respectively. In the validation cohort, using the 135 patients with BHNs as the controls group, the optimal cut-off value of NSMC-ASIL for diagnosing the 54 cases of early-stage HCC was 0.379, with AUC, sensitivity, specificity, and accuracy values of 0.956 (95% CI: 0.922-0.990), 92.59%, 83.70%, and 86.24%, respectively.
Proposed risk scale
On the basis of the data of the training and validation cohorts, we proposed a simple standardized scale that can be used by clinicians to evaluate the risk of occurrence of MHNs on the basis of the risk prediction probability obtained by NSMC-ASIL (Table 2), which was mainly set according to the following principles: (1) risk ≤ 0.228, the corresponding maximum risk predicted probability was defined as low risk with negative predictive value (NPV) ≥ 95.00%; (2) the maximum risk predicted probability corresponding to 0.229 ≤ risk ≤ 0.494 was defined as medium risk with NPV < 95.00%; (3) 0.495 ≤ risk ≤ 0.730 was defined as high risk with positive predictive value (PPV) < 95.00%; (4) risk ≥ 0.731 corresponding to the minimum risk predicted probability was defined as the highest risk (most likely HCC) with PPV ≥ 95.00%.
Table 2.
Proposed risk scale and the corresponding probability of predictive risk of MHNs
| Risk level | Probability of risk | NPV | PPV |
|---|---|---|---|
| Low risk | 0.000-0.228 | ≥ 95.00% | NA |
| Moderate risk | 0.229-0.494 | < 95.00% | NA |
| High risk | 0.495-0.730 | NA | < 95.00% |
| Most likely | 0.731-1.000 | NA | ≥ 95.00% |
NA: Not Applicable.
Discussion
In this study, the NSMC-ASIL based on age, sex, routine hepatic imaging findings, and laboratory diagnostic indicators was developed and validated to predict the risk of occurrence of MHNs in a population of patients with primary hepatic nodules. The NSMC-ASIL showed good diagnostic accuracy in predicting primary malignant nodules of the hepatic. Therefore, this model can help clinicians identify patients with primary hepatic nodules who are likely to develop MHNs or HCC at an early stage and formulate appropriate diagnosis and treatment plans in a timely manner. In this study, we found that male patients over the age of 50 years belonged to the high-risk group for MHNs, which is basically consistent with the reports in the literature [21]. Simultaneously, we also proved that tumour markers commonly used in evaluation of hepatic cancer, especially AFP and PIVKA-II levels, can also be used to differentiate BHNs and MHNs. Moreover, the size of nodules was related to the occurrence of MHNs. The higher the levels of AFP and PIVKA-II in patients, the greater the risk of developing MHNs, which is consistent with the findings reported by Cruz et al [22]. Therefore, we further analysed the association of AFP and PIVKA-II levels and hepatic nodule size with the occurrence of MHNs. We found that the diagnosis of MHNs could be significantly improved by combining factors such as AFP and PIVKA-II levels, hepatic nodule size, other hepatic function evaluation indicators (e.g., γ-GT/TBA/ALT/PT), along with age and sex. Thus, we chose a combination of age and sex with the size of hepatic nodules, which was determined by imaging examination, and common hepatic laboratory diagnostic indicators to construct the NSMC-ASIL for evaluating the risk of MHNs. The results suggested that while the combination of AFP and PIVKA-II levels showed better diagnostic performance for MHNs than the performance of the two parameters alone, it was still significantly lower than the performance of NSMC-ASIL. The AUC of the ROC curve obtained by the formula for the validation cohort was significantly different from that for the training cohort. This difference may be attributed to the large difference in the number of cases in the two groups, resulting in a lower standard error. Although small data changes may cause statistically significant differences in AUC, the results of our study (Figure 3B) showed that the predictive model achieved high diagnostic value in both groups, indicating that the model had high diagnostic performance for the differential diagnosis of BHNs and MHNs. We also used the data of the validation cohort to confirm that the predicted incidence of MHNs was consistent with the actual incidence. NSMC-ASIL also showed good ability to identify early-stage HCC. Since the ASAP model [8], which includes age, sex, and AFP and PIVKA-II levels, has been established and validated for the differential diagnosis of HCC, we compared NSMC-ASIL with the ASAP model (formula used in the original text) for identification of early-stage HCC. When the data of 176 patients with early-stage HCC and 325 patients with BHNs in the training cohort were substituted into the ASAP model, the optimal cut-off value of the ROC curve was 0.379, with AUC, sensitivity, specificity, and accuracy values of 0.856 (95% CI: 0.822-0.886), 84.66%, 66.15%, and 72.65%, respectively. The AUC value of NSMC-ASIL for the diagnosis of early-stage HCC was significantly different (P < 0.01), indicating that NSMC-ASIL had diagnostic efficiency for early-stage HCC and that it outperformed the ASAP model.
NSMC-ASIL is easy to operate and provides intuitive and accurate data. Clinicians can directly calculate the risk value corresponding to each indicator through the model, allowing them to accurately screen out high-risk patients and implement targeted prevention strategies. We also performed risk classification of MHNs into four levels by using this model: low, moderate, high, and most likely (Table 2). We also formulated corresponding reference clinical response methods for different risk levels. Patients with low and moderate risk scores should undergo follow-up screening (including laboratory hepatic function tests and hepatic ultrasonography) every six months, diet control and strengthening exercise. In contrast, high-risk patients should actively receive an individualised diagnosis and treatment plan, follow-up screening every 3 months, and additional CT/MRI/PET-CT examinations, if necessary, while patients in the most likely category should immediately undergo a diagnostic biopsy of the hepatic nodule, with active development of a surgical plan after determination of the nature of the nodule. By stratifying the risk level of the high-risk groups and formulating appropriate response plans, the early diagnosis rate of MHNs can be improved, and the substantial economic and psychological burden on patients as a result of excessive examination can be avoided, thereby alleviating the current situation of insufficient allocation of medical resources in China.
In conclusion, NSMC-ASIL developed in this study showed excellent performance in terms of discrimination ability, diagnostic performance and accuracy of BHNs and MHNs, and the included variables were readily available clinically. The model also showed good diagnostic accuracy in predicting early-stage HCC. The NSMC-ASIL model has the potential to be used as a screening tool for evaluating the risk of MHNs in high-risk groups of hepatic nodules, which will help clinicians assess the risk and formulate individualised treatment plans.
Acknowledgements
This work was supported by National Natural Science Foundation of China (82272436), Science and Technology Project of Nanchong (20SXQT0337).
Disclosure of conflict of interest
None.
References
- 1.Liu L, Chen A, Chen S, Song W, Yao Q, Wang P, Zhou S. CCNB2, NUSAP1 and TK1 are associated with the prognosis and progression of hepatocellular carcinoma, as revealed by co-expression analysis. Exp Ther Med. 2020;19:2679–2689. doi: 10.3892/etm.2020.8522. [DOI] [PMC free article] [PubMed] [Google Scholar]
- 2.An L, Zeng HM, Zheng RS, Zhang SW, Sun KX, Zou XN, Chen R, Wang SM, Gu XY, Wei WW, He J. Liver cancer epidemiology in China, 2015. Zhonghua Zhong Liu Za Zhi. 2019;41:721–727. doi: 10.3760/cma.j.issn.0253-3766.2019.10.001. [DOI] [PubMed] [Google Scholar]
- 3.Prospective suRveillance for very Early hepatoCellular cARcinoma(PreCar) Expert Panel. Expert consensus on early screening strategies for liver cancer in China. Zhonghua Gan Zang Bing Za Zhi. 2021;29:515–522. doi: 10.3760/cma.j.cn501113-20210605-00264. [DOI] [PMC free article] [PubMed] [Google Scholar]
- 4.Atiq O, Tiro J, Yopp AC, Muffler A, Marrero JA, Parikh ND, Murphy C, McCallister K, Singal AG. An assessment of benefits and harms of hepatocellular carcinoma surveillance in patients with cirrhosis. Hepatology. 2017;65:1196–1205. doi: 10.1002/hep.28895. [DOI] [PMC free article] [PubMed] [Google Scholar]
- 5.Allemani C, Matsuda T, Di Carlo V, Harewood R, Matz M, Nikšić M, Bonaventure A, Valkov M, Johnson CJ, Estève J, Ogunbiyi OJ, Azevedo E Silva G, Chen WQ, Eser S, Engholm G, Stiller CA, Monnereau A, Woods RR, Visser O, Lim GH, Aitken J, Weir HK, Coleman MP CONCORD Working Group. Global surveillance of trends in cancer survival 2000-14 (CONCORD-3): analysis of individual records for 37 513 025 patients diagnosed with one of 18 cancers from 322 population-based registries in 71 countries. Lancet. 2018;391:1023–1075. doi: 10.1016/S0140-6736(17)33326-3. [DOI] [PMC free article] [PubMed] [Google Scholar]
- 6.Yuen MF, Cheng CC, Lauder IJ, Lam SK, Ooi CG, Lai CL. Early detection of hepatocellular carcinoma increases the chance of treatment: Hong Kong experience. Hepatology. 2000;31:330–335. doi: 10.1002/hep.510310211. [DOI] [PubMed] [Google Scholar]
- 7.Bolondi L. Screening for hepatocellular carcinoma in cirrhosis. J Hepatol. 2003;39:1076–1084. doi: 10.1016/s0168-8278(03)00349-0. [DOI] [PubMed] [Google Scholar]
- 8.Yang T, Xing H, Wang G, Wang N, Liu M, Yan C, Li H, Wei L, Li S, Fan Z, Shi M, Chen W, Cai S, Pawlik TM, Soh A, Beshiri A, Lau WY, Wu M, Zheng Y, Shen F. A novel online calculator based on serum biomarkers to detect hepatocellular carcinoma among patients with hepatitis B. Clin Chem. 2019;65:1543–1553. doi: 10.1373/clinchem.2019.308965. [DOI] [PubMed] [Google Scholar]
- 9.Zhong X, Li JS, Chen ZJ, Yin JX, Gui S, Sun ZQ, Tang HS. Texture analysis of diffusion-weighted magnetic resonance imaging to identify atypically enhanced small hepatocellular carcinoma and dysplastic nodules under the background of cirrhosis. Zhonghua Gan Zang Bing Za Zhi. 2020;28:37–42. doi: 10.3760/cma.j.issn.1007-3418.2020.01.010. [DOI] [PMC free article] [PubMed] [Google Scholar]
- 10.Inchingolo R, Faletti R, Grazioli L, Tricarico E, Gatti M, Pecorelli A, Ippolito D. MR with Gd-EOB-DTPA in assessment of liver nodules in cirrhotic patients. World J Hepatol. 2018;10:462–473. doi: 10.4254/wjh.v10.i7.462. [DOI] [PMC free article] [PubMed] [Google Scholar]
- 11.Zhou XC, Chen QL, Huang CQ, Liao HL, Ren CY, He QS. The clinical application value of multi-slice spiral CT enhanced scans combined with multiplanar reformations images in preoperative T staging of rectal cancer. Medicine. 2019;98:e16374. doi: 10.1097/MD.0000000000016374. [DOI] [PMC free article] [PubMed] [Google Scholar]
- 12.Gao J, Song P. Combination of triple biomarkers AFP, AFP-L3, and PIVAKII for early detection of hepatocellular carcinoma in China: expectation. Drug Discov Ther. 2017;11:168–169. doi: 10.5582/ddt.2017.01036. [DOI] [PubMed] [Google Scholar]
- 13.Lin YJ, Lee MH, Yang HI, Jen CL, You SL, Wang LY, Lu SN, Liu J, Chen CJ. Predictability of liver-related seromarkers for the risk of hepatocellular carcinoma in chronic hepatitis B patients. PLoS One. 2013;8:e61448. doi: 10.1371/journal.pone.0061448. [DOI] [PMC free article] [PubMed] [Google Scholar]
- 14.Sharma SA, Kowgier M, Hansen BE, Brouwer WP, Maan R, Wong D, Shah H, Khalili K, Yim C, Heathcote EJ, Janssen HLA, Sherman M, Hirschfield GM, Feld JJ. Toronto HCC risk index: a validated scoring system to predict 10-year risk of HCC in patients with cirrhosis. J Hepatol. 2017:S0168-8278(17)32248-1. doi: 10.1016/j.jhep.2017.07.033. [DOI] [PubMed] [Google Scholar]
- 15.Yang HI, Yuen MF, Chan HL, Han KH, Chen PJ, Kim DY, Ahn SH, Chen CJ, Wong VW, Seto WK REACH-B Working Group. Risk estimation for hepatocellular carcinoma in chronic hepatitis B (REACH-B): development and validation of a predictive score. Lancet Oncol. 2011;12:568–574. doi: 10.1016/S1470-2045(11)70077-8. [DOI] [PubMed] [Google Scholar]
- 16.Papatheodoridis G, Dalekos G, Sypsa V, Yurdaydin C, Buti M, Goulis J, Calleja JL, Chi H, Manolakopoulos S, Mangia G, Gatselis N, Keskin O, Savvidou S, de la Revilla J, Hansen BE, Vlachogiannakos I, Galanis K, Idilman R, Colombo M, Esteban R, Janssen HL, Lampertico P. PAGE-B predicts the risk of developing hepatocellular carcinoma in Caucasians with chronic hepatitis B on 5-year antiviral therapy. J Hepatol. 2016;64:800–806. doi: 10.1016/j.jhep.2015.11.035. [DOI] [PubMed] [Google Scholar]
- 17.Raimondi S, Bruno S, Mondelli MU, Maisonneuve P. Hepatitis C virus genotype 1b as a risk factor for hepatocellular carcinoma development: a meta-analysis. J Hepatol. 2009;50:1142–1154. doi: 10.1016/j.jhep.2009.01.019. [DOI] [PubMed] [Google Scholar]
- 18.Pons M, Rodríguez-Tajes S, Esteban JI, Mariño Z, Vargas V, Lens S, Buti M, Augustin S, Forns X, Mínguez B, Genescà J. Non-invasive prediction of liver-related events in patients with HCV-associated compensated advanced chronic liver disease after oral antivirals. J Hepatol. 2020;72:472–480. doi: 10.1016/j.jhep.2019.10.005. [DOI] [PubMed] [Google Scholar]
- 19.Fan R, Papatheodoridis G, Sun J, Innes H, Toyoda H, Xie Q, Mo S, Sypsa V, Guha IN, Kumada T, Niu J, Dalekos G, Yasuda S, Barnes E, Lian J, Suri V, Idilman R, Barclay ST, Dou X, Berg T, Hayes PC, Flaherty JF, Zhou Y, Zhang Z, Buti M, Hutchinson SJ, Guo Y, Calleja JL, Lin L, Zhao L, Chen Y, Janssen HLA, Zhu C, Shi L, Tang X, Gaggar A, Wei L, Jia J, Irving WL, Johnson PJ, Lampertico P, Hou J. AMAP risk score predicts hepatocellular carcinoma development in patients with chronic hepatitis. J Hepatol. 2020;73:1368–1378. doi: 10.1016/j.jhep.2020.07.025. [DOI] [PubMed] [Google Scholar]
- 20.Chen PY, Fang AP, Wang XY, Lan QY, Liao GC, Liu ZY, Zhang DM, Zhang YY, Chen YM, Zhu HL. Adherence to the Chinese or American dietary guidelines is associated with a lower risk of primary liver cancer in China: a case-control study. Nutrients. 2018;10:1113. doi: 10.3390/nu10081113. [DOI] [PMC free article] [PubMed] [Google Scholar]
- 21.Dimitroulis D, Damaskos C, Valsami S, Davakis S, Garmpis N, Spartalis E, Athanasiou A, Moris D, Sakellariou S, Kykalos S, Tsourouflis G, Garmpi A, Delladetsima I, Kontzoglou K, Kouraklis G. From diagnosis to treatment of hepatocellular carcinoma: an epidemic problem for both developed and developing world. World J Gastroentero. 2017;23:5282–5294. doi: 10.3748/wjg.v23.i29.5282. [DOI] [PMC free article] [PubMed] [Google Scholar]
- 22.Cruz CR, Carvalho ARMR, Maranhão ACN, Aroucha DB, Foinquinos GA, Carvalho SRC, Vasconcelos LRS, Pereira LMMB. Clinical and laboratory parameters associated with li-rads as diagnostic of liver nodule in patients with cirrhosis. Transl Gastroenterol Hepatol. 2021;6:55. doi: 10.21037/tgh.2020.01.05. [DOI] [PMC free article] [PubMed] [Google Scholar]