

Abstract
Bile acids are metabolized by the gut microbiome and are involved in fat absorption. Contrary to their carcinogenic role in gastrointestinal cancers, bile acids have been reported to inhibit cancer cell proliferation in breast cancer. The microbiome of breast cancer tissues may also influence cancer proliferation. We hypothesized that bile acid metabolism reflects its accumulation and is associated with certain microbiomes, breast cancer biology, and patient survival. Transcriptomic and clinicopathological information of a total of 6050 patients in three large open primary breast cancer cohorts (GSE96058, METABRIC, TCGA) and 16S rRNA gene sequence microbiome data of breast cancer tissues in TCGA were analyzed by high and low bile acid metabolism scores calculated by gene set variation analysis (GSVA). Breast cancers with high bile acid metabolism had a significantly improved survival across all three cohorts. Metabolic pathways related to the production and regulation of bile acids were consistently enriched in high bile acid metabolism groups across all cohorts. On the other hand, the low bile acid metabolism group was associated with higher Ki67 expression and Nottingham histological grade, as well as enrichment of cell proliferation-related gene sets. Intratumoral heterogeneity, homologous recombination deficiency, mutational load, activation of cancer immunity, and infiltration of anticancer immune cells were also higher in this group. Gammaretrovirus, Hymenobacter, Anaerococcus, and Collimonas were significantly more abundant in the high bile acid metabolism group compared to Lactobacillus, Ruegeria, and Marichromatium in the low metabolism group. Surprisingly, almost all Hallmark cell proliferation-associated gene sets were highly enriched in all three microorganisms that were abundant in the low bile acid metabolism group. In conclusion, microorganisms abundant in the breast tumor microenvironment with low bile acid metabolism are associated with aggressive cancer biology, including increased cell proliferation and poor survival.
Keywords: Bile acid, BRCA, breast cancer, GSVA, microbiome, tumor microenvironment
Introduction
Primary bile acids are detergents synthesized from cholesterol in the liver, excreted into the duodenum to facilitate fat digestion, and metabolized by the intestinal microflora through deconjugation and dehydrogenation into secondary bile acids. Bile acids are reabsorbed in the small intestine, and 95% of them are returned to the liver via the portal vein, to be secreted back into bile through a cycle known as enterohepatic circulation. Secondary bile acids contribute to carcinogenesis and cancer progression in multiple gastrointestinal cancers, including colorectal cancer [1]. Contrary to gastrointestinal cancers, bile acids have been described to reduce breast cancer cell proliferation in multiple studies [2,3]. Secondary bile acids, such as lithocholic acid, induce oxidative stress by decreasing NRF2 expression [4], and also affect mitochondrial metabolism, thereby leading to induction of apoptosis in breast cancer cell lines [5-8]. Another secondary bile acid, deoxycholic acid, was shown to accumulate in breast cancer tissue, and it was negatively associated with tumor growth while being positively associated with favorable survival [9].
It is unclear how bile acids accumulate in breast cancer tissue because cells in the breast do not produce them. Secondary bile acids are all microbial metabolites, and it is possible that their presence in breast tissue may be from minimal leakage out of the enterohepatic circulation from the liver. On the other hand, a variety of gut microflora was reported to be reduced in breast cancer patients compared to healthy individuals, which resulted in decreased blood concentrations of secondary bile acids, notably lithocholic acid and cadaverine, particularly in early-stage breast cancer [6]. Meanwhile, it has been recently reported that the microbiome of breast cancer tissue is also different from that of the normal mammary gland [10,11]. Such differences in the microbiome can alter the tumor immune microenvironment in breast cancer and affect cancer proliferation [6]. These findings suggest that bile acids may be produced and metabolized not only by the gut microbiome but also by the microbiome localized in breast cancer tissues.
Our group has reported on how the activation of specific pathways relates to breast cancer biology by using bioinformatics methods to score those pathways, which include KRAS signaling [12], G2M checkpoint [13], E2F targets [14], angiogenesis [15], estrogen response [16], inflammation [17], thermogenesis [18], adipogenesis [19], and apoptosis [20]. Based on previous reports that bile acids downregulate breast cancer cell proliferation, we hypothesized that enhanced bile acid metabolism in breast cancer reflects bile acid accumulation and thus is associated with suppressed cancer cell proliferation and improved prognosis. We further hypothesized that a specific microbiome is involved in the enhancement of bile acid metabolism and affects cell proliferation in breast cancer. After a review of the current literature, this appears to be the first paper reporting on the clinical relevance of the microbiome and bile acid metabolism in the breast cancer tumor microenvironment.
Materials and methods
Cohort collection
The data of 6050 patients from the Cancer Genome Atlas (TCGA) [21], Molecular Taxonomy of Breast Cancer International Consortium (METABRIC) [22], and the Sweden Cancerome Analysis Network-Breast (SCAN-B, accession number GSE96058) [23,24] were downloaded in September 2021 and analyzed. As we have previously reported, clinical and RNA expression data of the TCGA and METABRIC cohorts were downloaded from cBiopotal [25-28]. GSE96058 data was obtained from the Gene Expression Omnibus database using the R package GEOquary [29-33]. For RNA expression data, log2 transformed RSEM were used for TCGA, log intensity ratios were used for METABRIC, and annotated RNA expression data at publication were used for GSE96058.
Bile acid metabolism score by gene set variation analysis
Bile acid metabolism score was calculated for each gene set and individual sample by gene set variation analysis (GSVA). GSVA is a gene set enrichment approach that can be used in both microarray and RNAseq data for bulk tumors. This approach assesses pathway activity by converting a sample’s expression data matrix into expression data matrices for each matching gene set [34]. We generated the bile acid metabolism activity score for each sample using the bile acid metabolism gene set consisting of 112 genes from the Molecular Signatures Database (MSigDB) Hallmark gene set [35].
Gene set enrichment analysis
Gene set enrichment analysis (GSEA) was used for functional analysis [36,37]. This is a method to examine differences in pathway expression between different phenotypes, defined by tens or hundreds of genes [38-41]. Genes are ranked based on the difference in RNA expression between two pre-defined phenotypes. The distribution is compared to the list of Hallmark gene sets provided in MSigDB [35] and evaluated by the enrichment score, which is the maximum deviation value. Briefly, the more similar the gene expression of each phenotype is to the pathway expressed in each gene set, the higher the enrichment score. High and low groups were defined by the upper and lower quartiles of the bile acid metabolism score of the cohort. Normalized enrichment score (NES), which is adjusted for the correlation between gene sets and expression data sets, was used for evaluation. The analysis was performed using the java application GSEA v4.1.0 provided by the Broad Institute, and FDR less than 0.25 was considered significant according to recommendations.
Intertumoral cell fraction estimation
XCell is an algorithm for estimating cell subsets from whole transcriptomes [42], and was used to assess intratumoral immune and stromal cell fractions, as we have previously reported [43-45]. This method is a combination of gene signature-based comparative methods with CIBERSORT, the most popular method for dissecting the tumor microenvironment from transcriptomics [46]. 64 different cell type fractions were estimated by comparing bulk tumor gene expression with 489 pre-defined gene signatures. Cytolytic activity (CYT) was measured using the geometric mean of granzyme A and Perforin 1 expression levels [47,48]. We also calculated intratumoral heterogeneity, homologous recombination deficiency, silent and non-silent mutation rate, proliferation score, tumor infiltrating lymphocyte (TIL) score, Interferon (IFN)-Response, Regulation Fraction, Lymphocyte Infiltration Signature Score, Leukocyte Fraction, TCR richness, and BCR richness using the methodology outlined by Thorsson et al. [49].
Microbiome analysis
The 16S rRNA gene sequence data of breast cancer tissue from TCGA was downloaded from cBiopotal as microbiome data [50]. The data was processed for taxonomic profiling at the time of download. For statistical assessment of the relevance of microorganisms in different phenotypes, non-parametric Wilcoxon test using the R package SIAMCAT was used to identify significantly abundant microorganisms at the genus level [51]. The check associations function of SIAMCAT was used for visualization, and the cutoff was set to the default adjusted p-value of less than 0.05.
Statistical analysis
All analyses and figure generations were performed by R (version 4.0.1). The high bile acid metabolism group was defined as the upper quartile according to a previous report on bile acids in breast cancer [9], and the low bile acid metabolism group was defined as the lower quartile. The definition of overall survival (OS) was the time from completion of treatment to any cause of death, disease-specific survival (DSS) was the time to death from breast cancer, and disease-free survival (DFS) was the time to recurrence. Survival analysis was performed by Kaplan-Meier and log-rank test, and statistical comparison of continuous variables between groups was performed by Mann-Whitney U test for two groups and Kruskal-Wallis test for multiple groups, with a cutoff value of 0.05 for statistical significance. Box-and-whisker plots were used to display the median and interquartile range.
Results
Breast cancer with elevated bile acid metabolism was associated with a better prognosis
Given the previous reports that bile acids suppress the growth of breast cancer cell lines [5-8], we investigated whether the level of bile acid metabolism in patients with breast cancer has any survival relevance. The level was estimated by gene set variation analysis using the Bile Acid Metabolism gene set, where each cohort was divided into high and low groups by the top and bottom quartiles of the scores in our previous reports [28,31,32]. As expected, breast cancer with high bile acid metabolism was associated with significantly better disease-free and disease-specific survival in the TCGA cohort. There was also a trend observed in overall survival (Figure 1: P = 0.004, 0.047, 0.057, respectively). These results were validated by both the METABRIC and GSE96058 cohorts (Figure 1: all P < 0.001 in METABRIC, and P = 0.005 in GSE96058).
Figure 1.
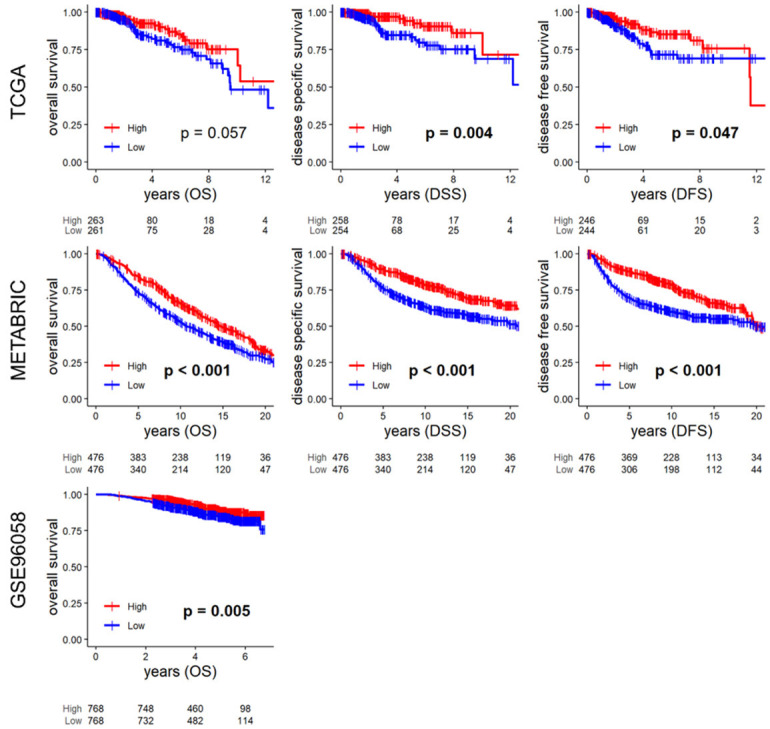
Survival analyses by bile acid metabolism score. Kaplan-Meier survival curves of the overall survival (OS), disease-specific survival (DSS), disease-free survival (DFS) in TCGA, METABRIC, and OS of the GSE96058 cohort. High and low groups were defined as the upper and lower quartiles of the bile acid metabolism score of each cohort. High groups are indicated by red lines, low groups by blue lines. Numbers at the bottom of the panels indicate the number of samples in each group. Statistical analysis was performed by Log-rank test, and P < 0.05 was considered significant.
When bile acid metabolism was compared across breast cancer subtypes, it was highest in the ER-positive/HER2-negative, Normal, and Luminal A subtypes and lowest in the triple-negative and Basal subtypes consistently in all three cohorts (Supplementary Figure 1). Somewhat surprisingly, the association of high bile acid metabolism and better survival was observed in ER-positive/HER2-negative subtype in METABRIC cohort alone, and none in the other subtypes and cohorts, may be due of too small sample sizes (Supplementary Figures 2, 3, 4).
Multiple fatty acid related metabolisms and pathways were enriched in high bile acid metabolism breast cancer
We were interested in determining which cancer biology is associated with patients’ breast cancer with elevated bile acid metabolism, since prior experimental studies suggested that bile induces oxidative stress and apoptosis in cancer cells [4-8]. Surprisingly, only one cohort had enriched Apoptosis, and neither the Reactive Oxygen Species (ROS) nor the Unfolded Protein Response (UPR) gene sets was enriched in the high bile acid metabolism group by gene set enrichment analysis (GSEA). On the other hand, bile acid metabolism, along with the fatty acid metabolism and xenobiotic metabolism gene sets, were enriched in the high bile acid metabolism group consistently across all cohorts (Figure 2A, FDR < 0.25). All the gene sets that were significantly enriched in the high bile acid metabolism group consistently in three cohorts are shown in Supplementary Figure 5. In addition, several gene sets related to bile acid production and metabolism, such as protein secretion, adipogenesis, androgen response, peroxisomes, and early estrogen response, were consistently enriched in all three cohorts (Figure 2A, all FDR < 0.25). Using the xCell algorithm, we found that adipocytes, pre-adipocytes, and lymphatic endothelial cells (LEC) were present in higher proportion in all three cohorts (Figure 2B, all P < 0.05), whereas mesangial endothelial cells (MEC) and vascular endothelial cells (VEC) were present in higher proportion only in two cohorts (Figure 2B, significance as P < 0.05).
Figure 2.
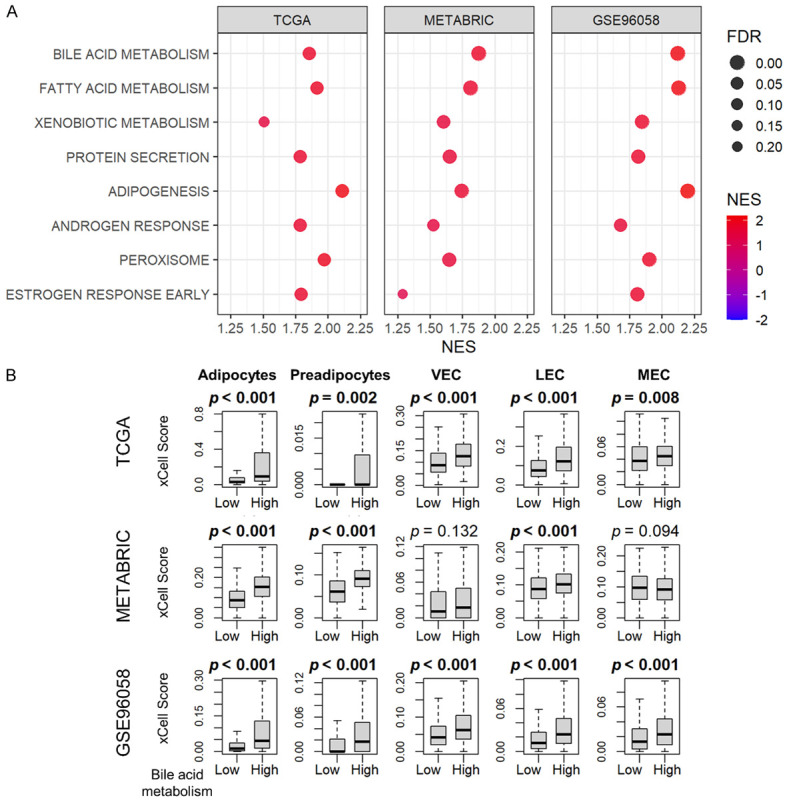
GSEA and cell fractions of the high bile acid metabolism group. A. Dot plots show the gene sets that are significantly enriched in the high bile acid metabolism group (upper quartile) by GSEA in the TCGA, METABRIC, and GSE96058 cohorts. The horizontal scale and the color of each dot indicate normalized enrichment score (NES), and the size of each dot indicates false discovery rate (FDR). FDR less than 0.25 is considered significant. B. Box-and-whisker plots show the cell fractions of adipocytes, preadipocytes, vascular endothelial cell (VEC), lymphatic endothelial cell (LEC), and mesangial endothelial cells (MEC) according to the high and low bile acid scores (upper and lower quartiles) in the TCGA, METABRIC, and GSE96058 cohorts. All two-group comparisons were performed using the Wilcoxon signed-rank test. The error bars in each boxplot show the 95% confidence interval. The line in the box shows the median, and the top and bottom show the 25th and 75th percentiles respectively.
Lower bile acid metabolism was associated with enhanced cancer cell proliferation
Although elevated bile acid metabolism has been associated with aggressive cancer biology, the mechanism underlying this association is unclear. Since understanding this mechanism could potentially impact survival, and since prior reports have suggested that bile suppresses proliferation of breast cancer cell lines [4-9], we decided to investigate the relationship between bile acid metabolism and cancer proliferation. The Nottingham histological grade correlated with decreased bile acid metabolism in the TCGA and METABRIC cohorts, but not in the GSE96058 cohort (Figure 3A). Bile acid metabolism demonstrated negative correlation with MKI67 gene expression consistently in all three cohorts. Additionally, among cell proliferation-related gene sets in the Hallmark collection, the G2M checkpoint gene set was enriched in all three cohorts, and the Myc Target v2 and Mitotic Spindle gene sets were enriched in the low bile acid metabolism group of two cohorts (Figure 3B, all FDR < 0.25). Intratumoral heterogeneity, homologous recombination deficiency, silent or non-silent mutation rate, and proliferation scores were all inversely related to bile acid metabolism in the TCGA cohort (Figure 3C, all P < 0.05). These results indicate that bile acid metabolism is inversely correlated with cancer cell proliferation in breast cancer patients, which is consistent with previous in vitro studies.
Figure 3.

The association of bile acid metabolism and Nottingham histological grade, MKi67 expression, Hallmark cell proliferation-related gene sets, intratumoral heterogeneity, HRD, and mutation rates. A. Box-and-whisker plots of bile acid metabolism score by Nottingham histological grade in the TCGA, METABRIC, and GSE96058 cohorts. Scatter plots show the correlation between MKI67 gene expression and the score. B. Dot plots show the gene sets significantly enriched in the low bile acid metabolism group (lower quartile) by GSEA in the TCGA, METABRIC, and GSE96058 cohorts. The horizontal scale and the color of each dot indicate normalized enrichment score (NES), and the size of each dot indicates false discovery rate (FDR). FDR less than 0.25 was considered significant. C. Box-and-whisker plots show intratumoral heterogeneity, homologous recombination defects (HRD), silent or non-silent mutation rate, and proliferation scores according to the high and low bile acid scores (upper and lower quartiles) in TCGA. Multiple group comparisons were performed using the Kruskal-Wallis test and two-group comparisons were performed using the Wilcoxon signed-rank test. The error bars in each boxplot show the 95% confidence interval. The line in the box shows the median, and the top and bottom show the 25th and 75th percentiles respectively.
Cancer immunity was activated and immune cells were infiltrated in low bile acid metabolism breast cancer
We have previously demonstrated that aggressive breast cancer has a high mutation rate and high immune cell infiltration [52]. Since low bile acid metabolism breast cancer was found to be highly proliferative, we decided to investigate whether it attracts immune cells. We found that components of cancer immunogenicity, such as SNV and Indel neoantigens, were significantly increased in the low bile acid metabolism group in TGCA, as were interferon gamma response, tumor infiltrating lymphocyte infiltration, and macrophage and lymphocyte infiltration scores (Figure 4A, all P < 0.05). Furthermore, CD8+ T-cells, CD4+ T-cells, and Type 1 helper T-cells (Th1) demonstrated high infiltration rates in low bile acid metabolism group tumors consistently across multiple cohorts (Figure 4B, all P < 0.05). Interestingly, low bile acid metabolism tumors had significant infiltration of M1 macrophages, whereas high bile acid metabolism tumors had more infiltration of M2 macrophages (Figure 4B, all P < 0.05). The cytolytic activity (CYT) score, which represents overall immune activity, was higher in the low bile acid metabolism group in TCGA and GSE96058 (Figure 4B). Taken together, tumors of the low bile acid metabolism group demonstrated cancer immunity activation and consistent infiltration of immune cells.
Figure 4.
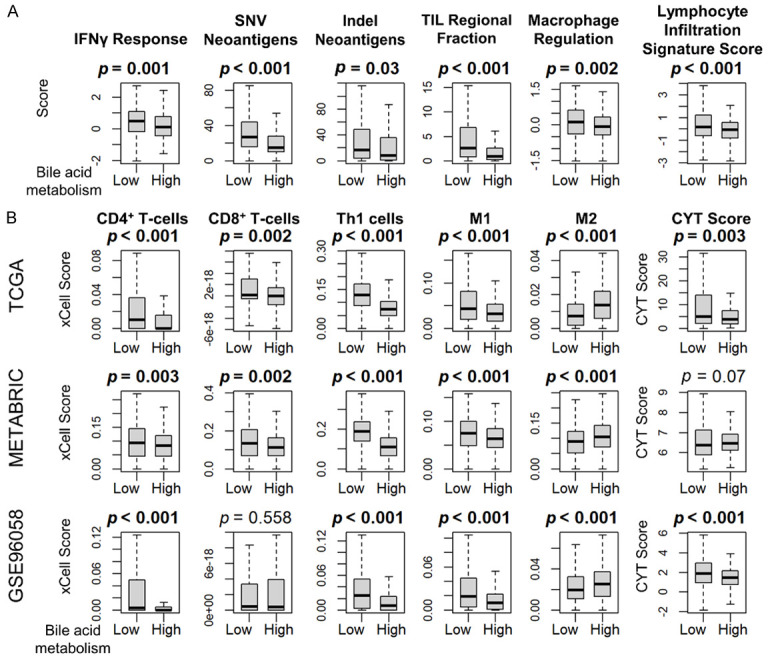
Immune activity related score and immune cell fractionation by the bile acid metabolism score. A. Box-and-whisker plots show SNV neoantigen, Indel neoantigen, interferon gamma (IFNγ) response, TIL infiltration, macrophage, and lymphocyte infiltration scores according to the high and low bile acid scores (upper and lower quartiles) in TCGA. B. Box-and-whisker plots show the cell fractions of CD8+ T-cells, CD4+ T-cells, type 1 helper T-cells (Th1), M1 and M2 macrophage, as well as cytolytic activity (CYT) score, according to the high and low bile acid score (upper and lower quartiles) in the TCGA, METABRIC, and GSE96058 cohorts. All two-group comparisons were performed using the Wilcoxon signed-rank test. The error bars in each boxplot show the 95% confidence interval. The line in the box shows the median, and the top and bottom show the 25th and 75th percentiles respectively.
Only seven bacterial species demonstrated a significant difference in abundance between the high and low bile acid metabolism breast cancer tumor microenvironments
Based upon the fact that bile is metabolized by microorganisms in the intestine, we hypothesized that the microbiome is involved in bile acid metabolism in the tumor microenvironment. Microorganisms were quantified using 16S RNA sequencing data available in the TCGA cohort. Contrary to our expectation, there was no significant difference in taxonomic composition at the phylum level. We found that Aeromonadaceae at the family level and Aeromonas at the genus level were more abundant in low bile acid metabolism breast cancer (Figure 5A). When we compared the high and low bile acid metabolism groups, Gammaretrovirus, Hymenobacter, Anaerococcus, and Collimonas were significantly more abundant in the high group, whereas Lactobacillus, Ruegeria, and Marichromatium were more abundant in the low group (Figure 5B).
Figure 5.
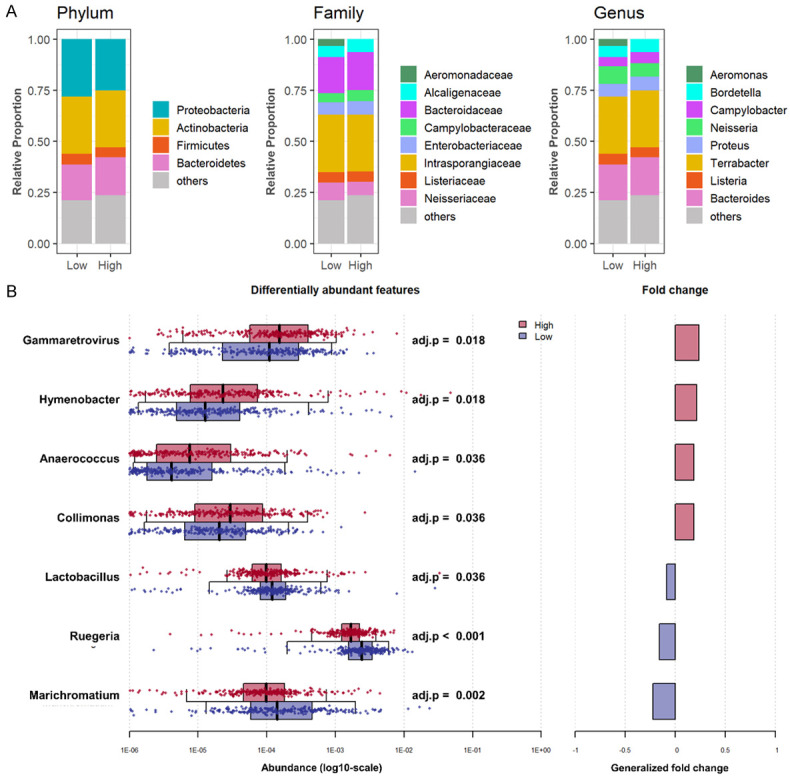
Difference in the microbiome between high and low bile acid metabolism breast cancer. A. The Bar plots show the percentage breakdown of microbiome composition at the Phylum, Family, and Genus levels in the high and low bile acid metabolism groups (upper and lower quartiles) in TCGA. B. Univariate association between high and low bile acid metabolism. Boxplots in the left panel show the distribution of the microbial abundance of the high (red) and low (blue) groups. The median is represented by a black line in the box, with whiskers extending up to the most extreme points within a 1.5-fold interquartile range, and adj. P < 0.05 was adopted as significant. Generalized fold change is shown in the right panel.
Breast cancers containing microorganisms abundant in the low bile acid metabolism group showed enrichment of multiple cancer proliferation-related gene sets
As above, Gammaretrovirus, Hymenobacter, Anaerococcus, and Collimonas appear to be more abundant in the high bile acid metabolism group, whereas Lactobacillus, Ruegeria, and Marichromatium are more abundant in the low bile acid metabolism group. Given the clinical relevance of bile acid metabolism, we hypothesized that the abundance of each microorganism is associated with features of cancer biology. Therefore, we investigated the characteristics of each microbial species-rich group using GSEA with the median content as the cutoff. There was no pathway commonly enriched in the four microorganisms specific to the high bile acid metabolism group (Figure 6A, all FDR < 0.25). On the other hand, surprisingly, almost all Hallmark cell proliferation-associated gene sets, such as the G2M checkpoint, E2F targets, and Myc targets v1 and v2, were enriched in all three microbial-rich groups specific to low bile acid metabolism (Figure 6B, all FDR < 0.25). Our results suggest that the microorganisms abundant in low bile acid metabolism cancer are strongly associated with cell proliferation and that the ones abundant in high bile acid metabolism are not.
Figure 6.
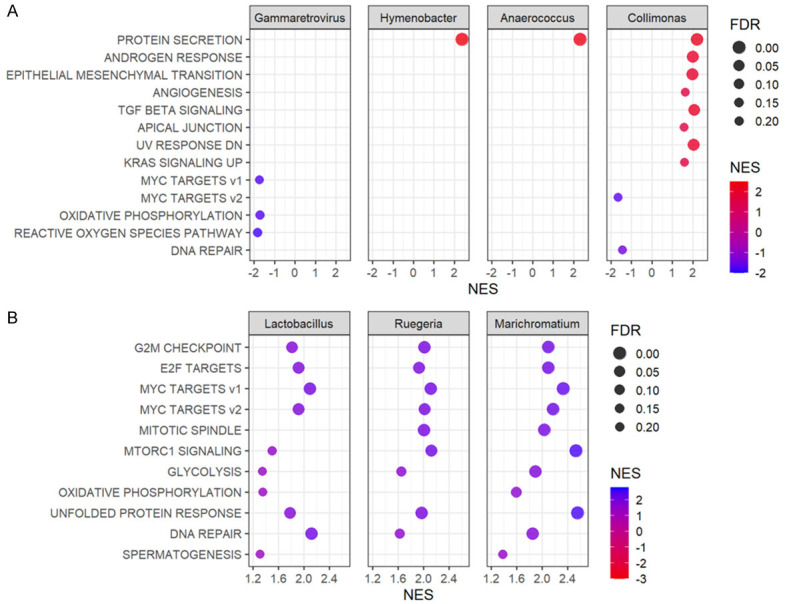
GSEA by bacterial species specific to high and low bile acid metabolism groups. (A) Dot plots show the gene sets significantly enriched by GSEA in groups with high or low abundances (median cutoff) of Gammaretrovirus, Hymenobacter, Anaerococcus, and Collimonas which were specific to the high bile acid metabolism group in TCGA. (B) Dot plots show the gene sets significantly enriched by GSEA in groups with high or low abundances (median cutoff) of Lactobacillus, Ruegeria, and Marichromatium which were specific to the low bile acid metabolism group in TCGA. The horizontal scale and the color of each dot indicate normalized enrichment score (NES) (high values are shown in red and low in blue in A, and vice versa in B), and the size of each dot indicates false discovery rate (FDR). FDR less than 0.25 is considered significant.
Discussion
In this study, we found that low bile acid metabolism in breast cancer is associated with poor prognosis and that the microbiome of breast cancer patients with reduced bile acid metabolism is associated with enhanced cancer cell proliferation. We hypothesized that activation of bile acid metabolism is associated with a better prognosis based on previous reports regarding the antitumor effects of bile acids in breast cancer cells. We found that survival was significantly improved in the high bile acid metabolism group, which was validated by three large breast cancer cohorts. We expected that oxidative stress-induced apoptosis in the high bile acid metabolism group would lead to improved survival, although the Apoptosis, ROS, and UPR gene sets were not found to be enriched in this group. Several metabolic pathways and pathways associated with bile acid production and regulation, however, were enriched. On the other hand, Ki67 and Nottingham histological grade were higher, and several cell proliferation-related gene sets were upregulated in the low bile acid metabolism group, especially the G2M checkpoint in all cohorts, indicating this group had aggressive and poor prognostic features. In association with the higher cell proliferation, the low bile acid metabolism group showed higher mutation load, immune activation, and infiltration of anti-cancer immune cells. Given the biology of the groups with high and low bile acid metabolism, we expected that the composition of the microbiome in each group would be associated with the characteristics of the group. We found four species that demonstrated significant abundance in the high bile acid metabolism group and three species in the low bile acid metabolism group. Surprisingly, almost all of the cell proliferation-related gene sets from MSigDB Hallmark were enriched in the three microorganisms-rich groups specific for low bile acid metabolism breast cancer. This was not the case for the microorganisms specific to high bile acid metabolism. To this end, clinical relevance of bile acid metabolism in breast cancer is that low bile acid metabolism with abundant Lactobacillus, Ruegeria, and Marichromatium is associated with highly proliferative cancer and worse survival, rather than the growth suppression effect of bile acids.
Bile acids have been reported to possess antitumor effects on breast cancer in both cell lines and patient tissues; Alasmael et al. reported that chenodeoxycholic acid (CDC) and deoxycholic acid (DC) decreased the long-term survival of MCF-7 cells [8], and Tang et al. reported that DC inhibited the proliferation of the Luminal A breast cancer cell line at concentrations as high as in breast tissue [9]. Lithocholic acid (LCA) induces oxidative stress and apoptosis through several pathways including downregulation of NRF2 and activation of TGR5 [53]. In addition to regulation of oxidative phosphorylation, LCA induces anti-tumor immune responses, suppresses proliferation and metastasis [3], and is inversely correlated with Ki67 in breast cancer tissues [54]. On the other hand, some groups reported that DC promoted breast cancer cell survival by reducing pro-apoptotic ceramides [55,56]. We found that activated bile acid metabolism breast cancer patients had a better prognosis. Assuming that accumulation of bile acids results in elevated bile acid metabolism, we speculated that cancer cells with high bile acid metabolism induce apoptosis and improve survival, but surprisingly, upregulation of apoptosis-related pathways was seen only in one cohort, and it was not validated by the others. In contrast, fatty acid metabolism, protein secretion, androgen response, peroxisome, and other pathways associated with bile acid function were all enriched in all cohorts. These results support the notion that the bile acid metabolism score reflects bile acid accumulation in the breast tumor microenvironment.
Pathways associated with cancer cell proliferation are enriched in the low bile acid metabolism group. This is consistent with prior studies and with clinical cancer aggressiveness as measured by Ki67 and Nottingham histological grade, which were both increased in this group. These results led us to speculate that higher cell proliferation in the low bile acid group may be responsible for the poor prognosis. Indeed, the low bile acid metabolism group had a higher mutational burden, with a significant increase of immune-related scores and a more abundant infiltration of cancer-associated immune cells. This is consistent with our previous report that breast cancers with a high degree of proliferation and mutation will have higher immunogenicity [20].
The microbiome in breast cancer is an emerging field, and it has been reported that the composition of the cancer microbiome differs from that of the normal mammary gland [57-61]. The predominant bacterial phyla in breast cancer tissues compared to tissues of the normal gland were Proteobacteria, followed by Firmicutes and Actinobacteria, which is consistent with previous reports [10,62]. However, the abundance of these predominant microbial species did not differ between high and low bile acid metabolism groups. Surprisingly, all cell proliferation-related gene sets were enriched in the low bile acid metabolism group as well as in all three of the microorganisms abundant in this group. This result makes us speculate that the presence of these microorganisms may be involved in the suppression of bile acid metabolism and proliferation of breast cancer. On the other hand, Lactobacillus, which was most abundant in the low bile acid metabolism group, has been reported to exhibit antitumor effects in colon cancer model [63]. Since bile acids have opposite effects in colorectal cancer and breast cancer, it may be that these species also have opposite effects in each cancer type. With further studies, the microbiome profile may be developed as a biomarker for susceptibility and/or to help guide prognosis of breast cancer in the future.
Limitations in this study are described as follows. First, this study is an entirely in silico bioinformatics study with public cohorts and does not include any bench experiments. Therefore, we do not know the mechanism by which bile acids activate bile acid metabolism or how they affect breast cancer cells in experiments with matched background conditions. Based on the results of this study, the next steps to consider would be to elucidate how these microorganisms settle in the breast tissue and the causality of the functions identified in this study. The microbiome data depended on a single cohort, because TCGA was the only cohort that included 16S RNA sequencing data of breast specimens, and we unfortunately did not have access to other large cohorts to use as validation. It would be ideal to validate our findings by our own institutional data; however, only data from public cohorts were included in this study because we do not have robust enough cohort with 16S sequence to obtain statistically meaningful results. Furthermore, all patient information was collected retrospectively, and selection bias by each cohort is inevitable. Prospective patient studies will be required to elucidate the relationship between bile acids and the breast microbiome.
Conclusion
Microorganisms abundant in a low bile acid metabolism breast tumor microenvironment are associated with aggressive cancer biology, including cell proliferation and poor survival.
Acknowledgements
This research was supported by US National Institutes of Health; R37CA248018, R01CA250412, R01CA251545, R01EB029596, as well as US Department of Defense BCRP grants; W81XWH-19-1-0674 and W81XWH-19-1-0111 to K. T. National Cancer Institute cancer center support grant P30CA016056 supports Roswell Park Comprehensive Cancer Center.
Disclosure of conflict of interest
None.
Supporting Information
References
- 1.Schramm G, Surmann EM, Wiesberg S, Oswald M, Reinelt G, Eils R, Konig R. Analyzing the regulation of metabolic pathways in human breast cancer. BMC Med Genomics. 2010;3:39. doi: 10.1186/1755-8794-3-39. [DOI] [PMC free article] [PubMed] [Google Scholar]
- 2.Dieleman S, Aarnoutse R, Ziemons J, Kooreman L, Boleij A, Smidt M. Exploring the potential of breast microbiota as biomarker for breast cancer and therapeutic response. Am J Pathol. 2021;191:968–982. doi: 10.1016/j.ajpath.2021.02.020. [DOI] [PubMed] [Google Scholar]
- 3.Miko E, Kovacs T, Sebo E, Toth J, Csonka T, Ujlaki G, Sipos A, Szabo J, Mehes G, Bai P. Microbiome-microbial metabolome-cancer cell interactions in breast cancer-familiar, but unexplored. Cells. 2019;8:293. doi: 10.3390/cells8040293. [DOI] [PMC free article] [PubMed] [Google Scholar]
- 4.Perez MJ, Briz O. Bile-acid-induced cell injury and protection. World J Gastroenterol. 2009;15:1677–1689. doi: 10.3748/wjg.15.1677. [DOI] [PMC free article] [PubMed] [Google Scholar]
- 5.Arnone AA, Cline JM, Soto-Pantoja DR, Cook KL. Investigating the role of endogenous estrogens, hormone replacement therapy, and blockade of estrogen receptor-alpha activity on breast metabolic signaling. Breast Cancer Res Treat. 2021;190:53–67. doi: 10.1007/s10549-021-06354-w. [DOI] [PMC free article] [PubMed] [Google Scholar]
- 6.Miko E, Vida A, Kovacs T, Ujlaki G, Trencsenyi G, Marton J, Sari Z, Kovacs P, Boratko A, Hujber Z, Csonka T, Antal-Szalmas P, Watanabe M, Gombos I, Csoka B, Kiss B, Vigh L, Szabo J, Mehes G, Sebestyen A, Goedert JJ, Bai P. Lithocholic acid, a bacterial metabolite reduces breast cancer cell proliferation and aggressiveness. Biochim Biophys Acta Bioenerg. 2018;1859:958–974. doi: 10.1016/j.bbabio.2018.04.002. [DOI] [PubMed] [Google Scholar]
- 7.Phelan JP, Reen FJ, Dunphy N, O’Connor R, O’Gara F. Bile acids destabilise HIF-1alpha and promote anti-tumour phenotypes in cancer cell models. BMC Cancer. 2016;16:476. doi: 10.1186/s12885-016-2528-2. [DOI] [PMC free article] [PubMed] [Google Scholar]
- 8.Alasmael N, Mohan R, Meira LB, Swales KE, Plant NJ. Activation of the Farnesoid X-receptor in breast cancer cell lines results in cytotoxicity but not increased migration potential. Cancer Lett. 2016;370:250–259. doi: 10.1016/j.canlet.2015.10.031. [DOI] [PubMed] [Google Scholar]
- 9.Tang W, Putluri V, Ambati CR, Dorsey TH, Putluri N, Ambs S. Liver- and microbiome-derived bile acids accumulate in human breast tumors and inhibit growth and improve patient survival. Clin Cancer Res. 2019;25:5972–5983. doi: 10.1158/1078-0432.CCR-19-0094. [DOI] [PMC free article] [PubMed] [Google Scholar]
- 10.Tzeng A, Sangwan N, Jia M, Liu CC, Keslar KS, Downs-Kelly E, Fairchild RL, Al-Hilli Z, Grobmyer SR, Eng C. Human breast microbiome correlates with prognostic features and immunological signatures in breast cancer. Genome Med. 2021;13:60. doi: 10.1186/s13073-021-00874-2. [DOI] [PMC free article] [PubMed] [Google Scholar]
- 11.Costantini L, Magno S, Albanese D, Donati C, Molinari R, Filippone A, Masetti R, Merendino N. Characterization of human breast tissue microbiota from core needle biopsies through the analysis of multi hypervariable 16S-rRNA gene regions. Sci Rep. 2018;8:16893. doi: 10.1038/s41598-018-35329-z. [DOI] [PMC free article] [PubMed] [Google Scholar]
- 12.Tokumaru Y, Oshi M, Katsuta E, Yan L, Satyananda V, Matsuhashi N, Futamura M, Akao Y, Yoshida K, Takabe K. KRAS signaling enriched triple negative breast cancer is associated with favorable tumor immune microenvironment and better survival. Am J Cancer Res. 2020;10:897–907. [PMC free article] [PubMed] [Google Scholar]
- 13.Oshi M, Takahashi H, Tokumaru Y, Yan L, Rashid OM, Matsuyama R, Endo I, Takabe K. G2M cell cycle pathway score as a prognostic biomarker of metastasis in estrogen receptor (ER)-positive breast cancer. Int J Mol Sci. 2020;21:2921. doi: 10.3390/ijms21082921. [DOI] [PMC free article] [PubMed] [Google Scholar]
- 14.Oshi M, Takahashi H, Tokumaru Y, Yan L, Rashid OM, Nagahashi M, Matsuyama R, Endo I, Takabe K. The E2F pathway score as a predictive biomarker of response to neoadjuvant therapy in ER+/HER2- breast cancer. Cells. 2020;9:1643. doi: 10.3390/cells9071643. [DOI] [PMC free article] [PubMed] [Google Scholar]
- 15.Oshi M, Newman S, Tokumaru Y, Yan L, Matsuyama R, Endo I, Nagahashi M, Takabe K. Intra-tumoral angiogenesis is associated with inflammation, immune reaction and metastatic recurrence in breast cancer. Int J Mol Sci. 2020;21:6708. doi: 10.3390/ijms21186708. [DOI] [PMC free article] [PubMed] [Google Scholar]
- 16.Oshi M, Tokumaru Y, Angarita FA, Yan L, Matsuyama R, Endo I, Takabe K. Degree of early estrogen response predict survival after endocrine therapy in primary and metastatic ER-positive breast cancer. Cancers (Basel) 2020;12:3557. doi: 10.3390/cancers12123557. [DOI] [PMC free article] [PubMed] [Google Scholar]
- 17.Oshi M, Newman S, Tokumaru Y, Yan L, Matsuyama R, Endo I, Takabe K. Inflammation is associated with worse outcome in the whole cohort but with better outcome in triple-negative subtype of breast cancer patients. J Immunol Res. 2020;2020:5618786. doi: 10.1155/2020/5618786. [DOI] [PMC free article] [PubMed] [Google Scholar]
- 18.Gandhi S, Oshi M, Murthy V, Repasky EA, Takabe K. Enhanced thermogenesis in triple-negative breast cancer is associated with pro-tumor immune microenvironment. Cancers (Basel) 2021;13:2559. doi: 10.3390/cancers13112559. [DOI] [PMC free article] [PubMed] [Google Scholar]
- 19.Oshi M, Tokumaru Y, Angarita FA, Lee L, Yan L, Matsuyama R, Endo I, Takabe K. Adipogenesis in triple-negative breast cancer is associated with unfavorable tumor immune microenvironment and with worse survival. Sci Rep. 2021;11:12541. doi: 10.1038/s41598-021-91897-7. [DOI] [PMC free article] [PubMed] [Google Scholar]
- 20.Murthy V, Oshi M, Tokumaru Y, Endo I, Takabe K. Increased apoptosis is associated with robust immune cell infiltration and cytolytic activity in breast cancer. Am J Cancer Res. 2021;11:3674–3687. [PMC free article] [PubMed] [Google Scholar]
- 21.Cancer Genome Atlas Network. Comprehensive molecular portraits of human breast tumours. Nature. 2012;490:61–70. doi: 10.1038/nature11412. [DOI] [PMC free article] [PubMed] [Google Scholar]
- 22.Curtis C, Shah SP, Chin SF, Turashvili G, Rueda OM, Dunning MJ, Speed D, Lynch AG, Samarajiwa S, Yuan Y, Graf S, Ha G, Haffari G, Bashashati A, Russell R, McKinney S METABRIC Group. Langerød A, Green A, Provenzano E, Wishart G, Pinder S, Watson P, Markowetz F, Murphy L, Ellis I, Purushotham A, Børresen-Dale AL, Brenton JD, Tavare S, Caldas C, Aparicio S. The genomic and transcriptomic architecture of 2,000 breast tumours reveals novel subgroups. Nature. 2012;486:346–352. doi: 10.1038/nature10983. [DOI] [PMC free article] [PubMed] [Google Scholar]
- 23.Brueffer C, Gladchuk S, Winter C, Vallon-Christersson J, Hegardt C, Hakkinen J, George AM, Chen Y, Ehinger A, Larsson C, Loman N, Malmberg M, Ryden L, Borg A, Saal LH. The mutational landscape of the SCAN-B real-world primary breast cancer transcriptome. EMBO Mol Med. 2020;12:e12118. doi: 10.15252/emmm.202012118. [DOI] [PMC free article] [PubMed] [Google Scholar]
- 24.Brueffer C, Vallon-Christersson J, Grabau D, Ehinger A, Hakkinen J, Hegardt C, Malina J, Chen Y, Bendahl PO, Manjer J, Malmberg M, Larsson C, Loman N, Ryden L, Borg A, Saal LH. Clinical value of RNA sequencing-based classifiers for prediction of the five conventional breast cancer biomarkers: a report from the population-based multicenter sweden cancerome analysis network-breast initiative. JCO Precis Oncol. 2018;2:PO.17.00135. doi: 10.1200/PO.17.00135. [DOI] [PMC free article] [PubMed] [Google Scholar]
- 25.Oshi M, Gandhi S, Huyser MR, Tokumaru Y, Yan L, Yamada A, Matsuyama R, Endo I, Takabe K. MELK expression in breast cancer is associated with infiltration of immune cell and pathological compete response (pCR) after neoadjuvant chemotherapy. Am J Cancer Res. 2021;11:4421–4437. [PMC free article] [PubMed] [Google Scholar]
- 26.Chouliaras K, Oshi M, Asaoka M, Tokumaru Y, Khoury T, Endo I, Ishikawa T, Takabe K. Increased intratumor heterogeneity, angiogenesis and epithelial to mesenchymal transition pathways in metaplastic breast cancer. Am J Cancer Res. 2021;11:4408–4420. [PMC free article] [PubMed] [Google Scholar]
- 27.Oshi M, Kawaguchi T, Yan L, Peng X, Qi Q, Tian W, Schulze A, McDonald KA, Narayanan S, Young J, Liu S, Morris LG, Chan TA, Kalinski P, Matsuyama R, Otsuji E, Endo I, Takabe K. Immune cytolytic activity is associated with reduced intra-tumoral genetic heterogeneity and with better clinical outcomes in triple negative breast cancer. Am J Cancer Res. 2021;11:3628–3644. [PMC free article] [PubMed] [Google Scholar]
- 28.Oshi M, Gandhi S, Angarita FA, Kim TH, Tokumaru Y, Yan L, Matsuyama R, Endo I, Takabe K. A novel five-gene score to predict complete pathological response to neoadjuvant chemotherapy in ER-positive/HER2-negative breast cancer. Am J Cancer Res. 2021;11:3611–3627. [PMC free article] [PubMed] [Google Scholar]
- 29.Oshi M, Asaoka M, Tokumaru Y, Angarita FA, Yan L, Matsuyama R, Zsiros E, Ishikawa T, Endo I, Takabe K. Abundance of regulatory T cell (Treg) as a predictive biomarker for neoadjuvant chemotherapy in triple-negative breast cancer. Cancers (Basel) 2020;12:3038. doi: 10.3390/cancers12103038. [DOI] [PMC free article] [PubMed] [Google Scholar]
- 30.Oshi M, Angarita FA, Tokumaru Y, Yan L, Matsuyama R, Endo I, Takabe K. High expression of NRF2 is associated with increased tumor-infiltrating lymphocytes and cancer immunity in ER-positive/HER2-negative breast cancer. Cancers (Basel) 2020;12:3856. doi: 10.3390/cancers12123856. [DOI] [PMC free article] [PubMed] [Google Scholar]
- 31.Oshi M, Gandhi S, Tokumaru Y, Yan L, Yamada A, Matsuyama R, Ishikawa T, Endo I, Takabe K. Conflicting roles of EGFR expression by subtypes in breast cancer. Am J Cancer Res. 2021;11:5094–5110. [PMC free article] [PubMed] [Google Scholar]
- 32.Satyananda V, Oshi M, Endo I, Takabe K. High BRCA2 gene expression is associated with aggressive and highly proliferative breast cancer. Ann Surg Oncol. 2021;28:7356–7365. doi: 10.1245/s10434-021-10063-5. [DOI] [PubMed] [Google Scholar]
- 33.McDonald KA, Oshi M, Kawaguchi T, Qi Q, Peng X, Yamada A, Opyrchal M, Liu S, Yao S, Otsuji E, Yan L, Endo I, Takabe K. Development of KAM score to predict metastasis and worse survival in breast cancer. Am J Cancer Res. 2021;11:5388–5401. [PMC free article] [PubMed] [Google Scholar]
- 34.Hanzelmann S, Castelo R, Guinney J. GSVA: gene set variation analysis for microarray and RNA-seq data. BMC Bioinformatics. 2013;14:7. doi: 10.1186/1471-2105-14-7. [DOI] [PMC free article] [PubMed] [Google Scholar]
- 35.Liberzon A, Birger C, Thorvaldsdottir H, Ghandi M, Mesirov JP, Tamayo P. The molecular signatures database (MSigDB) hallmark gene set collection. Cell Syst. 2015;1:417–425. doi: 10.1016/j.cels.2015.12.004. [DOI] [PMC free article] [PubMed] [Google Scholar]
- 36.Subramanian A, Tamayo P, Mootha VK, Mukherjee S, Ebert BL, Gillette MA, Paulovich A, Pomeroy SL, Golub TR, Lander ES, Mesirov JP. Gene set enrichment analysis: a knowledge-based approach for interpreting genome-wide expression profiles. Proc Natl Acad Sci U S A. 2005;102:15545–15550. doi: 10.1073/pnas.0506580102. [DOI] [PMC free article] [PubMed] [Google Scholar]
- 37.Mootha VK, Lindgren CM, Eriksson KF, Subramanian A, Sihag S, Lehar J, Puigserver P, Carlsson E, Ridderstrale M, Laurila E, Houstis N, Daly MJ, Patterson N, Mesirov JP, Golub TR, Tamayo P, Spiegelman B, Lander ES, Hirschhorn JN, Altshuler D, Groop LC. PGC-1alpha-responsive genes involved in oxidative phosphorylation are coordinately downregulated in human diabetes. Nat Genet. 2003;34:267–273. doi: 10.1038/ng1180. [DOI] [PubMed] [Google Scholar]
- 38.Tokumaru Y, Oshi M, Patel A, Katsuta E, Yan L, Angarita FA, Dasgupta S, Nagahashi M, Matsuhashi N, Futamura M, Yoshida K, Takabe K. Low expression of miR-195 is associated with cell proliferation, glycolysis and poor survival in estrogen receptor (ER)-positive but not in triple negative breast cancer. Am J Cancer Res. 2021;11:3320–3334. [PMC free article] [PubMed] [Google Scholar]
- 39.Tokumaru Y, Oshi M, Murthy V, Tian W, Yan L, Angarita FA, Nagahashi M, Matsuhashi N, Futamura M, Yoshida K, Miyoshi Y, Takabe K. Low intratumoral genetic neutrophil-to-lymphocyte ratio (NLR) is associated with favorable tumor immune microenvironment and with survival in triple negative breast cancer (TNBC) Am J Cancer Res. 2021;11:5743–5755. [PMC free article] [PubMed] [Google Scholar]
- 40.Oshi M, Patel A, Le L, Tokumaru Y, Yan L, Matsuyama R, Endo I, Takabe K. G2M checkpoint pathway alone is associated with drug response and survival among cell proliferation-related pathways in pancreatic cancer. Am J Cancer Res. 2021;11:3070–3084. [PMC free article] [PubMed] [Google Scholar]
- 41.Huang JL, Oshi M, Endo I, Takabe K. Clinical relevance of stem cell surface markers CD133, CD24, and CD44 in colorectal cancer. Am J Cancer Res. 2021;11:5141–5154. [PMC free article] [PubMed] [Google Scholar]
- 42.Aran D, Hu Z, Butte AJ. XCell: digitally portraying the tissue cellular heterogeneity landscape. Genome Biol. 2017;18:220. doi: 10.1186/s13059-017-1349-1. [DOI] [PMC free article] [PubMed] [Google Scholar]
- 43.Tokumaru Y, Oshi M, Huyser MR, Yan L, Fukada M, Matsuhashi N, Futamura M, Akao Y, Yoshida K, Takabe K. Low expression of miR-29a is associated with aggressive biology and worse survival in gastric cancer. Sci Rep. 2021;11:14134. doi: 10.1038/s41598-021-93681-z. [DOI] [PMC free article] [PubMed] [Google Scholar]
- 44.Katsuta E, Huyser M, Yan L, Takabe K. A prognostic score based on long-term survivor unique transcriptomic signatures predicts patient survival in pancreatic ductal adenocarcinoma. Am J Cancer Res. 2021;11:4294–4307. [PMC free article] [PubMed] [Google Scholar]
- 45.Asaoka M, Patnaik SK, Ishikawa T, Takabe K. Different members of the APOBEC3 family of DNA mutators have opposing associations with the landscape of breast cancer. Am J Cancer Res. 2021;11:5111–5125. [PMC free article] [PubMed] [Google Scholar]
- 46.Newman AM, Liu CL, Green MR, Gentles AJ, Feng W, Xu Y, Hoang CD, Diehn M, Alizadeh AA. Robust enumeration of cell subsets from tissue expression profiles. Nat Methods. 2015;12:453–457. doi: 10.1038/nmeth.3337. [DOI] [PMC free article] [PubMed] [Google Scholar]
- 47.Narayanan S, Kawaguchi T, Yan L, Peng X, Qi Q, Takabe K. Cytolytic activity score to assess anticancer immunity in colorectal cancer. Ann Surg Oncol. 2018;25:2323–2331. doi: 10.1245/s10434-018-6506-6. [DOI] [PMC free article] [PubMed] [Google Scholar]
- 48.Takahashi H, Kawaguchi T, Yan L, Peng X, Qi Q, Morris LGT, Chan TA, Tsung A, Otsuji E, Takabe K. Immune cytolytic activity for comprehensive understanding of immune landscape in hepatocellular carcinoma. Cancers (Basel) 2020;12:1221. doi: 10.3390/cancers12051221. [DOI] [PMC free article] [PubMed] [Google Scholar]
- 49.Thorsson V, Gibbs DL, Brown SD, Wolf D, Bortone DS, Ou Yang TH, Porta-Pardo E, Gao GF, Plaisier CL, Eddy JA, Ziv E, Culhane AC, Paull EO, Sivakumar IKA, Gentles AJ, Malhotra R, Farshidfar F, Colaprico A, Parker JS, Mose LE, Vo NS, Liu J, Liu Y, Rader J, Dhankani V, Reynolds SM, Bowlby R, Califano A, Cherniack AD, Anastassiou D, Bedognetti D, Mokrab Y, Newman AM, Rao A, Chen K, Krasnitz A, Hu H, Malta TM, Noushmehr H, Pedamallu CS, Bullman S, Ojesina AI, Lamb A, Zhou W, Shen H, Choueiri TK, Weinstein JN, Guinney J, Saltz J, Holt RA, Rabkin CS Cancer Genome Atlas Research Network. Lazar AJ, Serody JS, Demicco EG, Disis ML, Vincent BG, Shmulevich I. The immune landscape of cancer. Immunity. 2019;51:411–412. doi: 10.1016/j.immuni.2019.08.004. [DOI] [PubMed] [Google Scholar]
- 50.Poore GD, Kopylova E, Zhu Q, Carpenter C, Fraraccio S, Wandro S, Kosciolek T, Janssen S, Metcalf J, Song SJ, Kanbar J, Miller-Montgomery S, Heaton R, McKay R, Patel SP, Swafford AD, Knight R. Microbiome analyses of blood and tissues suggest cancer diagnostic approach. Nature. 2020;579:567–574. doi: 10.1038/s41586-020-2095-1. [DOI] [PMC free article] [PubMed] [Google Scholar] [Retracted]
- 51.Wirbel J, Zych K, Essex M, Karcher N, Kartal E, Salazar G, Bork P, Sunagawa S, Zeller G. Microbiome meta-analysis and cross-disease comparison enabled by the SIAMCAT machine learning toolbox. Genome Biol. 2021;22:93. doi: 10.1186/s13059-021-02306-1. [DOI] [PMC free article] [PubMed] [Google Scholar]
- 52.Takahashi H, Asaoka M, Yan L, Rashid OM, Oshi M, Ishikawa T, Nagahashi M, Takabe K. Biologically aggressive phenotype and anti-cancer immunity counterbalance in breast cancer with high mutation rate. Sci Rep. 2020;10:1852. doi: 10.1038/s41598-020-58995-4. [DOI] [PMC free article] [PubMed] [Google Scholar]
- 53.Kovacs P, Csonka T, Kovacs T, Sari Z, Ujlaki G, Sipos A, Karanyi Z, Szeocs D, Hegedus C, Uray K, Janko L, Kiss M, Kiss B, Laoui D, Virag L, Mehes G, Bai P, Miko E. Lithocholic acid, a metabolite of the microbiome, increases oxidative stress in breast cancer. Cancers (Basel) 2019;11:1255. doi: 10.3390/cancers11091255. [DOI] [PMC free article] [PubMed] [Google Scholar]
- 54.Tang X, Lin CC, Spasojevic I, Iversen ES, Chi JT, Marks JR. A joint analysis of metabolomics and genetics of breast cancer. Breast Cancer Res. 2014;16:415. doi: 10.1186/s13058-014-0415-9. [DOI] [PMC free article] [PubMed] [Google Scholar]
- 55.Krishnamurthy K, Wang G, Rokhfeld D, Bieberich E. Deoxycholate promotes survival of breast cancer cells by reducing the level of pro-apoptotic ceramide. Breast Cancer Res. 2008;10:R106. doi: 10.1186/bcr2211. [DOI] [PMC free article] [PubMed] [Google Scholar]
- 56.Spassieva S, Bieberich E. The gut-to-breast connection-interdependence of sterols and sphingolipids in multidrug resistance and breast cancer therapy. Anticancer Agents Med Chem. 2011;11:882–890. doi: 10.2174/187152011797655168. [DOI] [PubMed] [Google Scholar]
- 57.Meng S, Chen B, Yang J, Wang J, Zhu D, Meng Q, Zhang L. Study of microbiomes in aseptically collected samples of human breast tissue using needle biopsy and the potential role of in situ tissue microbiomes for promoting malignancy. Front Oncol. 2018;8:318. doi: 10.3389/fonc.2018.00318. [DOI] [PMC free article] [PubMed] [Google Scholar]
- 58.Banerjee S, Tian T, Wei Z, Shih N, Feldman MD, Peck KN, DeMichele AM, Alwine JC, Robertson ES. Distinct microbial signatures associated with different breast cancer types. Front Microbiol. 2018;9:951. doi: 10.3389/fmicb.2018.00951. [DOI] [PMC free article] [PubMed] [Google Scholar]
- 59.Wang H, Altemus J, Niazi F, Green H, Calhoun BC, Sturgis C, Grobmyer SR, Eng C. Breast tissue, oral and urinary microbiomes in breast cancer. Oncotarget. 2017;8:88122–88138. doi: 10.18632/oncotarget.21490. [DOI] [PMC free article] [PubMed] [Google Scholar]
- 60.Urbaniak C, Gloor GB, Brackstone M, Scott L, Tangney M, Reid G. The microbiota of breast tissue and its association with breast cancer. Appl Environ Microbiol. 2016;82:5039–5048. doi: 10.1128/AEM.01235-16. [DOI] [PMC free article] [PubMed] [Google Scholar]
- 61.Hieken TJ, Chen J, Hoskin TL, Walther-Antonio M, Johnson S, Ramaker S, Xiao J, Radisky DC, Knutson KL, Kalari KR, Yao JZ, Baddour LM, Chia N, Degnim AC. The microbiome of aseptically collected human breast tissue in benign and malignant disease. Sci Rep. 2016;6:30751. doi: 10.1038/srep30751. [DOI] [PMC free article] [PubMed] [Google Scholar]
- 62.Urbaniak C, Cummins J, Brackstone M, Macklaim JM, Gloor GB, Baban CK, Scott L, O’Hanlon DM, Burton JP, Francis KP, Tangney M, Reid G. Microbiota of human breast tissue. Appl Environ Microbiol. 2014;80:3007–3014. doi: 10.1128/AEM.00242-14. [DOI] [PMC free article] [PubMed] [Google Scholar]
- 63.Zhuo Q, Yu B, Zhou J, Zhang J, Zhang R, Xie J, Wang Q, Zhao S. Lysates of lactobacillus acidophilus combined with CTLA-4-blocking antibodies enhance antitumor immunity in a mouse colon cancer model. Sci Rep. 2019;9:20128. doi: 10.1038/s41598-019-56661-y. [DOI] [PMC free article] [PubMed] [Google Scholar]
Associated Data
This section collects any data citations, data availability statements, or supplementary materials included in this article.