

Summary
A high abundance of tumor-infiltrating lymphocytes (TILs) has a positive impact on the prognosis of patients with lung adenocarcinoma (LUAD). We aimed to develop and validate an artificial intelligence-driven pathological scoring system for assessing TILs on H&E-stained whole-slide images of LUAD. Deep learning-based methods were applied to calculate the densities of lymphocytes in cancer epithelium (DLCE) and cancer stroma (DLCS), and a risk score (WELL score) was built through linear weighting of DLCE and DLCS. Association between WELL score and patient outcome was explored in 793 patients with stage I-III LUAD in four cohorts. WELL score was an independent prognostic factor for overall survival and disease-free survival in the discovery cohort and validation cohorts. The prognostic prediction model-integrated WELL score demonstrated better discrimination performance than the clinicopathologic model in the four cohorts. This artificial intelligence-based workflow and scoring system could promote risk stratification for patients with resectable LUAD.
Subject areas: Health sciences, Immunology, Cancer, Artificial intelligence
Graphical abstract
Highlights
-
•
TILs assessment system was developed on H&E-stained WSIs of lung adenocarcinoma
-
•
WELL score was an independent prognostic factor in terms of OS and DFS
-
•
Prediction model integrated with WELL score demonstrated better performance
Health sciences; Immunology; Cancer; Artificial intelligence
Introduction
Lung cancer is one of the most common cancers and the leading cause of cancer-related death worldwide.1 Among all patients with lung cancer, lung adenocarcinoma (LUAD) accounts for the most significant proportion, and its incidence rate continues to rise.2 The American Joint Commission on Cancer (AJCC) tumor-node-metastasis (TNM) staging system has played a critical role in routine prediction and patient risk stratification.3 Although the TNM stage, integrated with clinical risk factors, provides valuable prognostic information and improves the risk stratification ability of patients to a certain extent,4,5 the effect is not satisfiable at present and there is an urgent need for new biomarkers. Recently, evaluation of the tumor immune microenvironment (TIME) in solid tumors has been demonstrated as a complementary prognostic biomarker for TNM stage.6
The development, metastasis, and prognosis of solid tumors are closely associated with the status of TIME,7,8,9 which is influenced by the type, abundance, and location of tumor-infiltrating lymphocytes (TILs). Several studies have shown that TILs are associated with the prognosis of many tumor diseases, such as breast cancer,10 colorectal cancer,11 and oropharyngeal cancer.12 In the context of lung cancer, high TILs and appropriate spatial architecture appeared to have a protective effect and had favorable outcomes for patients with LUAD.13,14 Immunohistochemical (IHC) and multiplex immunofluorescence (mIF) are the popular methods to depict the landscape of TILs subpopulation in patients with LUAD.4,15,16 Our group has recently proposed an immune cell biomarker named I-score, which integrated the density of CD3+ and CD8+ T cells in the tumor region of the IHC pathological images in patients with non-small cell lung cancer (NSCLC).4 Experiments demonstrated that the high I-score was associated with superior disease-free survival (DFS) compared with the low I-score. However, Federico et al. demonstrated that a high number of CD3+ T cells in the tumor was not associated with longer recurrence-free survival that was evaluated by mIF images.16 This is mainly due to the inconsistency or opposite results assessment via IHC images which produced with uncontrollable factors (e.g., antibody selection, experimental operation process, and different automated immunohistochemical staining instruments) across different laboratories. Moreover, mIF imaging is challenging to be embedded into the current clinical practice because it is not a conventional examination compared with Hematoxylin and Eosin (H&E)-stained pathology examination, and the cost is high.17
H&E-stained pathological sections, which are routinely used by pathologists for diagnosis with low cost and are easy to acquire, contain rich TIME information at the tissue and cell levels. It might be an alternative solution to assess TIME from H&E-stained images when IHC or mIF examinations are unavailable. Brambilla et al.13 claimed that intense lymphocytic infiltration was an independent prognostic factor in patients with LUAD through manual evaluation of the H&E-stained section. However, manual TILs quantification of hotspots or regions of interest (ROI) under the microscope is time consuming and laborious, with poor consistency.18 Restricted by computer hardware, the early automatic quantitative analysis of digital pathology images mainly focused on tissue microarrays (TMAs), which was proved to be a cost-effective method for exploring TILs-based image biomarkers in pathological practice.19,20 Nevertheless, the TMAs-based method is challenging to obtain a complete picture of a biological sample, often accompanied by selection bias. With the development of high-speed scanner technology, pathological sections could be quickly imaged into whole-slide images (WSIs) with high spatial resolution. This will provide sufficient fuel for computational pathology and make it possible to automatically quantify the TILs in WSIs. At present, there are few artificial intelligence-based workflows21 to automatically quantify and locate TILs in H&E-stained WSIs, and the exploration of the prognostic value of patients with LUAD is still insufficient.
In this study, a deep learning-driven digital image biomarker (named WELL score), based on the density and location of TILs, was proposed and the prognostic value of this biomarker was explored in patients with LUAD in four independent cohorts. We hypothesized that the WELL score was an independent prognostic factor and could improve the accuracy in predicting overall survival (OS) and DFS, along with clinicopathologic characteristics, in resectable LUAD.
Results
Baseline characteristics of cohorts
The details of the clinicopathologic characteristics of the discovery and validation cohorts are shown in Table 1. There were statistically significant differences in all of the clinicopathologic characteristics (age at surgery, sex, smoking status, pT stage, pN stage, TNM stage, tumor site, and adjuvant chemotherapy) across the four cohorts (p < 0.05).
Table 1.
Summary of clinicopathologic characteristics of all four cohorts
| D1 | V1 | V2 | V3 | p value | |
|---|---|---|---|---|---|
| Age at surgery (years, median [IQR]) | 62.0 (55.0, 69.0) | 62.0 (57.0, 66.5) | 54.0 (48.0, 62.5) | 65.0 (58.0, 72.0) | <0.001a |
| <65 | 181 (65.6%) | 97 (69.8%) | 98 (85.2%) | 136 (51.7%) | <0.001b |
| ≥65 | 95 (34.4%) | 42 (30.2%) | 17 (14.8%) | 127 (48.3%) | |
| Sex | 0.009b | ||||
| Male | 141 (51.1%) | 86 (61.9%) | 58 (50.4%) | 116 (44.1%) | |
| Female | 135 (48.9%) | 53 (38.1%) | 57 (49.6%) | 147 (55.9%) | |
| Smoking status | <0.001b | ||||
| Never | 208 (75.4%) | 65 (46.8%) | 74 (64.3%) | 37 (14.1%) | |
| Former/current | 68 (24.6%) | 74 (53.2%) | 41 (35.7%) | 226 (85.9%) | |
| pT stage | <0.001b | ||||
| T1 | 124 (44.9%) | 42 (30.2%) | 81 (70.4%) | 108 (41.1%) | |
| T2 | 130 (47.1%) | 60 (43.2%) | 21 (18.3%) | 132 (50.2%) | |
| T3 | 19 (6.9%) | 24 (17.3%) | 6 (5.2%) | 20 (7.6%) | |
| T4 | 3 (1.1%) | 13 (9.3%) | 7 (6.1%) | 3 (1.1%) | |
| pN stage | <0.001b | ||||
| N0 | 218 (79.0%) | 80 (57.6%) | 83 (72.2%) | 182 (69.2%) | |
| N1 | 18 (6.5%) | 19 (13.7%) | 13 (11.3%) | 52 (19.8%) | |
| N2 | 40 (14.5%) | 40 (28.7%) | 19 (16.5%) | 29 (11.0%) | |
| TNM stage | <0.001b | ||||
| I | 198 (71.7%) | 50 (36.0%) | 70 (60.9%) | 157 (59.7%) | |
| II | 32 (11.6%) | 33 (23.7%) | 17 (14.8%) | 72 (27.4%) | |
| III | 46 (16.7%) | 56 (40.3%) | 28 (24.3%) | 34 (12.9%) | |
| Tumor site | 0.033b | ||||
| Upper/middle lobe | 183 (66.3%) | 76 (54.7%) | 65 (56.5%) | 170 (64.6%) | |
| Lower lobe | 93 (33.7%) | 63 (45.3%) | 50 (43.5%) | 90 (34.2%) | |
| Unknown | 0 (0%) | 0 (0%) | 0 (0%) | 3 (1.1%) | |
| Adjuvant chemotherapy | <0.001b | ||||
| No | 211 (76.4%) | 63 (45.3%) | 56 (48.7%) | 164 (62.4%) | |
| Yes | 65 (23.6%) | 76 (54.7%) | 59 (51.3%) | 99 (37.6%) | |
| Follow-up (month, median [95% CI])c | 85.0 (82.4–88.6) | 36.9 (36.4–43.0) | 60.8 (57.8–65.1) | 29.6 (25.8–35.3) | |
| No. of OS events | 62 (22.5%) | 46 (33.1%) | 30 (26.1%) | 90 (34.2%) | |
| No. of DFS events | 116 (42.0%) | 67 (48.2%) | 48 (41.7%) | 113 (43.0%) |
IQR, interquartile range; CI, confidence interval. Data in parentheses are IQR, percentages, or 95% confidence intervals.
p values were determined by Kruskal-Wallis rank-sum test.
p values were determined by the Pearson’s Chi-square test or Fisher's exact test, where appropriate.
median follow-up time was estimated by the reverse Kaplan-Meier method.
Prognostic ability of the WELL score
Kaplan-Meier (K-M) survival curves showed that OS was superior for the low-risk group compared with the high-risk group (D1, hazard ratio [HR], 2.68; 95% confidence interval [CI], 1.56–4.62; p < 0.001; V1, HR, 3.05; 95% CI, 1.36–6.83; p = 0.004; V2, HR, 2.39; 95% CI, 0.98–5.84; p = 0.049; V3, HR, 1.99; 95% CI, 0.96–4.13; p = 0.058; Figure 2). In addition, we built a WELL score in terms of DFS and K-M survival curves, which showed that the low-risk group survived better than the high-risk group (D1, HR, 2.07; 95% CI, 1.42–3.01; p < 0.001; V1, HR, 1.54; 95% CI, 0.90–2.62; p = 0.11; V2, HR, 3.80; 95% CI, 1.61–8.96; p = 0.001; Figure 3). In subgroup analyses, the patients were pooled together to increase the discovery power. We found that the WELL score was associated with significantly better OS when stratified by age at surgery, sex, smoking status, and TNM stage (p < 0.05), and this trend (p = 0.210) was demonstrated in patients that received adjuvant chemotherapy (Figure S6).
Figure 2.

Kaplan-Meier curves of patients in four cohorts in terms of OS
Kaplan-Meier curves of patients stratified by WELL score in the discovery cohort D1 (A) and three validation cohorts V1, V2, and V3 (B, C, and D) in terms of OS.
Figure 3.

Kaplan-Meier curves of patients in three cohorts in terms of DFS
Kaplan-Meier curves of patients stratified by WELL score in the discovery cohort D1 (A) and two validation cohorts V1 and V2 (B and C) in terms of DFS.
The univariable and multivariable Cox regression analysis results for OS in different cohorts are shown in Table 2. The risk factors (WELL score and clinicopathologic characteristics) that demonstrated statistical significance at p < 0.05 in the univariable analysis (WELL score, age at surgery, sex, smoking status, and TNM stage) were included in the multivariable analysis. After adjusting for relevant clinical parameters, the multivariable Cox regression analysis revealed that the WELL score was an independent prognostic factor for OS in D1 and V1 (D1, HR, 1.95; 95% CI, 1.12–3.41; p = 0.019; V1, HR, 3.65; 95% CI, 1.61–8.27; p = 0.002). This trend could be found in other two validation cohorts ([V2, HR, 2.06; 95% CI, 0.83–5.07; p = 0.118] and [V3, HR, 1.91; 95% CI, 0.91–3.99; p = 0.085]) (Table 2). Similarly, the WELL score was also an independent prognostic factor for DFS in D1 and V2 (D1, HR, 1.68; 95% CI, 1.14–2.47; p = 0.008; V2, HR, 3.66; 95% CI, 1.53–8.76; p = 0.004). This trend could be found in another validation cohort (V1, HR, 1.58; 95% CI, 0.92–2.71; p = 0.097) (Table S1).
Table 2.
Univariable and multivariable Cox regression analyses for OS in four cohorts
| Discovery cohort D1a |
Validation cohort V1 |
Validation cohort V2 |
Validation cohort V3 |
|||||
|---|---|---|---|---|---|---|---|---|
| HR (95% CI) | p value | HR (95% CI) | p value | HR (95% CI) | p value | HR (95% CI) | p value | |
| Univariable analysis | ||||||||
| Age at surgery (years) | ||||||||
| ≥65 vs. <65 | 2.04 [1.24, 3.36] | 0.005 | 1.08 [0.57, 2.02] | 0.814 | 1.39 [0.57, 3.41] | 0.468 | 1.37 [0.91, 2.08] | 0.133 |
| Sex | ||||||||
| Female vs. male | 0.49 [0.29, 0.83] | 0.007 | 0.43 [0.22, 0.85] | 0.015 | 0.95 [0.46, 1.95] | 0.894 | 0.83 [0.55, 1.25] | 0.371 |
| Smoking status | ||||||||
| Former/current vs. never | 2.00 [1.19, 3.34] | 0.008 | 2.04 [1.11, 3.75] | 0.021 | 0.69 [0.32, 1.51] | 0.351 | 1.35 [0.70, 2.61] | 0.372 |
| TNM stage | ||||||||
| Stage III vs. stage I/II | 5.54 [3.30, 9.30] | <0.001 | 2.02 [1.13, 3.61] | 0.018 | 3.48 [1.69, 7.14] | <0.001 | 2.27 [1.35, 3.81] | 0.002 |
| Tumor site | ||||||||
| Upper/middle vs. lower | 1.39 [0.80, 2.44] | 0.243 | 1.38 [0.76, 2.51] | 0.296 | 1.01 [0.49, 2.07] | 0.986 | 0.82 [0.54, 1.26] | 0.367 |
| WELL scoreb | ||||||||
| High vs. low | 2.68 [1.56–4.62] | <0.001 | 3.05 [1.36–6.83] | 0.004 | 2.39 [0.98–5.84] | 0.049 | 1.99 [0.96–4.13] | 0.058 |
| Multivariable analysis | ||||||||
| Age at surgery (years) | ||||||||
| ≥65 vs. <65 | 2.29 [1.38, 3. 81] | 0.001 | 1.29 [0.67, 2.47] | 0.445 | 1.26 [0.50, 3.22] | 0.625 | 1.30 [0.85, 1.98] | 0.232 |
| Sex | ||||||||
| Female vs. male | 0.60 [0.33, 1.09] | 0.129 | 0.58 [0.22, 1.57] | 0.285 | 0.81 [0.31, 2.11] | 0.662 | 0.78 [0.51, 1.18] | 0.237 |
| Smoking status | ||||||||
| Former/current vs. never | 1.30 [0.71, 2.36] | 0.366 | 1.59 [0.64, 3.93] | 0.316 | 0.57 [0.20, 1.60] | 0.286 | 1.29 [0.66, 2.52] | 0.458 |
| TNM stage | ||||||||
| Stage III vs. stage I/II | 5.39 [3.14, 9.24] | <0.001 | 1.92 [1.06, 3.45] | 0.030 | 3.20 [1.53, 6.68] | 0.002 | 1.95 [1.14, 3.34] | 0.015 |
| WELL scoreb | ||||||||
| High vs. low | 1.95 [1.12, 3.41] | 0.019 | 3.65 [1.61, 8.27] | 0.002 | 2.06 [0.83, 5.07] | 0.118 | 1.91 [0.91, 3.99] | 0.085 |
D1 is the discovery cohort.
Continuous variables DLCE score and DLCS score were employed for Cox modeling, and the coefficients of the two variables in terms of OS were −0.4181 and −0.4400, respectively. We combined the two variables into a score through linear weighting, which was named WELL score, WELL score = −0.4181∗LDCE score −0.4400∗LDCS score.
Development and validation of the prognostic model
Because age at surgery, TNM stage, and WELL score were identified as independent factors for OS in multivariable Cox regression analysis in the discovery cohort, we developed a predictive model (full model) integrating the above independent factors. We further compared the performance of the full model with four other models that included the TNM stage model, the WELL score model, the TNM stage & WELL score combined (TNM_WELL) model, and the TNM stage & age at surgery combined (clinicopathologic) model. The baseline hazard, coding, and regression coefficients of each model are summarized in Table S2.
The model performance is presented in Table 3. The full model showed better discrimination performance (evaluated by C-index and iAUC) and better calibration ability (evaluated by AIC) than the clinicopathologic model in the four cohorts. The TNM_WELL model showed better discrimination and calibration performance than the TNM stage model in the four cohorts. Integrating the WELL score into the TNM stage model improved the prediction for OS (likelihood ratio test, χ2 = 8.269, p = 0.004); also, integrating the WELL score into the clinicopathologic model improved the prediction for OS (likelihood ratio test, χ2 = 6.967, p = 0.008). The receiver operating characteristic curve (ROC, t = 60 months) and resulting time-dependent AUC plotted over time are presented in Figure S7. The full model showed higher AUC across most time points compared to the reference model.
Table 3.
Performance metrics of the full model (integrated WELL score and clinicopathologic characteristics) and reference models in the discovery and validation cohorts
| Cohort | Model | C-index | iAUC | AIC |
|---|---|---|---|---|
| Discovery cohort (D1) | TNM stage | 0.651 (0.592–0.710) | 0.634 | 629.2 |
| WELL score | 0.622 (0.563–0.681) | 0.618 | 650.2 | |
| TNM_WELL | 0.709 (0.646–0.772) | 0.700 | 622.9 | |
| Clinicopathologic | 0.723 (0.658–0.788) | 0.715 | 618.9 | |
| Full | 0.751 (0.686–0.815) | 0.743 | 614.0 | |
| Validation cohort 1 (V1) | TNM stage | 0.586 (0.511–0.661) | 0.590 | 417.4 |
| WELL score | 0.589 (0.523–0.655) | 0.609 | 413.7 | |
| TNM_WELL | 0.627 (0.548–0.707) | 0.659 | 411.4 | |
| Clinicopathologic | 0.596 (0.512–0.680) | 0.593 | 417.9 | |
| Full | 0.622 (0.535–0.709) | 0.664 | 413.0 | |
| Validation cohort 2 (V2) | TNM stage | 0.632 (0.547–0.717) | 0.634 | 267.2 |
| WELL score | 0.587 (0.509–0.664) | 0.587 | 273.5 | |
| TNM_WELL | 0.679 (0.592–0.767) | 0.676 | 264.3 | |
| Clinicopathologic | 0.650 (0.556–0.744) | 0.648 | 267.0 | |
| Full | 0.683 (0.593–0.773) | 0.684 | 264.3 | |
| Validation cohort 3 (V3) | TNM stage | 0.565 (0.516–0.613) | 0.552 | 853.4 |
| WELL score | 0.527 (0.488–0.565) | 0.543 | 857.3 | |
| TNM_WELL | 0.585 (0.531–0.639) | 0.580 | 850.7 | |
| Clinicopathologic | 0.586 (0.521–0.651) | 0.575 | 852.5 | |
| Full | 0.596 (0.529–0.663) | 0.597 | 850.3 |
Visualization of TILs and assessment of the immune cell phenotypes
Visual examples of high-risk and low-risk groups identified by the WELL score were shown in Figure 4. We could observe that densities of TILs in the cancer epithelium and cancer stroma regions of low-risk patients in the discovery and validation cohorts were much higher than those of high-risk patients. CIBERSORT algorithm22,23 was employed to calculate the relative level of 22 immune cell phenotypes using RNA transcripts for the patients in V3 (n = 263). 25 samples were excluded because of p > 0.05 or lack of immune infiltration. Among the 22 immune cells, the difference in the abundance of 7 immune cells between the high-risk and low-risk groups was statistically significant (p < 0.05, Figure 5). The fractions of plasma cells, CD8+ T cells, and activated CD4+ memory T cells in the low-risk group were higher than those of the high-risk group (p < 0.05). The fractions of CD4+ memory resting T cells, macrophages M2, and mast cells resting in the low-risk group were lower than those of the high-risk group (p < 0.05).
Figure 4.

heatmaps of TILs
DLCE and DLCS maps of high-risk and low-risk groups from different cohorts (discovery cohort D1 and three validation cohorts V1, V2, and V3). The first and second columns were DLCE maps of the high-risk and low-risk groups identified by the WELL score. The third and fourth columns were DLCS maps of the high-risk and low-risk groups identified by the WELL score. The color bar (on the right of the figure) indicates the TILs density measurement (blue represents the low density, while red represents the high density).
Figure 5.

Immune cell phenotypes evaluated by CIBERSORT algorithm
Among the 22 immune cells, the distribution of 7 immune cells between the high-risk and low-risk groups was statistically significantly different (p < 0.05). The blue violin represents the low-risk group and the red represents the high-risk group. The fractions of plasma cells, CD8 T cells, and CD4 memory-activated T cells in the low-risk group are higher than those of the high-risk group. The fractions of CD4 memory resting T cells, macrophages M2, and mast cells resting in the low-risk group are lower than those of the high-risk group.
Discussion
In this study, we developed a digital biomarker named WELL score, which integrated the densities of TILs in cancer epithelium and cancer stroma region of H&E-stained WSIs. The prognostic analysis found that the WELL score was an independent prognostic factor in patients with resectable LUAD. Compared with a high WELL score, a low WELL score was associated with significantly superior OS and DFS in patients with LUAD. To our knowledge, this is the first image biomarker based on the artificial intelligence-driven automatic quantification of H&E-stained WSIs that focus on the prognosis analysis of resectable LUAD.
The analysis of TIME largely depends on the accurate quantification of tissue- and nuclei-level information. However, the heterogeneity of lung cancer pathological images has brought a great challenge in building the analysis manner.24,25 This work proposed a deep learning-based pipeline for the TILs quantification. In the tumor region segmentation process, a transfer learning framework was employed to pre-train the deep learning model by using pathological images of other tissues (breast cancer). We then used a small amount of annotated pathological images of LUAD for fine-tuning to accurately segment of tumor region while making full use of the labeled data. For the overstained vascular tissues or atelectasis that belong to normal tissue, it is easy to confuse with tumor-associated stroma (which belongs to the tumor region), so pathologists with relevant experience are essential to identify these issues. In the process of tissue segmentation, our proposed weakly supervised method was applied to segment the tumor region into cancer epithelium, cancer stroma, lymphoid aggregates, and necrosis.26 Compared with the full supervision method which requires a lot of pixel-level annotations,21 the weakly supervised semantic segmentation method only needs patch-level labels, which will greatly reduce the burden of data annotation for pathologists. The lymphoid aggregates and necrosis region were excluded according to the practical review.27 When calculating the density of TILs, the numerator of the calculation formula was the number of TILs, and the denominator represented the area of cancer epithelium or cancer stroma. Owing to the unique structure of the cavity in lung cancer tissue and the fact that the area and ratio of the blank region varied significantly in different pathological grades,28 we removed this area, which would help to calculate the density of TILs accurately and was conducive to downstream analysis.
TILs scoring process in breast cancer is relatively mature,29 but the uniform workflow is still unavailable for LUAD. Furthermore, there is no unified statement about which regions/compartments’ TILs scores are calculated. Most of the TILs-related research focused on the density of TILs in the stromal region. For example, Donnem et al.30 evaluated the density of stomal CD8+ TILs, which was demonstrated as the independent prognostic factor in NSCLC. Two pathologists evaluated stromal TILs in H&E-stained WSIs in a semiautomatic manner, and comparative experimental results showed that high-density TILs in the stroma were positively associated with better survival for the patients that received immunotherapy.31 Recently, some research work advocated considering the importance of TILs in cancer epithelium region.6,21 Park et al.21 firstly classified the tiles into three different immune phenotypes (IPs) according to the TILs density of the cancer epithelium region and cancer stroma region. Then the ratio of different IPs patches determined the IP of WSIs, which formed an image biomarker. It needed to set twice cutoff values on the processing pipeline in the discovery cohort, which may weaken the generalization ability of the model, especially when encountering a gap in data distribution between the discovery cohort and validation cohorts. In this study, we directly quantified the TILs density in cancer epithelium and cancer stroma of the tumor region in the WSIs. Furthermore, we developed and validated a new biomarker by integrating DLCE score and DLCS score and conducted the prognostic analysis.
Despite the differences in clinicopathologic characteristics among the four cohorts (Table 1), the WELL score also had good prognostic performance across different cohorts using a cutoff threshold learned from the discovery cohort. Image metrics related to brightness and contrast that were computed via HistoQC32 were embedded using the t-SNE algorithm33 and demonstrated in Figure S8A, which showed that each cohort was aggregated separately, indicating a strong batch effect. However, the image features (DLCE score and DLCS score) extracted by us from different cohorts were interlaced or overlapped with each other, indicating that two features of TILs were resilient to batch effects and reproducible across multiple cohorts (Figure S8B). Both in cancer epithelium and cancer stroma regions, the TILs densities of low-risk groups were higher than those of high-risk groups (Figure 4). This observation may suggest that more infiltration of lymphocytes was conducive to stronger anti-tumor immune reaction and thus conducive to the better survival of patients with LUAD. This was consistent with the experimental results or conclusions of18 previous studies mainly focused on the associations between DLCS and prognosis.15,30 This study comprehensively considered the impact of DLCE and DLCS on the prognosis of LUAD patients. It suggested that the risk stratification and generalization ability of the WELL score were better than those of DLCE or DLCS alone (Figures 2, S2, and S3).
Although the WELL score could enable risk stratification of LUAD by the density of TILs assessed via H&E-stained sections, the association of the WELL score with the immune infiltration landscape remained unclear. Hence, we applied the CIBERSORT,22 a tool for inferring the composition of immune cells by RNA transcripts, to clarify the lymphocyte infiltration landscape between the high-risk and low-risk groups. We found that the patients in the low-risk group had a higher proportion of CD8+ T cells, activated CD4+ memory T cells, and plasma cells versus those in the high-risk group, and these lymphocyte subsets participated in many aspects of antigen presentation and anti-tumor immune reaction.34 It was widely reported that the high abundance of CD8+ T cells,30,35 activated (but not resting) CD4+ memory T cells,36 and plasma cells37 contributed to favorable survival outcomes in LUAD, which was consistent with our findings. In addition, these lymphocyte subsets were involved in the formation of tertiary lymphoid structures, which played an important role in controlling tumor invasion and metastasis.38 We speculated that the differences in survival between the high-risk and low-risk groups might be due to the dual effect on both the TILs density and the abundance of these lymphocyte populations that were associated with better prognosis. However, the spatial correlation of these lymphocyte populations and the density of TILs remained to be further explored by using multiplex immunohistochemistry analysis.
In conclusion, we developed and validated a TILs-based digital image biomarker (named WELL score) by using H&E-stained WSIs. The WELL score was an independent prognostic factor and would improve the risk stratification ability when integrated with clinicopathologic characteristics for resectable LUAD patients. A future prospective study of the clinical application of the WELL score in the prognostic analysis of LUAD is warranted.
Limitations of the study
Our research still had some limitations. First, this work was retrospective with significant differences in clinicopathologic characteristics of different cohorts, which brought great challenges to the model development and validation. In addition, the protocol for the production of pathological sections and the parameters of WSI scanners in each cohort were different, which resulted in great differences in pathological images and was more prone to batch effects. Thanks to the two indexes (DLCE and DLCS), they alleviated batch effects to a certain degree that benefited multi-institute prognostic analysis. Second, we quantified DLCE and DLCS via routine H&E-stained slides but did not distinguish between lymphocyte (immune cell) subtypes. Automatic identification of subtypes of TILs (eg., CD3, CD4, CD8, CD20, etc.) could refine and enrich our studies. Third, this study was based on the analysis of a single WSI without considering the case of multiple slides. Although multiple slides would significantly increase the computational overhead, it may alleviate the bias in slide selection. In addition, the auxiliary results of lymph node metastases sections may further improve the discriminant ability of the WELL score-based model.
STAR★Methods
Key resources table
Resource availability
Lead contact
Further information and requests for resources and reagents should be directed to and will be fulfilled by the lead contact, Zaiyi Liu (liuzaiyi@gdph.org.cn).
Materials availability
This study did not generate new unique reagents.
Experimental model and subject details
Patients cohorts
Patients with LUAD who underwent curative-intent resection were retrospectively recruited from four institutions: Guangdong Provincial People’s Hospital (discovery cohort, D1), Shanxi Cancer Hospital (validation cohort 1, V1), Yunnan Cancer Hospital (validation cohort 2, V2), and The Cancer Genome Atlas (validation cohort 3, V3). The study was approved by the Research Ethics Committee of Guangdong Provincial People’s Hospital, the Ethics Committee of Shanxi Provincial Cancer Hospital, and the Institutional Review Board of Yunnan Cancer Hospital (approval number: KY-Z-2021-030-02, 202106, and KY2020139). As this was a retrospective image analysis study, the informed consent of patients was waived. The clinical factors, including age at surgery, sex, smoking status, pT stage, pN stage, TNM stage, tumor site, and adjuvant chemotherapy were collected from the hospital information system. The patients were excluded because of no intact clinicopathologic characteristics, receiving neoadjuvant therapy, incomplete resection, history of other tumors, and obvious artifacts on pathology image quality evaluation. The detailed inclusion criteria and exclusion criteria are shown in Figure S1. The endpoints were overall survival (OS) and disease-free survival (DFS).
H&E-stained slides digitalization and quality control
In discovery cohort (D1) and validation cohort 2 (V2), the glass sections were scanned as whole-slide images (WSIs) at 40× magnification (0.25μm/pixel) using a scanner (Leica, Aperio-AT2, USA), and the scanning equipment brand was Hamamatsu (Japan, 40× magnification, 0.22μm/pixel) in validation cohort 1(V1) cohort. WSIs of TCGA came from multiple institutes with large variances in terms of color and contrast. H&E-stained WSIs were reviewed by two pathologists (BBL and LXY) to select the most representative tumor slide. In addition, other low-quality (e.g., out-of-focus, blurred, pen markings, noticeable artifacts) WSIs were removed.
Method details
Semi-automated tumor region segmentation
The image processing pipeline was shown in Figures 1B–1D. Tumor region segmentation was a prerequisite for tissue and nuclei segmentation and classification. Firstly, the Camelyon Challenge dataset41 was cut into tumor patches and non-tumor patches, and fed into the ResNet-50 40 model for pre-training; Then, 67 LUAD WSIs from D1 were cut into tumor patches and non-tumor patches for fine-tuning the pre-trained model. Finally, the fine-tuning model was adopted in the tumor region segmentation for the remaining WSIs from D1 and all WSIs from the other three institutes. The segmentation masks of the tumor region were checked by two pathologists (BBL and LXY), and the imperfect masks were corrected for the following workflow.
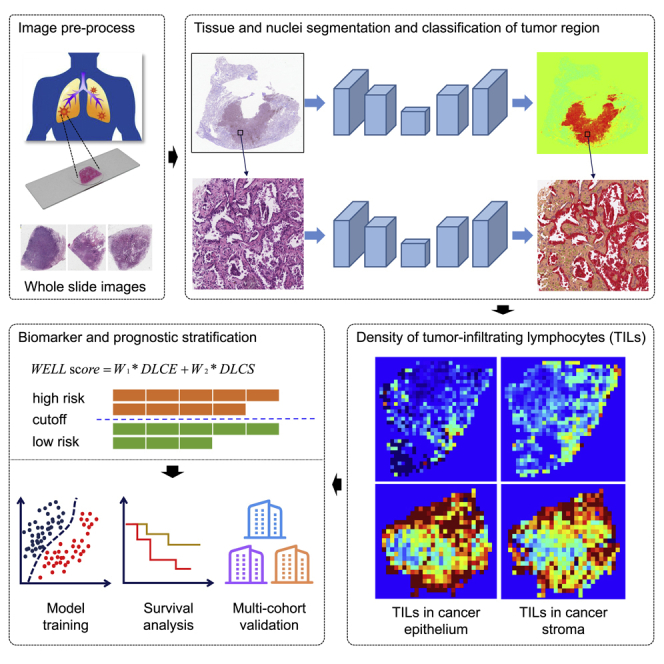
Figure 1.

The overall workflow of the study
(A) The HE-stained glass sections were scanned into whole-slide images.
(B) Semiautomated tumor region segmentation. A transfer learning framework was deployed for tumor region segmentation and segmentation masks of the tumor region were checked by two pathologists.
(C) Fully automated tissue and nuclei segmentation. To accurately obtain the boundary of the tissue region, our proposed semantic segmentation method was proposed to divide the tumor region into cancer epithelium, cancer stroma, lymphoid aggregate, and necrosis regions on WSIs under 10× magnification. Hover-Net was deployed to segment and classify the nuclei into tumor nuclei, stromal nuclei, lymphocytes, and other nuclei in the tumor region of WSI at the maximum magnification.
(D) TILs in cancer epithelium and cancer stroma. The densities of lymphocytes in cancer epithelium (DLCE) and cancer stroma (DLCS) were calculated.
(E) Risk score and model development. A risk score (named WELL score) was built through linear weighting of DLCE score and DLCS score. A discovery cohort was used to optimize WELL scores and the median value of WELL scores in the discovery cohort was selected as the cutoff to stratify patients into high- and low-risk groups. Univariable and multivariable Cox regression analyses were performed to evaluate the association of WELL score and clinical risk factors with OS and DFS.
(F) Model validation. The other two cohorts and TCGA were used to validate the performance of the model.
Tissue segmentation of tumor region
To accurately obtain the boundary of the tissue region, we introduced the semantic segmentation (pixel-level classification) method to divide the tumor region into cancer epithelium, cancer stroma, lymphoid aggregate, and necrosis regions. The tissue semantic segmentation was performed on WSIs under 10× magnification to save the computation cost. To save the workload of manual annotation, we applied our proposed weakly supervised segmentation method based on patch-level classification labels. The method was divided into two stages: image classification and image segmentation. In the image classification stage, we used a class activation map (CAM)-based model to generate pseudo segmentation; in the image segmentation stage, we used our proposed Multi-Layer Pseudo-Supervision strategy26 to improve the accuracy of image segmentation. The schematic diagram is shown in Figure 1C.
Nuclei segmentation and classification
Hover-Net,39 consisting of one encoding branch and three decoding branches, was one of the state-of-the-art deep learning models for nuclei segmentation and classification. We deployed Hover-Net to segment and classify the nuclei into tumor nuclei, stromal nuclei, lymphocytes, and other nuclei in the tumor region of WSI at the maximum magnification. The schematic diagram is shown in Figure 1C.
TILs quantification and WELL score establishment
We quantified the TILs density using the following equations.
| (Equation 1) |
| (Equation 2) |
| (Equation 3) |
| (Equation 4) |
| (Equation 5) |
where DLCE indicated the density of TILs in cancer epithelium (Equation 1); DLCS indicated the density of TILs in cancer stroma (Equation 2). We used a logarithmic operation42 to compress the dynamic range of DLCE and DLCS for the sake of better visualization and analysis (Equations 3 and 4). A risk score, named WELL score (Equation 5), was constructed through linear weighting of DLCE score and DLCS score. A Cox regression model was built in the discovery cohort to estimate the weights w1 and w2. The median value of the WELL score in the discovery cohort was set as a cutoff. That is, a patient with a WELL score higher than the median value belonged to the high-risk group and vice versa.
Quantitative assessment of immune cells via CIBERSORT algorithm
A well-known bioinformatics tool (named CIBERSORT algorithm22,23) was used to evaluate the proportion of the relative level of 22 immune cell phenotypes according to the expression of immune-related and other genes in the complex expression mixture. These 22 kinds of immune cells are mainly composed of T cells, B cells, natural killer cells, monocytes, macrophages, dendritic cells, mast cells, eosinophils, neutrophils, etc. We set the threshold p<0.05 and excluded the sample without immune infiltration.
Quantification and statistical analysis
Continuous clinicopathologic characteristics (age at surgery) were reported as median (IQR) and compared via Kruskal-Wallis rank-sum test. Categorical clinicopathologic characteristics (sex, TNM stage, etc.) were reported as count (percentage) and compared via Pearson’s Chi-square test or Fisher’s exact test, where appropriate. The follow-up time across the institutions was estimated using the reverse Kaplan-Meier (K-M) method. K-M curves and Cox proportional hazards regression models were employed for survival analyses. The log-rank test was used to compare the high-risk group and the low-risk group in terms of OS and DFS. The univariable Cox regression analysis was performed to evaluate the risk factors that are associated with OS and DFS, and the factors that demonstrated statistical significance (p < 0.05) would be served as candidates in multivariable Cox regression analysis. The final model was determined by stepwise regression, and Akaike information criterion (AIC) was used to balance the model complexity and the goodness of the fit. The discrimination performance of the prediction models was evaluated using Harrell’s C-statistics (C-index) and the integrated area under the curve (iAUC). The time-dependent area under the curve (tAUC) was computed and plotted over time.
All statistical analyses were performed using R (version 4.0.2; https://www.r-project.org/) with packages survival, survminer, Rmisc, timeROC, lmtest, lpSolve, and irr. All statistical tests were two-sided, and p-values < 0.05 were considered statistically significant. Since this study was retrospective and the patients with end-point events (i.e., 62/278 in our case) in the discovery cohort had been identified, our risk variables could not exceed 6 to meet the 10 EPP rule.43
Acknowledgments
This work was funded by the Key Area Research and Development Program of Guangdong Province, China (No. 2021B0101420006); National Science Fund for Distinguished Young Scholars of China (No. 81925023); National Science Foundation for Young Scientists of China (Nos. 62002082, 62102103, 82001986); National Natural Science Foundation of China (Nos. 82272084, 82272075, 82072090, 61866009); China Postdoctoral Science Foundation (Nos. 2021M690753, 2021M700897); Guangdong Provincial Key Laboratory of Artificial Intelligence in Medical Image Analysis and Application (No. 2022B1212010011); High-level Hospital Construction Project (No. DFJHBF202105); Guangxi Natural Science Foundation (Nos. 2020GXNSFBA238014, 2020GXNSFAA297061); Guangxi Key Research and Development Project (No. AB21220037); Yunnan digitalization, development and application of biotic resource (No. 202002AA100007); the Outstanding Youth Science Foundation of Yunnan Basic Research Project (No. 202101AW070001); Yunnan Fundamental Research Projects (No. 202201AT070010); Innovation Team of Kunming Medical University (No. CXTD202110); Science and technology Projects in Guangzhou (Nos. 202201020001, 202201010513); and Regional Innovation and Development Joint Fund of National Natural Science Foundation of China (No. U22A20345).
Author contributions
Conceptualization, X.P.P., H.L., C.L., and Z.Y.L.; Methodology, X.P.P., C.H., and C.L.; Software, X.P.P., Z.Y.F., Y.M.W., and J.T.L.; Formal Analysis, X.P.P., H.L., L.X.Y., and B.B.L; Writing – Original Draft, X.P.P. and H.L.; Writing – Review & Editing, C.L., C.H., B.J.Q., Z.Y.X., Z.Z.W., K.Z., Z.B.L., X.C., and Y.F.C.; Funding Acquisition, C.H.L. and Z.Y.L.; Resources, H.L., Y.F.C., and Z.H.L.; Supervision, C.H.L. and Z.Y.L. All authors read and approved the final manuscript for submission.
Declaration of interests
All authors declare no competing interests.
Published: December 22, 2022
Footnotes
Supplemental information can be found online at https://doi.org/10.1016/j.isci.2022.105605.
Contributor Information
Xin Chen, Email: wolfchenxin@163.com.
Zhenhui Li, Email: lizhenhui621@qq.com.
Yanfen Cui, Email: yanfen210@126.com.
Cheng Lu, Email: lucheng@gdph.org.cn.
Zaiyi Liu, Email: liuzaiyi@gdph.org.cn.
Supplemental information
Data and code availability
-
•
Image and genetic data of The Cancer Genome Atlas are publicly available as of the date of publication. DOIs are listed in the key resources table. Image and clinicopathological information from other institutions are available from the lead contact (Prof. Zaiyi Liu via liuzaiyi@gdph.org.cn) on reasonable requests.
-
•
The code is available in the github repository (https://github.com/panxipeng/HE-WSI-lungTILs).
-
•
Any additional information required to reanalyze the data reported in this paper is available from the lead contact upon request.
References
- 1.Sung H., Ferlay J., Siegel R.L., Laversanne M., Soerjomataram I., Jemal A., Bray F. Global cancer statistics 2020: GLOBOCAN estimates of incidence and mortality worldwide for 36 cancers in 185 countries. CA. Cancer J. Clin. 2021;71:209–249. doi: 10.3322/caac.21660. [DOI] [PubMed] [Google Scholar]
- 2.Thai A.A., Solomon B.J., Sequist L.V., Gainor J.F., Heist R.S. Lung cancer. Lancet. 2021;398:535–554. doi: 10.1016/S0140-6736(21)00312-3. [DOI] [PubMed] [Google Scholar]
- 3.Amin M.B., Greene F.L., Edge S.B., Compton C.C., Gershenwald J.E., Brookland R.K., Meyer L., Gress D.M., Byrd D.R., Winchester D.P. The eighth edition AJCC cancer staging manual: continuing to build a bridge from a population-based to a more “personalized” approach to cancer staging: the eighth edition AJCC cancer staging manual. CA. Cancer J. Clin. 2017;67:93–99. doi: 10.3322/caac.21388. [DOI] [PubMed] [Google Scholar]
- 4.Lin H., Pan X., Feng Z., Yan L., Hua J., Liang Y., Han C., Xu Z., Wang Y., Wu L., et al. Automated whole-slide images assessment of immune infiltration in resected non-small-cell lung cancer: towards better risk-stratification. J. Transl. Med. 2022;20:261. doi: 10.1186/s12967-022-03458-9. [DOI] [PMC free article] [PubMed] [Google Scholar]
- 5.Perez-Johnston R., Araujo-Filho J.A., Connolly J.G., Caso R., Whiting K., Tan K.S., Zhou J., Gibbs P., Rekhtman N., Ginsberg M.S., Jones D.R. CT-Based radiogenomic analysis of clinical stage I lung adenocarcinoma with histopathologic features and oncologic outcomes. Radiology. 2022;303:664–672. doi: 10.1148/radiol.211582. [DOI] [PMC free article] [PubMed] [Google Scholar]
- 6.Donnem T., Kilvaer T.K., Andersen S., Richardsen E., Paulsen E.E., Hald S.M., Al-Saad S., Brustugun O.T., Helland A., Lund-Iversen M., et al. Strategies for clinical implementation of TNM-Immunoscore in resected nonsmall-cell lung cancer. Ann. Oncol. 2016;27:225–232. doi: 10.1093/annonc/mdv560. [DOI] [PubMed] [Google Scholar]
- 7.Bagaev A., Kotlov N., Nomie K., Svekolkin V., Gafurov A., Isaeva O., Osokin N., Kozlov I., Frenkel F., Gancharova O., et al. Conserved pan-cancer microenvironment subtypes predict response to immunotherapy. Cancer Cell. 2021;39:845–865.e7. doi: 10.1016/j.ccell.2021.04.014. [DOI] [PubMed] [Google Scholar]
- 8.Bremnes R.M., Busund L.-T., Kilvær T.L., Andersen S., Richardsen E., Paulsen E.E., Hald S., Khanehkenari M.R., Cooper W.A., Kao S.C., Dønnem T. The role of tumor-infiltrating lymphocytes in development, progression, and prognosis of non–small cell lung cancer. J. Thorac. Oncol. 2016;11:789–800. doi: 10.1016/j.jtho.2016.01.015. [DOI] [PubMed] [Google Scholar]
- 9.Schumacher T.N., Thommen D.S. Tertiary lymphoid structures in cancer. Science. 2022;375 doi: 10.1126/science.abf9419. [DOI] [PubMed] [Google Scholar]
- 10.Sun P., He J., Chao X., Chen K., Xu Y., Huang Q., Yun J., Li M., Luo R., Kuang J., et al. A computational tumor-infiltrating lymphocyte assessment method comparable with visual reporting guidelines for triple-negative breast cancer. EBioMedicine. 2021;70 doi: 10.1016/j.ebiom.2021.103492. [DOI] [PMC free article] [PubMed] [Google Scholar]
- 11.Sanz-Pamplona R., Melas M., Maoz A., Schmit S.L., Rennert H., Lejbkowicz F., Greenson J.K., Sanjuan X., Lopez-Zambrano M., Alonso M.H., et al. Lymphocytic infiltration in stage II microsatellite stable colorectal tumors: a retrospective prognosis biomarker analysis. PLoS Med. 2020;17 doi: 10.1371/journal.pmed.1003292. [DOI] [PMC free article] [PubMed] [Google Scholar]
- 12.Corredor G., Toro P., Koyuncu C., Lu C., Buzzy C., Bera K., Fu P., Mehrad M., Ely K.A., Mokhtari M., et al. An imaging biomarker of tumor-infiltrating lymphocytes to risk-stratify patients with HPV-associated oropharyngeal cancer. J. Natl. Cancer Inst. 2022;114:609–617. doi: 10.1093/jnci/djab215. [DOI] [PMC free article] [PubMed] [Google Scholar]
- 13.Brambilla E., Le Teuff G., Marguet S., Lantuejoul S., Dunant A., Graziano S., Pirker R., Douillard J.-Y., Le Chevalier T., Filipits M., et al. Prognostic effect of tumor lymphocytic infiltration in resectable non–small-cell lung cancer. J. Clin. Oncol. 2016;34:1223–1230. doi: 10.1200/JCO.2015.63.0970. [DOI] [PMC free article] [PubMed] [Google Scholar]
- 14.Ding R., Prasanna P., Corredor G., Barrera C., Zens P., Lu C., Velu P., Leo P., Beig N., Li H., et al. Image analysis reveals molecularly distinct patterns of TILs in NSCLC associated with treatment outcome. NPJ Precis. Oncol. 2022;6:33. doi: 10.1038/s41698-022-00277-5. [DOI] [PMC free article] [PubMed] [Google Scholar]
- 15.Yoneda K., Kuwata T., Kanayama M., Mori M., Kawanami T., Yatera K., Ohguri T., Hisaoka M., Nakayama T., Tanaka F. Alteration in tumoural PD-L1 expression and stromal CD8-positive tumour-infiltrating lymphocytes after concurrent chemo-radiotherapy for non-small cell lung cancer. Br. J. Cancer. 2019;121:490–496. doi: 10.1038/s41416-019-0541-3. [DOI] [PMC free article] [PubMed] [Google Scholar]
- 16.Federico L., McGrail D.J., Bentebibel S.-E., Haymaker C., Ravelli A., Forget M.-A., Karpinets T., Jiang P., Reuben A., Negrao M.V., et al. Distinct tumor-infiltrating lymphocyte landscapes are associated with clinical outcomes in localized non-small-cell lung cancer. Ann. Oncol. 2022;33:42–56. doi: 10.1016/j.annonc.2021.09.021. [DOI] [PMC free article] [PubMed] [Google Scholar]
- 17.Lu C., Bera K., Wang X., Prasanna P., Xu J., Janowczyk A., Beig N., Yang M., Fu P., Lewis J., et al. A prognostic model for overall survival of patients with early-stage non-small cell lung cancer: a multicentre, retrospective study. Lancet. Digit. Health. 2020;2:e594–e606. doi: 10.1016/S2589-7500(20)30225-9. [DOI] [PMC free article] [PubMed] [Google Scholar]
- 18.Rakaee M., Kilvaer T.K., Dalen S.M., Richardsen E., Paulsen E.-E., Hald S.M., Al-Saad S., Andersen S., Donnem T., Bremnes R.M., Busund L.T. Evaluation of tumor-infiltrating lymphocytes using routine H&E slides predicts patient survival in resected non–small cell lung cancer. Hum. Pathol. 2018;79:188–198. doi: 10.1016/j.humpath.2018.05.017. [DOI] [PubMed] [Google Scholar]
- 19.Barua S., Fang P., Sharma A., Fujimoto J., Wistuba I., Rao A.U.K., Lin S.H. Spatial interaction of tumor cells and regulatory T cells correlates with survival in non-small cell lung cancer. Lung Cancer. 2018;117:73–79. doi: 10.1016/j.lungcan.2018.01.022. [DOI] [PMC free article] [PubMed] [Google Scholar]
- 20.Gachechiladze M., Škarda J., Skanderová D., Überall I., Kolek V., Smičkova P., Vojta P., Vbrková J., Hajdúch M., Shani I., et al. Prognostic value of tumor-infiltrating lymphocytes (TILs) and their association with PD-L1 expression and DNA repair protein RAD51 in patients with resected non-small cell lung carcinoma. Lung Cancer. 2020;147:30–38. doi: 10.1016/j.lungcan.2020.06.025. [DOI] [PubMed] [Google Scholar]
- 21.Park S., Ock C.-Y., Kim H., Pereira S., Park S., Ma M., Choi S., Kim S., Shin S., Aum B.J., et al. Artificial intelligence–powered spatial analysis of tumor-infiltrating lymphocytes as complementary biomarker for immune checkpoint inhibition in non–small-cell lung cancer. J. Clin. Oncol. 2022;40:1916–1928. doi: 10.1200/JCO.21.02010. [DOI] [PMC free article] [PubMed] [Google Scholar]
- 22.Newman A.M., Liu C.L., Green M.R., Gentles A.J., Feng W., Xu Y., Hoang C.D., Diehn M., Alizadeh A.A. Robust enumeration of cell subsets from tissue expression profiles. Nat. Methods. 2015;12:453–457. doi: 10.1038/nmeth.3337. [DOI] [PMC free article] [PubMed] [Google Scholar]
- 23.Yang X., Shi Y., Li M., Lu T., Xi J., Lin Z., Jiang W., Guo W., Zhan C., Wang Q. Identification and validation of an immune cell infiltrating score predicting survival in patients with lung adenocarcinoma. J. Transl. Med. 2019;17:217. doi: 10.1186/s12967-019-1964-6. [DOI] [PMC free article] [PubMed] [Google Scholar]
- 24.van der Laak J., Litjens G., Ciompi F. Deep learning in histopathology: the path to the clinic. Nat. Med. 2021;27:775–784. doi: 10.1038/s41591-021-01343-4. [DOI] [PubMed] [Google Scholar]
- 25.Bera K., Schalper K.A., Rimm D.L., Velcheti V., Madabhushi A. Artificial intelligence in digital pathology — new tools for diagnosis and precision oncology. Nat. Rev. Clin. Oncol. 2019;16:703–715. doi: 10.1038/s41571-019-0252-y. [DOI] [PMC free article] [PubMed] [Google Scholar]
- 26.Han C., Lin J., Mai J., Wang Y., Zhang Q., Zhao B., Chen X., Pan X., Shi Z., Xu Z., et al. Multi-layer pseudo-supervision for histopathology tissue semantic segmentation using patch-level classification labels. Med. Image Anal. 2022;80 doi: 10.1016/j.media.2022.102487. [DOI] [PubMed] [Google Scholar]
- 27.Hendry S., Russell P.A., John T. Assessing tumor-infiltrating lymphocytes in solid tumors: a practical Review for pathologists and proposal for a standardized method from the international immunooncology biomarkers working group: Part 1: assessing the host immune response, TILs in invasive breast carcinoma and ductal carcinoma in situ, metastatic tumor deposits and areas for further research. Adv. Anat. Pathol. 2017;00:17. doi: 10.1097/PAP.0000000000000162. [DOI] [PMC free article] [PubMed] [Google Scholar]
- 28.Rokutan-Kurata M., Yoshizawa A., Ueno K., Nakajima N., Terada K., Hamaji M., Sonobe M., Menju T., Date H., Morita S., Haga H. Validation study of the international association for the study of lung cancer histologic grading system of invasive lung adenocarcinoma. J. Thorac. Oncol. 2021;16:1753–1758. doi: 10.1016/j.jtho.2021.04.008. S1556086421021250. [DOI] [PubMed] [Google Scholar]
- 29.Amgad M., Stovgaard E.S., Balslev E., Thagaard J., Chen W., Dudgeon S., Sharma A., Kerner J.K., Denkert C., Yuan Y., et al. Report on computational assessment of tumor infiltrating lymphocytes from the international immuno-oncology biomarker working group. npj Breast Cancer. 2020;6:16. doi: 10.1038/s41523-020-0154-2. [DOI] [PMC free article] [PubMed] [Google Scholar]
- 30.Donnem T., Hald S.M., Paulsen E.-E., Richardsen E., Al-Saad S., Kilvaer T.K., Brustugun O.T., Helland A., Lund-Iversen M., Poehl M., et al. Stromal CD8 + T-cell density—a promising supplement to TNM staging in non–small cell lung cancer. Clin. Cancer Res. 2015;21:2635–2643. doi: 10.1158/1078-0432.CCR-14-1905. [DOI] [PubMed] [Google Scholar]
- 31.Gataa I., Mezquita L., Rossoni C., Auclin E., Kossai M., Aboubakar F., Le Moulec S., Massé J., Masson M., Radosevic-Robin N., et al. Tumour-infiltrating lymphocyte density is associated with favourable outcome in patients with advanced non–small cell lung cancer treated with immunotherapy. Eur. J. Cancer. 2021;145:221–229. doi: 10.1016/j.ejca.2020.10.017. [DOI] [PubMed] [Google Scholar]
- 32.Janowczyk A., Zuo R., Gilmore H., Feldman M., Madabhushi A. HistoQC: an open-source quality control tool for digital pathology slides. JCO Clin. Cancer Inform. 2019;3:1–7. doi: 10.1200/CCI.18.00157. [DOI] [PMC free article] [PubMed] [Google Scholar]
- 33.Li W., Cerise J.E., Yang Y., Han H. Application of t-SNE to human genetic data. J. Bioinform. Comput. Biol. 2017;15 doi: 10.1142/S0219720017500172. [DOI] [PubMed] [Google Scholar]
- 34.Bruni D., Angell H.K., Galon J. The immune contexture and Immunoscore in cancer prognosis and therapeutic efficacy. Nat. Rev. Cancer. 2020;20:662–680. doi: 10.1038/s41568-020-0285-7. [DOI] [PubMed] [Google Scholar]
- 35.Gentles A.J., Newman A.M., Liu C.L., Bratman S.V., Feng W., Kim D., Nair V.S., Xu Y., Khuong A., Hoang C.D., et al. The prognostic landscape of genes and infiltrating immune cells across human cancers. Nat. Med. 2015;21:938–945. doi: 10.1038/nm.3909. [DOI] [PMC free article] [PubMed] [Google Scholar]
- 36.Kim H.J., Cantor H. CD4 T-cell subsets and tumor immunity: the helpful and the not-so-helpful. Cancer Immunol. Res. 2014;2:91–98. doi: 10.1158/2326-6066.CIR-13-0216. [DOI] [PubMed] [Google Scholar]
- 37.Schmidt M., Hellwig B., Hammad S., Othman A., Lohr M., Chen Z., Boehm D., Gebhard S., Petry I., Lebrecht A., et al. A comprehensive analysis of human gene expression profiles identifies stromal immunoglobulin κ C as a compatible prognostic marker in human solid tumors. Clin. Cancer Res. 2012;18:2695–2703. doi: 10.1158/1078-0432.CCR-11-2210. [DOI] [PubMed] [Google Scholar]
- 38.Sautès-Fridman C., Petitprez F., Calderaro J., Fridman W.H. Tertiary lymphoid structures in the era of cancer immunotherapy. Nat. Rev. Cancer. 2019;19:307–325. doi: 10.1038/s41568-019-0144-6. [DOI] [PubMed] [Google Scholar]
- 39.Graham S., Vu Q.D., Raza S.E.A., Azam A., Tsang Y.W., Kwak J.T., Rajpoot N. Hover-Net: simultaneous segmentation and classification of nuclei in multi-tissue histology images. Med. Image Anal. 2019;58 doi: 10.1016/j.media.2019.101563. [DOI] [PubMed] [Google Scholar]
- 40.He K., Zhang X., Ren S., Sun J. Proceedings of the IEEE conference on computer vision and pattern recognition. 2016. Deep residual learning for image recognition; pp. 770–778. [Google Scholar]
- 41.Litjens G., Bandi P., Ehteshami Bejnordi B., Geessink O., Balkenhol M., Bult P., Halilovic A., Hermsen M., van de Loo R., Vogels R., et al. 1399 H&E-stained sentinel lymph node sections of breast cancer patients: the CAMELYON dataset. GigaScience. 2018;7 doi: 10.1093/gigascience/giy065. [DOI] [PMC free article] [PubMed] [Google Scholar]
- 42.Park J., Cho H.-G., Park J., Lee G., Kim H.S., Paeng K., Song S., Park G., Ock C.-Y., Chae Y.K. Artificial intelligence–powered hematoxylin and eosin analyzer reveals distinct immunologic and mutational profiles among immune phenotypes in non–small-cell lung cancer. Am. J. Pathol. 2022;192:701–711. doi: 10.1016/j.ajpath.2022.01.006. [DOI] [PubMed] [Google Scholar]
- 43.Riley R.D., Ensor J., Snell K.I.E., Harrell F.E., Martin G.P., Reitsma J.B., Moons K.G.M., Collins G., van Smeden M. Calculating the sample size required for developing a clinical prediction model. BMJ. 2020;368:m441. doi: 10.1136/bmj.m441. [DOI] [PubMed] [Google Scholar]
Associated Data
This section collects any data citations, data availability statements, or supplementary materials included in this article.
Supplementary Materials
Data Availability Statement
-
•
Image and genetic data of The Cancer Genome Atlas are publicly available as of the date of publication. DOIs are listed in the key resources table. Image and clinicopathological information from other institutions are available from the lead contact (Prof. Zaiyi Liu via liuzaiyi@gdph.org.cn) on reasonable requests.
-
•
The code is available in the github repository (https://github.com/panxipeng/HE-WSI-lungTILs).
-
•
Any additional information required to reanalyze the data reported in this paper is available from the lead contact upon request.