Abstract
Cuproptosis is a newly described form of cell death. However, nothing is known about the roles of cuproptosis regulators in glioma. First, we explored the characteristics of cuproptosis molecular subtypes and relevant tumor microenvironment (TME) immune cell infiltration patterns in glioma. Using unsupervised clustering analysis, we identified two cuproptosis subtypes and three gene clusters that exhibited different clinical characteristics and TME cell infiltration patterns. Then, we developed and validated a cuproptosis-related prognostic model for predicting the overall survival of glioma patients. We established a risk score tool based on a nomogram to assess the clinical applicability of the cuproptosis model. A high cuproptosis risk score with high immune cell infiltration level, tumor mutation burden, gene alterations, and immunity activation had an unfavorable overall survival. Next, we identified possible competing endogenous ribonucleic acid regulatory networks based on significantly differentially expressed genes between high-risk and low-risk groups and screened several candidate small molecular compounds that may improve chemotherapy. Data from IMvigor and GSE78200 showed that the cuproptosis score affected the prognosis of patients who received immunotherapy. Our study indicated that cuproptosis regulators are involved in TME immune infiltration and impact the clinical prognosis in glioma. It is necessary for clinical practice to develop different therapeutic strategies according to the different phenotypes associated with immune response. The present findings provide new insight for improving immunotherapy strategies and individualized treatment in glioma.
Keywords: Cuproptosis, glioma, immune infiltration, tumor microenvironment, prognostic model
Introduction
Glioma is the most common intracranial malignancy, accounting for approximately 50%-60% of all intracranial tumors [1]. Although great progress has been made in tumor cell biology and molecular biology in the last decades, the prognosis of patients with malignant glioma has not substantially improved [2]. Surgical resection combined with radiation therapy and/or chemotherapy continues to be the standard for patients with malignant glioma [3]. It is very difficult to accurately evaluate and predict prognosis using clinical characteristics such as age, pathologic grade, and recurrence [4]. Glioma is caused by the mutation and dysregulation of multiple genes [5]. It is more beneficial to explore and identify novel genetic prognostic markers than to use pathologic classification alone; the former can avoid an inaccurate histopathologic diagnosis and classification caused by glioma heterogeneity [6]. Accurately evaluating the prognosis of patients with glioma can help clinicians make decisions for individualized treatment, which is of great clinical importance to improve treatment strategy and the ability to predict prognosis.
Recently, Peter et al. discovered a new mode of cell death that is dependent on copper ions in cells, known as cuproptosis, in which copper ions bind directly to fatty acylated constituents in the tricarboxylic acid cycle, resulting in abnormal fat acylated protein aggregation and iron-sulfur protein loss. This process triggers proteotoxic stress responses, causing cell death [7]. They also found that the cytotoxic ability of cupric ions on cells was not affected after treatment with related inhibitors, which is very different from previously described programmed cell death such as necrosis, pyroptosis, apoptosis, and ferroptosis [8-12]. Cuproptosis shows a unique regulatory mechanism. Moreover, they screened cuproptosis regulators and found that Ferredoxin 1 (FDX1) and protein lipoylation were key regulators of cupric ion-induced cell death. Various modes of cell death are involved in glioma tumorigenesis. Since cuproptosis is a new form of programmed cell death, nothing is currently known about its functional role in tumors. At present, the immunotherapy of glioma still faces some challenges, including immunosuppression, difficulty in T cell recruitment, and difficulty in drug delivery [13]. Exploring the effect of cuproptosis on glioma immune regulation may provide a new immunotherapy strategy for glioma. In the present study, we first identified two discrete cuproptosis subtypes based on the expression levels of cuproptosis genes and explored the immune landscape of the two cuproptosis subtypes. Then, we further classified glioma patients into three gene subtypes based on differentially expressed genes (DEGs) between the two cuproptosis subtypes. Subsequently, we developed and validated a prognosis signature for predicting overall survival in patients with glioma and profiled the immune landscape using a cuproptosis risk score. Finally, we assessed the effect of the cuproptosis score on immunotherapy. Our study provides new insight about glioma progression and immune regulation.
Materials and methods
Data sources
The gene expression and relevant clinical characteristics and survival data were obtained from two databases: The Cancer Genome Atlas (TCGA) and Chinese Glioma Genome Atlas (CGGA). The gene expression profiles of the two datasets were adjusted and quantitatively-normalized. The clinical characteristics included age, gender, grade (TCGA), isocitrate dehydrogenase (IDH) mutation, 1p19q codeletion status, grade, histology, primary recurrence, secondary, chemotherapy, and radiotherapy status. Data without follow-up outcomes were excluded when we performed survival analyses. Cuproptosis-related genes were obtained from a recent study [7], and the lists of cuproptosis genes are provided in Table S1.
Gene alteration, copy number variation, methylation, and immune subtypes were also obtained from TCGA. Tumor mutation burden (TMB, n = 10114) were calculated according to the pan-cancer single-nucleotide variation profiles. Ethics approval was not applicable because all data were obtained from a public platform.
Identification of molecular subtypes and gene set variation analysis
We used the consensus clustering method for cuproptosis clustering and gene clustering based on DEGs from cuproptosis clusters (|log fold change (FC)| > 1.5, P < 0.05), and this method allowed negative values in gene expression profiles. Principal component analysis (PCA) was further used for the discrete distribution of clusters. We performed gene set variation analysis (GSVA) using the R “GSVA” and “GSEABase” packages [14,15].
Differential expression and enrichment analysis
We used the R “limma” package for DEG analysis between tumor and normal samples. We carried out gene set enrichment analysis (GSEA) for DEGs using the GSEA version 4.2.3 software from the online database (http://www.gsea-msigdb.org/gsea/index.jsp). GO function and Kyoto Encyclopedia of Genes and Genomes (KEGG) pathway enrichment analyses were performed using the R “clusterProfiler” package and the org.Hs.eg.db dataset. We built the protein-protein interaction (PPI) using the STRING (https://cn.string-db.org/) online database [16].
Development and validation of a cuproptosis prognostic model
The cuproptosis risk score was calculated for each sample. First, we performed univariate Cox regression analysis in the CGGA training set and identified overall survival (OS) prognosis-related cuproptosis regulators. Secondly, we performed Lasso regression using the R “glmnet” package to minimize the risk of over-fitting and identified the optimal number of genes included in the final prognostic model. We further calculated the cuproptosis risk score of each sample using the formula: Cuproptosis risk score = gene1expression * coefficient1 +…+ genenexpression * coefficientn. The risk scores of the TCGA validation dataset were also calculated. Patients were divided into high-risk and low-risk groups according to the median risk score in CGGA. Kaplan-Meier analysis was performed to compare the OS curve of the two risk groups using the TCGA and CGGA datasets, followed by PCA to visualize the risk distribution of patients. Finally, we evaluated the predictive ability of the cuproptosis score by calculating the areas under the curve (AUC) at different time points, which were shown using receiver operating characteristic (ROC) curves. We used the alluvial diagram to represent changes in cuproptosis subtypes, gene clusters, cuproptosis risk groups, and survival outcomes.
Tumor microenvironment, immune infiltration, and tumor mutation burden
The ESTIMATE algorithm was used to evaluate the immunologic and stromal scores of each sample. Immune cell infiltration levels in glioma samples were also evaluated. Immune checkpoint-related genes and function were also analyzed among different cuproptosis clusters and risk groups. The correlations of immune infiltration levels and tumor mutation burden (TMB) with cuproptosis score were evaluated using the Pearson method. TMB was also compared between the two risk groups.
CeRNA, gene alteration, and methylation analysis
Using |logFC| > 0.5, P < 0.05, we screened the differentially expressed mRNA, lncRNA, and miRNA, and built the lncRNA-mRNA-miRNA regulation network. Methylation and gene mutation levels and copy number variation (CNV) were also evaluated between the two risk groups.
Clinical relevance and risk scoring system
To investigate the clinical applications of the cuproptosis score in glioma, we first evaluated the correlations of cuproptosis risk score with clinical parameters. Then, were conducted Cox regression analyses to determine whether the cuproptosis score is an independent prognostic predictor. A predictive nomogram tool was established using the “rms” package. We could match a score for each variable and calculate the sum score of all variables. Calibration plots were used to depict the difference between the predicted and observed values, which can assess the stability of the scoring system.
Drug sensitivity and immunotherapy
Data were obtained from the Genomics of Drug Sensitivity in Cancer (GDSC) database. IC50 of 746 (GDSC: 265) small molecules in 1861 (GDSC: 860) cell lines were collected along with their mRNA expression data from the databases. Pearson correlation coefficients were calculated to assess the level of correlation between drug IC50 and mRNA expression, as previously employed by Rees et al. [17]. False discovery rate-adjusted P values were obtained. A positive correlation indicated drug resistance. We used two immunotherapy cohorts, including IMvigor and GSE78220, to validate the effect of cuproptosis score on immunotherapy.
Statistical analysis
For other continuous variables, Mann-Whitney U or Kruskal-Wallis H test was used. Category variables were expressed as count and percent, and the Chi-square test was used to compare the two risk groups. The survival curve comparison used the log-rank test. All analyses were completed using R software. P value < 0.05 was considered significant (two sides).
Results
Identification of cuproptosis subtypes in glioma
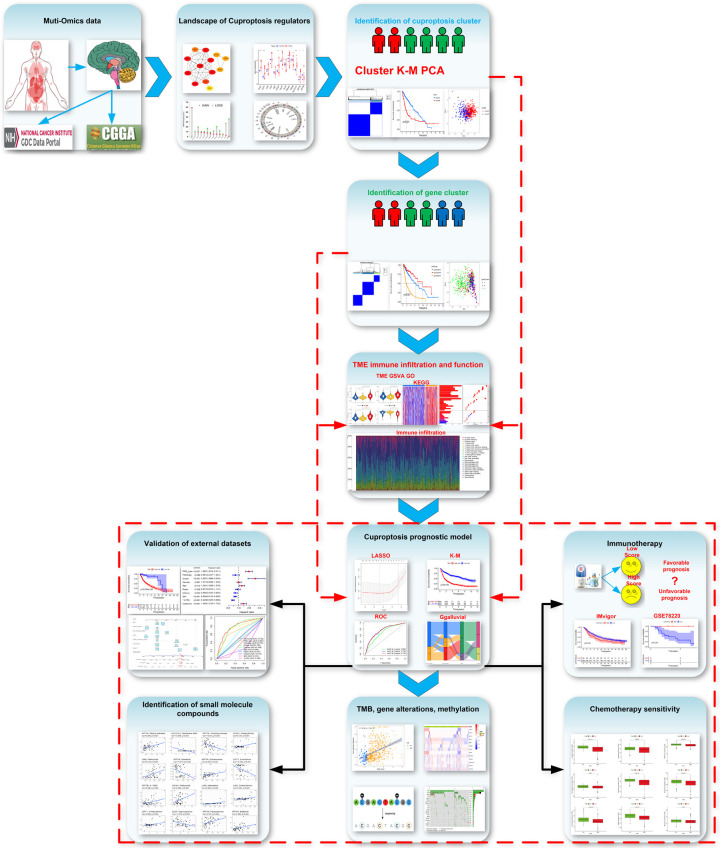
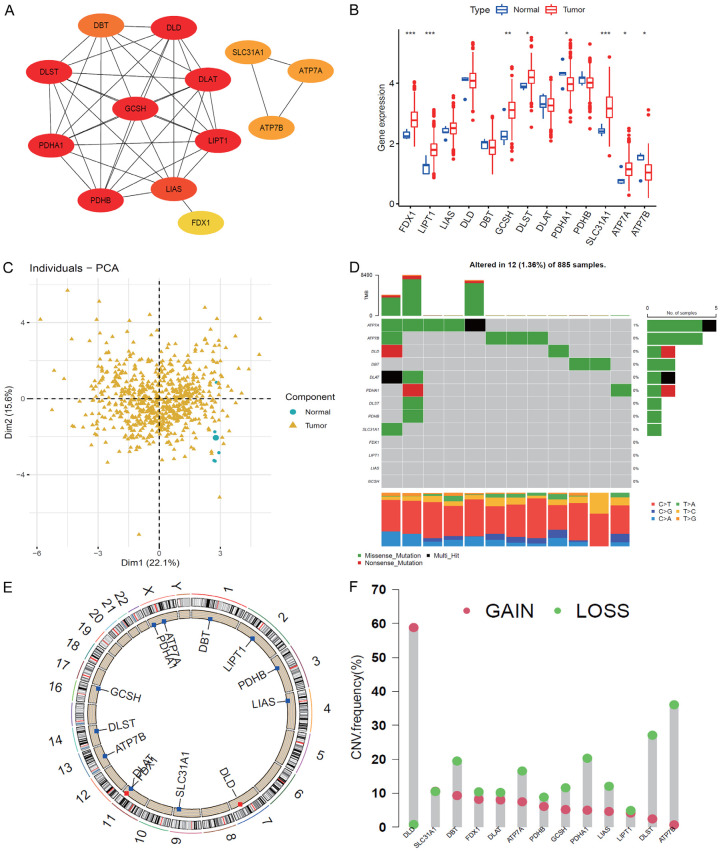
This study consisted of 13 cuproptosis genes. The overall flow diagram of data analyses is presented in Figure 1. First, we built a PPI network, which indicated complex connections among these cuproptosis regulators, and GCSH, DLST, PDHA1, LIPT1, and DLD were the top 5 hub genes (Figure 2A). Second, we evaluated the expressions of cuproptosis genes between tumor and normal samples and found that FDX1, LIPT1, GCSH, DLST, SLC31A1, ATP7A, and ATP7B were upregulated, and PDHA1 was downregulated in tumor tissues (Figure 2B, 2C). The gene alteration analysis indicated that the main gene alterations of cuproptosis regulators were missense and nonsense mutations. The frequency of ATP7A mutation was 1%, and that of other genes was zero (Figure 2D). The copy number variation results showed that DLD had higher gain frequency, while the other genes had higher loss frequencies (Figure 2E, 2F).
Figure 1.
Flow diagram of the whole data analyses.
Figure 2.
Landscape of cuproptosis regulators. A: Protein-protein interaction network among cuproptosis regulators. B: Expression of cuproptosis genes between normal and tumor samples. C: Principal component analysis indicated the distributions of tumor and normal tissues. D: Frequency of cuproptosis genes. E: Location of cuproptosis regulators in chromosomes. F: Copy number variation (CNV) frequency of cuproptosis regulators in TCGA (Gain and Loss).
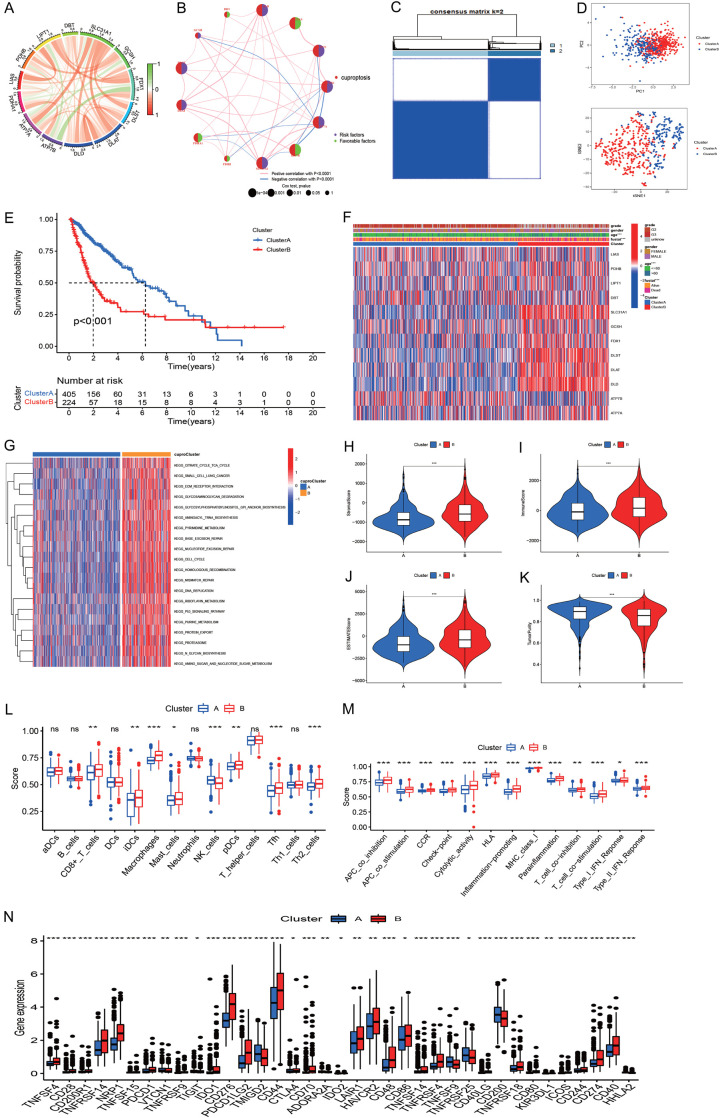
Pearson analysis showed positive correlations among most of the cuproptosis genes, and several negative associations among genes were also observed, such as FDX1-ATP7B, GCSH-ATP7A, ATP7B-LIPT1, ATP7A-PDHB, and FDX1-PDHA1 (Figure 3A).
Figure 3.
Molecular clusters of gliomas based on cuproptosis genes. A: The correlations among 13 cuproptosis genes. B: Correlations of cuproptosis regulators with prognosis. C: The consensus matrix indicated the optimal number (k = 2) of clustering in TCGA. D: Principal component analysis showed clear and sharp distributions of two cuproptosis clusters. E: The Kaplan-Meier curve indicated that the two subtypes had different survival outcomes. F: Heatmap showed the correlations of cuproptosis cluster with clinical measures and cuproptosis regulator expression. G: Heatmap of GSVA identified differential pathways of the two cuproptosis clusters. H-K: Differences of stromal score, immune score, estimate score, and tumor purity of the two cuproptosis clusters. L, M: Immune cell infiltration levels of the two cuproptosis clusters. N: Expression of immune checkpoint genes of the two cuproptosis clusters.
DLD, LIPT1, FDX1, ATP7A, SLC31A, DLAT, DLST, AND, and GCSH were risk factors for overall survival in glioma, while DBT, LIAS, ATP7B, PDHB, and PDHA1 were favorable factors for prognosis (Figure 3B).
To explore the molecular subtype of cuproptosis in glioma, 629 glioma samples that expressed 13 cuproptosis-related genes were evaluated using unsupervised clustering analysis. As shown in Figure 3C, two distinct clusters were obtained: A, B. Cluster A consisted of 450 samples, and cluster B consisted of 224 samples. PCA indicated a clear and sharp distribution for two cuproptosis clusters (Figure 3D). Kaplan-Meier analysis revealed that cuproptosis cluster 1 had a favorable prognosis, while Cluster 2 had a poor prognosis (Figure 3E). A clinical correlation analysis indicated that age and survival outcome were significantly different in the two clusters (Figure 3F). Among these cuproptosis regulators, PDHB, LIPT1, SLC31A1, GCSH, FDX1, DLST, DLAT, DLS, and ATP7A were significantly elevated, while ATP7B was reduced in cluster A (Figure S1).
Biological function and immune infiltration in cuproptosis subtypes
To explore biological function, we performed GSVA between cuproptosis clusters A and B. GSVA revealed that cuproptosis cluster A was mostly concentrated on olfactory transduction, while cluster B was mainly concentrated on metabolism, mismatch repair, DNA replication, cell cycle, and the p53 pathway (Figure 3G). We further explored the immune characteristics of the two cuproptosis clusters. The stromal, immune, and estimate scores in cluster B were significantly higher than those in cluster A (Figure 3H-J), while the tumor purity of cluster B was markedly lower than that of cluster A (Figure 3K). We also found that cluster B had higher CD8+ T cells, iDCs, macrophages, mast cells, pDCs, Tfh, and Th2 cells than cluster A (Figure 3L). Immune function measures were all higher in cluster B than in cluster A (Figure 3M). Levels of immune checkpoint-related genes were compared between the two cuproptosis clusters, and the results indicated that cluster B had a higher immune background than cluster A (Figure 3N). Therefore, cluster B was called hot tumor, while cluster A was called cold tumor. Coupled with the prognosis and immune content of glioma patients, the cuproptosis clustering could successfully classify the glioma patients. Finally, we explored the correlations of cuproptosis-related genes with programmed cell death-Ligand 1 (PD-L1) (Figure S2A) and found that PD-L1 was positively associated with PDHB, DBT, DLST, DLS, DLAT, FDX1, SLC31A1, and ATP7A (P < 0.001), and PD-L1 was significantly upregulated in cuproptosis cluster 2 (Figure S2B).
Identification of gene clusters
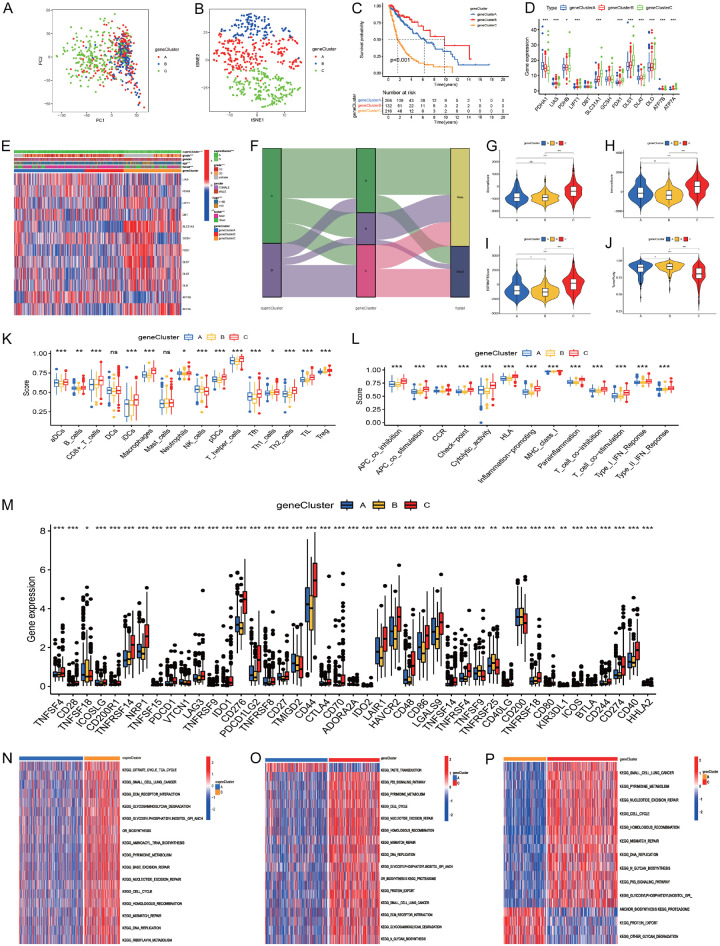
To explore the molecular characteristics of different cuproptosis clusters, we performed unsupervised cluster analysis on all the glioma patients based on 4,945 DEGs, and then all the glioma patients were categorized into three different clusters (A: n = 266; B: n = 147, C: n = 216). PCA confirmed the result of the unsupervised cluster analysis (Figure 4A, 4B). Kaplan-Meier analysis indicated that gene cluster B had better prognosis, while gene cluster C had worst prognosis (Figure 4C). The cuproptosis-related genes PDHA1 and PDHB were significantly upregulated in gene cluster B; LIAS, ATP7B, and ATP7A were upregulated in gene cluster A; and LIPT1, SLC31A1, FDX1, DLST, DLAT, and DLD were upregulated in gene cluster C (Figure 4D). We investigated the correlations of cuproptosis clusters with gene clusters and clinical characteristics, and highly significant distributions were observed (Figure 4E, 4F).
Figure 4.
The gene clustering based on DEGs in the two cuproptosis clusters. (A, B) PCA and t-SNE indicated three gene clusters (A-C). (C) The Kaplan-Meier curve showed the overall survival of the three gene clusters. (D) Cuproptosis-related gene expression levels among the three gene clusters. (E) Heatmap showed the correlations of cuproptosis subtypes with clinical characteristics, gene clusters, and cuproptosis-related genes. (F) Alluvial diagram showing the changes of cuproptosis subtypes, gene clusters, and survival outcomes. (G-J) Comparisons of stromal, immune, estimate scores, and tumor purity among the three gene clusters. (K-M) Immune cell, immune functions, and immune-related checkpoint expression levels among the three gene clusters. (N-P) GSVA for gene cluster (A, B), (A-C) and (B, C).
Then, we analyzed the immune content differences among the different gene clusters. The results indicated that gene cluster C had the highest stromal, immune, and estimate scores, followed by gene cluster A, while gene cluster B had the lowest (Figure 4G-I). On the contrary, gene cluster B had the highest tumor purity level, followed by gene cluster A, while gene cluster C had the lowest (Figure 4J). Furthermore, gene cluster C had the highest immune infiltration level, while gene cluster B had the lowest (Figure 4K). Similarly, gene cluster C showed the highest levels in immune-related checkpoint genes, inhibition, stimulation, and inflammation promotion, followed by gene cluster A, while gene cluster B showed the lowest (Figure 4L, 4M). Gene cluster C had a higher immune content level and was consider as an immune-inflamed phenotype, gene cluster A had a low immune content level and was considered as an immune-excluded phenotype, and gene cluster B had the lowest immune content level and was considered as an immune-desert phenotype.
GSVA revealed that gene cluster A was mainly enriched in olfactory transduction, oxidative phosphorylation, and butanoate and pyruvate metabolism (Figure 4N). Gene cluster B was mainly enriched in alpha linolenic acid metabolism, taste transduction, long-term depression, ascorbate and adorate metabolism, olfactory transduction, and steroid hormone biosynthesis (Figure 4O). Gene cluster C was mainly enriched in mismatch repair, DNA replication, homologous recombination, N glycan biosynthesis, cell cycle, and p53 signaling pathways (Figure 4P).
The GO and KEGG analyses suggested that there were significant differences in neutrophil degranulation and activation involved in immune response, focal adhesion, antigen processing, and molecular binding; proteoglycans; spliceosome; cell cycle; carbon metabolism; and DNA replication between the two cuproptosis subtypes (Figures S3, S4).
Development and validation of a cuproptosis prognostic model
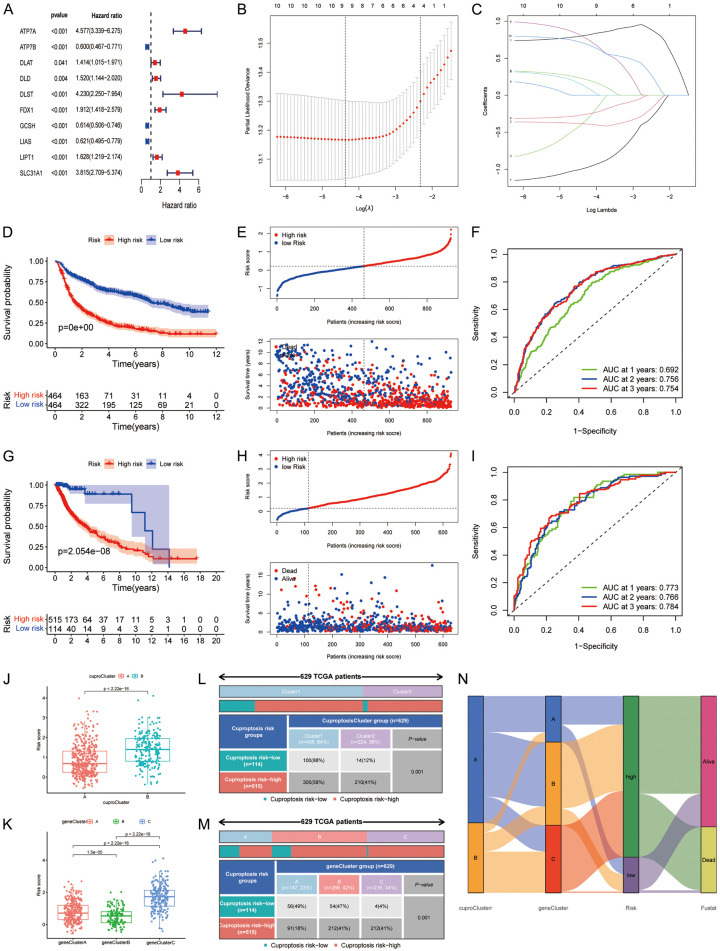
We identified 10 prognosis-related cuproptosis genes using univariate Cox regression (Figure 5A). The LASSO regression obtained the optimal number of genes in the prognostic model (Figure 5B, 5C). Finally, nine cuproptosis genes entered the prognostic signature (six risk-associated genes and three protective genes for OS). We obtained each cuproptosis risk score: cuproptosis risk score = 0.804 * ATP7A - 0.386 * ATP7B - 0.377 * DLAT + 0.135 * DLST + 0.793 * FDX1 - 0.992 * GCSH - 0.264 * LIAS + 0.224 * LIPT1 + 0.705 * SLC31A1 (Table S2). The patients were divided into cuproptosis high- and low-risk groups according to the median cuproptosis score from the CGGA cohort. Survival analyses indicated that the high-risk group had a poorer prognosis than the low-risk group in the CGGA and TCGA datasets (Figure 5D, 5E, 5G, 5H), and PCA also confirmed these findings (Figures S5, S6). The time-dependent ROC curves showed that the AUCs of cuproptosis risk score for predicting 1-year, 2-year, and 3-year OS were 0.692, 0.756, and 0.754 in CGGA, and 0.773, 0.766, 0.784 in TCGA, respectively (Figure 5F-I). We also investigated the effects of clinical measures and treatment on OS in patients with glioma, and the stratified analyses further confirmed the results (Figure S7A-T).
Figure 5.
Building and validation of the prognostic model based on cuproptosis-related genes. A: Univariate Cox regression in the Chinese Glioma Genome Atlas (CGGA) cohort. B, C: Least absolute shrinkage and selection operator regression. D, E: Overall survival curves of two risk groups in CGGA. F: ROC curves of risk score in CGGA. G, H: Overall survival curves of two risk groups in TCGA. I: Receiver operating characteristics curve (ROC) of risk score in TCGA. J, K: Comparison of cuproptosis risk score for different cuproptosis and gene clusters. L, M: Ratio distributions of cuproptosis and gene clusters between cuproptosis risk groups. N: Alluvial diagram showing the correlations of cuproptosis clusters, gene clusters, and risk groups with survival outcomes.
Cuproptosis cluster B had a higher risk score (Figure 5J), and the cuproptosis score risk group was associated with age, gender, grade, chemotherapy status, 1p19q codeletion status, and IDH mutation status (Figure S8A). The cuproptosis GCSH, ATP7B, and LIAS genes were negatively associated with cuproptosis risk score, and ATP7A, DLAT, DLST, FDX1, LIPT1, and SLC31A1 were positively associated with cuproptosis risk score (Figure S8B). The risk score of patients with WHO III, recurrent, IDH wildtype, 1p19q non-codeletion, and chemotherapy was also higher (Figure S8C-H). We also observed significant differences in cuproptosis risk score among the three gene clusters. Gene cluster C had the highest risk score, followed by gene cluster A, while gene cluster B had the lowest risk score (Figure 5K). Furthermore, the percentages of high-risk patients also showed significant differences in different cuproptosis subtypes and gene clusters (Figure 5L). They were 59% vs 41% for the cuproptosis subtypes, 18% in gene cluster A, and 41% in gene cluster C (P < 0.001) (Figure 5M). Alluvial diagram further showed the changes in cuproptosis subtypes, gene clusters, cuproptosis risk groups, and survival outcomes (Figure 5N).
Biological function and immune infiltration in different cuproptosis risk groups
We performed DEG analysis between the two risk groups and identified 42 DEGs in CGGA and 721 DEGs in TCGA. GO enrichment analysis indicated that the high-risk group was mainly enriched in extracellular matrix, structure, collagen fibril organization, B cells and its receptor signaling pathway, extracellular matrix structural constituents, and immunoglobulin receptor binding (Figure S9). KEGG pathway analysis showed that the high-risk group was enriched in extracellular matrix-receptor interaction, protein metabolism, p53 pathway, PI3K-Akt pathway, toll-like receptor pathway, hypoxia-inducible factor-1 pathway, NOD-like receptor pathway, and tumor necrosis factor pathway (Figure S10). Then, we built the lncRNA-miRNA-mRNA network by screening 731 DEGs, 78 lncRNAs, and 197 miRNAs between the two risk groups (Figure S11). We identified the FAM181A-AS1/miR-200a/EPHA2/DPY19L1 regulation axis according to the prognosis-related lncRNAs, mRNA, and miRNA (Figures S12, S13).
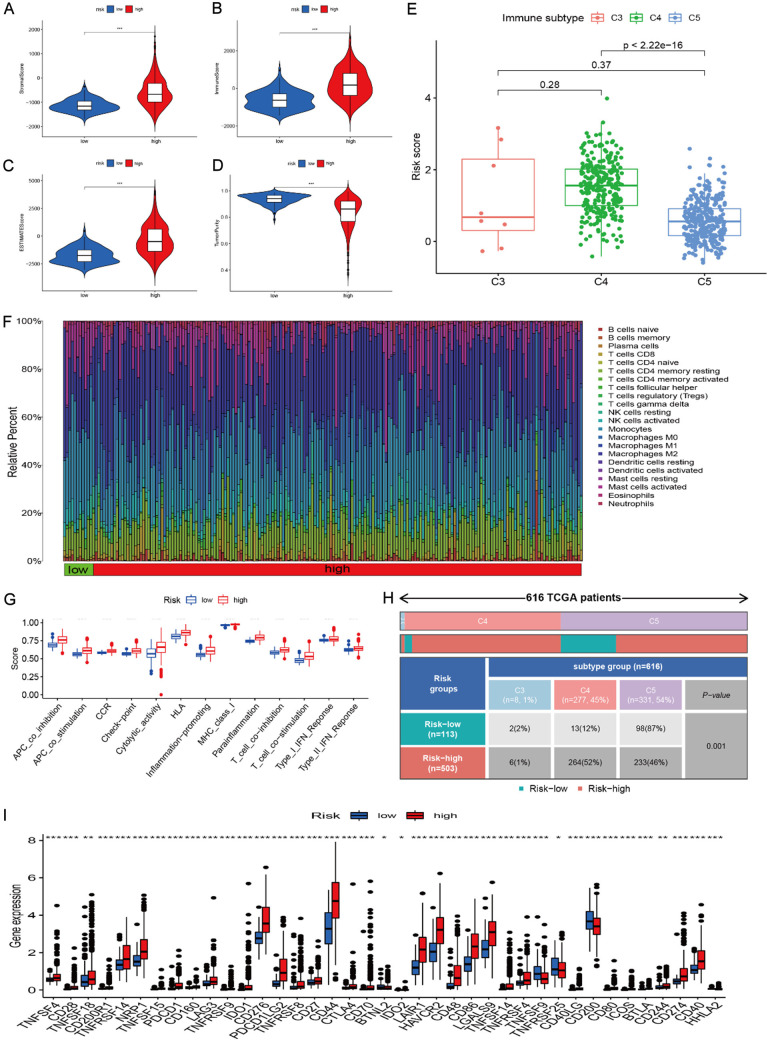
We further evaluated the immune content of different risk groups. Our results indicated that the high-risk group had higher stromal, immune, and estimate scores than the low-risk groups (Figure 6A-C), and the corresponding tumor purity level was low in the high-risk group (Figure 6D). We also observed a difference in the distribution of immune subtypes in the different risk groups. The high-risk group percentage was 1% of C3, 53% of C4, and 46% of C5, while the low-risk group percentage was 2% of C3, 12% of C4, and 54% of C5 (Figure 6E). The high-risk group was highly infiltrated by B cells, T cells, neutrophils, macrophages (M0, M1, M2), myeloid dendritic cells, and cancer-associated fibroblasts (Figure 6F). The low-risk group was mainly enriched in monocytes, mast cells, and NK cells. Moreover, macrophages (M0, M1, M2), neutrophils, naïve B cells, memory activated CD4 T cells, CD8 T cells, and gamma delta T cells were found to be positively associated with risk score, while monocytes, activated NK cells, eosinophils, and activated mast cells were negatively associated with risk score (Figure 6G). The high-risk group also showed higher scores in multiple immune functions (Figure 6H). All immune checkpoint-related gene expressions showed an increasing trend in the high-risk group (Figure 6I). A markedly positive association between PD-L1 and risk score was also observed (Figure S14). The high cu-proptosis risk score had an elevated immune background in glioma.
Figure 6.
Tumor microenvironment and immune infiltration in different risk groups. A-D: Stromal score, immune score, estimate score, and tumor purity in the the high- and low-risk groups. E: Risk scores of different immune subtypes. F: Immune infiltration levels from different calculation methods in the two risk groups. G: Immune function differences in the two risk groups. H: Immune subtypes in the two risk groups. I: Expression levels of immune checkpoint genes in the two risk groups.
Relationship between cuproptosis risk score and TMB, CNV, methylation, and mutation
Further analyses indicated that cuproptosis risk score was positively associated with tumor mutational burden (TMB) (Figure 7A, 7B). We further evaluated the CNV level of cuproptosis regulators and found higher low-risk mutation frequencies in FDX1, LIPT1, and DLAT (Figure 7C). The methylation levels of the high-risk group were also elevated in DLD, DLAT, PDHB, and ATP7B, while the methylation level was low in DBT (Figure 7D). Then, we evaluated the overall gene alterations of different risk groups. According to the results, the high-risk group had higher gene alterations in TP53, TTN, ATRX, PTEN, PIK3CA and FLG. The low-risk group had higher gene alterations in IDH1, CIC, IDH2, and DNMT3A (Figure 7E, 7F) and was similar in variant classification to the low-risk group (Figure S15A, 15B). The high-risk group showed more co-occurrence pairs (Figure S15C, 15D).
Figure 7.
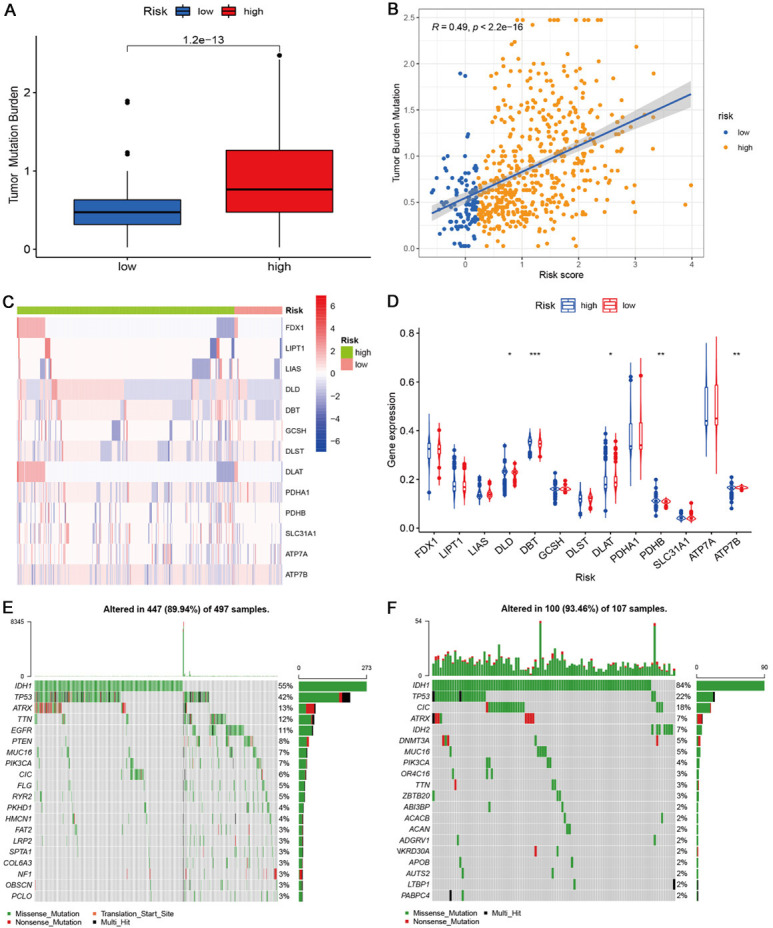
Tumor mutation burden, copy number mutation, methylation, and gene mutation profiling in the two risk groups. A: Tumor mutation burden in the two risk groups. B: The correlation of cuproptosis risk score with tumor burden mutation level. C: CNV levels of cuproptosis-related genes in the two risk groups. D: Methylation levels of cuproptosis-related genes in the two risk groups. E, F: Gene mutation profiling of the two risk groups.
Independent analysis and nomogram predicting system
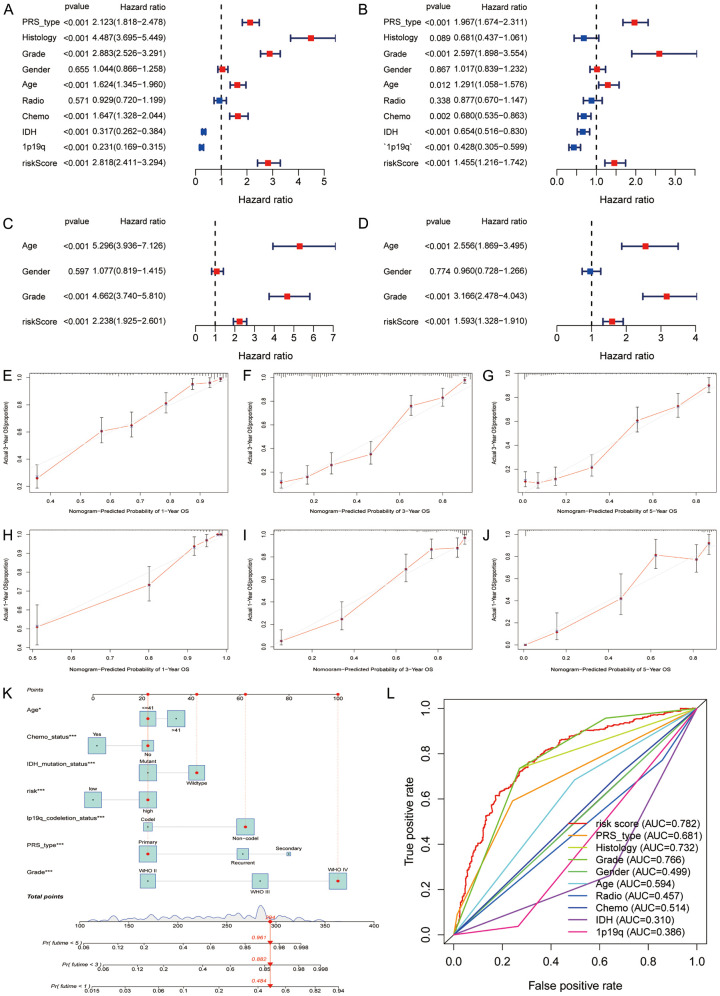
To validate whether cuproptosis score was independently associated with prognosis in glioma, we conducted univariate and multivariate Cox regression in the CGGA and TCGA cohorts, respectively. Both results indicated that cuproptosis score was positively related to poor OS in glioma (CGGA: HR 2.818, 95% CI: 2.411-3.294, Figure 8A; TCGA: HR 1.455, 95% CI: 1.216-1.742, Figure 8B). Similar results were confirmed in TCGA (Figure 8C, 8D). Then, we evaluated the fitting lines between predicted values and observed values at three OS time-points using calibrations plots (CGGA: Figure 8E-G; TCGA: Figure 8H-J), and the plots showed good fitting efficiency. Moreover, we built a nomogram tool using the cuproptosis risk score and clinical characteristics and found that the 1-year, 3-year, and 5-year OS rates were 96.1%, 89.2%, and 48.4%, respectively (Figure 8K). The multiple time-dependent ROC curves showed that cuproptosis risk score has the best predictive ability for 5-year OS in patients with glioma (AUC = 0.782, Figure 8L).
Figure 8.
Independent correlation analysis. A, B: Univariate and multivariate Cox regression of cuproptosis score in CGGA. C, D: Univariate and multivariate Cox regression of cuproptosis score in TCGA. E-G: Calibration plots of risk score at 1-, 3-, and 5-year in the CGGA. H-J: Calibration plots of risk score of OS at 1, 3, and 5 years in the TCGA cohort. K: Nomograph predicting overall survival probabilities based on cuproptosis score. L: Predictive ability of cuproptosis score and clinical measures for 5-year overall survival.
Correlations of cuproptosis risk score with chemotherapy sensitivity and immunotherapy
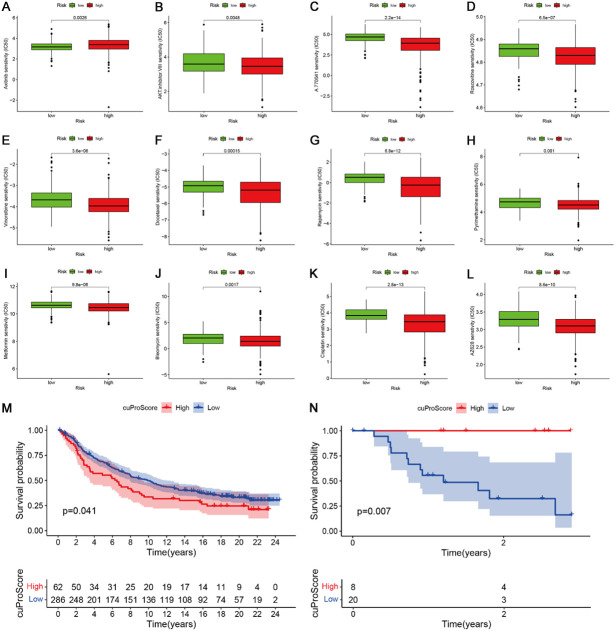
First, we screened some different risk groups that underwent chemotherapy. The IC50 of axitinib was high in the high-risk group, indicating that the high-risk group might have had chemotherapy resistance. The IC50 of AKT inhibitor VIII, A.770041, roscovitine, vinorelbrine, docetaxel, rapamycin, pyrimethamine, metformin, blenomycin, cisplatin, roscovitine, and salubrinal were significantly decreased in the high-risk group compared to the low-risk group, indicating that patients in the high-risk group were sensitive to this chemotherapy (Figure 9A-L). We further evaluated the effect of cuproptosis score on immunotherapy in the IMvigor and GSE78200 datasets and found that a high cuproptosis score led to an unfavorable prognosis in the IMvigro cohort (Figure 9M). In contrast, the GSE78200 cohort showed that a high cuproptosis score led to a favorable prognosis (Figure 9N). These results need to be verified in a large sample. Overall, we found that cuproptosis regulators can affect immunotherapy.
Figure 9.
Correlations of risk score with chemotherapy sensitivity and immune therapy. A-L: The IC50 of axitinib, AKT inhibitor VIII, A.770041, roscovitine, vinorelbrine, docetaxel, rapamycin, pyrimethamine, metformin, blenomycin, cisplatin, and salubrinal in the two risk groups. M, N: Effect of cuproptosis score on immunotherapy in the IMvigor and GSE78200 datasets.
We identified 16 small molecular compounds associated with signature genes included in the cuproptosis risk score using the CMap-02 tool. These molecules included the following resistance pairs: ATP7A-Acetalax, DLAT-Everolimus, ATP7B-Ifosfamide, DLAT-Staurosporine, LIPT1-Everolimus, ATP7A-Dasatinib, ATP7A-Triciribine phosphate, SLC31A1-Denileukin, Diftitox, and Ontak; and sensitivity pairs: ATP7A-Ethinyl estradiol, GCSH-Chelerythrine, LIAS-Palbociclib, ATP7A-Estramustine, ATP7B-E-7820, GCSH-Palbociclib, LIAS-Nelarabine, LIAS-Chelerythrine (Figure S16A-P).
Discussion
In the current study, we first investigated the clinical significance and immunological features of cuproptosis molecular patterns in glioma. Then, we developed a cuproptosis risk score tool to assess the prognosis of each patient, and further evaluated the correlations of cuproptosis score with immune content, clinical characteristics, gene alterations, and potential chemotherapy. Finally, we found that the cuproptosis score could affect immunotherapy response. Our study elucidates the role of the cuproptosis molecular pattern and its tumor microenvironment (TME) cell infiltration profile in glioma and provides insight about the TME anti-tumor immune response as a basis for developing immunotherapy for glioma.
Patients with glioma could be categorized into two different subtypes based on the expression of cuproptosis genes, and there was a marked difference in TME infiltration levels. Cuproptosis cluster 2 showed a higher immune cell infiltration and stromal score, which was considered “cold” tumor, while cluster 1 had lower immune infiltration levels [18-21]. Furthermore, cluster 2 was mainly enriched in mismatch repair, DNA replication, cell cycle regulation, primary immunodeficiency, and p53 pathway, which are important in tumorigenesis [22-25], whereas cluster 1 was mainly enriched in olfactory transduction. Patients from cluster 2 had a poorer prognosis than those in cluster 1. Results from the consensus clustering also indicated that two distinct components were obtained, suggesting that cuproptosis molecular patterns exert a strong impact on TME immune characteristics in glioma. We further explored the characteristics of transcriptome levels between cuproptosis subtypes. We obtained three gene clusters from DEGs between the two cuproptosis subtypes using consensus clustering analysis. The survival curve indicated that the prognosis of gene cluster C was the worst among the three gene clusters, followed by cluster A. Cluster B had a better prognosis. Clusters B and C showed higher immune infiltration and stromal levels and were called “hot” tumors, while cluster A had the lowest immune stromal level, so was considered as “cold” tumor. These results indicate that we may develop different therapy strategies for different phenotypes of glioma using cuproptosis regulator patterns.
Previous studies had established different types of programmed cell death-related risk score models in glioma [26-32]. We first built a cuproptosis risk score tool based on nine cuproptosis regulators. This cuproptosis risk score showed a close correlation with the cuproptosis subtype and gene cluster. The risk score of cluster 2 was higher than that of cluster 1, while the risk scores of gene clusters B and C were higher than that of cluster A. The high-risk group also had immune infiltration and stromal levels, and the expressions levels of immune checkpoint-related genes (such as PD-L1) were also significantly elevated. Positive correlations of cuproptosis risk score with some immune cells such as macrophages, neutrophils, naïve B cells, activated CD4 memory T cells, CD8 T cells, and gamma delta T cells were also observed. These immune cells and function were associated with high immune content [33,34]. The cuproptosis high-risk group a had poorer prognosis than the low-risk group, which was consistent with the results of cuproptosis subtypes and gene clusters. Besides, the high-risk group had a higher TMB than the low-risk group, and the risk score showed a positive association with TMB level. These results further highlight the role of cuproptosis regulators in the immune regulation of glioma.
In recent years, immunotherapy has been more widely available. However, glioma immunotherapy still faces many challenges [35]. The immunosuppressive microenvironment of glioma consists of a variety of components. First, tumor cells highly express certain immunosuppressive factors, such as PD-L1, and downregulate major histocompatibility complexes, thereby reducing self-antigen presentation [36]. Second, cells in the tumor microenvironment, such as microglia and tumor-associated macrophages, can induce decreased T cell activity, inhibit T cell proliferation, and cause T cell exhaustion. Besides, regulatory T cells in the microenvironment of glioma cells can modulate the immune response and express immunosuppressive cytokines, thereby aggravating immunosuppression at the tumor site [37]. Finally, studies have suggested that tumor-infiltrating lymphocytes (TILs) are present in the glioma microenvironment; however, these TILs also express high depletion, which is associated with T-cell immunoglobulin domain mucin domain protein-3 and lymphocyte activation gene-3 [38]. Molecular markers, when regulated by other cells in the glioma microenvironment, lose their proliferative and effector capabilities. In addition, certain physical features of gliomas also play an important role in the immunosuppressive response. Tissue hypoxia caused by vascular disorder in glioma induces tumor necrosis, and the necrotic tumor tissue increases the concentration of potassium ions in the tumor microenvironment, which in turn leads to the inactivation of T cells infiltrating the tumor site, limiting the effect of immunotherapy [39,40]. Thus, it is urgent to explore and identify new anti-tumor immune drugs.
In conclusion, cuproptosis regulators are involved in TME immune infiltration and affect the clinical prognosis in glioma. It is necessary for clinical practice to develop different therapeutic strategies according to the different phenotypes associated with immune response. The present findings provide new insights on improving the immunotherapy strategy and individualized treatment in glioma.
Acknowledgements
This study w as suported by the National Natural Science Foundation of China (LZZ: 82003239), and Science Foundation of Xiangya Hospital for Young Scholar (LZZ: 2018Q012).
Disclosure of conflict of interest
None.
Supporting Information
References
- 1.Weller M, Wick W, Aldape K, Brada M, Berger M, Pfister SM, Nishikawa R, Rosenthal M, Wen PY, Stupp R, Reifenberger G. Glioma. Nat Rev Dis Primers. 2015;1:15017. doi: 10.1038/nrdp.2015.17. [DOI] [PubMed] [Google Scholar]
- 2.Chen R, Smith-Cohn M, Cohen AL, Colman H. Glioma subclassifications and their clinical significance. Neurotherapeutics. 2017;14:284–297. doi: 10.1007/s13311-017-0519-x. [DOI] [PMC free article] [PubMed] [Google Scholar]
- 3.Przybylowski CJ, Hervey-Jumper SL, Sanai N. Surgical strategy for insular glioma. J Neurooncol. 2021;151:491–497. doi: 10.1007/s11060-020-03499-4. [DOI] [PMC free article] [PubMed] [Google Scholar]
- 4.Kan LK, Drummond K, Hunn M, Williams D, O’Brien TJ, Monif M. Potential biomarkers and challenges in glioma diagnosis, therapy and prognosis. BMJ Neurol Open. 2020;2:e000069. doi: 10.1136/bmjno-2020-000069. [DOI] [PMC free article] [PubMed] [Google Scholar]
- 5.Tateishi K. Glioma cell biology. No Shinkei Geka. 2021;49:476–484. doi: 10.11477/mf.1436204419. [DOI] [PubMed] [Google Scholar]
- 6.Namba N, Chonan Y, Nunokawa T, Sampetrean O, Saya H, Sudo R. Heterogeneous glioma cell invasion under interstitial flow depending on their differentiation status. Tissue Eng Part A. 2021;27:467–478. doi: 10.1089/ten.TEA.2020.0280. [DOI] [PubMed] [Google Scholar]
- 7.Tsvetkov P, Coy S, Petrova B, Dreishpoon M, Verma A, Abdusamad M, Rossen J, Joesch-Cohen L, Humeidi R, Spangler RD, Eaton JK, Frenkel E, Kocak M, Corsello SM, Lutsenko S, Kanarek N, Santagata S, Golub TR. Copper induces cell death by targeting lipoylated tca cycle proteins. Science. 2022;375:1254–1261. doi: 10.1126/science.abf0529. [DOI] [PMC free article] [PubMed] [Google Scholar]
- 8.Kajarabille N, Latunde-Dada GO. Programmed cell-death by ferroptosis: antioxidants as mitigators. Int J Mol Sci. 2019;20:4968. doi: 10.3390/ijms20194968. [DOI] [PMC free article] [PubMed] [Google Scholar]
- 9.Elmore S. Apoptosis: a review of programmed cell death. Toxicol Pathol. 2007;35:495–516. doi: 10.1080/01926230701320337. [DOI] [PMC free article] [PubMed] [Google Scholar]
- 10.Wu J, Ye J, Kong W, Zhang S, Zheng Y. Programmed cell death pathways in hearing loss: a review of apoptosis, autophagy and programmed necrosis. Cell Prolif. 2020;53:e12915. doi: 10.1111/cpr.12915. [DOI] [PMC free article] [PubMed] [Google Scholar]
- 11.Liu A, Shen L, Li N, Shen L, Li Z. Pan-cancer analyses of pyroptosis with functional implications for prognosis and immunotherapy in cancer. J Transl Med. 2022;20:109. doi: 10.1186/s12967-022-03313-x. [DOI] [PMC free article] [PubMed] [Google Scholar]
- 12.Djulbegovic MB, Uversky VN. Ferroptosis - an iron- and disorder-dependent programmed cell death. Int J Biol Macromol. 2019;135:1052–1069. doi: 10.1016/j.ijbiomac.2019.05.221. [DOI] [PubMed] [Google Scholar]
- 13.Wan RJ, Peng W, Xia QX, Zhou HH, Mao XY. Ferroptosis-related gene signature predicts prognosis and immunotherapy in glioma. CNS Neurosci Ther. 2021;27:973–986. doi: 10.1111/cns.13654. [DOI] [PMC free article] [PubMed] [Google Scholar]
- 14.Liberzon A, Birger C, Thorvaldsdottir H, Ghandi M, Mesirov JP, Tamayo P. The molecular signatures database (msigdb) hallmark gene set collection. Cell Syst. 2015;1:417–425. doi: 10.1016/j.cels.2015.12.004. [DOI] [PMC free article] [PubMed] [Google Scholar]
- 15.Hänzelmann S, Castelo R, Guinney J. Gsva: gene set variation analysis for microarray and rna-seq data. BMC Bioinformatics. 2013;14:7. doi: 10.1186/1471-2105-14-7. [DOI] [PMC free article] [PubMed] [Google Scholar]
- 16.Shannon P, Markiel A, Ozier O, Baliga NS, Wang JT, Ramage D, Amin N, Schwikowski B, Ideker T. Cytoscape: a software environment for integrated models of biomolecular interaction networks. Genome Res. 2003;13:2498–2504. doi: 10.1101/gr.1239303. [DOI] [PMC free article] [PubMed] [Google Scholar]
- 17.Rees MG, Seashore-Ludlow B, Cheah JH, Adams DJ, Price EV, Gill S, Javaid S, Coletti ME, Jones VL, Bodycombe NE, Soule CK, Alexander B, Li A, Montgomery P, Kotz JD, Hon CS, Munoz B, Liefeld T, Dančík V, Haber DA, Clish CB, Bittker JA, Palmer M, Wagner BK, Clemons PA, Shamji AF, Schreiber SL. Correlating chemical sensitivity and basal gene expression reveals mechanism of action. Nat Chem Biol. 2016;12:109–116. doi: 10.1038/nchembio.1986. [DOI] [PMC free article] [PubMed] [Google Scholar]
- 18.Turley SJ, Cremasco V, Astarita JL. Immunological hallmarks of stromal cells in the tumour microenvironment. Nat Rev Immunol. 2015;15:669–682. doi: 10.1038/nri3902. [DOI] [PubMed] [Google Scholar]
- 19.Shen J, Sun C, Wang Z, Chu Z, Liu C, Xu X, Xia M, Zhao M, Wang C. Sequential receptor-mediated mixed-charge nanomedicine to target pancreatic cancer, inducing immunogenic cell death and reshaping the tumor microenvironment. Int J Pharm. 2021;601:120553. doi: 10.1016/j.ijpharm.2021.120553. [DOI] [PubMed] [Google Scholar]
- 20.Gajewski TF, Woo SR, Zha Y, Spaapen R, Zheng Y, Corrales L, Spranger S. Cancer immunotherapy strategies based on overcoming barriers within the tumor microenvironment. Curr Opin Immunol. 2013;25:268–276. doi: 10.1016/j.coi.2013.02.009. [DOI] [PubMed] [Google Scholar]
- 21.Chen DS, Mellman I. Elements of cancer immunity and the cancer-immune set point. Nature. 2017;541:321–330. doi: 10.1038/nature21349. [DOI] [PubMed] [Google Scholar]
- 22.Lu C, Guan J, Lu S, Jin Q, Rousseau B, Lu T, Stephens D, Zhang H, Zhu J, Yang M, Ren Z, Liang Y, Liu Z, Han C, Liu L, Cao X, Zhang A, Qiao J, Batten K, Chen M, Castrillon DH, Wang T, Li B, Diaz LA Jr, Li GM, Fu YX. DNA sensing in mismatch repair-deficient tumor cells is essential for anti-tumor immunity. Cancer Cell. 2021;39:96–108. e6. doi: 10.1016/j.ccell.2020.11.006. [DOI] [PMC free article] [PubMed] [Google Scholar]
- 23.Kayes OJ, Loddo M, Patel N, Patel P, Minhas S, Ambler G, Freeman A, Wollenschlaeger A, Ralph DJ, Stoeber K, Williams GH. DNA replication licensing factors and aneuploidy are linked to tumor cell cycle state and clinical outcome in penile carcinoma. Clin Cancer Res. 2009;15:7335–7344. doi: 10.1158/1078-0432.CCR-09-0882. [DOI] [PMC free article] [PubMed] [Google Scholar]
- 24.Frantsiyants EM, Kaplieva IV, Trepitaki LK, Surikova EI, Bandovkina VA, Neskubina IV, Коtievа IМ, Shumarin KА. Experimental modeling of multiple primary malignant processes with one tumor suppressed by another under conditions of primary immunodeficiency. Bull Exp Biol Med. 2021;171:367–369. doi: 10.1007/s10517-021-05229-w. [DOI] [PubMed] [Google Scholar]
- 25.Mello SS, Attardi LD. Deciphering p53 signaling in tumor suppression. Curr Opin Cell Biol. 2018;51:65–72. doi: 10.1016/j.ceb.2017.11.005. [DOI] [PMC free article] [PubMed] [Google Scholar]
- 26.Tanzhu G, Li N, Li Z, Zhou R, Shen L. Molecular subtypes and prognostic signature of pyroptosis-related lncrnas in glioma patients. Front Oncol. 2022;12:779168. doi: 10.3389/fonc.2022.779168. [DOI] [PMC free article] [PubMed] [Google Scholar]
- 27.Chen P, Li Y, Li N, Shen L, Li Z. Comprehensive analysis of pyroptosis-associated in molecular classification, immunity and prognostic of glioma. Front Genet. 2022;12:781538. doi: 10.3389/fgene.2021.781538. [DOI] [PMC free article] [PubMed] [Google Scholar]
- 28.Zhang G, Li Y, Li N, Shen LF, Li Z. Functional implications of aging-related lncrnas for predicting prognosis and immune status in glioma patients. Aging (Albany NY) 2022;14:2348–2366. doi: 10.18632/aging.203944. [DOI] [PMC free article] [PubMed] [Google Scholar]
- 29.Zheng J, Zhou Z, Qiu Y, Wang M, Yu H, Wu Z, Wang X, Jiang X. A prognostic ferroptosis-related lncrnas signature associated with immune landscape and radiotherapy response in glioma. Front Cell Dev Biol. 2021;9:675555. doi: 10.3389/fcell.2021.675555. [DOI] [PMC free article] [PubMed] [Google Scholar]
- 30.Lin S, Xu H, Zhang A, Ni Y, Xu Y, Meng T, Wang M, Lou M. Prognosis analysis and validation of m(6)a signature and tumor immune microenvironment in glioma. Front Oncol. 2020;10:541401. doi: 10.3389/fonc.2020.541401. [DOI] [PMC free article] [PubMed] [Google Scholar]
- 31.Zhang M, Wang X, Chen X, Zhang Q, Hong J. Novel immune-related gene signature for risk stratification and prognosis of survival in lower-grade glioma. Front Genet. 2020;11:363. doi: 10.3389/fgene.2020.00363. [DOI] [PMC free article] [PubMed] [Google Scholar]
- 32.Zhong QY, Fan EX, Feng GY, Chen QY, Gou XX, Yue GJ, Zhang GH. A gene expression-based study on immune cell subtypes and glioma prognosis. BMC Cancer. 2019;19:1116. doi: 10.1186/s12885-019-6324-7. [DOI] [PMC free article] [PubMed] [Google Scholar]
- 33.Weber EW, Maus MV, Mackall CL. The emerging landscape of immune cell therapies. Cell. 2020;181:46–62. doi: 10.1016/j.cell.2020.03.001. [DOI] [PMC free article] [PubMed] [Google Scholar]
- 34.Duan S, Paulson JC. Siglecs as immune cell checkpoints in disease. Annu Rev Immunol. 2020;38:365–395. doi: 10.1146/annurev-immunol-102419-035900. [DOI] [PubMed] [Google Scholar]
- 35.Xu S, Tang L, Li X, Fan F, Liu Z. Immunotherapy for glioma: current management and future application. Cancer Lett. 2020;476:1–12. doi: 10.1016/j.canlet.2020.02.002. [DOI] [PubMed] [Google Scholar]
- 36.Decordova S, Shastri A, Tsolaki AG, Yasmin H, Klein L, Singh SK, Kishore U. Molecular heterogeneity and immunosuppressive microenvironment in glioblastoma. Front Immunol. 2020;11:1402. doi: 10.3389/fimmu.2020.01402. [DOI] [PMC free article] [PubMed] [Google Scholar]
- 37.Ma Q, Long W, Xing C, Chu J, Luo M, Wang HY, Liu Q, Wang RF. Cancer stem cells and immunosuppressive microenvironment in glioma. Front Immunol. 2018;9:2924. doi: 10.3389/fimmu.2018.02924. [DOI] [PMC free article] [PubMed] [Google Scholar]
- 38.Liu Z, Meng Q, Bartek J Jr, Poiret T, Persson O, Rane L, Rangelova E, Illies C, Peredo IH, Luo X, Rao MV, Robertson RA, Dodoo E, Maeurer M. Tumor-infiltrating lymphocytes (tils) from patients with glioma. Oncoimmunology. 2016;6:e1252894. doi: 10.1080/2162402X.2016.1252894. [DOI] [PMC free article] [PubMed] [Google Scholar]
- 39.Xu S, Tang L, Liu Z, Luo C, Cheng Q. Hypoxia-related lncrna correlates with prognosis and immune microenvironment in lower-grade glioma. Front Immunol. 2021;12:731048. doi: 10.3389/fimmu.2021.731048. [DOI] [PMC free article] [PubMed] [Google Scholar]
- 40.Yaghi L, Poras I, Simoes RT, Donadi EA, Tost J, Daunay A, de Almeida BS, Carosella ED, Moreau P. Hypoxia inducible factor-1 mediates the expression of the immune checkpoint HLA-G in glioma cells through hypoxia response element located in exon 2. Oncotarget. 2016;7:63690–63707. doi: 10.18632/oncotarget.11628. [DOI] [PMC free article] [PubMed] [Google Scholar]
Associated Data
This section collects any data citations, data availability statements, or supplementary materials included in this article.


