

Summary
Carbon capture, utilization and storage (CCUS) technology is critical to global net-zero emission goal, whereas actual deployment is well below expectations. This study constructs a comprehensive framework, integrating nonlinear dynamic optimization, real option and technology learning curve, to explore optimal CCUS deployment for China’s coal-fired power plant toward carbon neutrality. The commercialization application will occur in 2030–2035, with the optimal potential ranging between 248.54 GW and 564.90 GW. East China has the greatest potential, reaching 196.85 GW, followed by North China with the potential of 116.29 GW. The cost of second-generation capture technology will decrease from 219 CNY/ton CO2 to 165 CNY/ton CO2 during 2030–2031.The annual corporate expenditure (R&D investment and capture cost) and government expenditure (subsidy) will peak at 23.92 billion CNY in 2035 and 63.71 billion CNY in 2044, respectively. The financial burden can be lessened by carbon trading market and third-party intervention in the later period.
Subject areas: Energy resources, Energy policy, Energy management, Energy modeling
Graphical abstract
Highlights
-
•
Optimal deployment for CCUS in China is explored in a dynamic environment
-
•
Retrofitting potential will range between 248.54 GW and 564.90 GW in 2030–2035
-
•
Annual corporate expenditure will peak around 2035 because of technology update
-
•
Operational risk from large-scale application causes increasing subsidy until 2044
Energy resources; Energy policy; Energy management; Energy Modeling
Introduction
Carbon capture, utilization and storage (CCUS), which can remove CO2 emissions directly at the source, has been regarded as an essential part of the global toolkit toward a carbon neutral-future. Achieving the ambitious targets proposed in the Paris Agreement typically rely on greenhouse gas emission reductions combined with net carbon dioxide removal (CDR), mostly accomplished through large-scale application of CCUS technology in addition to afforestation.1 According to IEA,2 CCUS will account for nearly 15% of the cumulative emission reduction in sustainable development scenario by 2070 when global CO2 emissions from the energy sector fall to zero, and 10.4 Gt of CO2 is projected to be captured from across the energy sector by then.1,3 Remarkably, the global cost of achieving 450 ppm CO2-equivalent in the atmosphere by 2100 would rise by 138% without large-scale application of CCUS.2,4 Moreover, CCUS is a crucial option for avoiding large-scale “lock-in” emissions while also offering effective asset protection and boosting the required dispatchable energy for flexibility and resource adequacy from intermittent renewable generation.5
China, as the world’s largest developing country and carbon emitter, is committed to peaking CO2 emissions before 2030 and achieving carbon neutrality before 2060. The large-scale energy infrastructures, including coal-fired power plants (CFPPs) and industrial facilities, have an enormous demand for emission reductions. Although renewables have always been a substantial part of the climate solution, the major emission-intensive industries will still use fossil fuel for a long term because of the endowment resource rich in coal.6 In this context, negative emission technologies play a critical role in achieving near-zero emissions in China, with captured carbon accounting on average for 20% of the total reductions in 2050.3 Moreover, it is further estimated that China’s negative carbon emissions will contribute nearly one-fifth of the global negative emissions in 2100, with its CCUS-captured emissions accounting for 14%.7 Undoubtedly, CCUS technology is capable of helping the energy sectors align with China’s carbon neutrality goal.8 Considering that the power sector is required to achieve full decarbonization by 2050, the initial focus of China’s CCUS deployment should be targeted at retrofitting existing CFPPs accounting for approximately 50% of the total capacity globally9 and 40% of global energy-related emissions.10 Presumably, China should retrofit at least 185 GW of coal-fired power installed capacity with CCUS technologies by 2035.11 According to the most recent official roadmap, CCUS technology should be commercialized by 2035 in China, and its emission reduction demand is estimated at approximately 1–1.82 billion tons in 2060 under the carbon neutrality target.12 Furthermore, it is anticipated that delaying commercialization will increase the cost of mitigation to $626 billion by 2050 to meet the 2°C warming target.13 At present, the annual CCUS funding has consistently represented less than 0.5% of worldwide clean energy technology investment, and related facilities around the world only have the capture capacity of more than 40 Mt CO2 each year, far from living up to its promise. Therefore, deployment in advance is viewed as integral to meeting China’s climate ambitions and avoiding asset stranding, and is also critical to the global CCUS development and net-zero emissions.
As a matter of fact, China has been well-positioned to demonstrate global leadership in CCUS technology, owing to the special technical scheme, a number of CCUS full-process projects, and increasing progress in R&D and demonstration capability. Basically, the CCUS industrial chain is relatively well developed, and the overall technological maturity is at a high level, not far from the international level. Nevertheless, the current operating projects still remain at pilot scale or lab scale, which can largely be attributed to the technical issues, cost overruns and the dearth of incentive policies. Notwithstanding this, “large scale” and “commercial operation” are terms repeatedly mentioned across CCUS discussions around the world, in which the preoccupation with technology cost reduction persists highly. Aiming at pushing ahead with the CCUS investment in electric power sector, related researches have been carried out by domestic and foreign scholars through various mathematical methods.14,15,16,17 Specifically, on the one hand, it involves the evaluation of the total system levelized cost of the CCUS full-life cycle deployment.18,19,20 On the other hand, the retrofitting potential and option value are evaluated from the perspective of carbon price and carbon tax under uncertain investment circumstances.21,22 It is worth noting that Kang et al.13 explored the economically optimal CCUS deployment in China for 2°C target, indicating that the retrofitting capacity for power sector will reach 499 GW with the abatement cost of 330 billion US dollars by 2050. Admittedly, the high cost of CCUS technology has somewhat hindered its large-scale deployment, and therefore the government incentive is extremely necessary, especially in the early stage. As a means for encouraging CCUS deployment, subsidies are favored by stakeholders, although is not the optimal choice because of potential market distortion.23 Generally, energy related subsidies can be achieved by feed-in-tariff or tax refund. Many scholars have discussed the effect of policy subsidy on CCUS development.21,24,25,26,27,28 Notably, given the severe fiscal burden arousing from the traditional fiscal subsidies, the non-fiscal policy subsidy, extending additional electricity quotas, for early demonstration projects is also discussed.29
In view of the policy deficiency, the promoters advocate that CCUS retrofitting could benefit from a large potential of cost reduction caused by learning-by-doing.30,31 The exponential form of the learning effect is the most common expression, presenting a constant percentage of cost decrease for every doubling of capacity.13,32 Accordingly, to depict dynamic CCUS development, both one-factor learning curves based on cumulative capacity and two-factor learning curves based on R&D input have been considered.27,33,34,35,36,37 In addition, the technology options have also been explored.38 CCUS requires two generations capture technology development to be commercially available and economically viable. First-generation technology is costly but essential to be demonstrated in “first-of-a-kind” large-scale projects without the need for further development, whereas the second-generation technology is capable of improving the economic feasibility, energy penalty and abatement performance because of better capture solvents, higher efficiency boilers, better integration. In China, few power plants will probably utilize second-generation capture technology without rational deployment even though the second-generation capture technology matures. Generally, the CFPPs have a lifetime of 40 years, and the recovery period for CCUS investment generally requires at least 15 years21 Consequently, it is almost impossible to upgrade the more advanced second-generation capture technology for CFPPs with first-generation capture technology.37 Ultimately, many CFPPs in China will face a high risk of technology lock-in.
The existing research has made significant contributions to the techno-economic analysis to accelerate commercialization of CCUS. However, there is a distinct lack of discussions on the optimization of investment cost, retrofitting capacity and policy incentive in multi-period considering the learning effect and technology upgrade. Importantly, although the initial investment is completed, the subsequent operational risks of CCUS technology may result in the long-term operating and maintaining cost. In this context, this study aims to explore the optimal CCUS deployment path for China’s power sector in a dynamic and uncertain environment, applying a comprehensive framework integrating nonlinear dynamic optimization, real option and technology learning curve. Specifically, the technical learning effect characterized by nonlinearity is primarily interpreted by learning coefficients of learning-by-doing and learning-by-researching, through which the annual capture scale and cost efficiency of the first- and second-generation CCUS technologies can be assessed reasonably in a dynamic environment. Moreover, the interaction among capture cost, R&D cost and government subsidy is identified through dynamic programming integrating real option and endogenously learning effect. In addition, the spatial and temporal layout is also investigated based on the regional heterogeneity in installed capacity, storage potential and capture cost.
Results
Current development status of CCUS technology in China
In China, the Technology Readiness Level (TRL) of various CCUS technologies is constantly improving, reflecting on the significant progress made in low-cost, low-energy capture technology, chemical/biological CO2 comprehensive utilization, enhanced deep salt water recovered and storage and other technologies, which have reached the international advanced level. In addition, China has the capacity to build the million-ton CCUS demonstration project and has also accumulated a great deal of engineering experience. By 2022, there had been approximately 50 CCUS demonstration projects in operation and planning, with a capture capacity of 2–3 Mt CO2/a, mainly applied in petroleum, coal chemical, power, cement, steel and other industries. It is clear that by 2030, existing technologies will be ready for commercial application and industrialization. The cost and energy consumption of the first-generation capture technology will reduce by 10–15% compared with the current one, and the cost of second-generation capture technology is close to first-generation technology. By 2035, the cost and energy consumption of first-generation capture technology will further reduce by 15–25% compared with current one, and the second-generation capture technology would achieve commercial application with a cost reduction of 5–10% compared to the first-generation capture technology.12,39
In terms of the policy support, China and other countries/organizations jointly established the Carbon Sequestration Leadership Forum (CSLF) in 2003, aiming to promote the CCUS technology development via internationally collaborative efforts. Afterward, as China became the largest carbon emitter, the government decided to draw more attention to CCUS technology and introduced a range of policies, regulations and guidelines to promote its development, such as three specific CCUS road maps issued in 2011, 2015 and 2019.
Potential evaluation with CCUS commercial retrofitting
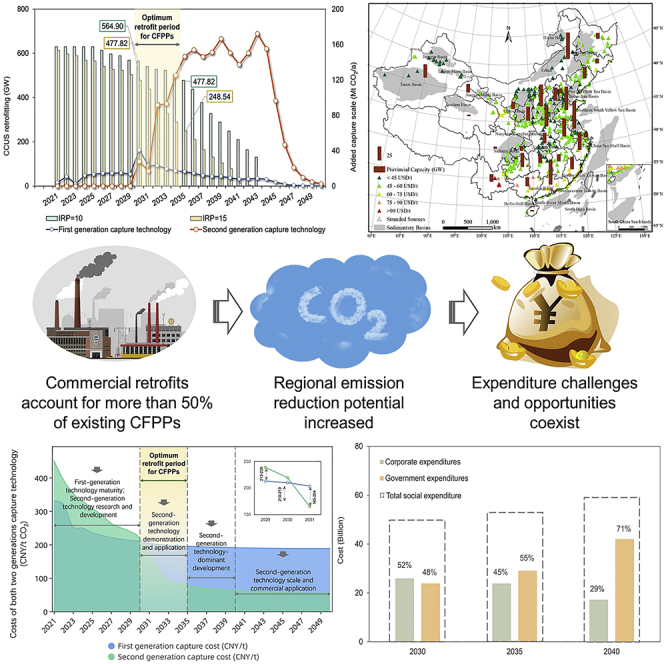
In China, the total installed capacity of coal-fired units in operation after 1996 reaches 841 GW. Because of the 40-year operating life of coal-fired units, we provide a comprehensive assessment of the CCUS commercialization potential and capture scale with the comprehensive concern of residual life and two types retrofitting investment recovery periods (IRPs): One is 15 years (IRP = 15) and the other is 10 years (IRP = 10).21,37 As shown in Figure 1, the total CCUS retrofitting potential will gradually decrease over time under the two IRPs without taking into account the new-built CFPPs in China, especially from 2030. It can be observed that the potential will reach 477.82 GW (56.82%) by 2030 and then drop to 248.54 GW (29.55%) by 2035 if the investment recovery period is 15 years. Afterward, the retrofitting potential continues to drop, even less than 100 GW by 2040, and would then further tend to be nearly zero from 2041 onwards. In this case, most of the CFPPs will face two kinds of situations: on the one hand, they lost the retrofit opportunity because of the late commercialization of second-generation capture technology and the progressively shorter operating life of coal-fired power plants; on the other hand, most of these CFPPs will be retrofitted with first-generation capture technology, resulting in the technology lock-in risk. It is noteworthy that the total retrofit potential would increase significantly if the IRP reduced from 15 to 10 years, although it would also see a marked decline after 2035. To be specific, the CCUS retrofitting potential will reach 564.90 GW (67.17%) by 2030 and 477.82 GW (56.82%) by 2035, respectively, whereas it will rise from almost zero (IRP = 15) to 130.71 GW in 2043.
Figure 1.

CCUS commercial retrofit potential and change in capture scale
The results describe the variation trend of CCUS retrofitting potential under the two IRPs, and the line graph shows the variation of added capture capacity over time between the both two generations of capture technology.
China has promised to peak its carbon dioxide emissions before 2030, and then CO2 emissions will enter the phase of rapid decline, leading to the preferential demand for CCUS technology. Currently, almost half of CFPPs in active service are less than 10 years old, with a long residual service life. Thus, if two-generation CCUS technologies are not deployed reasonably and timely, the residual life of these CFPPs will be difficult to recover retrofit investment. On the one hand, some CFPPs will suffer technology lock-in risk caused by the first-generation technology and fail in adoption the second-generation technology. One the other hand, some infrastructures will inevitably be decommissioned in advance under the mandatory emission constraints, resulting in a large number of assets stranded.21,37 Moreover, the cost of the second-generation capture technology will also decrease significantly by 2030, making it economically viable for CCUS deployment. In this case, the CCUS technology roadmap and related national policies identify 2030–2035 as the optimal retrofitting period. On the whole, during the optimum retrofit period from 2030 to 2035, reasonable CCUS deployment enables 29.55–67.17% of China’s coal-fired power plant to achieve low-carbon transformation. Regardless of the investment recovery periods, the IEA’s retrofitting target of 185 GW in 2035 can be satisfied.11 Apparently, deployment in advance and shortening the investment payback recovery are crucial, with the retrofit potential reaching 564.90 GW if the commercialization time can be advanced to 2030.
In addition, the capture capacity of first-generation and second-generation capture technologies varies greatly from year to year. It can be found that the CCUS retrofitting of CFPPs is dominated by first-generation capture technology during the period of 2021–2030, with the capture scale increasing from 4.17 to 40.70 Mt CO2/a, whereas the second-generation capture technology is in its infancy and should be in the R&D demonstration stage without deploying on a large scale simultaneously, with the capture scale increasing from 0 to 27.95 Mt CO2/a. After this, however, the newly added capture scale with first-generation capture technology will start to decline gradually, corresponding to the continuous explosive growth for that with second-generation capture technology whose scale will reach 146.59 Mt CO2/a in 2035, with an increase of 4.2 times compared with that in 2030. Remarkably, the second-generation capture technology will be commercially available by 2035 and will be the primary technology applied by China’s thermal power industry to realize decarbonization. By 2043, the retrofitting potential tends to be zero with the 15-year IRP, whereas the capture scale will peak at 172.37 Mt CO2/a CO2. Since then, the annual newly added capture scale will experience a marked drop because of the continuous improvement of technology maturity and decline of the retrofitting potential of CFPPs, whereas it still maintains an overall growth trend. Overall, the capture scale of first-generation capture technology basically stays at a relatively low level during the whole study period, whereas the second-generation capture technology rapidly becomes the predominant technical means after 2030.
Regional-level CCUS retrofit potential evaluation
It is extremely vital to reveal the detailed CCUS retrofitting potential of CFPPs in different regions from the spatial level perspective when deciding on an appropriate CO2 storage area. Currently, the most suitable regions for inland CO2-EWR and CO2-EOR are mainly located in the northwest, northeast and north of China.20 As illustrated in Figure 2, the distribution of CFPPs in China is characterized by “more in the southeast and less in the northwest”, and there is a large potential for CCUS retrofitting in East China with relatively concentrated CFPPs, reaching 196.85 GW. The potential in North China is 116.29 GW, which is slightly lower than that in East China. In northwest, central and South China, the potential is at the medium level, which is 78.61, 71.30 and 63.13 GW, respectively. The regions with the least potential are southwest and northeast China because of the decentralized and small-scale CFPPs, with the value of 49.36 and 37.89 GW, respectively.
Figure 2.

CCUS retrofitting potential and sequestration tech-economic assessment of CFPPs at the regional level in China
The results are tech-economic evaluation based on the source-sink matching of China’s CFPPs. The column represents the CO2 emission reduction potential realized by CCUS retrofitting in different regions, and the different color triangles represent differentiated CO2 sequestration costs at the current location.
Specifically, the basins suitable for CO2-EWR in China have a large distribution areas and great storage potential, among which Junggar Basin, Tarim Basin, Qaidam Basin, Songliao Basin and Ordos Basin are the best choices. It is estimated that CO2-EWR technology can achieve a theoretical storage capacity ranging from 1210 to 4130 billion tons CO2 at 10 and 90% confidence level, accompanying with recoverable ground water approximately 1330–6190 billion tons.40 The optimal areas for CCUS retrofitting are proved to be North China, East China and South China based on the cost-effective source-sink matching within a distance of 800 km, among which the eastern and northern sedimentary basins have relatively favorable spatial matching with carbon source distribution (such as Bohai Bay Basin, Ordos Basin and Songliao Basin). The geological conditions for sequestration are relatively well in the northwest, but the distribution of carbon sources is relatively scarce.40 In addition, most CFPPs, located in the southern coastal area, can pay attention to the demand of offshore CCUS projects requiring offshore infrastructure, including offshore platforms and subsea pipelines, making them more costly and challenging than onshore CCUS projects.20
Actually, the techno-economic analysis of CFPP with CCUS retrofitting for China has been performed, noting that the capture cost ranges from 35 to 80 USD/t CO2.13,38,41 However, most of them provided the preliminary knowledge of CCUS used in decarbonizing China’s power sector, ignoring the spatiotemporal variation of capture cost resulting from technology upgrades and regional differences. In this study, the plant-level capture cost is provided. Specifically, it estimates that most of these projects will come at a high cost, with the value of 45–60 USD/t CO2, whereas in the Sanshui Basin, Erhai Basin and Jinggu Basin, the cost can be as high as 60–90 USD/t CO2 and even more than 90 USD/t CO2. By contrast, the lowest cost below 45 USD/t CO2 can be observed in Junggar Basin, Jianghan Basin, Bohai Bay Basin and Ordos Basin. As a result, CCUS projects are not currently being deployed in South China considering the high cost and technical limitations of offshore storage despite the great potential for CCUS retrofitting.
Capture cost assessment with CCUS commercial retrofitting
Figure 3 illustrates the capture cost curve for both two generations capture technology. Around 2030, the two generation technologies are predicted to reach break-even point, with the capture cost of first-generation technology lower than that of second-generation technology. Whereafter, the second-generation capture technology will gradually begin to be demonstrated on a scale and its capture cost will usher in a new breakthrough based on learning-by-doing and learning-by-researching. From 2030 to 2031, it will decrease from 219 CNY/t CO2 to 165 CNY/t CO2. If CCUS commercialization is realized at this time, the retrofitting potential will reach 564.9 GW (IPR = 10 years) and 477.7 GW (IPR = 15 years). Overall, the first-generation capture technology will hit a wall after 2030, whereas the second-generation capture technology will witness a continuous cost reduction and become more appealing.
Figure 3.

Trends in unit costs of both two generations capture technology
The results describe the cost variation of intergenerational replacement of capture technology. In 2021–2030, the first-generation capture technology will be the main technology, and the second-generation capture technology is in the research and development stage. 2030–2035 is the window period for demonstration and application of the second-generation capture technology. From 2035 to 2040, the second-generation technology will be basically mature and large-scale application will begin. After 2040, the second-generation technology will be commercialized gradually. The result in the upper right corner describes the change in intergenerational costs around the break-even point.
During the period from 2031 to 2040, the cost of second-generation capture technology still shows a downward trend with a significant drop, reaching at about 62.8 CNY/t CO2 by 2040. In contrast, the first-generation capture technology cost roughly remains at about 190 CNY/t CO2. The second-generation capture technology has become the main capture technology for CCUS retrofitting since 2035, with the capture cost staying in a slow and stable trend. Subsequently, it will continue to mature by 2040 with the space for cost reduction gradually decreasing.
Assessment of total capture cost and subsidy level with CCUS commercialization
As CCUS retrofitting is affected by the corporation itself, as well as the policy support, the annual capture cost, R&D investment and subsidy level of CCUS retrofitting from 2021 to 2050 are investigated (Figure 4). It should be noted that the R&D investment mainly refers to the R&D cost of the enterprise for the second-generation capture technology in this study. Moreover, China’s financing modes for CCUS deployment are currently not well developed and government subsidy is considered as the most effective incentive. However, it is possible to establish a market-oriented incentive mechanism to ease the financial burden, so as to form a sustainable CCUS industrial chain.
Figure 4.

Assessment of various types of costs and subsidy levels for the commercialization of CCUS
(A–C) The results mainly discuss the capture cost of the both two generations technology, corporate R&D investment (A) and corresponding government subsidy level (B) in different retrofitting periods. Cost proportion among the first- and second-generation technology, and the corporate R&D investment is depicted in (A), and finally, the overall corporate expenditures, government expenditures, and total social expenditures are comprehensively counted (C). Corporate R&D investment mainly refers to the investment cost of the enterprises for the second-generation capture technology. The total capture cost represents the sum of the two generations technology costs and the R&D investment from enterprises with the second-generation capture technology. The level of subsidy in this paper refers to any form of subsidy from the government as it does not consider the specific funds classification.
Of interest, the annual capture cost roughly presents an “inverted U” type trend, whereas the R&D investment can be observed a moderate “N” type trend (Figure 4A). With the development of the second-generation capture technology, the scale of the first-generation capture technology has declined and shows a trend of decreasing year by year. By 2030, as the second-generation capture technology begins to be demonstrated with a scale of 27.95 Mt CO2/a, the capture cost and R&D investment will go up significantly, reaching at 14.68 billion and 11.24 billion CNY, respectively. However, the scale of the second-generation capture technology suddenly decreases to 16.86 Mt CO2/a in 2031 because of the limitation of the initial technology development capability, with a correspondingly larger reduction in capture cost. Subsequently, the second-generation capture technology will increase to 91.6 Mt CO2/a by 2032 and the capture cost presents a significant surge, possibly because of the demand for emission reduction and the stimulus of relevant policies. With the continuous technological progress, the second-generation capture technology will gradually replace the first-generation capture technology, and its capture cost will reach 11.42 billion CNY with a slightly reduced R&D investment of 9.3 billion CNY by 2035. Owing to the gradual decommissioning of the CFPPs, the newly added capture scale will remain largely low and R&D investment will decline continuously, bottoming at 51.69 billion CNY in 2043. Afterward, the capture cost will continue to fall, whereas R&D investment will continue to rise steadily because of the further technology updating to promote the CCUS high-quality development and commercialization.
The continuous expansion of CCUS retrofitting scale may lead to excessive financial burden, and therefore the optimal subsidies is likely to increase for a long time. The government subsidy pictures an obvious “inverted U” shape, peaking at 63.71 billion CNY in 2044 (Figure 4B). Specifically, from 2021 to 2030, the policy subsidy continues to rise with the increasingly total capture cost, reaching at 23.96 billion CNY by 2030. Notably, although the total CCUS cost starts to decrease after 2031, it is still essential to increase the policy subsidy considering the risk factors, such as CCUS facility investment, in the whole CCUS process system. Moreover, CCUS full lifecycle would achieve unprecedented development beyond 2040, which initially form CCUS new format with Chinese characteristics, and policy subsidies level would to be significantly improved, reaching its peak in 2044. The subsidy level is also more favorable for decarbonization policy incentives and investment with the continuous R&D progress.
To achieve the 2°C target, the total abatement cost of CCUS technology in China has been assessed by many scholars, reaching one trillion dollars or more.42,43 However, based on a dynamic nonlinear optimization model, we found the total abatement cost is not quite as high as that, and the our estimated results are roughly consistent with the studies conducted by Kang et al.13 and Yao et al.27 To be specific, the total CCUS commercialization cost will be 25.92 billion CNY by 2030, of which 33.0% will be spent on first-generation capture technology demonstration projects, 43.4% on corporate R&D of second-generation capture technology, and the remaining 23.7% on second-generation capture technology demonstration projects (Figure 4A). By 2035, the total CCUS enterprise expenditure cost will peak at 23.92 billion CNY, of which the capture cost for the second-generation technology demonstration project goes up to 47.7%, the corporate R&D and innovation demonstration cost of the second-generation capture technology decreases slightly to 38.9%, and the remaining 13.4% is used for the demonstration project construction of the first-generation capture technology. In addition, the corporate R&D investment of second-generation capture technology in 2040 is lower than that in 2030 and 2015 as the high technology maturity, but still at a high level. At this time, investment in demonstration projects with second-generation capture technology accounted for more than half of the total CCUS commercialization cost, which is 56.9% higher than that in 2030, and corporate R&D and innovation investment accounted for 35.0%. Although the proportion of the first-generation capture technology demonstration projects continues to decrease, with a 69.1% cost reduction during the decade. As a whole, the total social expenditure, including corporate related R&D investment and capture cost and government-related subsidy, will rise from 49.88 billion CNY in 2030 to 59.26 billion CNY in 2040 (Figure 4C). The corporate-related expenditure accounts for 52% in 2030, whereas it declines to 29% in 2040. This can be attributed to the large-scale facility investment from the government in along with the widespread adoption of second-generation technology and rapid development of CCUS commercialization.
Discussion
CCUS is widely recognized as being uniquely valuable to meeting climate goals. We construct a comprehensive model, integrating the nonlinear dynamic optimization, real option and technology learning curve, to explore the CCUS retrofitting potential of CFPPs in China from 2021 to 2050, considering the uncertainties of technology lock-in risk and IRPs (Figure S1). Meanwhile, the multi-period capture cost, R&D input cost and required subsidy level in a dynamic and uncertain environment are also estimated. Obviously, there is a large potential for CCUS retrofitting in East China with relatively concentrated CFPPs, reaching 196.85 GW, and the retrofitting potential in North China is 116.29 GW, which is slightly lower than that in East China. We interpret cost-learning effects with nonlinear characteristics based on technological progress and lock-in risk through technology learning coefficients, as well as the carbon price and technology attenuation rate to minimize the demonstration cost and R&D cost of the two generations capture technology. The break-even point between first- and second-generation capture technologies is expected to occur around 2030. Considering the high cost pressure from the expansion of CCUS retrofitting scale, we further identified the interaction between subsidy level, R&D investment and capture cost through dynamic programming and endogenously learning effect. Although the R&D investment is estimated at up to 11.24 billion CNY in 2031, it would likely decline to 51.7 billion CNY in 2043 because of the continuous maturity of the second-generation capture technology. It is still essential to increase the policy subsidy considering the risk factors such as CCUS facility investment, source-sink matching pipeline construction investment, and additional storage cost caused by uncertain geological conditions in the whole CCUS process system, resulting in the subsidy level peaking at 63.71 billion CNY in 2044. Generally, three different subsidy manners, including initial investment subsidy, electricity tariff subsidy and CO2 utilization/storage subsidy, can be applied for CCUS development.25 Actually, China has not yet established specific fiscal support and incentive mechanisms for CCUS development until now. By contrast, the European Union (EU) incorporated CCUS into the carbon trading system (ETS) and relied on higher carbon trading prices to reflect the value of CCUS emission reduction; the US Government enacted the Section 45Q tax credit regardless of whether the CO2 was used for EOR and stored in 2008, and further amended the tax credit in 2018, significantly increasing and enhancing it in a variety of ways. At present, the tax credit is set to rise over a period of years to $35 per ton of CO2 captured from an industrial source and stored through EOR, and $50 per ton for CO2 stored in a non-producing geologic formation, greatly improving the enthusiasm of high-emission enterprises to construct CCUS projects. From this, some scholars suggested that China could draw on the 45Q tax credit and EU-ETS provisions, proving that storage/EOR subsidy is conducive to form a complete CCUS industrial chain and therefore can be considered as an effective mechanism to promote CCUS development.25,44 More importantly, the current subsidy level referring to the 45Q Tax Credit can lower critical carbon price and is high enough to trigger CCUS investment because of low labor and production costs in China.25
The financial burden can be lessened by means of carbon trading market and third-party intervention in the later period. To be specific, first, although the entities with CCUS retrofitting have not been incorporated into the carbon trading scheme in China as a result of unanticipated impacts on vulnerable carbon market, they are necessary to be involved in carbon trading market in the future. Notably, the critical price for CCUS investment has been proved to 103.56–700 CNY/ton CO2, whereas the current global carbon price and Chinese carbon price are far from desirable level to trigger CCUS investment.21,38,45,46 Therefore, a significant increase in carbon price is needed through applying a price incentive directly proportional to the greenhouse gas emissions generated by a given product or activity. Second, the government can establish CCUS development fund, open up CCUS green finance channel, and launch CCUS climate investment and financing pilot. Third, it is suggested to introduce the third-party companies (e.g., high-tech enterprises, venture capital firm), which are responsible for technical solutions and capital chain, to develop the flexible business model.
Overall, we found that the future emission reduction potential of CCUS technology in China is huge, whereas it is difficult to release the potential because of the maturity of key technologies and economic efficiency in each link of CCUS. Reasonable industrial integration based on industry characteristics and regional characteristics can effectively reduce cost. In the next 10 years, with the continuous technology enhancement and the increasingly intensive policy incentives, the maturity and economy of CCUS technologies will continue to improve, and the emission reduction potential will be gradually released as they gradually enter the stage of commercial operation. At present, selecting the right early opportunity is critical to the development of CCUS technology, and the intergenerational transformation of CCUS technology should be carried out. To conclude, we put forward some suggestions. First, to reduce the possibility of technology lock-in risk, the two generation technologies must be deployed in a systematic manner. It is essential for the government to help enterprises to speed up the R&D demonstration of the new-generation capture technology before 2030 so as to reduce the capture cost and energy consumption. Meanwhile, the application of first-generation capture technology should be appropriately restricted to clear space for the advancement of second-generation capture technology. Second, the government and power companies should keep the total CCUS commercialization cost under reasonable control, that is to say, the investment allocation ratio between both two generations capture technology should be clarified. Particularly, the government can take some measures to boost the carbon price suitably and gradually integrate CCUS into the carbon market to incentivize CCUS development. It is suggested that the government should set the total emission reduction properly and reduce the carbon quota appropriately, plan the financial market mechanism and raise the carbon tax to some extent. In addition, the enterprises need to adjust their production and operation decisions reasonably according to the carbon trading market to ensure stable carbon price expectations. Finally, it is necessary to accelerate technology learning and R&D investment to stimulate the development of second-generation technologies, and thus reduce the subsidy level for future CCUS retrofitting. In addition, with reference to the current subsidy policy for renewable energy technologies, the government should further improve the subsidy scheme for the CCUS technology to make up for the policy deficiency at present.
Limitations of the study
Currently there are still some limitations regarding to the technology learning curve model. The fluctuation and uncertainty of the technology learning rates over time have not been fully taken into account in our study. In terms of future studies, scenarios of technology learning rate changes at different stages will be further considered, and the impact of technological advances on CCUS retrofitting costs will be assessed in a comprehensive manner by stages.
STAR★Methods
Key resources table
| REAGENT or RESOURCE | SOURCE | IDENTIFIER |
|---|---|---|
| Software and algorithms | ||
| Microsoft Office 2019 | Microsoft | https://www.microsoft.com/zh-cn/microsoft-365/microsoft-office |
| MATLAB 2018b | Mathworks | https://www.mathworks.com/products/matlab.html |
Resource availability
Lead contact
Further information and requests should be directed to and will be fulfilled by the lead contact, Dr. Xian Zhang (zhangxian@acca21.org.cn).
Materials availability
This study did not generate new unique materials.
Experimental model and subject details
Framework of the optimization model
Currently, the CCUS commercial retrofitting faces many uncertainties, including carbon price fluctuations, technology lock-in risks, power plant residual lifetime, and investment recovery period, etc. According to the research on CCUS demonstration evaluation, the capture cost accounted for the largest proportion with 60–80% of the total process cost.47,48,49 Moreover, the improvement of capture technology is also one of the biggest contribution factors to the reduction of the overall CCUS cost. In this context, this paper constructs a comprehensive model integrating the technology learning curve, real option and objective optimization model to achieve the optimal capture cost and subsidy level based on the premise of meeting the CCUS commercial retrofitting potential proposed by IEA and assisting in China’s carbon neutrality goal. Typically, the objective function is to minimize the capture cost, which is restricted by the per unit capture cost and the newly added capture scale. More details are shown in Figure S1. These three models will be detailed in supplementary information.
This dynamic optimization model is based on the expected conditions satisfying certain constraints, and we have actually used the Monte Carlo simulation to examine the effectiveness and robustness. We first simulate thousands of scenarios of the drift rate based on the stochastic process of Brownian motion to seek the feasible and optimal solution. Then, we take each of the simulated price paths into the model to calculate the subsidy level derived under expected condition. Finally, the re-calculated results under simulation are adopted to test the robustness of the optimized subsidy levels and R&D inputs in achieving the capacity target and minimized costs.
Model assumption
Based on the above, the following assumptions are formulated.
-
(1)
The CFPPs in China will most likely not be built on a large scale.
-
(2)
The basic installed scale for CCUS retrofitting ranges from 300 MW to 600 MW.
-
(3)
The first-generation capture technology matures to be commercially applied by 2030; the second-generation capture technology is gradually tested for industrial application after 2031.
-
(4)
Considering the current environmental policy in China, we assume that units above 600 MW will have a 40-year operating lifetime, smaller units will have a 30-year operating lifetime, and units smaller than 300 MW will be abandoned by 2025.
-
(5)
The characteristics of power plant itself, include age, size, load, and location, have significantly impact on commercial retrofits in-service plants. In response to these feature, IEA11 has specified the relevant technical suitability criteria for CCUS retrofitting of CFPPs (Table S1).
Method details
CCUS technology learning curve model
The link between CO2 capture costs and R&D demonstration investments is determined by using technology learning curve models, thus reflecting the degree of technological progress.50 A single-factor learning curve was used for the first-generation capture technology and a two-factor learning curve was used for the second-generation capture technology. In terms of the first-generation capture technology, only by establishing demonstration projects (learning-by-doing) can capture expenses be reduced.
| (Equation 1) |
| (Equation 2) |
Meanwhile, the second-generation capture technologies also need to be further improved, so the development of demonstration projects should be accompanied by increased investment in research to facilitate CCUS commercialization (learning-by-researching).
| (Equation 3) |
| (Equation 4) |
| (Equation 5) |
where and denote the initial capture scale of first-generation capture technology and second-generation capture technology (Mt CO2), respectively. and denote the capture cost in year t, respectively; anddenote the learning rate of learning-by-doing and learning-by-researching with second-generation technology.
Actual cost of first-and second generation capture technology:
| (Equation 6) |
| (Equation 7) |
| (Equation 8) |
| (Equation 9) |
| (Equation 10) |
| (Equation 11) |
where denotes the R&D and demonstration cost in year t; denotes the incremental of knowledge stock in period t.
Critical carbon price-based real options model
A real options is a crucial tool for evaluating value and making strategic decisions. For large investment projects with greater uncertainty (including the irreversibility of investment, the uncertainty of future cash flow, and the flexibility of investment timing), the real options model can delay investment judgment to appropriate time, thus providing new investment opportunities.51
The critical carbon price is the carbon price that must be met to trigger CCUS investment in CFPPs under the real option regulation.21 The volatility of carbon price, which reflects the uncertainty of carbon price, is an important factor influencing CCUS retrofitting. A carbon price can be regarded as the price that power plants pay for their carbon emissions, and CCUS could avoid these extra costs. According to the study of Abadie and Chamorro,52 carbon price adjustments have the greatest impact on the subsidy prices development. Energy prices are usually modeled as non-stationary random processes.21 represents the price of carbon in year t.
Based on Insley,53 the carbon pricing change is assumed to be a random process with considerable volatility and drift., implying that the carbon price is governed by Geometric Brownian Motion (GBM) and follows a non-stationary random process:
| (Equation 12) |
where represents the emission price of 1 ton of carbon dioxide in time t, and . Typically, represents the projected growth rate and indicates the instantaneous fluctuation of the carbon price. is the increment of the standard Wiener process, denoted as , where is a regularly distributed random variable with a mean of 0 and a SD of 1. Therefore, applying the initial carbon price and Equation 12, the future carbon price can be estimated.
According to Laurikka and Koljonen54 and Abadie and Chamorro,52 we got . Meanwhile, applying Ito’s Lemma, we could get:
| (Equation 13) |
Based on the background of risk neutrality, the risk neutral function of this equation is:
| (Equation 14) |
At this point, the forward price F(·) (€/t CO2) is the projected spot price in a risk-neutral situation, thus making the current value of the forward contract equal to zero. In addition, the properties of lognormal distribution (X) show that:
| (Equation 15) |
After simplification, we get:
| (Equation 16) |
Writing the above equation in logarithmic form yields, we get:
| (Equation 17) |
In summary, based on a series of discretized variations in Abadie and Chamorro,52 and combined with the research results of Yao et al.,27 we can obtain the expression of carbon price in t+1 period as follows:
| (Equation 18) |
where denotes the risk premium associated with the cost of existing thermal power plant. The parameter values are set as: = 0.2339.
In addition, when accounting for the cost of CCUS retrofitting, the project subsidy cost should also be considered. Applying the incremental cost accounting approach to assess the level of project subsidies, the cash flow of the CCUS technology in period t is:
| (Equation 19) |
where is the fixed subsidy level for CCUS retrofitting per capture scale in period t. CCUS retrofitting projects implemented in different periods may have different subsidy levels, and different critical carbon price would stimulate CCUS retrofitting to some extent. Therefore, direct subsidies might be turned into the necessary carbon price in each period to boost CCUS investment. We use to estimate the newly-added capture scale (DP). The predicted yield of CCUS retrofitting is equal to the risk-free interest rate r with 10% based on risk-neutral valuation.27
| (Equation 20) |
The incremental retrofitting profit and the instantaneous profit during dt make up the majority of the CCUS retrofitting profit. Since obeys the geometric Brownian motion (GBM), it likewise obeys the same drift rate and volatility of the GBM.55 Therefore, can be expressed applying Ito’s Lemma.
| (Equation 21) |
Since and is a normal distribution with , consequently . Therefore, the CCUS retrofitting benefit is the solution of the following constant coefficient homogeneous partial differential equation.
| (Equation 22) |
According to the standard argument, the specific solution takes the following form:
| (Equation 23) |
where is the basic component of the CCUS retrofitting benefits and is the speculative bubble. Based on the research results of Dixit and Pindyck55 and Boomsma et al.,56 the Yao et al.27 conducted a further study and obtained the CCUS retrofitting revenue with eliminating speculative bubble:
| (Equation 24) |
CCUS retrofitting cost optimization model
More than half of the CFPPs in China were built between 2005 and 2015, and will expect to decommission in 2035–2045 based on the operation life of 30–40 years. Considering the thermal power phase-out and capture technology progress, the first-generation capture technology should be industrialized around 2030, and the energy consumption and retrofitting cost of second-generation technology will be significantly lower than that of first-generation technology by 2035.12 It is planned that CCUS technology will be widely deployed and related industrial clusters will be set up by 2050 because of high technology maturity and favorable business environment, and therefore the final time point of relevant technologies in this study is set to 2050. Based on the above, the expression of the optimization model aiming at minimizing the capture cost is shown in Equation 25:
| (Equation 25) |
where TCOST denotes the total capture cost with CCUS; the time range of t is 2021–2050, which indicates the application phase of the transition from first-generation capture technology to second-generation capture technology.
Based on Equations 10 and 11, the relationship between the R&D costs () and cumulative experience of () of second-generation capture technology during year t can be expressed:
| (Equation 26) |
In the CCUS cost optimization model, the constraints are mainly reflected by CO2 capture cost and CCUS newly-added capture scale.
CO2 capture cost constraints
The second-generation capture technology must be more cost-effective than the first-generation capture technology before commercial large-scale application. On the one hand, existing technologies will be capable of realizing commercialization by 2030, so the cost constraint of first- and second-generation capture could be determined. On the other hand, the second-generation capture technology should be at least 30% less expensive than the first-generation capture technology through continuous experience accumulation,57,58 and the second-generation capture technology should not spend more than 220 CNY/t.37,57,58
| (Equation 27) |
| (Equation 28) |
where indicates the technology application time when CCUS is commercialized. For example, denotes the capture cost per unit of the second-generation technology when CCUS is commercialized in year .
CCUS capture scale constraint
At present, CCUS capture capacity and project scale are relatively limited in China, and to minimize capture costs and gain experience, various large-scale CCUS demonstration projects are required.
Most CCUS demonstration projects with first-generation capture technology are expected to be completed by 2030, with preliminary application of second-generation technology expected by 2035. According to China’s CCUS technology roadmap,12 the total capture scale will reach 9 Mt/a by 2025, while it will exceed 20 Mt/a by 2030 and 70 Mt/a by 2035, respectively. Based on the fact that the capture scale of first-generation technology cannot be too large to avoid technology lock-in risk, it is assumed that the average capture capacity is 1 Mt/a and the projects with first-generation technology are mostly completed before 2030 with a total number of 10–40.59 During the whole study period, the newly-added cumulative capture scale is 10–40 Mt with first-generation technology, as follows:
| (Equation 29) |
where denotes the newly-added capture scale in year t (Mt CO2/a).
Quantification and statistical analysis
Model solution
This study uses MATLAB software to solve the model. The goal of this model is to minimize the total cost of first-generation capture technology, second-generation capture technology, and R&D for CCUS under several constraints.
Firstly, a nonlinear optimization procedure is run given a set of initial values of variables and parameter values. In the cost-optimal objective model, there are 3 × 30 variables to be optimized (three cost types multiplied by 30 time periods, i.e., 2021–2050, with a time step of 1 year). Secondly, the model subroutines is run with cumulative capture size and capture cost, and R&D costing. All the above procedures are repeated from the first t period to the last cycle. Finally, the cumulative capture size and corresponding total cost per unit of capture for CCUS capture technologies from 2021 to 2050 are aggregated to ensure that the predefined targets are met. Finally, the nonlinear intertemporal convex optimization problem is solved using the Fmincon solver. This problem usually uses the interior point method to calculate the global optimal result and applies the interior point method as a function in MATLAB, thus setting a large feasible domain range for the variables so that the optimization is not affected by the feasible domain boundary. This iterative algorithm will first determine the termination condition. If it does not satisfy the termination condition, the value of the variable will change and it will proceed to the next iteration loop until the termination condition is satisfied to end the iteration. At the end of the entire iteration, a check is performed using exitflag to ensure that the minimum result is obtained and recorded (in MATLAB, exitflag = 1 indicates that the first-order optimal measure is less than the option, resulting in the optimal result).
Data
By 2017, there were 807 CFPPs operating with a total installed capacity of 841GW and average installed capacity of individual units being 350 MW in China. Based on the criteria for CCUS retrofitting, there are 508 CFPPs which meet the retrofitting requirements, with 1317 coal-fired units and a total installed capacity of 613 GW. The units were put into operation from 1995 to 2017, as shown in Figure S2. Regarding regional distribution, these units meeting the conditions for CCUS retrofitting are distributed in 30 provinces, as shown in Figure S3.
Parameter definition and value
Table S2 shows some of the parameters' details which determined from existing literature, official organizations and relevant institutions.
-
(1)
The initial capture costs for first- and second-generation capture technology are calculated according to the ADB.60 The former costs 330 CNY/t CO2 and the latter costs 450 CNY/t CO2.
-
(2)
There are no million-ton CCUS demonstration projects in China at the moment, and therefore, the first- and second-generation technologies' initial capture scales are set as 1 Mt CO2/a.
-
(3)
The initial carbon price is set about 56 CNY/t CO2 based on the study of Fan et al.,37 and the carbon price drift rate is determined by the study conducted by Wang and Du.46
-
(4)
The learning rate of the first-generation capture technology is set at 10%. For second-generation capture technology, the learning rates for “learning-by-doing” and “learning-by-researching” are set at 15 and 8%, respectively.
-
(5)
The attenuation rate of the capture capacity for capture technologies are obtained from Fan et al.37
Acknowledgments
This research was supported by the National Natural Science Foundation of China (U21B20102, 72104114, 72174186, 71804166), Program for Young Talents of Science and Technology in Universities of Inner Mongolia Autonomous Region, Philosophy and Social Science Planning Project of Inner Mongolia Autonomous Region (2021NDC179, 2021NDB167).
Author contributions
L.Y.: Conceptualization, data curation, supervision, validation, writing, review and editing. N.W.: Data curation, software, writing original draft. H.L.: Data curation, software, visualization, writing original draft. X.Z.: Data curation, software, visualization, writing original draft.
Declaration of interests
The authors declare that they have no known competing financial interests or personal relationships that could have appeared to influence the work reported in this paper.
Inclusion and diversity
We support inclusive, diverse, and equitable conduct of research.
Published: December 22, 2022
Footnotes
Supplemental information can be found online at https://doi.org/10.1016/j.isci.2022.105664.
Contributor Information
Haodong Lv, Email: lvhd318@163.com.
Xian Zhang, Email: zhangxian@acca21.org.cn.
Supplemental information
Data and code availability
Data: The datasets generated in this study are available from the lead contact on reasonable request.
Code: This paper does not report original code.
References
- 1.van Vuuren D.P., Stehfest E., Gernaat D.E.H.J., van den Berg M., Bijl D.L., de Boer H.S., Daioglou V., Doelman J.C., Edelenbosch O.Y., Harmsen M., et al. Alternative pathways to the 1.5 °C target reduce the need for negative emission technologies. Nat. Clim. Chang. 2018;8:391–397. [Google Scholar]
- 2.IEA . International Energy Agency; 2020. Energy Technology Perspectives 2020: Special Report on Carbon Capture Utilisation and Storage. [Google Scholar]
- 3.Duan H., Zhou S., Jiang K., Bertram C., Harmsen M., Kriegler E., van Vuuren D.P., Wang S., Fujimori S., Tavoni M., et al. Assessing China's efforts to pursue the 1.5 degrees C warming limit. Science. 2021;372:378–385. doi: 10.1126/science.aba8767. [DOI] [PubMed] [Google Scholar]
- 4.IPCC . In: Contribution of Working Groups I, II and III to the Fifth Assessment Report of the Intergovernmental Panel on Climate Change. Pachauri R.K., Meyer L.A., editors. Intergovernmental Panel on Climate Change; 2014. Climate change 2014: synthesis report. [Google Scholar]
- 5.IEA . International Energy Agency; 2020. The Role of CCUS in Low-Carbon Power Systems. [Google Scholar]
- 6.Li J., Tian Y., Deng Y., Zhang Y., Xie K. Improving the estimation of greenhouse gas emissions from the Chinese coal-to-electricity chain by a bottom-up approach. Resour. Conserv. Recycl. 2021;167:105237. [Google Scholar]
- 7.Zheng J., Duan H., Yuan Y. Perspective for China's carbon capture and storage under the Paris agreement climate pledges. Int. J. Greenh. Gas Control. 2022;119:103738. [Google Scholar]
- 8.Mallapaty S. How China could be carbon neutral by mid-century. Nature. 2020;586:482–483. doi: 10.1038/d41586-020-02927-9. [DOI] [PubMed] [Google Scholar]
- 9.BP . 69th edition. 2020. BP Statistical Review of World Energy. [Google Scholar]
- 10.IEA . International Energy Agency; 2021. An Energy Sector Roadmap to Carbon Neutrality in China. [Google Scholar]
- 11.IEA . International Energy Agency; 2016. Ready for Retrofit: Analysis of the Potential for Equipping CCS to the Existing Coal Fleet in China. [Google Scholar]
- 12.ACCA21 . 2019 edition. Science Press; 2019. Technology Roadmap Study on Carbon Capture, Utilization and Storage in China. [Google Scholar]
- 13.Kang J.N., Wei Y.M., Liu L., Han R., Chen H., Li J., Wang J.W., Yu B.Y. The prospects of carbon capture and storage in China’s power sector under the 2 °C target: a component-based learning curve approach. Int. J. Greenh. Gas Control. 2020;101:103149. [Google Scholar]
- 14.Dalla Longa F., Detz R., van der Zwaan B. Integrated assessment projections for the impact of innovation on CCS deployment in Europe. Int. J. Greenh. Gas Control. 2020;103:103133. [Google Scholar]
- 15.Holz F., Scherwath T., Crespo del Granado P., Skar C., Olmos L., Ploussard Q., Ramos A., Herbst A. A 2050 perspective on the role for carbon capture and storage in the European power system and industry sector. Energy Econ. 2021;104:105631. [Google Scholar]
- 16.Lohwasser R., Madlener R. Economics of CCS for coal plants: impact of investment costs and efficiency on market diffusion in Europe. Energy Econ. 2012;34:850–863. [Google Scholar]
- 17.Muratori M., Kheshgi H., Mignone B., Clarke L., McJeon H., Edmonds J. Carbon capture and storage across fuels and sectors in energy system transformation pathways. Int. J. Greenh. Gas Control. 2017;57:34–41. [Google Scholar]
- 18.Dahowski R.T., Davidson C.L., Yu S., Horing J.D., Wei N., Clarke L.E., Bender S.R. The impact of CCS readiness on the evolution of China's electric power sector. Energy Proc. 2017;114:6631–6637. [Google Scholar]
- 19.Renner M. Carbon prices and CCS investment: a comparative study between the European Union and China. Energy Pol. 2014;75:327–340. [Google Scholar]
- 20.Wei N., Jiao Z., Ellett K., Ku A.Y., Liu S., Middleton R., Li X. Decarbonizing the coal-fired power sector in China via carbon capture, geological utilization, and storage technology. Environ. Sci. Technol. 2021;55:13164–13173. doi: 10.1021/acs.est.1c01144. [DOI] [PubMed] [Google Scholar]
- 21.Zhang X., Wang X., Chen J., Xie X., Wang K., Wei Y. A novel modeling based real option approach for CCS investment evaluation under multiple uncertainties. Appl. Energy. 2014;113:1059–1067. [Google Scholar]
- 22.Wang N., Akimoto K., Nemet G.F. What went wrong? Learning from three decades of carbon capture, utilization and sequestration (CCUS) pilot and demonstration projects. Energy Pol. 2021;158:112546. [Google Scholar]
- 23.Heesh N. Low carbon policy and market mechanisms to enable carbon capture and storage and decarbonisation in Australia. Int. J. Greenh. Gas Control. 2021;105:103236. [Google Scholar]
- 24.Chen H., Wang C., Ye M. An uncertainty analysis of subsidy for carbon capture and storage (CCS) retrofitting investment in China's coal power plants using a real-options approach. J. Clean. Prod. 2016;137:200–212. [Google Scholar]
- 25.Yang L., Xu M., Yang Y., Fan J., Zhang X. Comparison of subsidy schemes for carbon capture utilization and storage (CCUS) investment based on real option approach: evidence from China. Appl. Energy. 2019;255:113828. [Google Scholar]
- 26.Wang X., Qie S. When to invest in carbon capture and storage: a perspective of supply chain. Comput. Ind. Eng. 2018;123:26–32. [Google Scholar]
- 27.Yao X., Fan Y., Zhu L., Zhang X. Optimization of dynamic incentive for the deployment of carbon dioxide removal technology: a nonlinear dynamic approach combined with real options. Energy Econ. 2020;86:104643. [Google Scholar]
- 28.Turner K., Race J., Alabi O., Katris A., Swales J.K. Policy options for funding carbon capture in regional industrial clusters: what are the impacts and trade-offs involved in compensating industry competitiveness loss? Ecol. Econ. 2021;184:106978. [Google Scholar]
- 29.Yang L., Xu M., Fan J., Liang X., Zhang X., Lv H., Wang D. Financing coal-fired power plant to demonstrate CCS (carbon capture and storage) through an innovative policy incentive in China. Energy Pol. 2021;158:112562. [Google Scholar]
- 30.Riahi K., Rubin E.S., Taylor M.R., Schrattenholzer L., Hounshell D. Technological learning for carbon capture and sequestration technologies. Energy Econ. 2004;26:539–564. [Google Scholar]
- 31.Amigues J.-P., Lafforgue G., Moreaux M. Optimal timing of carbon capture policies under learning-by-doing. J. Environ. Econ. Manag. 2016;78:20–37. [Google Scholar]
- 32.van den Broek M., Hoefnagels R., Rubin E., Turkenburg W., Faaij A. Effects of technological learning on future cost and performance of power plants with CO2 capture. Prog. Energy Combust. Sci. 2009;35:457–480. [Google Scholar]
- 33.Rubin E.S., Yeh S., Antes M., Berkenpas M., Davison J. Use of experience curves to estimate the future cost of power plants with CO2 capture. Int. J. Greenh. Gas Control. 2007;1:188–197. [Google Scholar]
- 34.Li S., Zhang X., Gao L., Jin H. Learning rates and future cost curves for fossil fuel energy systems with CO2 capture: methodology and case studies. Appl. Energy. 2012;93:348–356. [Google Scholar]
- 35.Duan H.-B., Fan Y., Zhu L. What’s the most cost-effective policy of CO2 targeted reduction: an application of aggregated economic technological model with CCS? Appl. Energy. 2013;112:866–875. [Google Scholar]
- 36.Lohwasser R., Madlener R. Relating R&D and investment policies to CCS market diffusion through two-factor learning. Energy Pol. 2013;52:439–452. [Google Scholar]
- 37.Fan J.-L., Xu M., Li F., Yang L., Zhang X. Carbon capture and storage (CCS) retrofit potential of coal-fired power plants in China: the technology lock-in and cost optimization perspective. Appl. Energy. 2018;229:326–334. [Google Scholar]
- 38.Hu B., Zhai H. The cost of carbon capture and storage for coal-fired power plants in China. Int. J. Greenh. Gas Control. 2017;65:23–31. [Google Scholar]
- 39.Cai B., Li Q., Zhang X. Institute of Environmental Planning, Ministry of Ecology and Environment, Institute of Rock and Soil Mechanics, Chinese Academy of Sciences, the Administrative Center for China’s Agenda 21, Ministry of Science and Technology; 2021. Annual Report on Carbon Dioxide Capture, Utilization and Storage (CCUS) in China (2021) -- Study on the CCUS Pathway in China. [Google Scholar]
- 40.Wei N., Li X., Fang Z., Bai B., Li Q., Liu S., Jia Y. Regional resource distribution of onshore carbon geological utilization in China. J. CO2 Util. 2015;11:20–30. [Google Scholar]
- 41.Liu S., Li H., Zhang K., Lau H.C. Techno-economic analysis of using carbon capture and storage (CCS) in decarbonizing China's coal-fired power plants. J. Clean. Prod. 2022;351:131384. [Google Scholar]
- 42.Wang P.T., Wei Y.M., Yang B., Li J.Q., Kang J.N., Liu L.C., Yu B.Y., Hou Y.B., Zhang X. Carbon capture and storage in China’s power sector: optimal planning under the 2 °C constraint. Appl. Energy. 2020;263:114694. [Google Scholar]
- 43.Wei Y.M., Kang J.N., Liu L.C., Li Q., Wang P.T., Hou J.J., Liang Q.M., Liao H., Huang S.F., Yu B. A proposed global layout of carbon capture and storage in line with a 2 °C climate target. Nat. Clim. Chang. 2021;11:112–118. [Google Scholar]
- 44.Fan J.L., Xu M., Yang L., Zhang X., Li F. How can carbon capture utilization and storage be incentivized in China? A perspective based on the 45Q tax credit provisions. Energy Pol. 2019;132:1229–1240. [Google Scholar]
- 45.Li M., Gao H., Abdulla A., Shan R., Gao S. Combined effects of carbon pricing and power market reform on CO2 emissions reduction in China's electricity sector. Energy. 2022;257:124739. [Google Scholar]
- 46.Wang X., Du L. Study on carbon capture and storage (CCS) investment decision-making based on real options for China's coal-fired power plants. J. Clean. Prod. 2016;112:4123–4131. [Google Scholar]
- 47.IEA . International Energy Agency; 2020. CCUS in Clean Energy Transitions. [Google Scholar]
- 48.Wei Y. Science press; 2020. Climate Engineering Management: Carbon Capture and Storage Technology Management. [Google Scholar]
- 49.HUang J., Chen Q., ZHong P. Science press; 2021. National Assessment Report on Carbon Capture Utilization and Storage Technology in China. [Google Scholar]
- 50.Anzanello M.J., Fogliatto F.S. Learning curve models and applications: literature review and research directions. Int. J. Ind. Ergon. 2011;41:573–583. [Google Scholar]
- 51.Zhou W., Zhu B., Fuss S., Szolgayová J., Obersteiner M., Fei W. Uncertainty modeling of CCS investment strategy in China’s power sector. Appl. Energy. 2010;87:2392–2400. [Google Scholar]
- 52.Abadie L.M., Chamorro J.M. European CO2 prices and carbon capture investments. Energy Econ. 2008;30:2992–3015. [Google Scholar]
- 53.Insley M.C. On the option to invest in pollution control under a regime of tradable emissions allowances. Can. J. Econ. 2003;36:860–883. [Google Scholar]
- 54.Laurikka H., Koljonen T. Emissions trading and investment decisions in the power sector—a case study in Finland. Energy Pol. 2006;34:1063–1074. [Google Scholar]
- 55.Dixit A.K., Pindyck R.S. Princeton University Press; 1994. Investment under Uncertainty. [Google Scholar]
- 56.Boomsma T.K., Meade N., Fleten S.-E. Renewable energy investments under different support schemes: a real options approach. Eur. J. Oper. Res. 2012;220:225–237. [Google Scholar]
- 57.CSLF . Carbon Sequestration Leadership Forum; 2013. Carbon Sequestration Technology Roadmap 2013. [Google Scholar]
- 58.Department of Energy and Climate Change (United Kingdom) 2013. CCS Cost Reduction Taskforce. The Potential for Reducing the Costs of CCS in the UK. Final Report. [Google Scholar]
- 59.CSLF . Carbon Sequestration Leadership Forum; 2017. Carbon Sequestration Technology Roadmap 2017. [Google Scholar]
- 60.ADB . Asian Development Bank; 2015. Roadmap for Carbon Capture and Storage Demonstration and Deployment in the People’s Republic of China. [Google Scholar]
Associated Data
This section collects any data citations, data availability statements, or supplementary materials included in this article.
Supplementary Materials
Data Availability Statement
Data: The datasets generated in this study are available from the lead contact on reasonable request.
Code: This paper does not report original code.