

Abstract

During the conversion of natural gas to liquified natural gas, sulfur components are separated by adsorption on zeolites. New zeolite materials may improve this adsorption process. In this paper, the adsorption of hydrogen sulfide is studied on seven faujasite (FAU) zeolites, which differ only in the number of sodium and calcium cations. From a pure NaX zeolite (13X), which contains only sodium cations, the calcium cation content was gradually increased by ion exchange. In a fixed-bed adsorber, cumulative equilibrium loadings of H2S on these zeolites were determined at concentrations between 50 and 2000 ppm at 25 and 85 °C and 1.3 bar (abs). Adsorption isotherms were analyzed considering the influence of cation positioning in the FAU zeolites. The experimental data indicate a superposition of a chemisorptive and a physisorptive mechanism. At a small number of chemisorptive sites, we conclude a dissociation of hydrogen sulfide and covalent bonding of the proton and the hydrogen sulfide ion to the zeolite lattice. The contribution of chemisorption exhibits a very low temperature dependence, which is typical for nearly irreversible reactions with an equilibrium strongly shifted to one side. With an increase in the proportion of Ca2+ cations, only physisorptive adsorption by electrostatic interaction with the cations in the lattice was observed. A large number of physisorptive sites have a lower energetic value. The share of physisorption strongly depends on temperature, which is characteristic of reversible equilibrium reactions.
1. Introduction
Natural gas covered 24.7% of primary energy consumption worldwide in 2020.1 Forecasts predict an increase in demand over the next few years.2 The main components of natural gas are methane and other short-chain hydrocarbons. Depending on the production region, it may also contain higher hydrocarbons, carbon dioxide, and sulfur-containing components. Natural gas can be transported from the production sites to the consumer by pipelines or in a cryogenic liquefied state [liquefied natural gas (LNG)]. Global demand for LNG is forecast to double by 2035.3 Transport as LNG is subject to strict purity requirements with respect to toxic and corrosive components, so purification of the raw gas is necessary.4 Sulfur components such as hydrogen sulfide (H2S), mercaptans (CxHx+2SH), and carbonyl sulfide (COS) are present in trace concentrations in the raw gas. The process of adsorption is particularly suitable for separating substances in trace concentrations. In natural gas cleaning, cyclic-temperature swing adsorption (TSA) processes are used with polar adsorbents such as zeolites, silica gels, or silica alumina gels.5,6 Separation of sulfur components in particular is preferably carried out with zeolites with a faujasite (FAU) or a Linde type A (LTA) structure.7 As zeolites are aluminosilicates and consist of an anionic framework with exchangeable cations, the type and number of cations strongly influence adsorption properties.8−10 LTA zeolites are primarily used to dry the natural gas, but they also come into contact with H2S molecules and can separate them from the gas.7,11,12 We have already investigated the adsorption properties of LTA zeolites in the adsorption of H2S depending on the Na+ and Ca2+ cations they contain in a previous study.13 The present work deals with the adsorption properties of FAU zeolites and can be considered as a continuation of the first study. The field of application of FAU zeolites in natural gas processing is in the separation of higher hydrocarbons and mercaptans.5,14 In this process, the FAU zeolites also come into contact with residual concentrations of H2S, which are also to be separated.
1.1. Literature Overview
Due to its importance for industrial applications, the adsorption of H2S on zeolites has been studied several times. Cruz et al. examined H2S adsorption in various zeolites, including FAU zeolites (NaX and NaY) and LTA zeolites (NaA). The FAU zeolites showed a higher capacity than the LTA zeolites. However, for a more detailed description of the mechanistic processes during adsorption, further investigation is recommended.15 Tomadakis et al. investigated the adsorption of H2S and CO2 during pressure swing adsorption on NaA, CaNaA, and NaX zeolites. The three zeolites adsorbed H2S more strongly than CO2, and the highest H2S capacities were found on fresh CaNaA and NaX zeolites.16 Especially, for FAU zeolites, the influences of occupying different cation positions in the zeolite structure with different cation species are difficult to determine because there is no consensus in the literature on the distribution of cations among the sites.
Mauer et al. examined the influence of the type and number of cations on the adsorption of methane on FAU zeolites. The measured adsorption isotherms and enthalpies indicate a significant influence of the occupied cation positions and cation type on the strength of interactions.17 Frising and Leflaive studied the occupation of cation positions in detail and prepared a comprehensive review paper on the cation distribution in X- and Y-FAU zeolites. The authors compiled studies on FAU zeolites including the cations Na+, Li+, K+, Rb+, Cs+, Mg2+, Ca2+, Sr2+, and Ba2+ as well as other cations. Differences in the occupation of cation positions were found, depending on the type of cation and the degree of exchange. Mostly cation positions I and II are preferred, and positions III and III′, on the other hand, are occupied less frequently and are judged to be unstable.18 In addition, a shift of the cations during the adsorption process could be shown for the adsorption of certain adsorptives based on molecular dynamics simulations. For example, Plant et al. considered the adsorption of CO2 on NaX and NaY zeolites. Especially at low loadings, the cations located at position III′ moved to a position close to III′.19 The same could be observed during the adsorption of methanol and butane.20,21 During the adsorption of water, on the other hand, a migration of the cations can only be shown for the FAU zeolite with a low cation content (NaY); this does not occur for FAU zeolites with a large cation content (NaX).22
The adsorption of H2S on NaX and NaY zeolites was studied by Karge et al. in 1987 by UV/vis and IR spectroscopy. A larger capacity was observed on NaX than on the NaY zeolite. Therefore, it is assumed that different adsorption mechanisms take place. From the experiments, dissociative adsorption of H2S on the NaX zeolite is concluded at low coverage levels at so-called “strong centers”. With an increase in the degree of coverage, physisorption of undissociated H2S molecules dominates.23 Sigot et al. studied the desorption of H2S on NaX zeolites and came to similar conclusions. Since complete regeneration of the zeolites was not achieved at temperatures of 350 °C, a chemisorptive mechanism is suspected. In this, a dissociation of H2S in pore water of the zeolite is supposed to occur in the first step followed by an oxidation reaction.24
Fellmuth et al. investigated the catalytic activity in the reaction during the adsorption of H2S and CO2 on LTA and FAU zeolites. A decrease in catalytic activity with an increase in the proportion of divalent cations was observed for both FAU and LTA zeolites. Furthermore, the catalytic activity of the zeolites is correlated with the number of weakly bound cations.25 Investigating the adsorption of H2S on a fully exchanged CaX zeolite by X-ray diffraction, Jang et al. were able to locate 16 Ca2+ cations at position I and 30 Ca2+ cations at position II. The authors propose that three H2S molecules were attached to each of the cations at position II, and the other 59 H2S molecules formed hydrogen bonds to 2 oxygen atoms of each of the 12-membered rings per supercage. Dissociative adsorption of H2S was not observed.26
Many studies deal with highly exchanged calcium FAU zeolites. Data from zeolites with lower calcium content are lacking. These are important, however, to better describe the influence of cation type and positioning as well as to allow a discussion of different adsorption mechanisms. In previous work, we investigated the influence of sodium and calcium cations on the adsorption of H2S on binder-free LTA zeolites. Evidence for dissociative adsorption of H2S on weakly bound Na+ cations was found at site III. With an increase of Ca2+ cations, only physisorptive adsorption was observed.13 Based on this publication, we commissioned PXRD measurements of the LTA zeolites, which confirmed the assumptions made in ref (13) about the cation positions.27
Following this publication, we started to study the FAU zeolites since LTA and FAU are the technically relevant zeolites for natural gas processing. We investigated the influence of cations in FAU zeolites on the adsorption of H2S in cooperation with BASF Catalysts Germany GmbH and Chemiewerk Bad Köstritz GmbH. From the binder-free base material NaX, which contains only sodium cations, the calcium content was gradually increased by ion exchange. Cumulative breakthrough curves were measured at 25 and at 85 °C in a fixed-bed adsorber, and adsorption isotherms were determined. Subsequently, the data were discussed with respect to temperature dependence, and mechanistic suggestions were developed.
2. Experiments
2.1. Methods and Experimental Setup
Cumulative breakthrough curve measurements are performed in a fixed-bed adsorber (Figure 1). The feed gas mixture is generated by thermal mass-flow controllers (MFCs). The adsorber has a diameter of 3.8 cm and a height of 17.5 cm. With a height/diameter ratio of 4:1 and a ratio of 19 between the particle diameter of the adsorbent (2 mm) and the adsorber diameter (3.8 cm), the dimensions of the adsorber comply with the general technical design rules. The adsorber wall is designed as a double jacket and thus enables the temperature control of the adsorber interior with a temperature-controlled fluid. In addition, electrically heatable pipes are installed to adjust temperatures between 25 and 300 °C. The process is monitored by five type-T thermocouples along the adsorber and two thermocouples at the inlet and outlet of the adsorber. All thermocouples have a measuring accuracy of ±0.5 K. The operating pressure of 1.3 bar (abs.) is set by an electronic pressure control. Pressure monitoring is ensured by two pressure gauges from BD Sensors. The gas mixture is analyzed by a μ-GC (micro-gas chromatograph Varian CP-4900).
Figure 1.

Process scheme of the experimental plant.
For conditioning, the adsorbent is heated in a nitrogen-purged oven at 350 °C for 4 h before the experiments. The hot adsorbent is then filled into the adsorber. Dry nitrogen is flown through the adsorbent until the experimental temperature is reached. For mixing the raw gas, the sample gas is added to the matrix gas stream by an MFC. To adjust the concentration on the wanted level, the entire gas flow is passed first through the bypass directly to the μ-GC. As soon as the concentration of the adsorptive is constant for 30 min, the experiment is started by switching the feed gas flow to the fixed-bed adsorber.
If the adsorptive concentration at the outlet of the adsorber corresponds to the adsorptive concentration at the inlet of the adsorber and the outlet concentration is within the statistical deviation of the μ-GC for a period of 45 min, the system has reached equilibrium. By increasing the volumetric flow rate of H2S, the concentration of the adsorbent can then be increased and the next equilibrium step approached. Isotherms with 11 equilibrium points each were measured using this cumulative measurement method.
To determine the equilibrium
loading  , a mass balance around the adsorber is
done by integrating the area above the breakthrough curve (eq 1).
, a mass balance around the adsorber is
done by integrating the area above the breakthrough curve (eq 1).  describes the total flow, consisting of
the nitrogen flow and the adsorptive flow,
describes the total flow, consisting of
the nitrogen flow and the adsorptive flow,  is the mass of the adsorbent,
  is the inlet concentration of the adsorptive,
and
is the inlet concentration of the adsorptive,
and  is the measured outlet concentration.
The integration of the area above the measured breakthrough curves
can be expressed as the sum of the concentration differences over
a time interval. Due to the cumulative measurement method, the determined
loading of the previous equilibrium point  is added.
| 1 |
To fit the experimental data, a dual-site
Langmuir isotherm is
used (eq 2). In the dual-site
Langmuir isotherm, two Langmuir terms are added. This allows the consideration
of two energetically very different adsorption sites. The parameters  and
and  give the monomolecular loading and the
affinity parameter of the respective adsorption site
give the monomolecular loading and the
affinity parameter of the respective adsorption site  .28
.28
| 2 |
Fitting was performed by nonlinear regression using the Levenberg–Marquardt algorithm to minimize the squared errors.
2.2. Error Analysis
For the systematic error, instrumental errors must be considered. This includes the error of adsorbent mass determination (Acculab 3100.2 balance), measurement of gas concentration (Varian Micro GC CP4900 gas chromatograph), and setting of gas flows (Bronkhorst EL-FLOW mass-flow controller). This results in a systematic error of 3.5%. Gaussian error propagation is used to calculate the statistical error. Variables subject to error in the calculation of the equilibrium loading are mass flow rate, adsorbent mass, time, and inlet, as well as outlet concentration of the adsorptive. The statistical error of time is neglected due to the precise time measurement. Moreover, the inlet concentration is obtained from the arithmetic mean of the outlet concentration with a large number of measured values, so the error on this value is also negligible. Thus, the total error varies between approx. 3.7 and 10%.
3. Materials
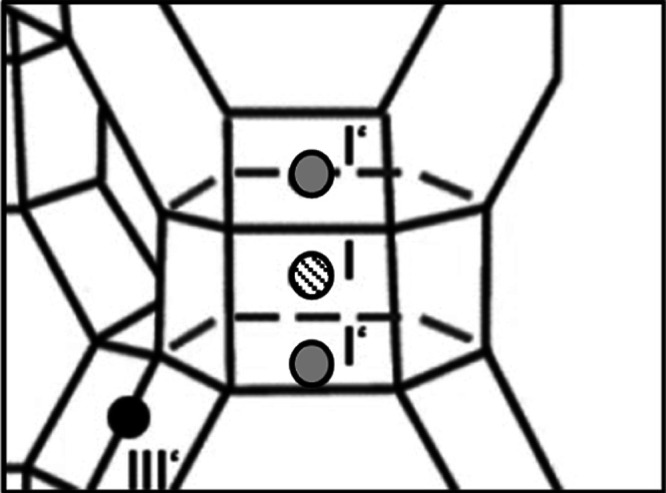
In this paper, we studied seven FAU zeolites, which differ in the number of sodium and calcium cations. Zeolites consist of SiO4 and AlO4 tetrahedra, which are linked via oxygen atoms. The Si/Al ratio can range from 1 to 3 for FAU zeolites. In the range of 1–1.5, FAU zeolites are called type X zeolites, with Si/Al ratios of 1.5 to 3 type Y zeolites.8 In this work, zeolites with a Si/Al ratio of 1.17 belonging to type X were investigated. The tetrahedra assemble into secondary building units (SBUs). These form the polyhedral tertiary structure of the zeolites. Figure 2 shows one of these tertiary structures, the sodalite cage, consisting of 24 tetrahedra. In the FAU structure, the sodalite cages are linked by double six-membered rings. Eight sodalite cages form a supercage (Figure 2) with a free diameter of 1.37 nm. It can be accessed via four apertures consisting of 12-membered rings with an effective diameter of 0.74–0.8 nm, depending on the number and type of cations. The symmetry of the FAU zeolite is described in the literature by the space group Fd 3m.9
Figure 2.

Schematic view of (a) a sodalite cage and (b) a super cage with the distribution of cation positions in the FAU zeolite (according to refs (9) and (20). Position I: This position is centered inside the double six-membered ring that connects the sodalite cages. Per super cage, this position is present 16 times. Position I’: Position I′ is located on the double six-membered ring surfaces of the sodalite cages. In total, this position is present 32 times per supercage. Position II: Cation site II is located on the six-membered ring surfaces of the sodalite cages, which are oriented toward the supercage. These are present 32 times per supercage and are accessible to adsorptive molecules. Position II’: This cation position corresponds to position II and is also present 32 times per supercage, but cation position II′ has shifted into the sodalite cage. Thus, this position is not accessible from the supercage and therefore is inaccessible to many adsorptive molecules. Moreover, positions II and II′ cannot be occupied simultaneously. Position III: This position is located inside the supercage near the four-membered rings. From this, a total of 48 sites are available per supercage. Adsorptive molecules can easily reach cations at this position. Position III’: While position III is centrally located on the surface of the four-membered ring, position III′ is located offset from the four-membered ring. Similarly, this position is described as lying in the 12-member ring, which forms the entrance to the supercage. Cation position III′ occurs up to 96 times per supercage.
Since a negative charge is introduced into the zeolite lattice by the aluminum atoms, cations must be present to balance the charge. These cations are located in different positions in the cage structure. In the scientific literature, there is no consensus on the number and distribution as well as the occupation of cation positions, but various approaches and models have been published. The most common is the assumption that there are six cation positions (Figure 2).8,29
The cation positions II, III, and III′ are important for adsorption processes since they are accessible to adsorptive molecules via the supercage. In contrast, cation positions I, I′, and II′ are only accessible via the six-membered rings of the sodalite cages. The free diameter of these rings is 0.28 nm, so only adsorptive molecules with a smaller critical diameter can enter the sodalite cages and reach the cation positions I, I′, and II′. The number of charges required to balance the total charge is determined by the number of aluminum atoms and thus by the Si/Al ratio. All the zeolites studied here have a Si/Al ratio of 1.17. According to the structural formula of the FAU zeolites (eq 3), a unit cell with this Si/Al ratio consists of 88 aluminum atoms and 104 silicon atoms. Accordingly, 88 charges must be introduced via the cations for charge balance. M represents the cation type, and y is the valence of the cations.
| 3 |
To reduce the Gibbs energy, cations initially occupy positions with strong interactions. These positions are as close as possible to the zeolite lattice. There are different views in the literature on the occupation and order of energetic value of the positions.
In this paper, we follow the proposal of Frising and Leflaive as it is very comprehensive and includes many sources.18
Decisive factors influencing the distribution of cations at the corresponding positions are the activation process, the cation type, and impurities in the zeolite. In addition, it must be taken into account that even with identical zeolites, a slightly different cation distribution cannot be ruled out as a result of small differences in the manufacturing process. There is agreement on the assumption that cation positions I, I′, and II provide sites of higher energetic quality than positions III and III′. According to Takaishi et al., the order of energetic valence is I, I′, II, and III′, with position I having the highest value.30 On the contrary, Abrioux et al. consider position II to be the most stable position in the FAU zeolite lattice since they estimate that the electrostatic repulsive forces are lowest there.31 This is in agreement with some results of Frising and Leflaive, who also identify position II as the favored position for certain cation species.18 In addition, the adjacent cation positions I and I′ cannot be occupied simultaneously.30,32,33 Thus, a maximum of 32 cations can be placed at these two positions. This can be explained by repulsive forces among the cations resulting from the geometry (Figure 3).9,31,32,34,35
Figure 3.
Position of the cation sites I and I′ in the double six-membered ring.
Occupation of the positions is only possible by one cation on position I or by two cations on the two positions I’. Depending on the exchange rate, the total number of cations changes if monovalent Na+ is exchanged by divalent Ca2+. The relationships with the energetic valence of cation sites and their occupancy then lead to the following distribution scheme for a supercage unit:
<32 cations per unit: depending on the type of cations, position I or II is preferred; for example, Ca2+ cations prefer position I18
<64 cations per unit: depending on the type of cations, position I or II is preferred, if position I cannot be occupied due to too many cations, the cations settle on positions I′ and II
>64 cations per unit: positions I′ and II are completely occupied; all other cations are placed in positions III and III′.18
The base material NaX was synthesized by Chemiewerk Bad Köstritz GmbH from sodium silicate, sodium aluminate, and sodium hydroxide in the liquid phase by a well-known industrial synthesis route.36 The primary crystals have a size of 2.0–5.0 μm. During ion exchange in the liquid phase, sodium ions were exchanged for calcium ions. For this purpose, the granulated sodium form (NaX) was continuously flown through by a solution consisting of water and calcium chloride with a molarity between 0.1 and 0.5 mol·l–1 in an ion exchange column at 298.15 K. This was followed by activation of the zeolites at temperatures ranging from 573.15–673.15 K. The exchange rate indicates the amount of sodium cations removed from the base material NaX and exchanged by calcium cations. The materials in this work have exchange rates of 0, 19, 36, 50, 56, 71, and 90%. All zeolites examined are binder-free.
Figure 4 lists the data on cations in the zeolite with increasing degree of cation exchange. Following the considerations described above, we assume a complete occupation of the cation positions I′ and II with 32 cations each for the sodium form NaX (exchange rate 0%; 88 Na+ cations). The remaining 24 cations occupy places at positions III and III’. Since only cations at positions II, III, and III′ are accessible to H2S molecules, this results in a 56 accessible cations. In the cation exchange process, two monovalent sodium cations are exchanged for one divalent calcium cation. With increasing exchange rate, the total number of cations decreases. Thus, with an exchange rate of 19%, the total number of cations is 80, divided into 72 Na+ and 8 Ca2+ cations. It is assumed that the cations weakly bound at positions III and III′ are the first to be removed during ion exchange. Since the total number of cations is still greater than 64, the two cation positions I′ and II continue to be fully occupied. The remaining 16 cations occupy positions III and III’. The number of accessible cations becomes 48. The introduced calcium cations presumably accumulate at the higher value positions I′ and II and not at positions III or III’. Hence, when the degree of exchange is gradually increased to 50%, the cations on positions III and III′ are gradually removed. From an exchange rate of 56%, no more cations are present in this position. Below a total number of 64 cations (degree of exchange of 54.5%), a statement on the occupancy of cation positions I, I′ and II becomes difficult. Since it cannot be clearly determined which and how many cations are in positions I and I′ in each case, which has a direct effect on the number and type of cations relevant for adsorption in position II, no figure is given here for the occupation of the respective positions. Accordingly, the interpretation of the experimental results is limited to those effects that can be clearly explained with knowledge of the cation distribution. For a more detailed discussion, it would be necessary to determine the exact occupation of the cation positions, for example, by XRPD measurement. However, this is not the subject of this work.
Figure 4.

Changes in the unit cell during the exchange of Na+ cations for Ca2+ cations (according to ref (18)).
Nitrogen isotherms were measured volumetrically at 77 K using a Bel-Sorb Mini measuring device (Bel Japan). Before measurement, the zeolites were conditioned under vacuum for 6 h. The specific BET surface area (DIN ISO 9277) and pore volume according to Gurvich (DIN 66134) are shown in Table 1. The pore size distributions of the FAU zeolites are shown in the Supporting Information (figure S1).
Table 1. BET Specific Surface Area and Pore Volume of the FAU Zeolites.
| adsorbent | BET surface (m2 g–1) | pore volume (cm3 g–1) |
|---|---|---|
| Na88X | 847 | 0.32 |
| Ca8Na72X(19%) | 831 | 0.32 |
| Ca16Na56X(36%) | 831 | 0.32 |
| Ca22Na44X(50%) | 830 | 0.32 |
| Ca29Na30X(56%) | 833 | 0.32 |
| Ca36Na16X(71%) | 842 | 0.33 |
| Ca38Na12X(90%) | 837 | 0.33 |
The values for BET surface area and pore volume are each of the same order of magnitude and within the error range of 2%. Moreover, no trend can be observed (average BET surface area 835.8 m2 g–1 and average pore volume 0.3215 cm3 g–1). Therefore, it is assumed that the BET surface area and pore volume of the zeolites studied are independent of the degree of cation exchange.
Nitrogen from the university’s own infrastructure with a purity of 99.999% and a dew point lower than −80 °C is used as the carrier gas. Hydrogen sulfide (H2S) with a purity of >99.5% from Air Liquide was used as an adsorptive. H2S molecules have a critical diameter of 0.36 nm and a molar mass of 34.08 g·mol–1. Additionally, H2S is considered polar with a dipole moment of 0.98 D. Thus, the adsorption on the zeolites is expected to be mainly caused by attractive electrostatic cation–dipole interactions with the cations and anion–dipole interactions with oxygen atoms of the zeolite lattice, which carry delocalized negative charges.37 This paper focuses on the influence of the cation–dipole interactions, which can be better analyzed due to the localized character of the cations in the zeolite structure.
4. Results and Discussion
The H2S isotherms were measured at a temperature of 25 and 85 °C in the concentration range of 50 to 2000 ppm. In the following, the isotherms are shown in the diagram as loading in mol·kg–1 versus concentration in ppm. The experimentally determined equilibrium loadings are shown as symbols, and the lines indicate calculated isotherm equations. The corresponding isotherm parameters are given in Tables S1 and S2, and the measured data points are given in Tables S3 and S4 in the Supporting Information For the sake of clarity, the isotherms at 85 °C are not shown with error bars.
4.1. Adsorption of H2S on FAU Zeolites at 25 °C
Figure 5 shows the measured adsorption isotherms at 25 °C. For clarity, the isotherm field is split. Figure 6a shows the isotherms on the FAU zeolites with exchange rates of 0–50%. These four isotherms have a very steep increase in the low concentration range and a marked decrease in the isotherm slope from about 50 ppm. The three zeolites NaX, CaNaX(19%), and CaNaX(36%) show a comparable loading of approximately 0.75 mol·kg–1 at 50 ppm. Consequently, these materials have a similar slope in the initial range. The material CaNaX(50%) reaches a loading of only 0.56 mol·kg–1 at 50 ppm. From concentrations of approximately 200 ppm, the loadings of the CaNaX(19%) and the CaNaX(36%) zeolite are above the loading of the NaX zeolite. The CaNaX(50%) zeolite has a lower loading than the other three materials at the beginning of the concentration range. From about 530 ppm, however, this isotherm intersects the NaX isotherm.
Figure 5.

H2S isotherms on calcium-exchanged FAU X zeolites at 25 °C.
Figure 6.

H2S isotherms on FAU X zeolites at 25 °C: (a) exchange rates 0–50% and (b) exchange rates 56–90%.
With an increase in the degree of exchange from 0 to 19%, the introduction of calcium cations provides a clear increase in capacity. At 2000 ppm, CaNaX(19%) shows a H2S loading of 2.68 mol·kg–1, whereas the loading of NaX at 2000 ppm is 2.28 mol·kg–1. The loading in molecules per unit cell, which can be calculated using eq 1 and the molar masses of the respective atomic species, corresponds to 30–36 H2S molecules per unit cell. With a further increase in the degree of exchange to 36 and 50%, a decrease in the loading can be observed.
Figure 6b represents the H2S isotherms on the FAU zeolites with the exchange rates of 56, 71, and 90%. The zeolite CaNaX(56%) exhibits the lowest loading throughout the concentration range. Furthermore, the slope in the low concentration range and the subsequent decrease in slope are not as pronounced in this material as in the other materials investigated. Instead, this material shows a uniform decrease in slope with no characteristic regions. The materials CaNaX(71%) and CaNaX(90%) show loadings of the same order of magnitude with approx. 0.7 and 0.8 mol·kg–1 at 50 ppm, with correspondingly strong slopes in the low concentration range. When the concentration is increased, a flattening of the slope can be observed again. Over the further concentration range, both isotherms run very similarly. At each exchange rate, both calcium and sodium cations are present at accessible cation positions (with the exception of 0 and 100%) (Figure 4). Calcium cations provide adsorption sites of higher energetic value due to their divalent charge. Therefore, calcium cations form stronger ion–dipole interactions with H2S molecules than monovalent sodium cations. The number of H2S molecules per unit cell ranges from 26 to 36 at a concentration of 2000 ppm (Table S5 in the Supporting Information). Thus, assuming the distribution according to Figure 4, the number of molecules per unit cell is below the number of accessible cations per supercage. As a result, each H2S molecule can interact with its own cation. Consequently, the more calcium the cations contained, the more the H2S molecules that can interact with them, resulting in a steep isotherm at low concentrations. If a large part of the calcium sites is occupied at higher concentrations, H2S molecules increasingly adsorb at sodium cations. This implies that energetically less valuable sites are occupied and the isotherm flattens out. When changing from a 50% exchange rate to a 56% exchange rate, a strong reduction in capacity can be observed. At this point, the smallest exchange rate difference among these two zeolites is noticeable, but the largest loading difference occurs. Therefore, the increase in the degree of exchange from 50 to 56% appears to represent a point of change in the zeolite material that is relevant to adsorption. Clearly, there would be an elimination of relevant adsorption sites or limited access to important cations. From this point in the exchange series, the cation positions III are no longer occupied. A correlation between the unoccupied cation position III and the decrease in capacity is assumed. When the degree of exchange is further increased to 71 and 90%, an increase in capacity can be observed compared to CaNaX(56%).
When comparing the H2S isotherms at 25 °C on the seven FAU zeolites investigated, no clear trend can be identified. This suggests overlapping of capacity-increasing and capacity-decreasing effects. Since the materials differ only in their proportion of calcium and sodium cations, the type and number of cations seem to be decisive for adsorption properties.
Four effects may be superimposed in an exchange series:
-
1
Stronger binding cations by ion exchange: In an exchange series, the substitution of monovalent Na+ ions with divalent Ca2+ ions will lead to stronger interactions and thus to an increase in capacity.
-
2
Change of cation number: At the same time, however, the number of cations is reduced, so fewer binding sites are available. This leads to a decrease in capacity.
-
3
Limited accessibility of cation sites: In the FAU zeolite, not all cations are accessible to the adsorptive molecules. Since it cannot be clearly clarified which and how many cations are accessible for adsorptive molecules at different exchange rates, an influence on adsorption properties cannot be quantified in more detail at this point.
-
4
Change of cation positions: A reduction in the total number of cations as part of a cation exchange of monovalent sodium cations for divalent calcium cations leads to a change in the occupation of the cation positions (Section 1.2). In addition, cation migration may possibly occur due to the adsorption of the H2S molecules, as has already been shown, for example, for the adsorption of CO2, methanol, and alkanes.19−21 If there are cation sites with strongly differing energetic values, such as chemisorption and physisorption sites, these could be varied in number by cation exchange.
The cation distribution in FAU zeolites is much more complex than, for example, in LTA zeolites because of the different tertiary structures. Due to the structure complexity, commissioned XRPD measurements to determine the cation positions in FAU zeolites could not be meaningfully evaluated. For this reason, we refrained from a detailed interpretation of the results based on hypothetical cation positions and limited ourselves to a mechanistic discussion. In the following, we would like to discuss the influence of the cations in the exchange series on the chemisorption and physisorption of H2S. Chemisorption in the form of dissociative adsorption of H2S on weakly bound cations in the FAU-X zeolite was suspected in previous work.25,38 To find conclusive evidence for dissociative adsorption of H2S, we measured isotherms at 85 °C to compare them with the data at 25 °C.
4.2. Adsorption of H2S on FAU Zeolites at 85 °C
Figure 7 shows the measured adsorption isotherms at 85 °C. For better clarity, the isotherm field in Figure 8 has been divided into two diagrams. Figure 8a shows the isotherms of the zeolites NaX, CaNaX(19%), CaNaX(36%), and CaNaX(50%). Figure 8b presents the isotherms of the zeolites CaNaX(56%), CaNaX(71%), and CaNaX(90%).
Figure 7.

H2S isotherms on calcium-exchanged FAU zeolites at 85 °C.
Figure 8.

H2S isotherms on FAU zeolites at 85 °C: (a) exchange rates of 0–50% and (b) exchange rates of 56–90%.
The H2S isotherms at 85 °C can be divided into two groups according to their different shapes. The first group includes materials with exchange rates between 0 and 50%. These isotherms show a very steep loading increase in the low concentration range. Already at an adsorptive concentration of 50 ppm, loading values between 0.27 mol·kg–1 (CaNaX(50%)) and 0.52 mol·kg–1 (NaX) are reached. The NaX material has the highest capacity. The loadings of the materials CaNaX(19%), CaNaX(36%), and CaNaX(50%) follow a descending order. At concentrations above 50 ppm, a sharp decrease in the isothermal slope occurs. For the base material NaX, a final loading of 0.69 mol·kg–1 was measured at 2000 ppm. Accordingly, at concentrations of 50 ppm, about 75% of the final capacity was already reached. With the first increase in the exchange rate to 19% (CaNaX(19%)), the loading at 2000 ppm is reduced to 0.59 mol·kg–1. Also with this zeolite, at concentrations of 50 ppm, already approximately 71% of the final capacity could be reached (0.42 mol·kg–1). The isotherm of the material CaNaX(36%) is initially below the isotherm of the material CaNaX(19%). At about 1300 ppm, the isotherms cross and from then on the loading of the CaNaX(36%) is just above the loading of the CaNaX(19%). At this exchange rate, about 59% of the final loading is reached at 50 ppm. For the zeolite with an exchange rate of 50%, this trend continues, and the loading in low concentration ranges is below the loadings of the other three zeolites. At 1600 ppm, the isotherm crosses the isotherm of CaNaX(36%). At the end of the studied concentration range at 2000 ppm, the loading of the material CaNaX(50%) is at the same level as the loading of the material CaNaX(19%). The zeolite CaNaX(50%) reaches about 43% of the final loading at 50 ppm.
For the second group of zeolites with the exchange rates of 56, 71, and 90%, the initial increase up to the first measuring point at 50 ppm is less steep. Here, initial loadings are between 0.07 mol·kg–1 (CaNaX(56%)) and 0.17 mol·kg–1 (CaNaX(90%)). Between CaNaX(50%) and CaNaX(56%), the smallest exchange rate difference is present. Nevertheless, the highest capacity loss takes place. This was also observed at 25 °C. The zeolite CaNaX(56%) exhibits the lowest capacity in the test series at 85 °C over the entire concentration range. Increasing the degree of exchange to 71 and 90% leads to an increase in capacity in each case. This reverses the previous trend of decreasing concentration when the degree of exchange increases. The decrease in the slope from 50 ppm and thus the flattening of the isotherms in the concentration range between 50 and 2000 ppm takes place to a lesser extent in this zeolite group than in the zeolites from the first group. The majority of adsorption in this zeolite group takes place only at concentrations between 50 and 2000 ppm. For example, for CaNaX 71%, the loading increases from 0.14 mol/kg (50 ppm) to 0.5 mol/kg (2000 ppm). In addition, the isotherms of this group show a concave course without characteristic regions.
For H2S isotherms at 25 °C, no clear trends can be identified. When comparing the capacities at 85 °C, at the end of the measuring range, one observes a decrease with an increase in the degree of exchange up to 56% and then an increase with a further increase in the degree of exchange. This trend reversal again indicates the superposition of capacity-increasing or -decreasing effects.
However, one result is striking: if we compare the data at 25 and 85 °C, we find that the arrangement of the isotherms within the exchange series at 25 and 85 °C does not match. This suggests a different temperature dependence of relevant mechanisms. Based on this evidence, we develop a mechanistic proposal.
4.3. Mechanistic Proposal for the Adsorption of H2S on FAU Zeolites
We will now discuss the existence of temperature-independent chemisorptive and temperature-dependent physisorptive sites, the number of which depends on the proportion of calcium cations. To investigate these effects in more detail, the change in H2S adsorption on some materials when the temperature is increased from 25 to 85 °C is analyzed. For further analysis of the results, the adsorption isotherms of selected FAU zeolites at 25 and 85 °C are shown in Figure 9. The base material NaX shows a moderate reduction in loading at low concentrations (50 ppm) due to the temperature increase by 31%. In the high concentration range (2000 ppm), the reduction increases to 68%. This indicates a lower temperature dependence in the low concentration range and a stronger temperature dependence in the higher concentration range. Similar results are found for the materials up to an exchange rate of 50%. For these materials, we suggest the existence of adsorption sites with energetically different values. In the low concentration range, there is a significant contribution of adsorption on sites of high energetic value, which is less temperature-dependent. Low temperature dependence is typical for nearly irreversible processes with the equilibrium strongly shifted to one side. In adsorption, this applies to chemisorptive sites. In addition, the NaX zeolite could not be completely desorbed after the adsorption of H2S at 25 °C (Table S6 in the Supporting Information).
Figure 9.

H2S isotherms at 25 and 85 °C on (a) NaX and (b) CaNaX 56%.
In contrast, materials with exchange rates from 56 to 90% exhibit a constant decrease in loading over the entire concentration range. For example, in case of CaNaX(56%), a 74% reduction in loading can be observed in the low concentration range and a reduction of 80% in the high concentration range is found. For these zeolites, we propose that only physisorptive adsorption with a stronger temperature dependence takes place. The energetically high-quality and less temperature-dependent chemisorptive sites observed in the FAU zeolites with exchange efficiencies up to 50% could be provided by sodium cations at cation positions III and III’. At exchange rates above 54.5%, the cation positions III and III’ remain completely unoccupied (Figure 4). From an exchange rate of 56%, the isotherms no longer show any evidence of energetically high-quality adsorption sites, so a correlation between energetically high-quality adsorption sites and the occupation of cation positions III and III′ can be assumed.
Figure 10 shows the isotherms of NaX and CaNaX(56%) at 25 and 85 °C normalized to their final concentration. As a result of the temperature increase, it can be seen that the shape of the isotherms on the NaX zeolite changes the most. At 85 °C, a kink in the isotherm becomes visible. This is not the case at 25 °C. A similar kink at 85 °C can be observed for the zeolites with exchange rates of 19, 36, and 50%. On the contrary, the isotherms of the zeolite CaNaX(56%) each exhibit a similar shape at both temperatures without a pronounced kink. A similar behavior was found for the materials with exchange rates of 71 and 90%.
Figure 10.

H2S isotherms normalized to the input concentration at 25 and 85 °C on (a) NaX and (b) CaNaX 56%.
The abrupt change in the isothermal gradient at the point of the kink suggests that there is a change in the dominant adsorption mechanism. In the region of a large slope, predominantly energetically high-quality chemisorptive sites will be occupied, while in the region of a small slope, adsorption occurs predominantly at energetically lower-quality physisorptive sites. At 85 °C, physisorption decreases sharply, while chemisorption is only slightly temperature-dependent. Therefore, the transition from the region of predominant chemisorption to the region of predominant physisorption is particularly clear at 85 °C, and a kink in the isotherm is formed. Because the kink disappears when the exchange rate is increased to more than 50%, the chemisorptive adsorption sites at cation positions III and III′ may have disappeared. Cations in this position are only weakly bound to the lattice and are first removed from the zeolite lattice during cation exchange. Thus, as the degree of exchange is increased to >50%, the cations at positions III and III’ have been removed. A similar behavior of the isotherm shape with increasing temperature could already be observed in a work with LTA zeolites with sodium cations and low calcium exchange rates.13 There, too, the existence of adsorption sites with different energetic valence was suspected, as well as the occurrence of dissociative adsorption of H2S. Since the cation positions LTA(III) and FAU(III) are geometrically very similar, we also assume dissociative adsorption of H2S as on the LTA zeolites (Figure 11).
Figure 11.

Mechanistic proposal of the interaction of an adsorbed H2S molecule on Na+ cations on position III.
In this process, a H2S molecule first physisorbs on a Na+-cation at position III or III′ in the supercage. The adsorption enthalpy released leads to the dissociation of the H2S molecule into SH– and H+, which are subsequently chemisorptively bound. The SH– anion attaches to the sodium cation, while the proton interacts with an oxygen atom in the lattice.38−40 The same mechanism is considered to be the first step of the catalytic activity in the formation of COS during the simultaneous adsorption of H2S and CO2 on LTA and FAU zeolites.25,25,40 At other cation positions, the adsorption enthalpy does not seem to be sufficient for the dissociation of H2S molecules. This is probably caused at cation position II by stronger shielding by the oxygen atoms, while positions I, I′, and II′ are not accessible for the H2S molecules (Figure 4). All Ca2+-cations are presumably located at cation positions I, I′, II, and II′, so dissociative adsorption to Ca2+-cations is not assumed. Since this mechanistic discussion of H2S chemisorption is theoretical, Figure 11 is only symbolic.
At the adsorption sites present in large numbers at cations on site II and at the negatively charged oxygen atoms, a temperature-dependent physisorption of the H2S molecules is to be expected. Electrostatic ion–dipole interactions act between ions at site II and H2S molecules. In case of the cations, due to their dual charge, stronger electrostatic interactions between the cation and the dipole of H2S are expected between calcium cations and H2S molecules than between monovalent sodium cations and H2S molecules. However, a clear correlation between the degree of exchange and loading, which should increase as a result of the stronger interactions, cannot be observed. Presumably, the calcium ions position themselves at cation position I, where the cation can interact with a particularly large number of oxygen atoms. However, cations at this position are not accessible for adsorptive molecules because of their position in the sodalite cage and in the double six-membered ring.
4.4. Comparison Between the Results of the NaA and NaX Zeolite
In a previous study, we have already investigated the influence of cations on the adsorption of H2S in LTA zeolites.13 The two zeolites are similar in that both are composed of the same SBUs. However, the tertiary building structure differs, resulting in a much more complicated cation distribution in the FAU zeolite. Due to the same SBUs, the same adsorption mechanisms can be suspected based on the experimental results in both zeolites. Based on the adsorption isotherms of H2S on the NaX zeolite and the NaA zeolite (isotherm data from13), the influence of the zeolite structure on adsorption can be discussed. Both zeolites have only sodium cations. Figure 12 shows the isotherms of both zeolites at 25 °C (a) and 85 °C (b).
Figure 12.

Isotherms of H2S on zeolites NaX and NaA at (a) 25 °C and (b) 85 °C.
At both 25 and 85 °C, the NaX zeolite exhibits a greater capacity for H2S. This is an unexpected finding. The zeolites have different Si/Al ratios. The NaA zeolite has a Si/Al ratio of 1, while the NaX zeolite has a Si/Al ratio of 1.17. Accordingly, there are more Al atoms in the NaA zeolite than in the NaX zeolite, relative to mass. Since negative charges are introduced into the zeolite lattice with the aluminum atoms, more cations must be present in the NaA zeolite than in the NaX zeolite, relative to the mass, to establish neutrality. The number of cations present exerts a significant influence on the capacity for H2S since more cations generally provide more binding sites. Thus, there must be another influencing factor of the zeolite structure on the capacity to explain the loadings on the NaX and NaA zeolite. Evidence of dissociative adsorption (chemisorption) was found for both zeolites when H2S was adsorbed. This takes place at the cation position III in the LTA zeolite and positions III and III′ in the FAU zeolite. Adsorption sites that cause dissociative adsorption of H2S have a high energetic value. As a result, adsorption at these sites leads to a particularly strong increase in capacity. Therefore, comparing the available number of these sites in the two zeolites is useful. Since the unit cells of the NaX (supercage) and NaA (α-cage) zeolites differ greatly, the number of dissociative adsorption sites per gram of adsorbent is determined. This can be calculated using the knowledge of the cation positions, the sum formula of the unit cell, the Si/Al ratio, and the residual water content in the zeolite. Table 2 gives an overview of the data used for the calculation and the results.
Table 2. Parameters for Calculating the Number of Chemisorptively Active Cations per Gram of Adsorbent.
| NaX | NaA | |||
|---|---|---|---|---|
| sum formula unit cell | ||||
| Si/Al ratio | 1,17 | 1 | ||
| number of Na + cations per unit cell | 88 | 12 | ||
| residual water content (Karl Fischer titration) | 0,96 Ma % | 1,16 Ma % | ||
| number of unit cells per g adsorbent | 4,43025 × 10¹⁹ | 3,49165 E + 20 | ||
| number of chemisorptively active cations per unit cell | 24 | 1 | ||
| number of chemisorptively active cations per g adsorbent | 1,06326 × 10²¹ | 3,49165 E + 20 |
This calculation shows that the number of potentially chemisorptively active cations in the NaX zeolite is 3 times higher than in the NaA zeolite. Accordingly, a greater proportion of dissociative adsorption of H2S can be assumed in the NaX zeolite.
This assumption can be confirmed by observing the isotherms at 85 °C. Due to the strong temperature dependence of the physisorption of H2S on the cations, a strong decrease in capacity can be expected due to the temperature increase. Accordingly, the contribution of physisorption to the total loading is assumed to be very small. The majority of the total loading is caused by chemisorption. Since the loading of the NaX zeolite at 85 °C with 0.52 mol kg–1 at an adsorptive concentration of about 50 ppm is larger than the loading of the NaA zeolite with 0.19 mol kg–1, a larger share of dissociative adsorption can be assumed. This is consistent with the calculations.
Thus, although there are more cations per gram of adsorbent in the NaA zeolite than in the NaX zeolite, a lower loading is found on the NaA zeolite because the different structure leads to strong differences in cation positioning. Thereby, more cations are available for the H2S molecules in the NaX zeolite, which allow dissociative adsorption of H2S due to their positioning. This dissociative adsorption makes a large contribution to the total capacity due to its high energetic valence so that the NaX zeolite has a larger capacity for H2S than the NaA zeolite over the entire concentration range and at both 25 and 85 °C. This example emphasizes that the positioning, type, number, and accessibility of the cations dominate the adsorption mechanisms and capacity.
5. Summary
The adsorption of hydrogen sulfide was studied on FAU zeolites in which sodium was exchanged for calcium with exchange rates of 0, 19, 36, 50, 56, 71, and 90%. For this purpose, cumulative breakthrough curves were measured at temperatures of 25 and 85 °C in a fixed-bed adsorber. Using a mass balance, the loading could be determined and isotherm parameters fitted to the experimental data. No clear trends can be found with an increasing degree of exchange in the arrangement of the isotherms. Instead, a trend reversal of the capacities with an increasing degree of exchange is found at both temperatures at the end of the measurement range. This is attributed to the superposition of multiple opposing effects. For example, the type and number of cations have an influence on the loading due to the different strengths of interactions with H2S molecules. In the exchange series, as the proportion of calcium ions increases, the total number of cations decreases. At the same time, more divalent cations are present. Furthermore, different cation positions exist in FAU zeolites, which are differently attractive for cations. However, some of these positions are not accessible to the H2S molecules due to their location in the zeolite lattice. Finally, to work out a mechanistic proposal, the temperature dependence of the adsorption of H2S on the seven zeolites was considered. Differentially strong temperature dependences of the isotherms at exchange rates up to 50% indicate two energetically different kinds of adsorption sites. The temperature-independent adsorption sites are attributed to a chemisorptive mechanism in which the dissociation of H2S molecules occurs. The resulting proton and hydrogen sulfide ion are covalently bonded to the zeolite lattice. Since evidence for this mechanism cannot be observed at exchange rates above 50%, dissociative adsorption of H2S molecules is associated with sodium cations at positions III and III’. When the exchange rate is increased, the occupation of these positions disappears and thus chemisorption. Physisorption of H2S molecules on accessible cations and anions by the formation of electrostatic interactions then dominates.
The comparison of the influence of the structure of the NaA and NaX zeolites on the adsorption of hydrogen sulfite shows that consistently higher capacities are achieved on the NaX zeolite. This can be explained by the larger proportion of catalytically active sites in the NaX zeolite compared to the NaA zeolite, relative to the adsorbent mass..
Acknowledgments
The authors wish to express their thanks to BASF Catalysts Germany GmbH for funding and technical support and Chemiewerk Bad Köstritz GmbH for the support with adsorbent materials.
Supporting Information Available
The Supporting Information is available free of charge at https://pubs.acs.org/doi/10.1021/acsomega.2c04606.
Isotherm parameters and regression coefficients, experimental isotherm data, calculated H2S molecules per unit cell at 2000 ppm, mass balances for the adsorption and desorption of H2S at 25 °C on NaX and CaNaX(56%), pore size distribution from nitrogen isotherms, and BET surface and pore volume for NaX and CaNaX(71%) from argon isotherms (PDF)
The project is funded by BASF Catalysts Germany GmbH.
The authors declare no competing financial interest.
Supplementary Material
References
- bp. Statistical Review of World Energy, 2021.https://www.bp.com/content/dam/bp/business-sites/en/global/corporate/pdfs/energy-economics/statistical-review/bp-stats-review-2021-full-report.pdf.
- IEA . Gas, 2020. https://www.iea.org/reports/gas-2020.
- bp. Energy Outlook 2020 Edition, 2020.https://www.bp.com/en/global/corporate/energy-economics/energy-outlook/energy-outlook-downloads.html.
- Berg F.; Pasel C.; Eckardt T.; Bathen D. Temperature Swing Adsorption in Natural Gas Processing: A Concise Overview. ChemBioEng Rev 2019, 6, 59–61. 10.1002/cben.201900005. [DOI] [Google Scholar]
- Mokhatab S.; Poe W. A., Eds. Handbook of natural gas transmission and processing, 2nd ed.; Gulf Professional Pub, 2012. [Google Scholar]
- Kohl A. L., Ed. Gas Purification, 5th ed.; Elsevier Science & Technology, 1997. [Google Scholar]
- Belviso C., Ed. In Zeolites - Useful Minerals: Industrial Zeolite Molecular Sieves; IntechOpen, 2016. [Google Scholar]
- Yang R. T.Adsorbents: Fundamentals and applications; Wiley-Interscience, 2003. [Google Scholar]
- Kulprathipanja S.Zeolites in Industrial Separation and Catalysis. Zeolites in industrial separation and catalysis; Wiley-VCH Verlag GmbH & Co, 2010. [Google Scholar]
- Baerlocher C.; Olson D.; McCusker L. B.; Meier W. M.. In Atlas of zeolite framework types; ScienceDirect, Ed.; Elsevier; ScienceDirect Online-Anbieter, 2007, p 6. [Google Scholar]
- Gleichmann K.; Unger B.; Brandt A.. Industrial Zeolite Molecular Sieves; IntechOpen; 2017, Vol 89. [Google Scholar]
- Gleichmann K.; Unger B.; Brandt A. Industrielle Herstellung von zeolithischen Molekularsieben. Chem. Ing. Tech. 2017, 89, 851–862. 10.1002/cite.201600164. [DOI] [Google Scholar]
- Starke A.; Pasel C.; Bläker C.; Eckardt T.; Zimmermann J.; Bathen D. Impact of Na+ and Ca2+ Cations on the Adsorption of H2S on Binder-Free LTA Zeolites. Adsorpt. Sci. Technol. 2021, 2021, 1–12. 10.1155/2021/5531974. [DOI] [Google Scholar]
- Unger B.; Schumann K.; Brandt A. Zeolithe als Sorptionsmittel. Chem. Ing. Tech. 2010, 82, 929–940. 10.1002/cite.201000013. [DOI] [Google Scholar]
- Cruz A. J.; Pires J.; Carvalho A. P.; De Carvalho M. B. de. Physical Adsorption of H2S Related to the Conservation of Works of Art: The Role of the Pore Structure at Low Relative Pressure. Adsorption 2005, 11, 569–576. 10.1007/s10450-005-5614-3. [DOI] [Google Scholar]
- Tomadakis M. M.; Heck H. H.; Jubran M. E.; Al-Harthi K. Pressure-Swing Adsorption Separation of H 2 S from CO 2 with Molecular Sieves 4A, 5A, and 13X. Sep. Sci. Technol. 2011, 46, 428–433. 10.1080/01496395.2010.520292. [DOI] [Google Scholar]
- Mauer V.; Bläker C.; Pasel C.; Bathen D. Energetic Characterization of Faujasite Zeolites Using a Sensor Gas Calorimeter. Catalysts 2021, 11, 98. 10.3390/catal11010098. [DOI] [Google Scholar]
- Frising T.; Leflaive P. Extraframework cation distributions in X and Y faujasite zeolites: A review. Microporous Mesoporous Mater. 2008, 114, 27–63. 10.1016/j.micromeso.2007.12.024. [DOI] [Google Scholar]
- Plant D. F.; Maurin G.; Jobic H.; Llewellyn P. L. Molecular dynamics simulation of the cation motion upon adsorption of CO2 in Faujasite zeolite systems. J. Phys. Chem. B 2006, 110, 14372–14378. 10.1021/jp062381u. [DOI] [PubMed] [Google Scholar]
- Maurin G.; Plant D. F.; Henn F.; Bell R. G. Cation migration upon adsorption of methanol in NaY and NaX faujasite systems: a molecular dynamics approach. J. Phys. Chem. B 2006, 110, 18447–18454. 10.1021/jp062059j. [DOI] [PubMed] [Google Scholar]
- Calero S.; Dubbeldam D.; Krishna R.; Smit B.; Vlugt T. J. H.; Denayer J. F. M.; Martens J. A.; Maesen T. L. M. Understanding the role of sodium during adsorption: a force field for alkanes in sodium-exchanged faujasites. J. Am. Chem. Soc. 2004, 126, 11377–11386. 10.1021/ja0476056. [DOI] [PubMed] [Google Scholar]
- Beauvais C.; Boutin A.; Fuchs A. H. Adsorption of water in zeolite sodium-faujasite. C. R. Chim. 2005, 8, 485–490. 10.1016/j.crci.2004.11.011. [DOI] [Google Scholar]
- Karge H. G.; Ziółek M.; Łaniecki M. U. . v. . spectroscopic study of hydrogen sulphide adsorption on faujasite-type zeolitesr. Zeolites 1987, 7, 197–202. 10.1016/0144-2449(87)90050-9. [DOI] [Google Scholar]
- Sigot L.; Ducom G.; Germain P. Adsorption of hydrogen sulfide (H2S) on zeolite (Z): Retention mechanism. Chem. Eng. J. 2016, 287, 47–53. 10.1016/j.cej.2015.11.010. [DOI] [Google Scholar]
- Fellmuth P.; Lutz W.; Bülow M. Influence of weakly coordinated cations and basic sites upon the reaction of H2S and CO2 on zeolites. Zeolites 1987, 7, 367–371. 10.1016/0144-2449(87)90041-8. [DOI] [Google Scholar]
- Jang S. B.; Jeong M. S.; Kim Y.; Han Y. W.; Seff K. Crystal structure of a hydrogen sulfide sorption complex of fully Ca2+-exchanged zeolite X. Microporous Mesoporous Mater. 1998, 23, 33–44. 10.1016/S1387-1811(98)00043-2. [DOI] [Google Scholar]
- Mauer V.; Petersen H.; Bläker C.; Pasel C.; Weidenthaler C.; Bathen D. Combination of X-ray powder diffraction and adsorption calorimetry for the characterization of calcium exchanged LTA zeolites. Microporous Mesoporous Mater. 2022, 337, 111940. 10.1016/j.micromeso.2022.111940. [DOI] [Google Scholar]
- Ruthven D. M.Principles of adsorption and adsorption processes; A Wiley-Interscience publication; Wiley, 1984. [Google Scholar]
- Xu R., Ed. In Chemistry of zeolites and related porous materials: Synthesis and structure; Wiley, 2007. [Google Scholar]
- Takaishi T. Ordered distribution of Na ions in dehydrated NaX zeolite. Zeolites 1996, 17, 389–392. 10.1016/0144-2449(96)00020-6. [DOI] [Google Scholar]
- Abrioux C.; Coasne B.; Maurin G.; Henn F.; Jeffroy M.; Boutin A. Cation Behavior in Faujasite Zeolites upon Water Adsorption: A Combination of Monte Carlo and Molecular Dynamics Simulations. J. Phys. Chem. C 2009, 113, 10696–10705. 10.1021/jp902274t. [DOI] [Google Scholar]
- Buttefey S.; Boutin A.; Mellot-Draznieks C.; Fuchs A. H. A Simple Model for Predicting the Na + Distribution in Anhydrous NaY and NaX Zeolites. J. Phys. Chem. B 2001, 105, 9569–9575. 10.1021/jp0105903. [DOI] [Google Scholar]
- Calestani G.; Bacca G.; Andreetti G. D. Structural study of zeolite X exchanged with ‘f’ transition elements. I. Crystal structure of reference hydrated NaX. Zeolites 1987, 7, 54–58. 10.1016/0144-2449(87)90120-5. [DOI] [Google Scholar]
- Di Lella A.; Desbiens N.; Boutin A.; Demachy I.; Ungerer P.; Bellat J.-P.; Fuchs A. H. Molecular simulation studies of water physisorption in zeolites. Phys. Chem. Chem. Phys. 2006, 8, 5396–5406. 10.1039/B610621H. [DOI] [PubMed] [Google Scholar]
- Beauvais C.; Guerrault X.; Coudert F.-X.; Boutin A.; Fuchs A. H. Distribution of Sodium Cations in Faujasite-Type Zeolite: A Canonical Parallel Tempering Simulation Study. J. Phys. Chem. B 2004, 108, 399–404. 10.1021/jp036085i. [DOI] [Google Scholar]
- Bey O.; Eigenberger G. Fluid flow through catalyst filled tubes. Chem. Eng. Sci. 1997, 52, 1365–1376. 10.1016/S0009-2509(96)00509-X. [DOI] [Google Scholar]
- Shah M. S.; Tsapatsis M.; Siepmann J. I. Hydrogen Sulfide Capture: From Absorption in Polar Liquids to Oxide, Zeolite, and Metal-Organic Framework Adsorbents and Membranes. Chem. Rev. 2017, 117, 9755–9803. 10.1021/acs.chemrev.7b00095. [DOI] [PubMed] [Google Scholar]
- Bülow M.; Lutz W.; Suckow M. The mutual transformation of hydrogen sulphide and carbonyl sulphide and its role for gas desulphurization processes with zeolitic molecular sieve sorbents. Stud. Surf. Sci. Catal. 1999, 120, 301–345. 10.1016/S0167-2991(99)80556-4. [DOI] [Google Scholar]
- Förster H.; Schuldt M. Infrared spectroscopic study of the adsorption of hydrogen sulfide on zeolites NaA and NaCaA. J. Colloid Interface Sci. 1975, 52, 380–385. 10.1016/0021-9797(75)90213-1. [DOI] [Google Scholar]
- Chowanietz V.; Pasel C.; Luckas M.; Bathen D. Temperature Dependent Adsorption of Sulfur Components, Water, and Carbon Dioxide on a Silica–Alumina Gel Used in Natural Gas Processing. J. Chem. Eng. Data 2016, 61, 3208–3216. 10.1021/acs.jced.6b00301. [DOI] [Google Scholar]
Associated Data
This section collects any data citations, data availability statements, or supplementary materials included in this article.