

Abstract

4-Hydroxy-2-butanone, an important intermediate for vitamin A and fragrances, is usually produced by aldol condensation of acetone and formaldehyde. Noncatalytic synthesis of 4-hydroxy-2-butanone in supercritical state, which was fast and had high production yield, was widely applied. Previous research on 4-hydroxy-2-butanone synthesis in the supercritical state focused on the formation and dehydration of 4-hydroxy-2-butanone while ignoring side reactions involving formaldehyde, which were studied in this paper. A reaction pathway of 4-hydroxy-2-butanone supercritical synthesis containing formaldehyde side reactions was proposed. The cross-disproportionation of formaldehyde and formic acid was found to be the main consumption of formic acid. The effects of initial formaldehyde and formic acid mass fractions in the feed on side reactions were studied. Based on the experiments conducted from 523.15 K to 563.15 K and 17 MPa, a kinetic model was suggested. The relative deviations between experimental and simulated data were less than 10%.
1. Introduction
4-Hydroxy-2-butanone (HB), an important intermediate for vitamin A and fragrances, is usually produced by aldol condensation of acetone and formaldehyde. Typical HB synthesis was conducted in the liquid phase with an alkaline catalyst,1 which produced lots of wastewater and increased the separation burden. Recently, Wang and Cai.2 used ion liquid to catalyze aldol condensation in the liquid phase, and the selectivity of HB was improved greatly. However, the separation process for ion liquid was still needed. Tanner et al.3 used vanadium phosphate to catalyze aldol condensation in the gas phase, but catalyst deactivation was inevitable and an oxidation treatment was needed for catalyst regeneration. Attempts have been made to conduct supercritical HB synthesis where acetone (critical temperature 508.2 K and critical pressure 4.7 MPa4) and formaldehyde aqueous solution were mixed and reacted with each other to provide a HB yield of 90%.5−7 Mei et al.5 found that aldol reaction of acetone and formaldehyde in the supercritical state was autocatalytic, and no additional catalyst was needed. From the viewpoint of green chemistry,8 no additional catalyst meant no extra separation burden, no catalyst regeneration problem, and less wastewater. Thus, supercritical synthesis of HB has considerable advantage in industrial production in the long term.
According to the study of Mei et al.,5 a small amount of formic acid appeared via noncatalytic self-disproportionation of formaldehyde during supercritical HB synthesis. The generated formic acid proved to play the role of the catalyst in the formation and dehydration of HB. The reaction pathway and the kinetic model for the main reactions (the formation and dehydration of HB) were provided. However, the consumption path of formic acid was not confirmed and side reactions involving formaldehyde were not included, which made the kinetic model unable to predict the effects of different initial concentrations of formaldehyde and formic acid in the feed.
The reactivity of formaldehyde was complex at high temperature and high pressure. The self-disproportionation of formaldehyde, the cross-disproportionation of formaldehyde with formic acid, and the decomposition of formaldehyde and formic acid existed at the same time in supercritical water.9−11 Density,10 pH,11,13 and catalyst12,13 would change the reaction pathways. Meanwhile, all of the above research were conducted in aqueous solution. Reports about formaldehyde activity in supercritical acetone are scarce.
Now that formic acid is the significant catalyst of HB synthesis in the supercritical state based on the study of Mei et al.,5 the generation and consumption of formic acid play an important role during the synthesis process, which were possibly the side reactions involving formaldehyde. So, the study on side reactions involving formaldehyde in HB synthesis shows great value for both perception of the reactivity of formaldehyde in supercritical acetone and HB production optimization. This work is aimed to explore side reactions involving formaldehyde in the supercritical synthesis process of HB and suggest a more practical kinetic model containing side reactions.
2. Experimental Methods
2.1. Materials
Formaldehyde aqueous solution (36–40 wt %) was purchased from Xi long Chemical Co., Ltd., China. 100 mg/L formaldehyde standard solution was supplied by Aladdin Industrial Co., Ltd., China. Acetone (purity of 99.5%) was supplied by Sinopharm Chemical Reagent Co., Ltd., China. HB (purity of 95.0%), formic acid (purity of 99.0%), 2-pentanone (purity of 99.0%), and 2-heptanol (purity of 99.0%) were purchased from Aladdin Industrial Co., Ltd., China. All chemicals were used without further purification.
2.2. Apparatus and Experimental Procedures
All experiments were performed in the supercritical fluid reaction system SFR0.1 manufactured by SEPAREX as mentioned in the literature.5 The experimental apparatus mainly consisted of two high-performance liquid chromatography (HPLC) pumps, a preheater, a cooler, and a volumetric variable 316L stainless steel tube reactor. A gas/liquid separator was located at the exit of the reactor to facilitate sampling. Pressure was controlled by a programmable back pressure valve at the exit of the reactor. Temperature was controlled by sensors installed at several points throughout the system. The accuracies of temperature and pressure were within 1 K and 0.1 MPa, respectively.
All experiments were conducted at 17 MPa. Preheated acetone (523.15 to 563.15 K) was mixed with unheated formaldehyde aqueous solution at the entrance of the reactor. The samples of the liquid-phase product were taken at different residence times which was controlled between 0.4 and 2.5 min and calculated by eq 1.
| 1 |
where τ is the residence time and Vr is the volume of the tube reactor (38.0 mL in this job). Vs, mr, and ρr are the volumetric flow rate, the mass flow rate, and the density of the reaction solution at reaction conditions. mr was measured by weighing the feed. An assumption was introduced that the density of the reaction mixture is kept constant during the reaction and is equal to that of the feed. Table 1 shows the feed densities calculated by Aspen Plus V10 with PRWS EOS from 523.15 to 563.15 K.
Table 1. Density of the Feed from 523.15 K to 563.15 K and 17 MPaa.
| temperature (K) | 523.15 | 533.15 | 543.15 | 553.15 | 563.15 |
| density (g/mL) | 0.444 | 0.4251 | 0.4058 | 0.3862 | 0.3665 |
Data calculated by Aspen Plus V10 with PRWS EOS.
2.3. Analytical Methods
Both gas-phase products and liquid-phase products were determined by gas chromatography (GC)–mass spectroscopy using an Agilent 7890 GC system equipped with a mass spectrometry detector. Liquid-phase reaction products were analyzed quantitatively by a GC Agilent 7820A GC system equipped with a 30 m × 0.25 mm × 0.25 μm BP-WAX capillary column and a flame ionization detector. The column temperature was 70 °C for 7 min, increased to 140 °C at a rate of 40 °C/min, held for 20 min, and increased to 250 °C at a rate of 10 °C/min. The temperature of the GC injector and detector was 250 °C. The split ratio was 50:1. The sample volume was 1 μL.
Methanol, HB, methyl vinyl ketone (MVK), water, 2-hydroxyethyl vinyl ketone (HVK), and divinyl ketone (DVK) in liquid phase were analyzed quantitatively via GC. 2-Pentanone and 2-heptanol were internal standard substances for methanol and HB, respectively. The GC correction factors of MVK, HVK, and DVK were calculated by the effective carbon number approach with methanol as the reference.
Formaldehyde in liquid phase was quantified by the external standard method via detecting ultraviolet absorption under 415 nm14 after acetylacetone derivatization.15 Before acetylacetone derivatization, the liquid-phase product was diluted to ensure that the mass fraction of formaldehyde was within 0.8–1.6 ppm, which was within the measuring range of the external standard line to ensure accuracy.
The content of formic acid was calculated via detecting the pH of the liquid-phase product. The substances capable of ionizing hydrogen ions in the liquid-phase product were formic acid and carbonic acid whose pKa were 3.75 and 6.37, respectively. Before pH detection, the liquid-phase product was diluted till the solution pH was around 4.00. In this case, ionization of carbonic acid and water could be neglected. The mass fraction of formic acid in the liquid-phase product was calculated as follows.
| 2 |
| 3 |
| 4 |
| 5 |
| 6 |
Cacid/mol L–1, CHCOOH/mol L–1, and CHCOO–/mol L–1 are the total concentration of formic acid molecule and formate ion, formic acid concentration, and formate ion concentration in diluted solution, respectively. KHCOOH is the formic acid ionization constant with a value of 1.77 × 10–416 at 25 °C. x is the mass fraction of total formic acid in the liquid-phase product. a is the mass dilution ratio of the liquid-phase product. MHCOOH/g is the molecular weight of formic acid.
The content of water in the liquid-phase product, which was almost the same before and after the reaction, was treated as a constant and determined from the feed by a Karl Fischer moisture titrator. Mass fraction of acetone in the liquid-phase product was determined by conservation of mass.
The total amount of gas-phase products was less than 0.1 mol % of initial formaldehyde in the feed. Thus, the gas-phase products were neglected during quantitative analysis.
3. Results
3.1. Reaction Pathway
As mentioned in the work of Mei et al.,5 formic acid degraded in two ways: self-degradation and cross-disproportionation with formaldehyde. Herein, the reactivity of formic acid was examined. Formic acid aqueous solution was mixed with supercritical acetone at 543.15 K, 17 MPa and reacted for 3 min. The formic acid and water mass fractions in the feed were around 0.1 and 5%, respectively, close to maximum during HB synthesis. The mass fractions of formic acid before and after the reaction were almost the same, which proved that formic acid was chemically stabilized under reaction conditions and did not decompose in large quantities. Meanwhile, during HB synthesis, carbon dioxide was detected both in liquid-phase and gas-phase products, and no hydrogen was detected in gas-phase products. So, it was confirmed that the cross-disproportionation with formaldehyde was the main consumption path for formic acid.
Formaldehyde could decompose in supercritical state according to the work of Osada et al.11 and Watanabe et al.12 The volume flow of the gas-phase product was detected during reaction at 543.15 K and 17 MPa. It was found that even if all gas-phase products came from formaldehyde decomposition, the amount of decomposed formaldehyde was less than 0.1 mol % of raw formaldehyde in the feed. So, the self-decomposition of formaldehyde could be ignored.
Traces of HVK and DVK were detected in the liquid-phase product. It was speculated that HVK came from aldol condensation between MVK and formaldehyde. DVK was generated from dehydration of HVK. The mass fractions of HVK and DVK during HB synthesis from 523.15 K to 563.15 K and 17 MPa were detected, whose maximums were around 2.3 and 7.8 ppm, respectively (less than 0.003 and 0.015 wt % of raw formaldehyde in the feed).
A small amount of methyl formate was found in the liquid-phase product. Tsujino et al.17 and Morooka et al.10 also detected methyl formate in the product of formaldehyde reaction. It was suspected that methyl formate came from the bimolecular reaction of formaldehyde.18 The mass fractions of methyl formate during HB synthesis from 523.15 K to 563.15 K and 17 MPa were detected. However, it was too small to determine the source (the max mass fraction was round 28 ppm, about 0.06 mol % of initial formaldehyde, during the reaction).
Based on the above studies, the reactivity of formaldehyde was described by the reaction pathway shown in Figure 1. The main reactions were the generation reactions of HB and MVK. Side reactions contained the self-disproportionation of formaldehyde, the cross-disproportionation between formaldehyde and formic acid, and the formation and dehydration of HVK.
Figure 1.

Reaction path containing main and side reactions involving formaldehyde.
By ignoring HVK and DVK due to their small amounts, reactions contributing to kinetics are presented below.
| 7 |
| 8 |
| 9 |
| 10 |
3.2. Effect of Formic Acid Mass Fraction in the Feed
The effect of formic acid was examined by artificially adding formic acid. The HB synthesis was conducted at 17 MPa and 543.15 K with the initial formic acid mass fraction of around 0, 0.11, and 0.22% in the feed. Figure 2 shows the mass fractions of formaldehyde, methanol, formic acid, HB, and MVK during HB synthesis. Note that the formic acid mass fraction was 2.37 × 10⁻⁶ in the feed with no additional formic acid.
Figure 2.
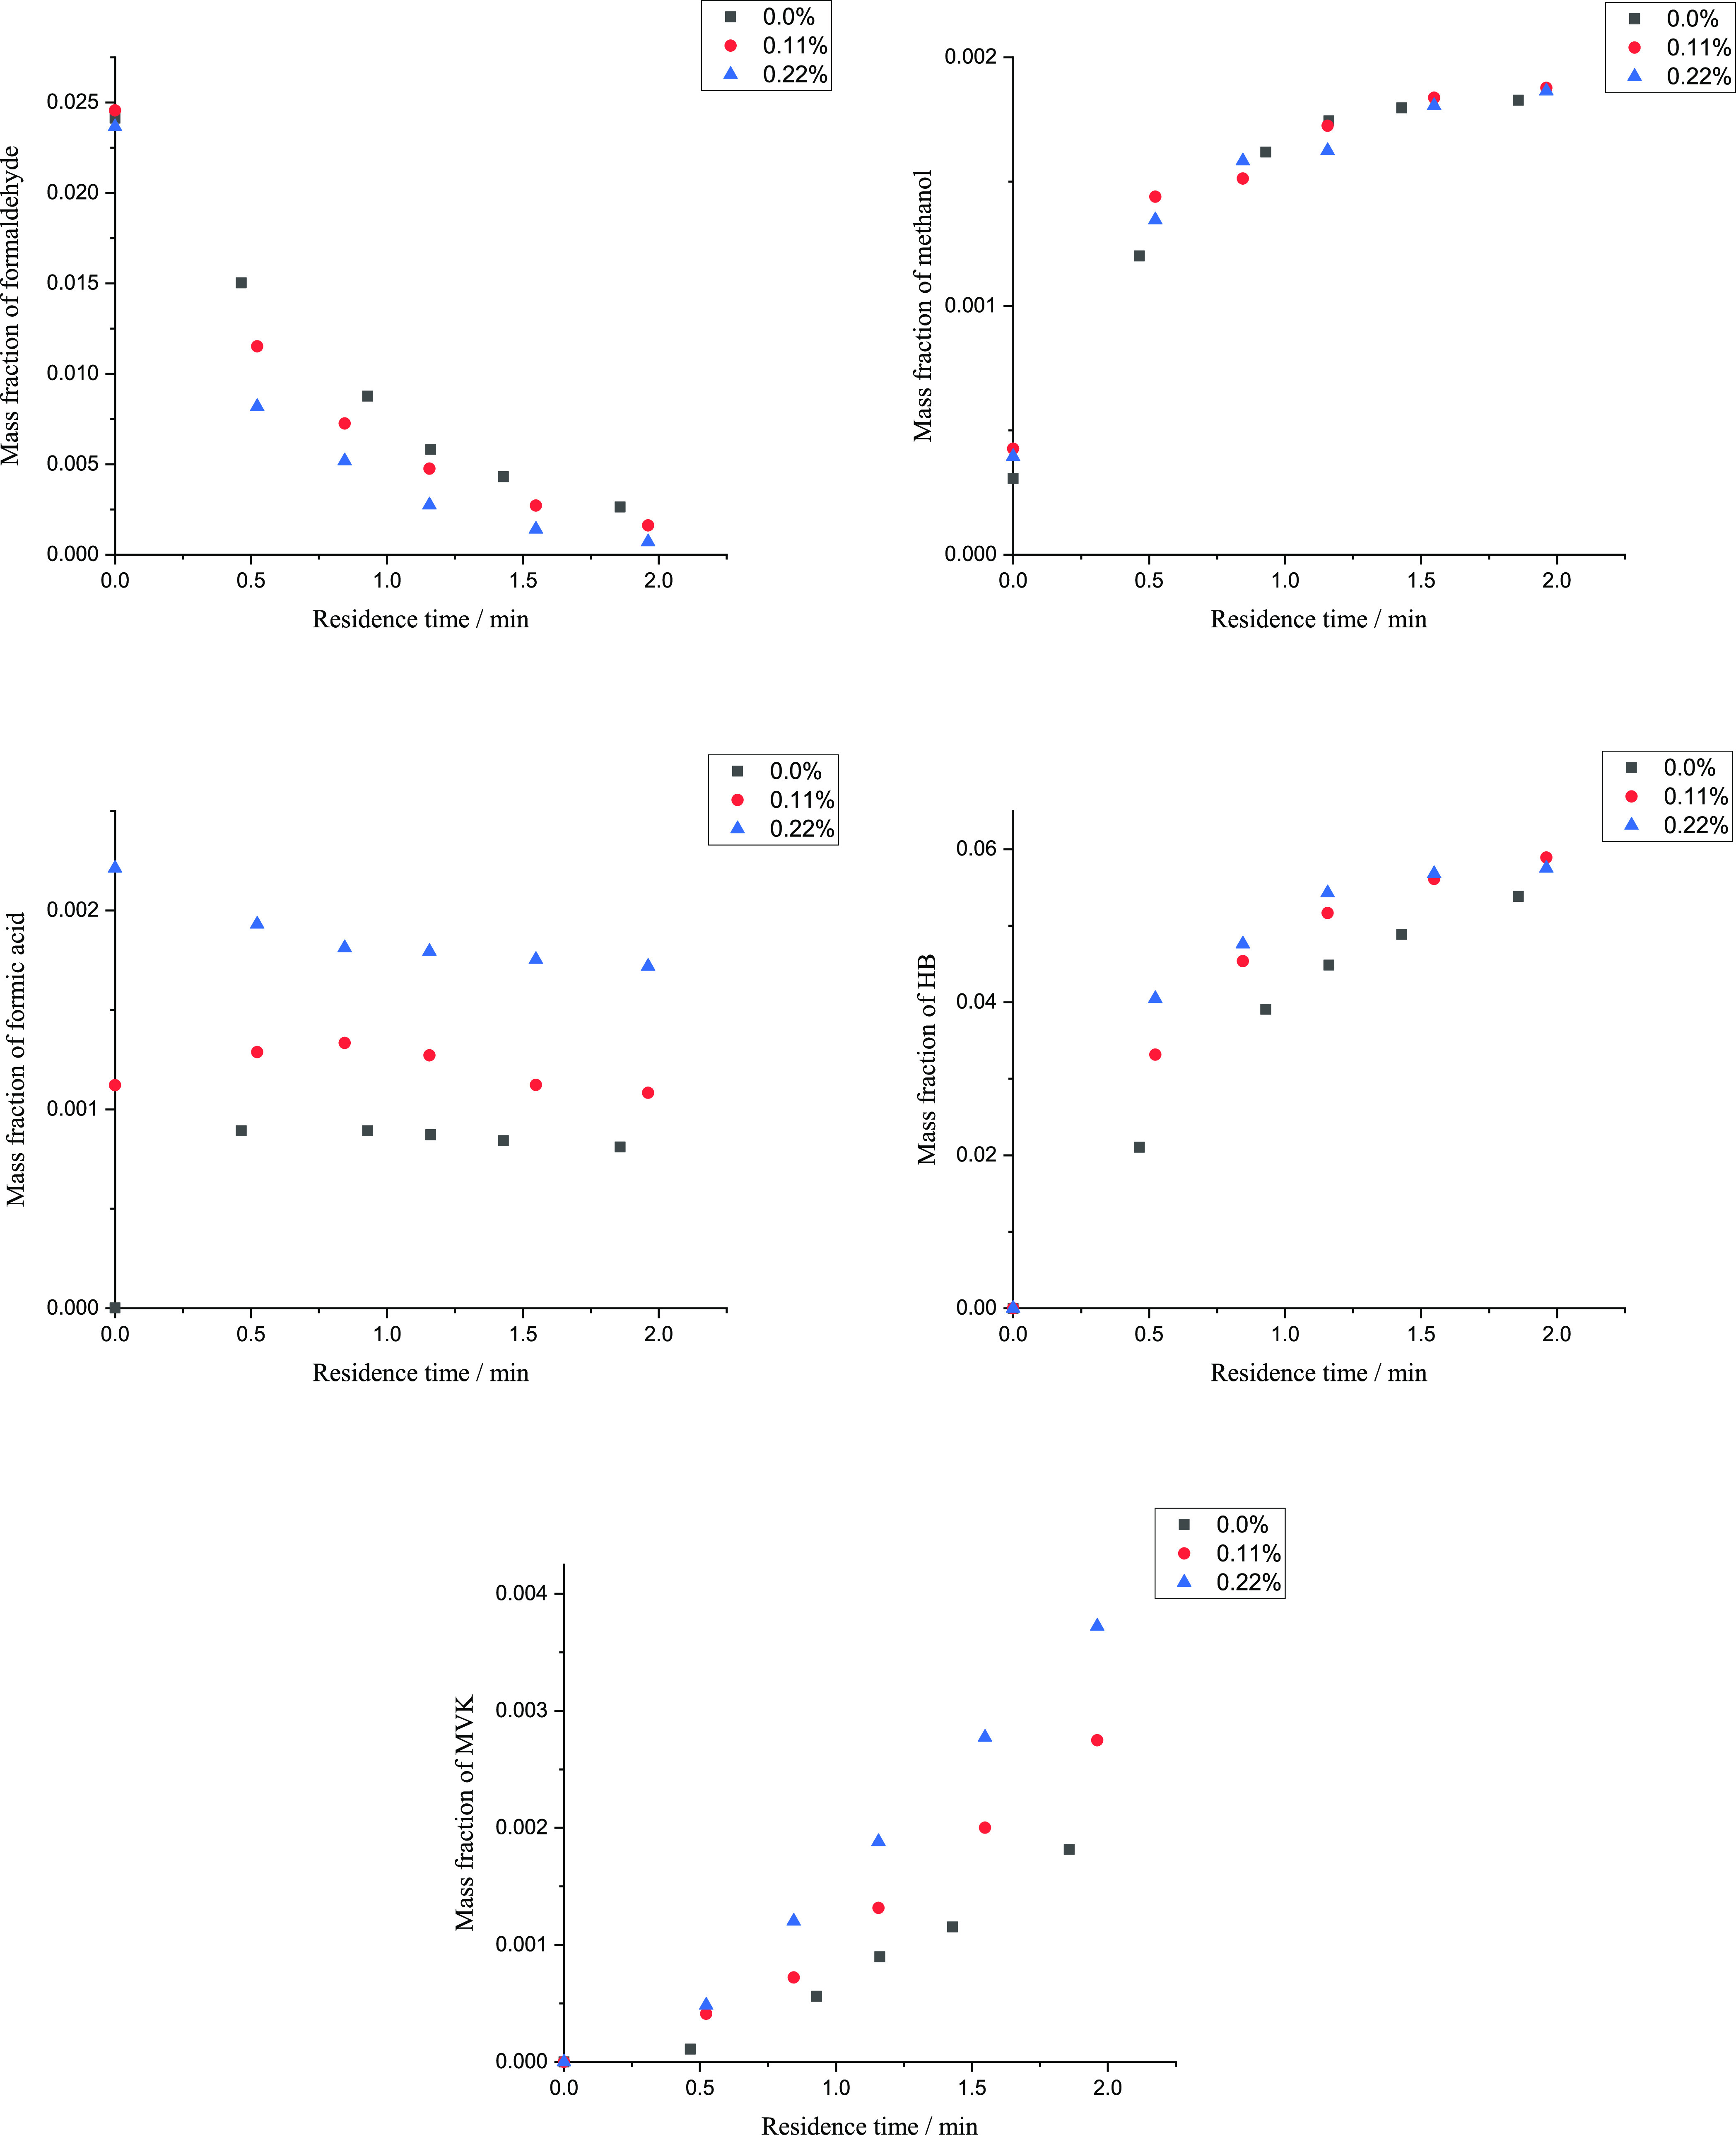
Mass fraction of formaldehyde, methanol, formic acid, HB, and MVK with the initial formic acid mass fraction of 0, 0.11, and 0.22% in the feed. The black points represent experiment data with the formic acid mass fraction of 0% in the feed; the red points represent experiment data with the formic acid mass fraction of 0.11% in the feed; the blue points represent experiment data with the formic acid mass fraction of 0.22% in the feed.
The increasement of HB and MVK generation rate proved that formic acid catalyzed R3 and R4. The reaction time needed up to a specific formaldehyde conversion was shorter with a higher initial formic acid mass fraction. However, no change could be told for methanol, which indicated that one reaction of R3 and R4 was promoted and the other was suppressed. Due to the dropping trend of formic acid with 0.22% initial formic acid mass fraction, it was more possible that R4 was the promoted one. In a word, artificially adding formic acid in the feed would promote the generation reaction of HB and MVK and improve the yield of HB and MVK.
3.3. Effect of Formaldehyde Mass Fraction in the Feed
The effect of formaldehyde mass fraction was examined by changing the mass ratio of acetone to formaldehyde aqueous solution in the feed. The supercritical HB synthesis was conducted at 543.15 K and 17 MPa with the mass ratios of 10:1, 15:1, and 20:1. Figure 3 shows the mass fraction of formaldehyde, methanol, formic acid, HB, and MVK during synthesis.
Figure 3.
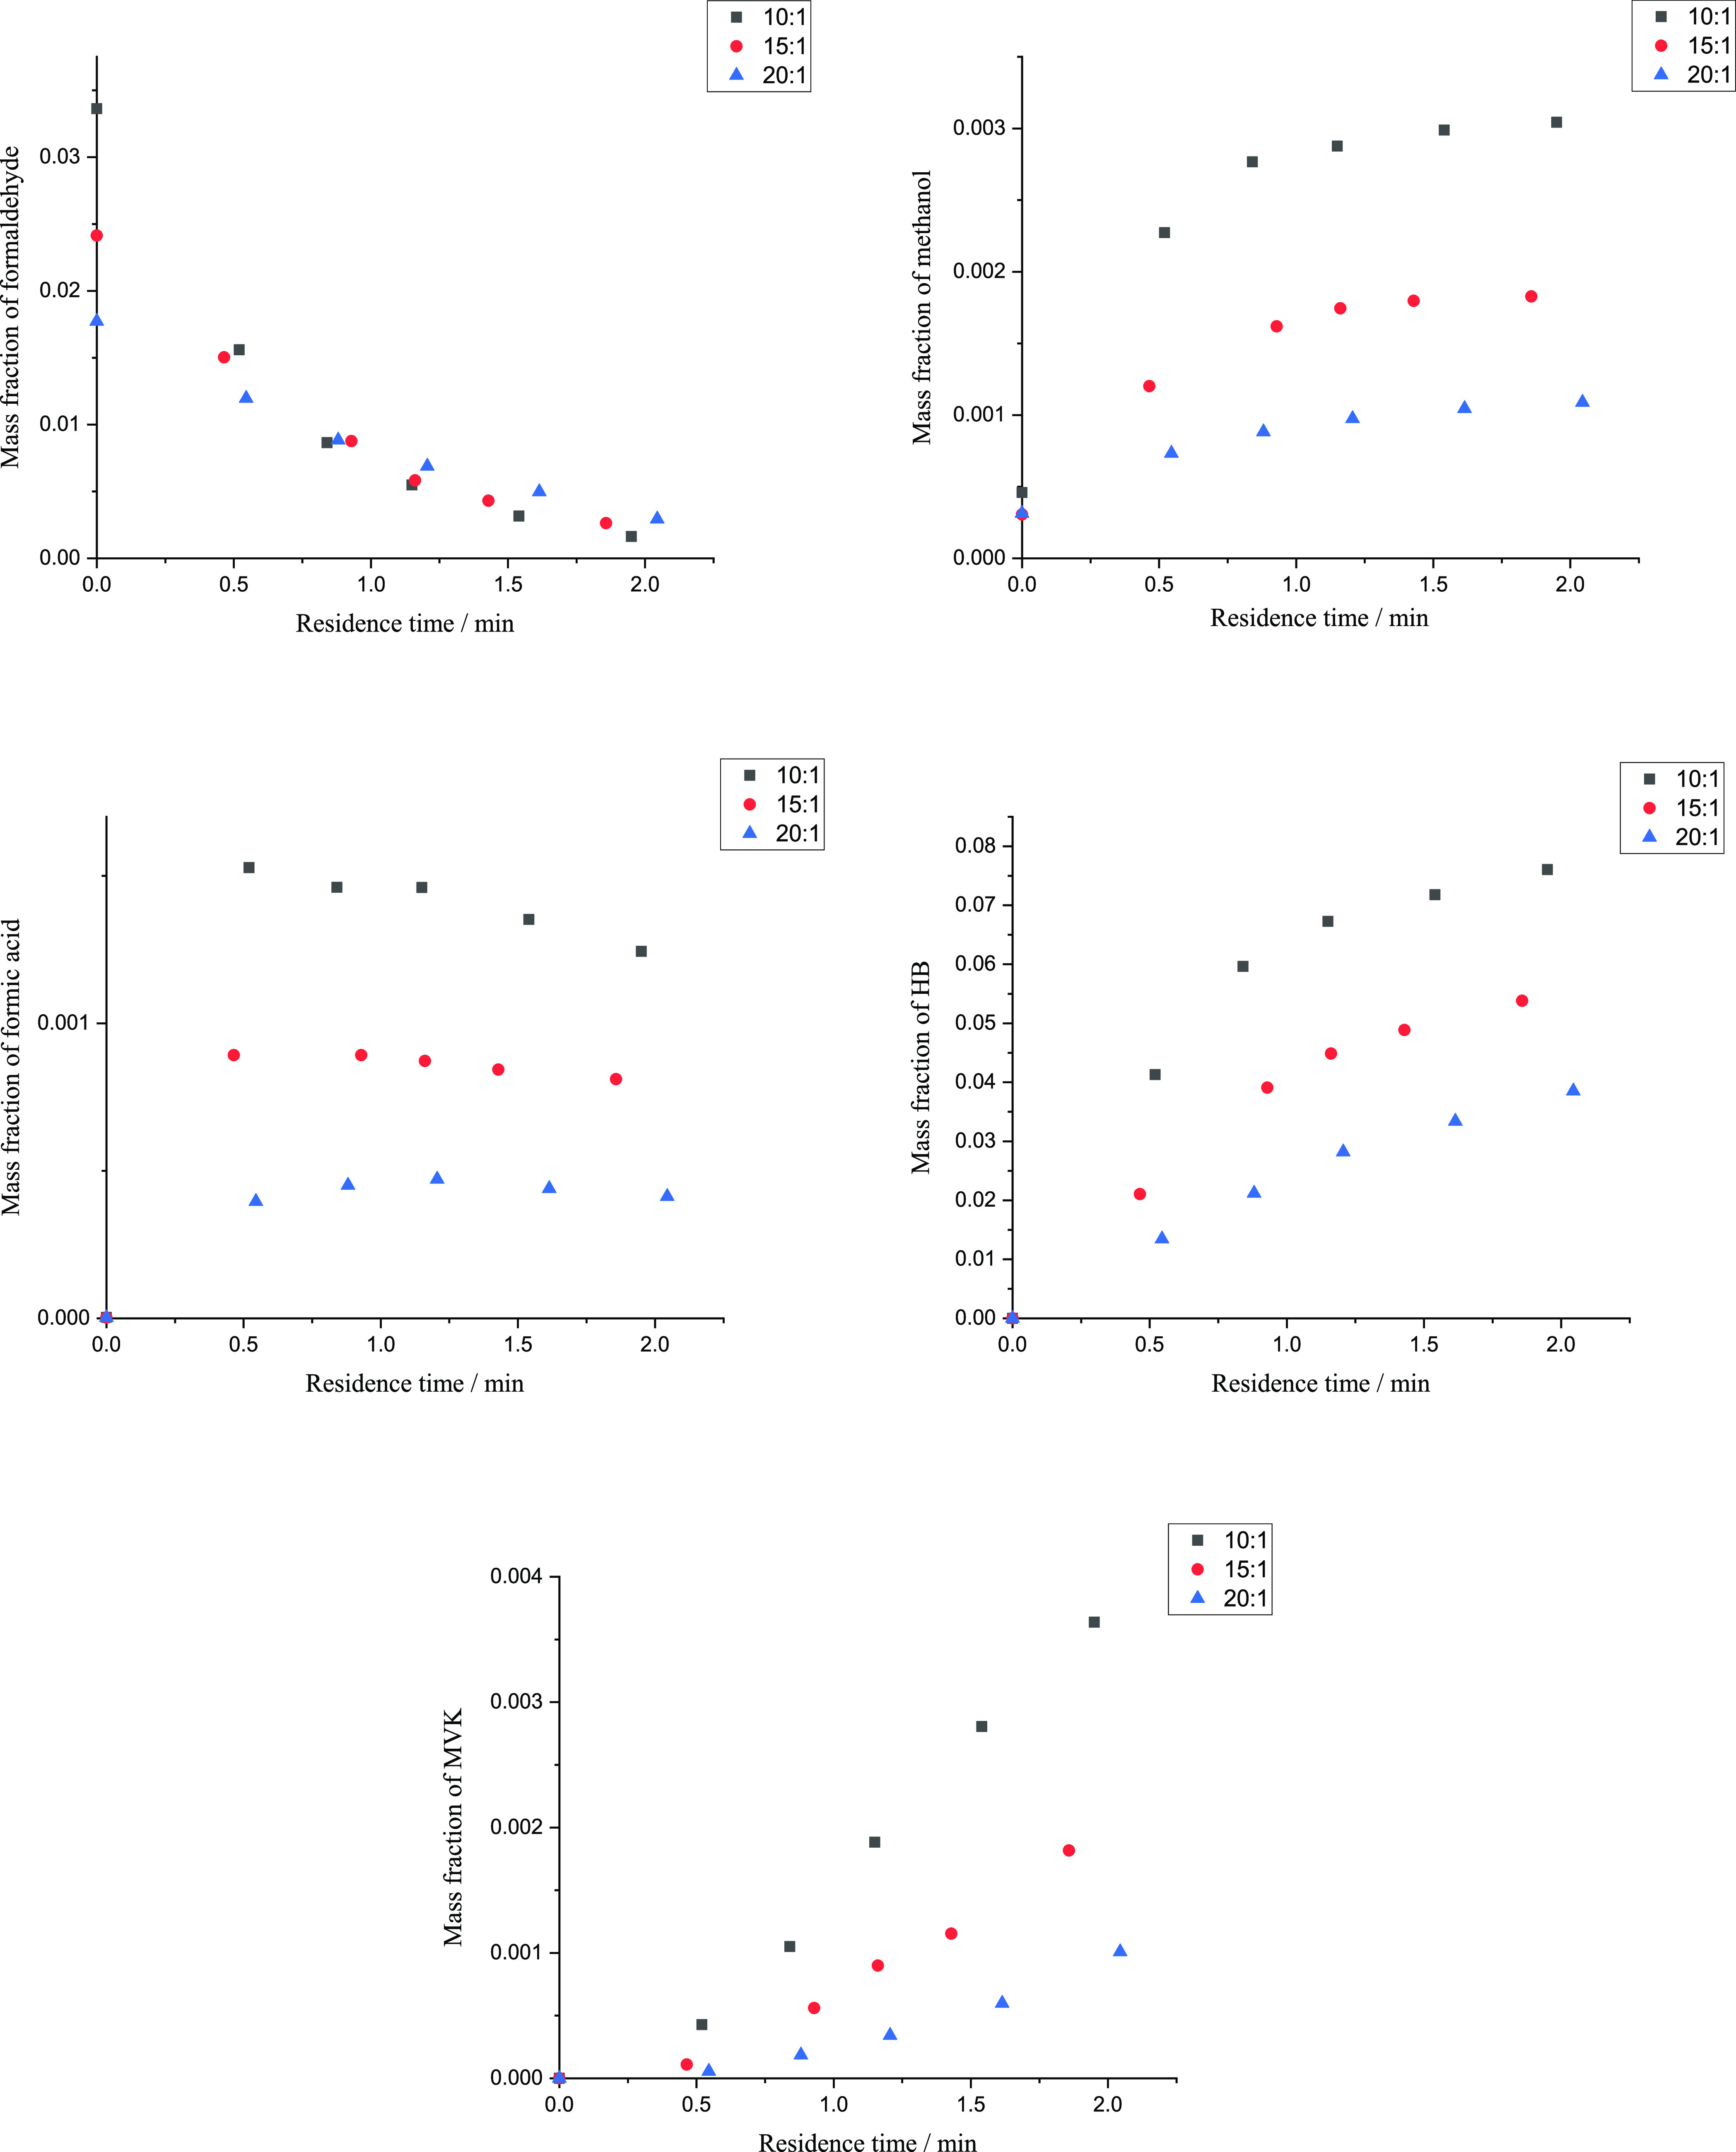
Mass fraction of formaldehyde, methanol, formic acid, HB, and MVK with acetone to formaldehyde solution mass ratios of 10:1, 15:1, and 20:1 in the feed. The black points represent experiment data with the mass ratio of 10:1 in the feed; the red points represent experiment data with the mass ratio of 15:1 in the feed; the blue points represent experiment data with the mass ratio of 20:1 in the feed.
Generation rates for all substances were faster with a higher initial mass fraction of formaldehyde. Meanwhile, as observed from the plot of formaldehyde, the reaction time up to a specific formaldehyde conversion was shorter with a higher initial formaldehyde mass fraction. For the moment, the effect of initial mass fraction of formaldehyde on the yield of HB and MVK is not clear.
3.4. Effect of Reaction Temperature
Figure 4 shows the mass fraction of substances in reaction solutions at different reaction temperatures.
Figure 4.
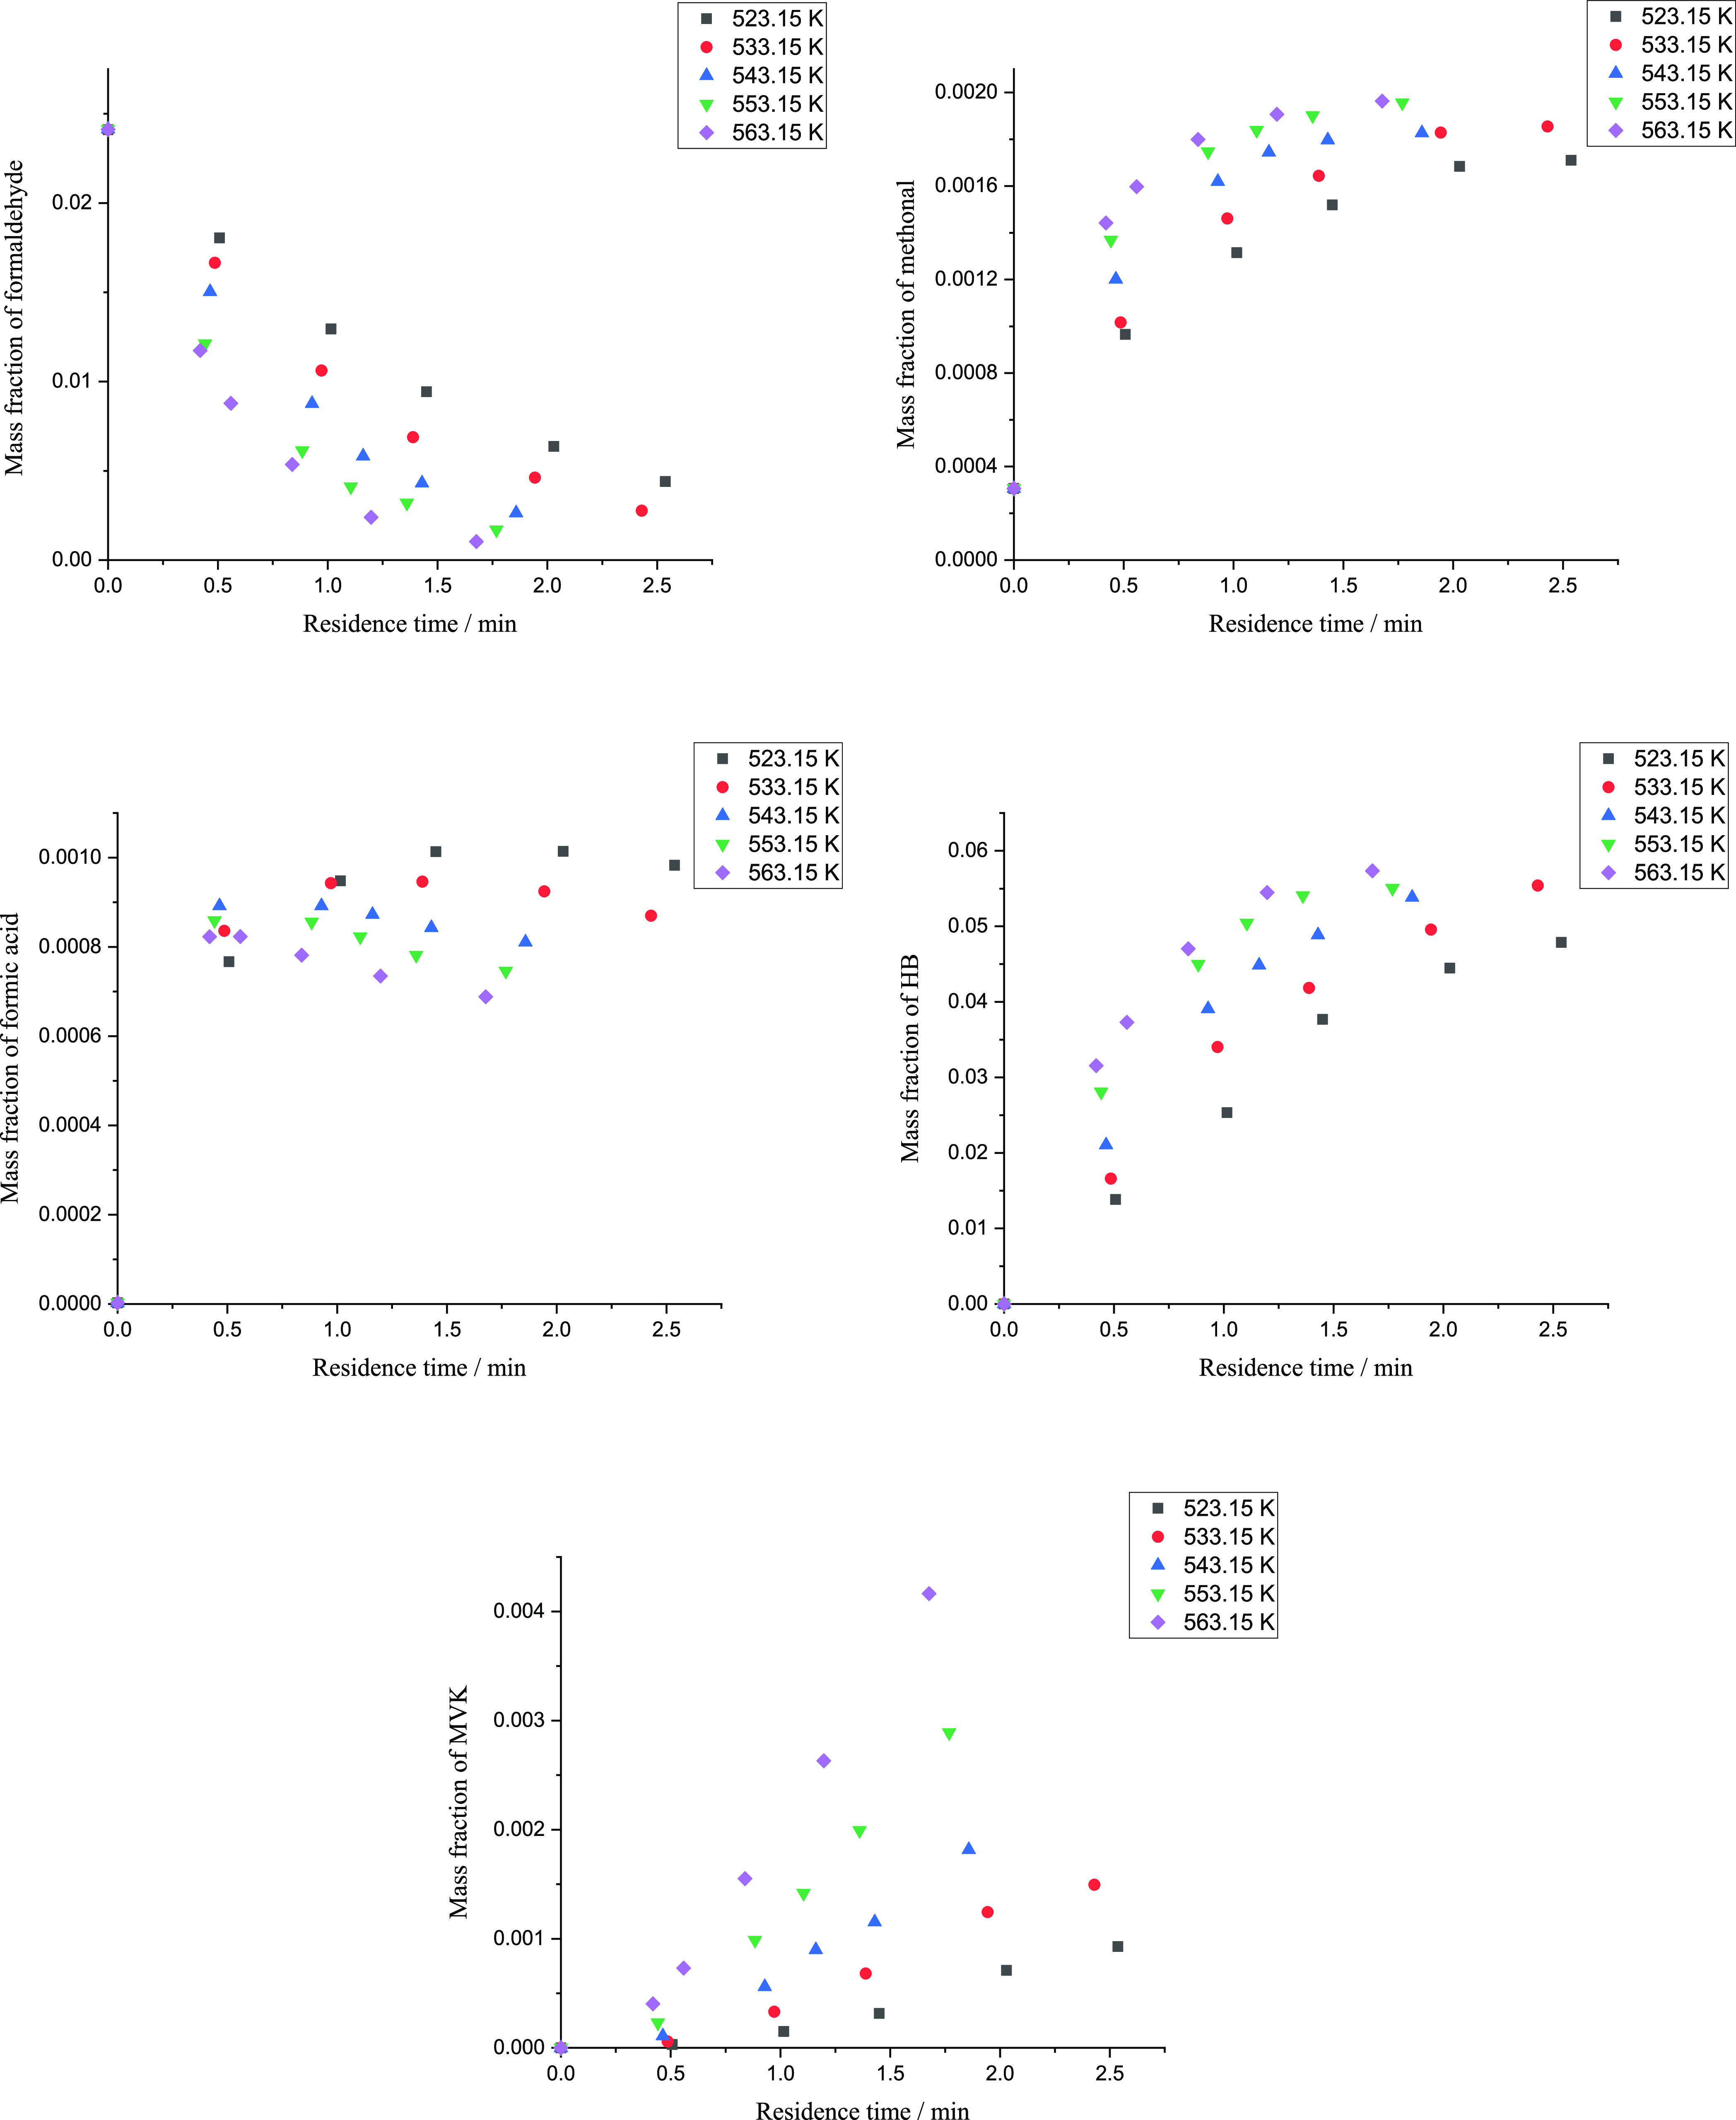
Mass fraction of formaldehyde, methanol, formic acid, HB, and MVK during HB synthesis from 543.15 K to 563.15 K and 17 MPa.
Generation rates of all substances became faster at a higher reaction temperature except formic acid whose mass fraction had different trends at different temperatures. As the reaction temperature rose, the peak of formic acid mass fraction appeared earlier, and the mass fraction near the end of the reaction became lower, which indicated that R2 was more sensitive to temperature and had a bigger activation energy than R1. The plots of HB at 553.15 and 563.15 K were close to each other, which indicated that more HB was transferred to MVK at a higher temperature. Besides, with a higher reaction temperature, the reaction time up to a specific formaldehyde conversion was shorter.
3.5. Kinetic Study
Reaction rate equations were provided according to reactions R1–R4. In the work of Watanabe et al.,12 self-disproportionation of formaldehyde was a reaction catalyzed by the hydroxyl ion, and the reaction order for the hydroxyl ion was 0.2 as shown in eq 11.
| 11 |
where r1 is the reaction rate of R1 and kr1 is the rate constant. Since the concentration of the hydroxyl ion could not be detected directly during the reaction in the supercritical state, it was calculated by ionization of formic acid. An assumption was made that hydrogen ions in the solution only came from formic acid and water ionization was neglected. Then, the concentration of the hydroxyl ion could be calculated from eq 12
| 12 |
By substituting eq 12 into the reaction rate, the formaldehyde disproportionation rate is presented below.
| 13 |
| 14 |
where k1 is the
modified rate constant. KHCOOH and Kw are the temperature-dependent constants and
estimated according to the study of Marshall et al.19 and Kim et al.20Table 2 shows  from 523.15 to 563.15 K. For industrial
applications, deviation less than 10% is acceptable. So,
from 523.15 to 563.15 K. For industrial
applications, deviation less than 10% is acceptable. So,  is regarded as a temperature-independent
parameter and contained in the modified rate constant k1 to simplify the calculation. The water concentration
was treated as a constant and calculated from the feed.
is regarded as a temperature-independent
parameter and contained in the modified rate constant k1 to simplify the calculation. The water concentration
was treated as a constant and calculated from the feed.
Table 2. KHCOOH and Kw from 523.15 to 563.15 K.
| T/K | 1012·Kw/(mol/L)2 | 105·KHCOOH/(mol/L)2 | 109·Kw/(KHCOOH)0.5 | deviationa/% |
|---|---|---|---|---|
| 523.15 | 5.49 | 1.31 | 1.52 | 0.29 |
| 533.15 | 5.20 | 1.10 | 1.57 | 3.49 |
| 543.15 | 4.78 | 0.93 | 1.57 | 3.51 |
| 553.15 | 4.24 | 0.78 | 1.51 | –0.01 |
| 563.15 | 3.61 | 0.66 | 1.40 | –7.27 |
 .
.  represents the average value of
  from 523.15 to 563.15 K.
The cross-disproportionation of formaldehyde with formic acid (R2) was regarded as an elementary reaction, which is consistent with the literature.9,10,12
| 15 |
where r2 is the reaction rate of R2 and k2 is the rate constant.
Mei et al.5 listed the synthesis process of HB catalyzed by HCOOH via a set of elementary steps, and the reaction orders of formic acid in HB formation (R3) and MVK formation (R4) were 0.5 in their work.
| 16 |
| 17 |
where r3 and r4 are the reaction rates of R3 and R4, respectively, and k3 and k4 are the rate constants of R3 and R4, respectively.
The reaction rates of all reactants and products are presented below according to eqs 13–17.
 |
18 |
| 19 |
| 20 |
| 21 |
| 22 |
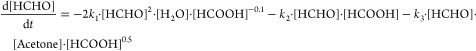
The concentration data/mol·L–1 were calculated with the densities listed in Table 1. Rate constants, as listed in Table 3, were regressed via lsqnonlin function in Matlab with the data at various temperatures in Section 3.4. Activation energies and pre-exponential factors were regressed according to Arrhenius equation. The R2 of all fitting lines between ln (k) and 1/T were above 0.99 as shown in Figure 5.
Table 3. Rate Constants from 523.15 to 563.15 K.
| T/K | k1/(mol–1.9 L1.9 min–1) | k2/(mol–1 L1 min–1) | k3/(mol–1.5 L1.5 min–1) | k4/(mol–0.5 L0.5 min–1) |
|---|---|---|---|---|
| 523.15 | 0.073 | 1.586 | 0.964 | 0.169 |
| 533.15 | 0.105 | 2.540 | 1.416 | 0.263 |
| 543.15 | 0.148 | 3.918 | 2.034 | 0.412 |
| 553.15 | 0.222 | 6.107 | 3.025 | 0.642 |
| 563.15 | 0.271 | 8.005 | 3.944 | 1.006 |
Figure 5.
Relationship between k1, k2, k3, k4, and 1/T. (A): ln (k)–(1/T) plot for the disproportionation of formaldehyde. (B): ln (k)–(1/T) plot for the cross-disproportionation of formaldehyde with formic acid. (C): ln (k)–(1/T) plot for the generation reaction of HB. (D): ln (k)–(1/T) plot for the generation reaction of MVK.
The activation energies for R1 to R4 are 82.5, 100.9, 87.7, and 109.2 kJ/mol, respectively. The pre-exponential factors for R1 to R4 are 1.28 × 10⁷ mol–1.9 L1.9 min–1, 1.95 × 10¹⁰ mol–1 L1 min–1, 5.49 × 10⁸ mol–1.5 L1.5 min–1, and 1.33 × 10¹⁰ mol–0.5 L0.5 min–1, respectively.
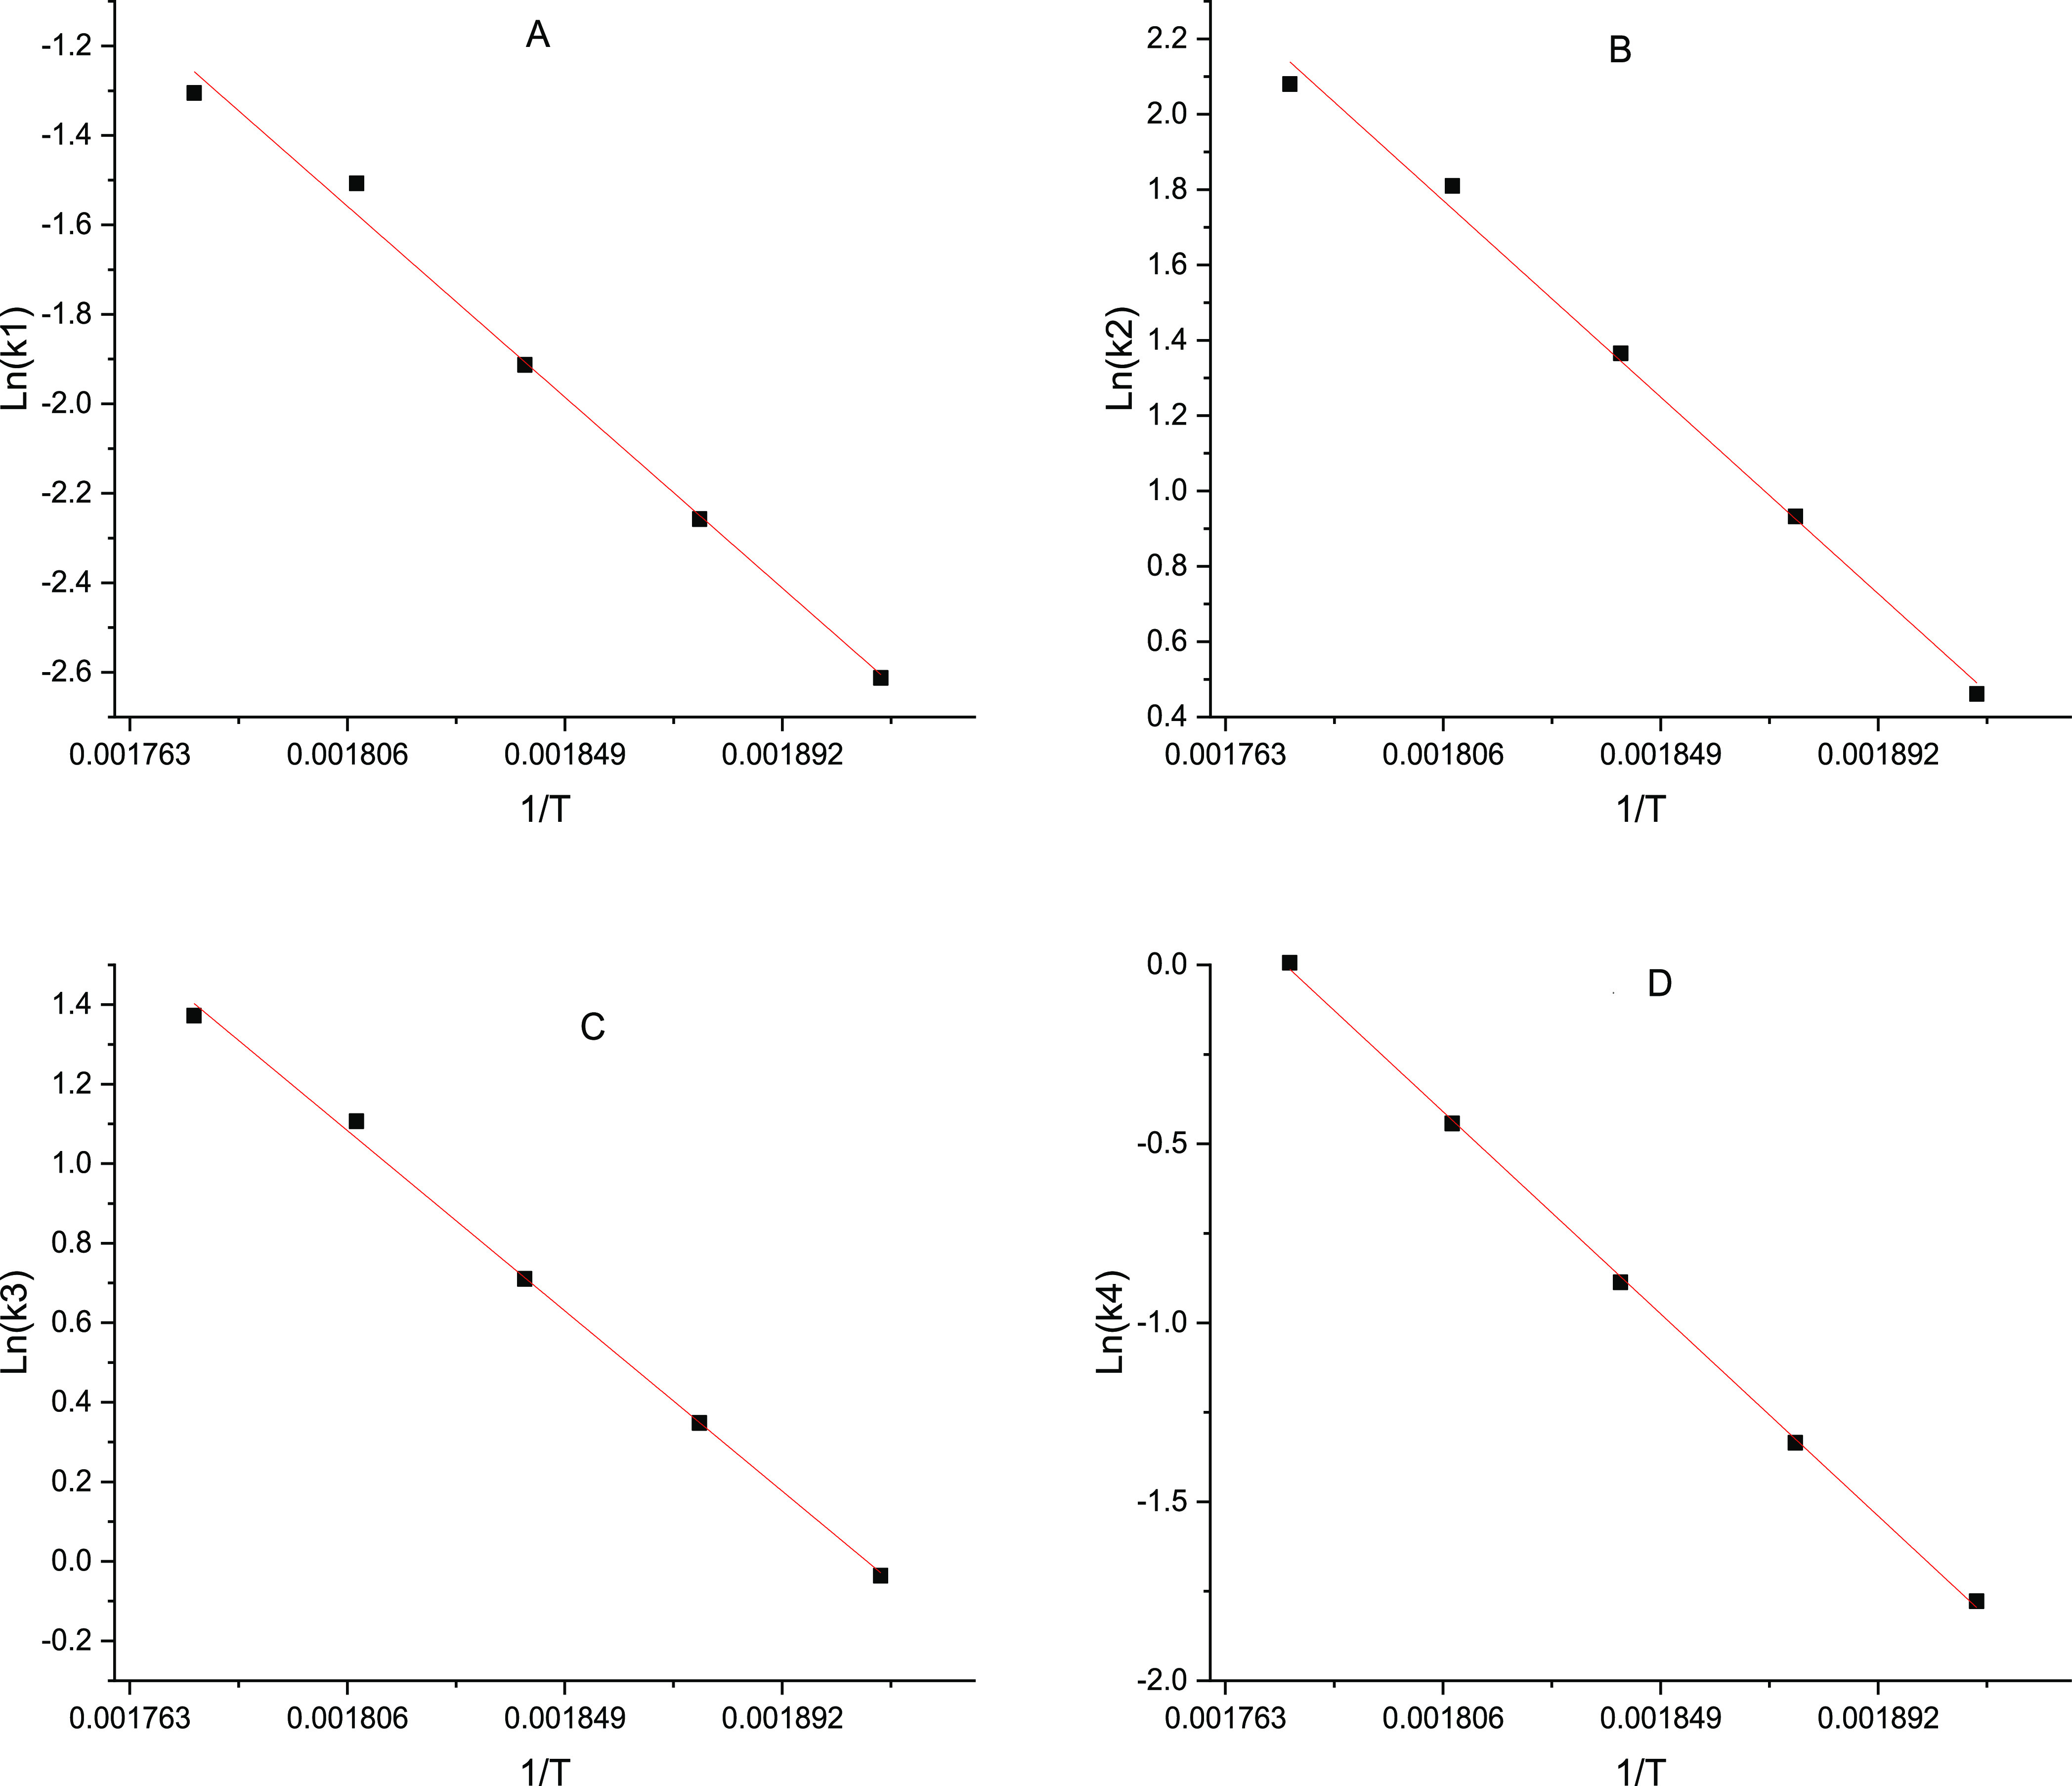
To verify the accuracy of the kinetic model, Figure 6 shows the comparison between simulated concentrations and experimental concentrations with different reaction temperatures, different initial formaldehyde mass fractions, and different initial formic acid mass fractions. The absolute average related deviations (AARDs) of all substances were calculated via eq 23.
| 23 |
where n is the number of total experiment points, Csim is the simulated concentration, and Cexp is the experimental concentration.
Figure 6.
Absolute relative deviation between simulation and experiment concentrations of all substances. (A) Data with different reaction temperatures. AARDs of formaldehyde, methanol, formic acid, HB, and MVK are 3.61, 1.81, 1.93, 2.78, and 4.54%. (B) Data with different initial formic acid mass fractions. AARDs of formaldehyde, methanol, formic acid, HB, and MVK are 5.26, 2.46, 2.44, 2.16, and 4.41%. (C) Data with different initial formaldehyde mass fractions. AARDs of formaldehyde, methanol, formic acid, HB, and MVK are 5.61, 3.07, 3.15, 2.13, and 5.38%.
The results in Figure 6A with different reaction temperatures indicate that the activation energies and pre-exponential factors regressed are accurate. The results in Figure 6B with different initial formic acid mass fractions indicate that the reaction order of formic acid in eq 13 is appropriate. The results in Figure 6C with different initial formaldehyde mass fractions indicate that the reaction orders of formaldehyde in all rate equations are appropriate. In a word, the kinetic model suggested in this paper is successful to describe the supercritical synthesis of HB from 523.15 K to 563.15 K and 17 MPa.
4. Discussion
4.1. Effects of Operation Conditions on the Percentage of Formaldehyde Consumed by R1 and R2
In this section, the effects of initial formic acid concentrations, initial formaldehyde concentrations, and temperatures on the self-disproportionation (R1) and cross-disproportionation (R1) of formaldehyde were further discussed. The ratios of formaldehyde consumed by side reactions (R1 and R2) were calculated by eqs 24–27 using the data in Section 3.2 to Section 3.4 with a precondition that methanol was chemically stable and did not decompose.
| 24 |
| 25 |
| 26 |
| 27 |
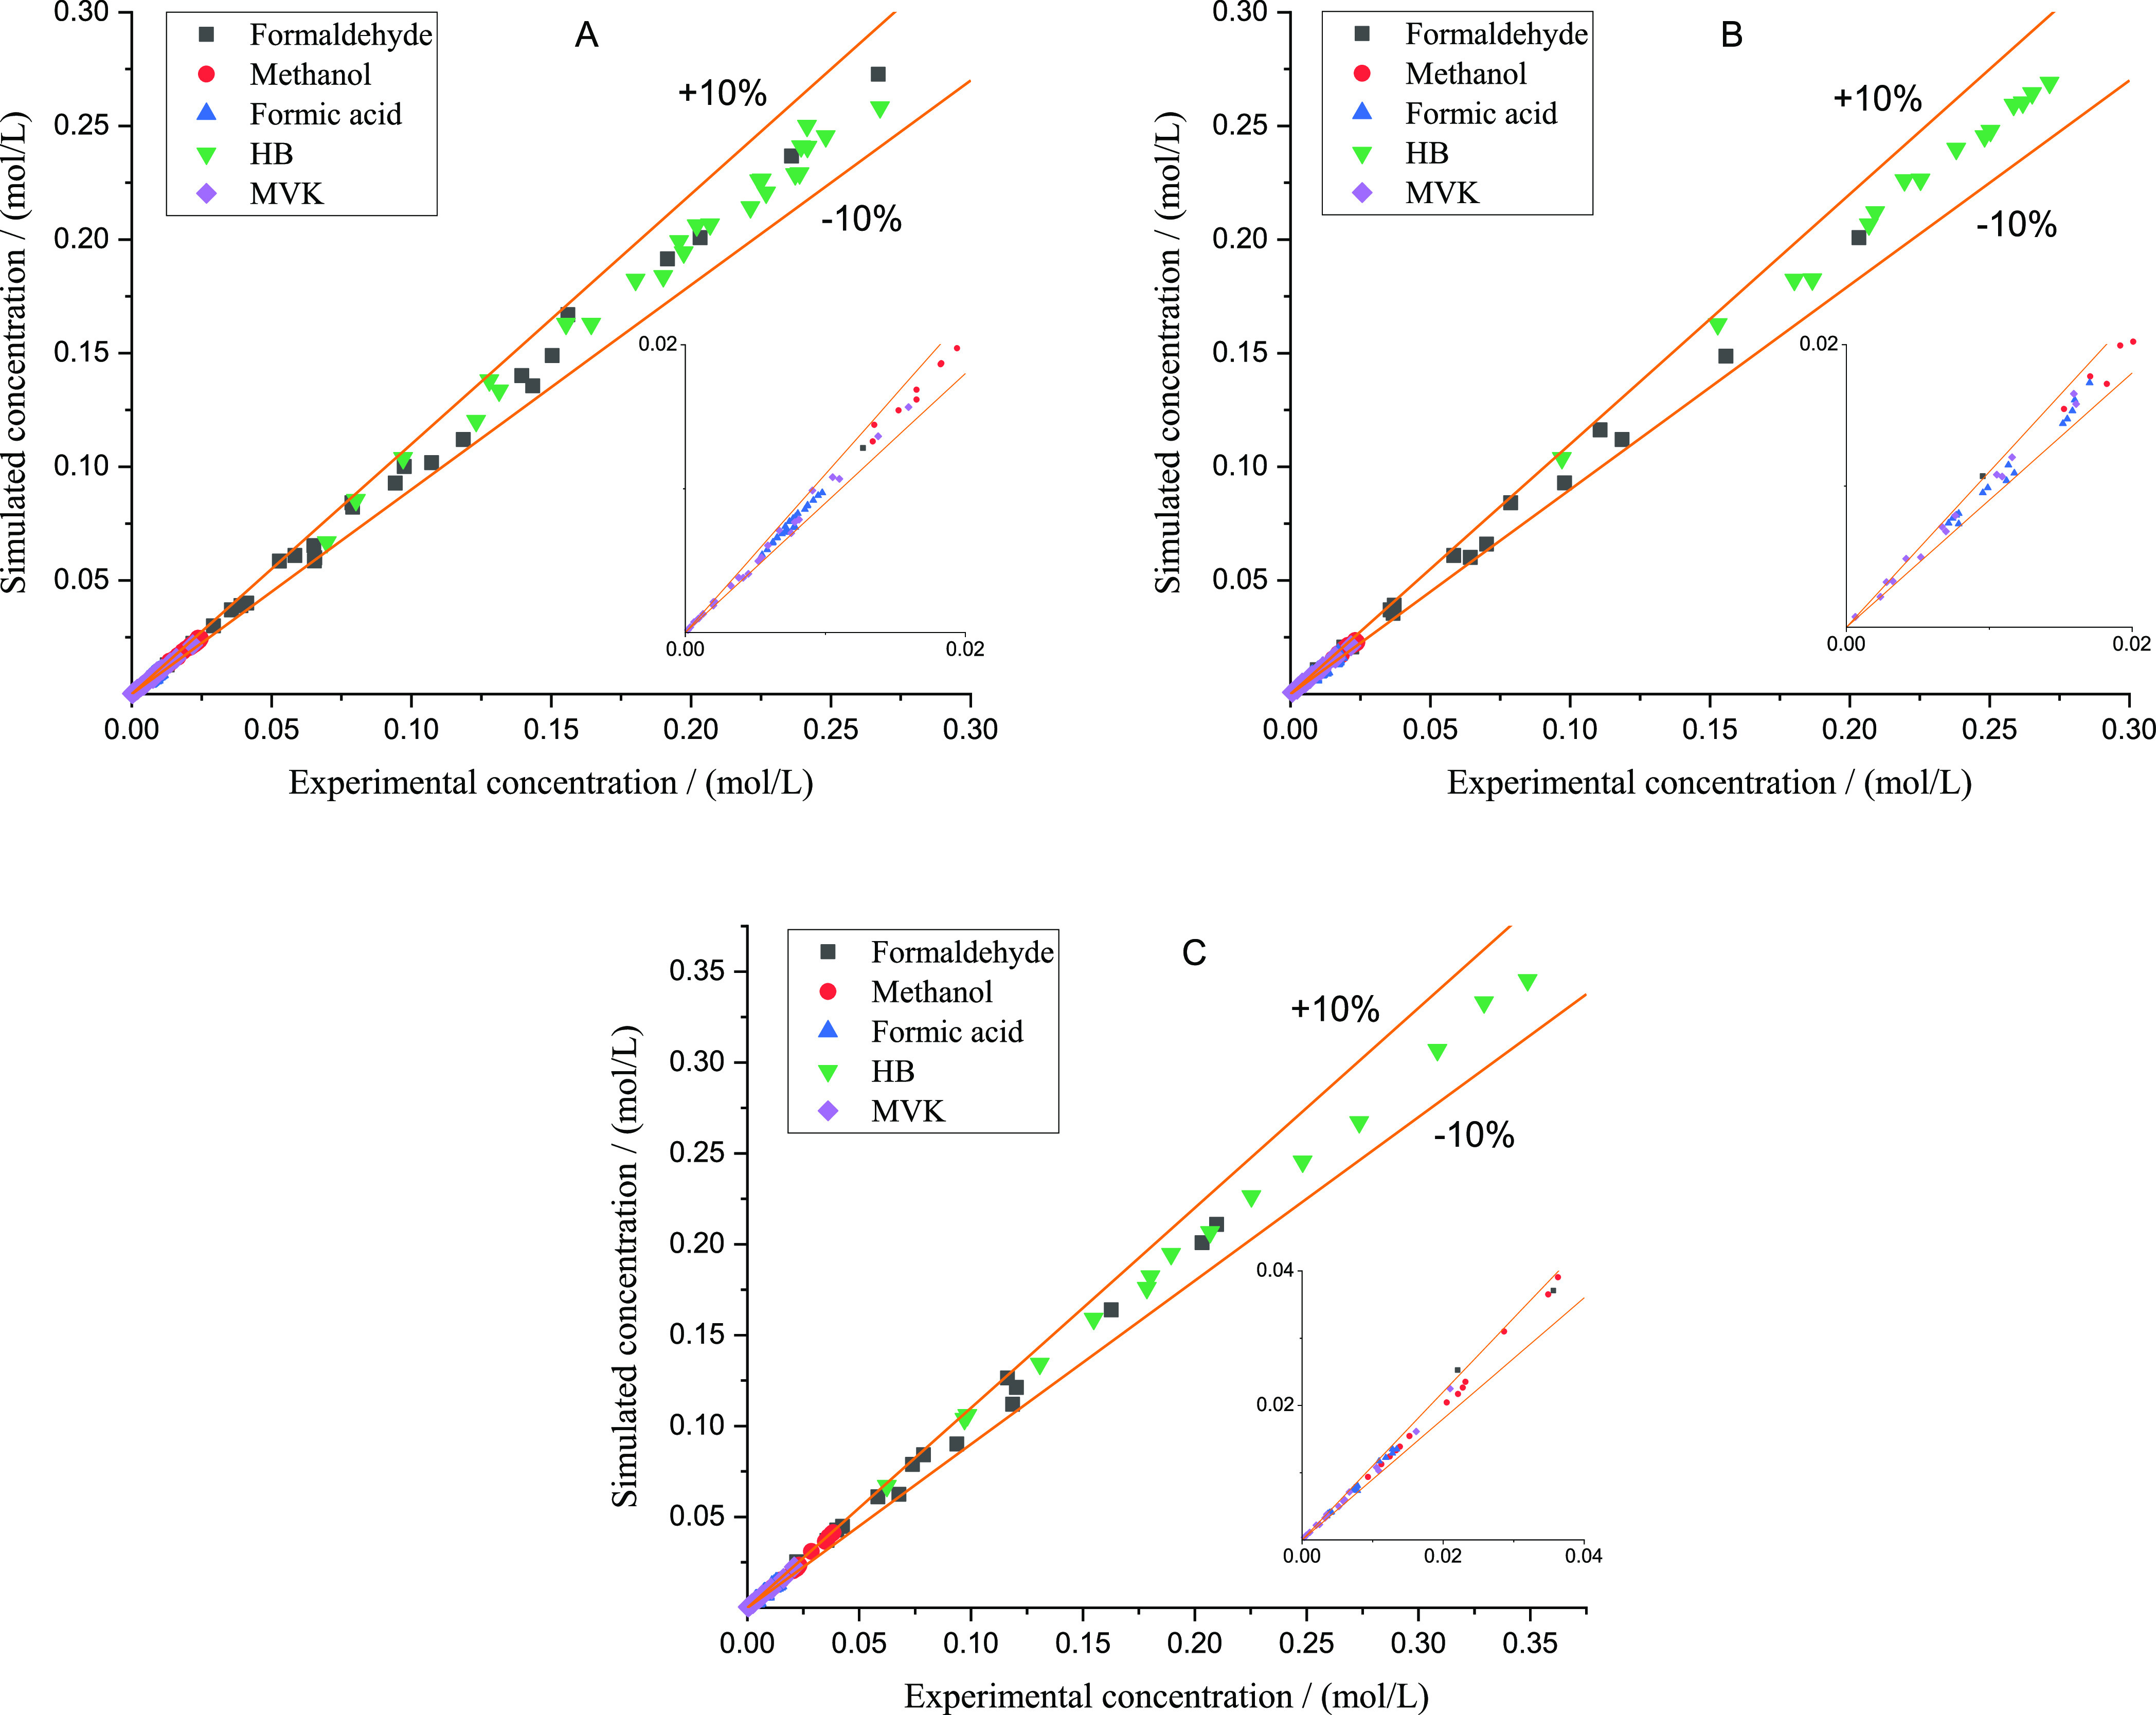
where f1 and f2 are the ratios of formaldehyde consumed by R1 and R2. [HCOOH]r and [CH3OH]r are the concentration changes of formic acid and methanol during the reactions. [HCOOH]0, [CH3OH]0, and [HCHO]0 are the initial concentrations of formic acid, methanol, and formaldehyde in the feed. [HCOOH] and [CH3OH] are the concentrations of formic acid and methanol in the reaction solution. Figure 7 provides the percentages of formaldehyde consumed by R1 and R2 at different operation conditions.
Figure 7.
Percentages of formaldehyde consumed by R1 and R2 at various operation conditions. (A) Percentages of formaldehyde calculated with different initial formic acid concentrations. (B) Percentages of formaldehyde calculated with different initial formaldehyde concentrations. (C) Percentages of formaldehyde calculated with different reaction temperatures.
Figure 7A provides the ratio of formaldehyde consumed by R1 and R2, while the formic acid mass fractions in the feed were 0, 0.11 and 0.22%. It is obvious that the self-disproportionation of formaldehyde (R1) consumed less formaldehyde with higher initial formic acid concentration. The result indicated that formic acid had the ability to suppress R1, which also proved that the negative reaction order of formic acid in eq 13 was appropriate. Meanwhile, the cross-disproportionation of formaldehyde (R2) consumed more formaldehyde with higher initial formic acid concentration, which indicated the necessity of the limit on the initial formic acid concentration. From the view of the yield of HB and MVK, artificially adding formic acid in an appropriate range was beneficial because the total ratio of formaldehyde consumed by R1 and R2 went down with more formic acid in the feed.
Figure 7B provides the ratio of formaldehyde consumed by R1 and R2, while the mass ratios of acetone to formaldehyde aqueous solution were 10:1, 15:1, and 20:1 in the feed. Both R1 and R2 were promoted. The total ratio of formaldehyde consumed by R1 and R2 with the mass ratio of 10:1 was almost twice as large as that with the mass ratio of 20:1. The result indicated that the self-disproportionation of formaldehyde (R1) and the cross-disproportionation of formaldehyde with formic acid (R2) were more sensitive to the formaldehyde concentration than the generation reactions of HB (R3) and MVK (R4). The increase of formaldehyde in the feed was harmful to the yield of HB and MVK. Besides, the ratio of formaldehyde consumed by R1 was much bigger than that consumed by R2. Thus, for the yield of HB and MVK, the limit on R1 was comparatively more effective than that on R2.
Figure 7C provides the ratio of formaldehyde consumed by R1 and R2 when the temperatures were 523.15 to 563.15 K. All data points intertwined with each other. It seemed that the reaction temperature had nonsignificant effect on the yield of HB and MVK.
In a word, the ratio of formaldehyde consumed by R1 was suppressed by artificially adding formic acid and promoted by increasing the initial formaldehyde concentration; the ratio of formaldehyde consumed by R2 was promoted by both artificially adding formic acid and increasing the initial formaldehyde concentration; the yield of HB and MVK increased with artificially adding formic acid in an appropriate range and decreased with higher initial formaldehyde concentration.
4.2. Discussion on the Self-Disproportionation of Formaldehyde
In Kruse et al.’s kinetic model,9 the self-decomposition of formaldehyde (R1) known as Cannizzaro reaction was regarded as an elementary reaction, and the concentration of formic acid was not contained. To verify the effect of formic acid reaction orders, the rate constants of R1 with formic acid reaction orders ranging from 0 to −0.5 were regressed, as shown in Table 4, using data with different initial formaldehyde concentrations in Section 3.3.
Table 4. Comparison of Formic Acid Reaction Order.
| rate constants
at various mass ratios |
||||
|---|---|---|---|---|
| HCOOH orders | 1:10 | 1:15 | 1:20 | RSDa/% |
| 0 | 0.239 | 0.258 | 0.28 | 6.6 |
| –0.1 | 0.145 | 0.149 | 0.151 | 1.6 |
| –0.2 | 0.089 | 0.086 | 0.081 | 3.5 |
| –0.3 | 0.055 | 0.05 | 0.044 | 8.4 |
| –0.4 | 0.034 | 0.03 | 0.024 | 13.2 |
| –0.5 | 0.021 | 0.017 | 0.013 | 18 |
 , and kaverage was the
average value of rate constants.
, and kaverage was the
average value of rate constants.
The relative standard deviation of k1 with the formic acid order of 0 was almost 4 times that with the formic acid order of −0.1, which indicated that formic acid concentration should be considered. In addition, RSD was the smallest when the order of hydroxide ion was −0.1, which indicated that the order of −0.1 was comparatively appropriate. On the basis of our work, it was possible that the reaction rate of the self-disproportionation of formaldehyde (R1) was also controlled by formic acid concentration except concentrations of formaldehyde and water. Herein, the whole process of R1 recurred according to the kinetic model proposed. At the beginning of the reaction, almost no formic acid existed, and the reaction rate was fast. As the reaction went on, formic acid was produced quickly and suppressed the reaction rate. Note that the increase of formic acid concentration and the decrease of the reaction rate happened in a very short time, and 0.5 min was enough for the change in our case. Along with the generation of formic acid, the cross-disproportionation of formaldehyde with formic acid (R2) took place. As time went on, under the influence of R1 and R2, the concentration of formic acid remained almost constant, and the suppression of the self-disproportionation kept stable too. So, if the self-disproportionation of formaldehyde was regarded as an elementary reaction, either the reaction rate at the beginning was underestimated or the reaction rate far away from the beginning was overvalued. However, if a long-time reaction was conducted, possibly, only the data far away from the beginning of the reaction would be collected, and the change of reaction rate caused from formic acid would be ignored. Different from batch reactors used in the literature,9−12,17 a continuous pipe reactor was employed to control the reaction time within 2.5 min due to the fast aldol condensation reaction of acetone and formaldehyde, which meant that the last experimental point in our work may be the first experimental point in others’ work. The data in this paper were more sensitive to the change. Due to limits of the apparatus like the max flow rate of HPLC pumps, the minimum residence time was around 0.5 min. If more data could be got within 0.5 min, the kinetic model in this paper would be better examined.
Hydrogen ions generated from ionization of formic acid might be the reason for the suppression effect of formic acid. As far as our research, it was considered that the disproportionation of formaldehyde took place in two ways, as shown in Figure 8, during the synthesis of HB.
Figure 8.

Two reaction paths of disproportionation of formaldehyde.
Chandrasekhar and Srimannarayana21 proposed the first path. It was the reaction mechanism of Cannizzaro reaction which occurred via the initial addition of hydroxide ions to the aldehydes at room temperature and pressure. Morooka et al.10 proposed the second path. It was believed by them that disproportionation reactions could take place between HCHO and CH2(OH)2 automatically under supercritical state without any catalyst. The addition of formic acid can bring a large amount of hydrogen ions which can inhibit the ionization of water. As a result, the free hydroxide ions in the reaction solution decrease, and the first reaction path of Cannizzaro reaction is suppressed. The two-path reaction mechanism also provided an explanation of the reaction order in formic acid. The orders in hydroxide ions in the first and second paths were 1 and 0, respectively. In the macro reaction kinetics study, the reaction order of the specific reactant should be determined by the combination of all relevant elementary reactions. In such a situation, the total order in hydroxide ions was between 0 and 1. If the concentration of the hydroxide ion was replaced by the concentration of HCOOH, the total order in HCOOH would be between −0.5 and 0.
5. Conclusions
The side reactions involving formaldehyde during the supercritical HB synthesis were studied in this paper. The main consumption of formaldehyde included aldol reaction with acetone and self-disproportionation and cross-disproportionation with formic acid. The cross-disproportionation between formaldehyde and formic acid was also the main consumption of formic acid. A detailed reaction pathway was provided. The effects of the initial concentration of formic acid and formaldehyde in the feed on the yield of HB were studied. It turned out that artificially adding formic acid in an appropriate range was useful in promoting the yield of HB, and increase of formaldehyde in the feed had the opposite influence. A kinetic model containing both main and side reactions involving formaldehyde was suggested. The activation energy and pre-exponential factor were regressed according to Arrhenius equation. The relative deviations of all substances’ concentrations between the simulated and experiment data were within 10%.
Acknowledgments
The authors thank the staff in Zhejiang NHU Company Ltd. for providing the experiment apparatus and reagents.
The authors declare no competing financial interest.
References
- Yoshizawa S.; Nishikawa M.. 4-Hydroxy-2-butanone prepd. by reacting acetone with formaldehyde: Japan, JPS52128311A [P]. Nov 11, 1985. [Google Scholar]
- Wang G.; Cai G. Steric hindrance effect and kinetic investigation for ionic liquid catalyzed synthesis of 4-hydroxy-2-butanone via aldol reaction. Chem. Eng. Sci. 2021, 229, 116089. 10.1016/j.ces.2020.116089. [DOI] [Google Scholar]
- Tanner R.; Gill P.; Wells R.; Bailie J. E.; Kelly G.; Jackson S. D.; Hutchings G. J. Aldol condensation reactions of acetone and formaldehyde over vanadium phosphate catalysts: Comments on the acid–base properties. Phys. Chem. Chem. Phys. 2002, 4, 688–695. 10.1039/b108794k. [DOI] [Google Scholar]
- Abudour A. M.; Mohammad S. A.; Robinson R. L.; Gasem K. A. M. Volume-translated Peng–Robinson equation of state for saturated and single-phase liquid densities. Fluid Phase Equilib. 2012, 335, 74–87. 10.1016/j.fluid.2012.08.013. [DOI] [Google Scholar]
- Mei J.; Mao J.; Chen Z.; Yuan S.; Li H.; Yin H. Mechanism and kinetics of 4-hydroxy-2-butanone formation from formaldehyde and acetone under supercritical conditions and in high-temperature liquid-phase. Chem. Eng. Sci. 2015, 131, 213–218. 10.1016/j.ces.2015.03.025. [DOI] [Google Scholar]
- Huang G.; Lv G.; Liu H. Non-catalytic Synthesis of 4-hydroxy-2-butanone in Supercritical Conditions. Guangzhou Chem. Ind. 2013, 16, 91–92. 10.3969/j.issn.1001-9677.2013.16.035. [DOI] [Google Scholar]
- X Z.; J C.; M J. Thermodynamic Analysis for Synthesis of 4-hydroxy-2-butanone from Acetone and formaldehyde. Chem. World 2014, 12, 713–716. [Google Scholar]
- Mestres R. A green look at the aldol reaction. Green Chem. 2004, 6, 583–603. 10.1039/b409143b. [DOI] [Google Scholar]
- Akgül G.; Kruse A. Hydrothermal disproportionation of formaldehyde at subcritical conditions. J. Supercrit. Fluids 2013, 73, 43–50. 10.1016/j.supflu.2012.11.007. [DOI] [Google Scholar]
- Morooka S.; Matubayasi N.; Nakahara M. Kinetic Study on Disproportionations of C1 Aldehydes in Supercritical Water: Methanol from Formaldehyde and Formic Acid. J. Phys. Chem. A 2007, 111, 2697–2705. 10.1021/jp066785y. [DOI] [PubMed] [Google Scholar]
- Osada M.; Watanabe M.; Sue K.; Adschiri T.; Arai K. Water density dependence of formaldehyde reaction in supercritical water. J. Supercrit. Fluids 2004, 28, 219–224. 10.1016/s0896-8446(03)00042-1. [DOI] [Google Scholar]
- Watanabe M.; Osada M.; Inomata H.; Arai K.; Kruse A. Acidity and basicity of metal oxide catalysts for formaldehyde reaction in supercritical water at 673 K. Appl. Catal., A 2003, 245, 333–341. 10.1016/s0926-860x(02)00656-7. [DOI] [Google Scholar]
- Kolah A. K.; Sharma M. M. Removal of formaldehyde from aqueous solutions. Sep. Technol. 1995, 5, 13–22. 10.1016/0956-9618(94)00100-7. [DOI] [Google Scholar]
- Z Y. Determination of formaldehyde in vegetables by acetylacetone spectrophotometry. Occup. Health 2012, 28, 3094–3096. [Google Scholar]
- Backe W. J. A novel mass spectrometric method for formaldehyde in children’s personal-care products and water via derivatization with acetylacetone. Rapid Commun. Mass Spectrom. 2017, 31, 1047–1056. 10.1002/rcm.7874. [DOI] [PubMed] [Google Scholar]
- David R. L.CRC Handbook of Chemistry and Physics, 90th ed.; Academic Press, CRC Press, 2009; p 12862. [Google Scholar]
- Tsujino Y.; Wakai C.; Matubayashi N.; Nakahara M. Noncatalytic Cannizzaro-type Reaction of Formaldehyde in Hot Water. Chem. Lett. 1999, 28, 287–288. 10.1246/cl.1999.287. [DOI] [Google Scholar]
- Chung M.; Moon D.; Park K.; Ihm S. Mechanism of methyl formate formation on Cu/ZnO catalysts. J. Catal. 1992, 136, 609–612. 10.1016/0021-9517(92)90091-u. [DOI] [Google Scholar]
- Marshall W. L.; Franck E. U. Ion product of water substance, 0–1000 °C, 1–10,000 bars New International Formulation and its background. J. Phys. Chem. Ref. Data 1981, 10, 295–304. 10.1063/1.555643. [DOI] [Google Scholar]
- Kim M. H.; Kim C. S.; Lee H. W.; Kim K. Temperature dependence of dissociation constants for formic acid and 2,6-dinitrophenol in aqueous solutions up to 175 °C. J. Chem. Soc., Faraday Trans. 1996, 92, 4951–4956. 10.1039/ft9969204951. [DOI] [Google Scholar]
- Chandrasekhar S.; Srimannarayana M. New Approaches to the Cannizzaro and Tishchenko Reactions. Synth. Commun. 2009, 39, 4473–4478. 10.1080/00397910902916049. [DOI] [Google Scholar]