

Abstract
Secondary organic matter (SOM) formed from gaseous precursors constitutes a major mass fraction of fine particulate matter. However, there is only limited evidence on its toxicological impact. In this study, air–liquid interface cultures of human bronchial epithelia were exposed to different series of fresh and aged soot particles generated by a miniCAST burner combined with a micro smog chamber (MSC). Soot cores with geometric mean mobility diameters of 30 and 90 nm were coated with increasing amounts of SOM, generated from the photo-oxidation of mesitylene and ozonolysis of α-pinene. At 24 h after exposure, the release of lactate dehydrogenase (LDH), indicating cell membrane damage, was measured and proteome analysis, i.e. the release of 102 cytokines and chemokines to assess the inflammatory response, was performed. The data indicate that the presence of the SOM coating and its bioavailability play an important role in cytotoxicity. In particular, LDH release increased with increasing SOM mass/total particle mass ratio, but only when SOM had condensed on the outer surface of the soot cores. Proteome analysis provided further evidence for substantial interference of coated particles with essential properties of the respiratory epithelium as a barrier as well as affecting cell remodeling and inflammatory activity.
Keywords: aerosol, soot, secondary organic matter, oxidation flow reactor, bronchial epithelial cells, air−liquid interface exposure, cytotoxicity, pro-inflammatory cytokines
Short abstract
Atmospheric aerosols undergo continuous temporal and spatial variations, which makes it difficult to identify metrics dominating the onset of detrimental health effects. Our research delineates novel experimental procedures to allocate specific particulate matter constituents to specific health outcomes.
Introduction
Atmospheric particulate pollution has been linked to a broad spectrum of adverse health effects, such as respiratory and cardiovascular diseases, lung cancer, and dementia.1−8 Atmospheric aerosols vary significantly in their composition and size distribution. Due to this complexity and their continuous temporal and spatial variations, it has been impossible to clearly identify which metric(s) dominate the etiology and progression of detrimental health effects.9−11 Atmospheric aerosols have been regulated for human health purposes by the mass concentration of the size fractions, for example, PM10 (particulate matter with aerodynamic diameter below 10 μm) and PM2.5 (particulate matter with aerodynamic diameter below 2.5 μm, generally described as fine particles, European Parliament Directive 2008/50/EC). This metric, which is used in most epidemiologic studies, is suitable to capture the effects of large particles with considerable mass but cannot account for the effects of ultrafine particles (UFP, particulate matter with aerodynamic diameter ≤100 nm), which only negligibly contribute to the total aerosol mass concentration of ambient air. Therefore, it has been suggested that PM mass concentration, while useful, is not the most informative metric to characterize the potential of particles to cause the detrimental health effects reported.
Additional air-quality metrics, such as particle number concentration, oxidative potential, and chemical composition, have been proposed to disentangle the health effects of combustion particles,9,12−14 the mass of which is too small to be efficiently regulated by mass-based metrics. Several studies show that fresh and mature diesel exhaust soot and carbon black soot model particles strongly produce reactive oxygen species and are genotoxic.15−17 There is also growing information on the association of organic carbon fractions with health effects.13,17−20 Organic carbon primary gas-phase emissions contribute to the formation of secondary organic matter, an important constituent of the PM2.5 mass.21 Studies indicate adverse health impacts arise from PM emissions containing carbonaceous material, yet it has been impossible to clearly apportion responses to specific types of carbonaceous materials, e.g., organic versus elemental carbon, and primary versus secondary organic material.18
Moreover, with the establishment of air–liquid interface (ALI) cultures of redifferentiated human bronchial epithelia (HBE),22 suitable in vitro models for respiratory research have become available. HBE cultures can be set up from cells of normal human donor lungs or donors with pre-existing pulmonary disease like asthma, chronic obstructive pulmonary disease, or cystic fibrosis, enabling health effect studies in the vulnerable population.23 In addition, in vitro technology to study respiratory effects from aerosol particles has greatly increased with the development of cell exposure chambers mimicking particle inhalation, i.e., allowing deposition of particles directly out of a continuous air flow.24
In this study, we combined the generation of well-controlled and chemically defined synthetic reference aerosols with state-of-the-art cell cultures, particle exposure, and analysis to identify specific aerosol properties adversely affecting respiratory health. By combining a miniCAST combustion generator25,26 with a micro smog-chamber,27−29 a series of “fresh” soot particles with high elemental carbon (EC) mass fraction were produced. Subsequently, soot was coated with controlled amounts of secondary organic matter (SOM) from the oxidation of α-pinene and mesitylene. The physicochemical properties and morphology of the reference aerosols were characterized with an array of methods, including aerosol mass spectrometry (AMS), gas chromatography–mass spectrometry (GC-MS), and cryogenic transmission electron microscopy (cryo-TEM). ALI cultures of normal HBE were exposed to the different reference aerosols using the Nano Aerosol Chamber for In-Vitro Toxicity (NACIVT), allowing realistic delivery of (nano)particles out of a conditioned air-flow to the apical surface of ALI cell cultures.30 We evaluated cytotoxicity and release of pro-inflammatory mediators at 24 h after exposure to the aerosols.
Materials and Methods
Aerosol Generation
Soot particles were generated with a miniCAST 5201 Type BC (Jing Ltd., Switzerland) combustion generator as described in detail previously.25,26 The miniCAST was operated in the “premixed flame mode” under fuel lean conditions to maximize the elemental carbon to total carbon (EC/TC) mass fraction of the soot particles. After drying (diffusion dryer with silica gel spheres), the 90 nm soot aerosol was diluted with dry, particle-free air (VKL 10 dilution unit, Palas GmbH, Germany) by a factor of 10, resulting in 5% relative humidity (RH). The 30 nm soot aerosol was not diluted. For experiments at higher humidity, the aerosol was passed through a custom-made Nafion humidifier (GoreTex© membrane, U.S.A., in a glass bottle filled with water), resulting in 60–75% RH. The aerosol humidity was measured with a digital humidity sensor (FHAD 46 series/Almemo D6, Ahlborn, Germany). Amicro smog-chamber (MSC, model with two quartz tubes)27 was used to simulate atmospheric aging of soot particles as described elsewhere.28 Briefly, soot particles were mixed with gas phase α-pinene (≥97% purity, Sigma-Aldrich, Switzerland) or mesitylene (1,3,5-trimethylbenzene, 98% purity, Sigma-Aldrich), which served as a surrogate for biogenic and anthropogenic SOM precursor, respectively. The α-pinene is one of the most significant monoterpenes which, together with isoprene, are of great importance for atmospheric chemistry.31 Mesitylene is an important anthropogenic VOC, released in the atmosphere through biomass and coal burning, use of solvents in industry, and diesel and (to a lesser extent) gasoline exhaust.32 The VOC concentration was controlled by adjusting the flow of zero-air through the VOC container (cylindrical gas bubbler) using a mass flow controller (V-red-y Compact with hand valve, 1–100 mL/min, Vögtlin, Switzerland). In the MSC, the α-pinene or mesitylene vapors were oxidized by OH and/or O3 radicals, yielding SOM, part of which condensed on the soot particles as coating.28 More specifically, ozonolysis of α-pinene was performed under dry conditions (5% relative humidity), while oxidation of mesitylene by O3 and OH radicals was performed under humid conditions (60–75% RH). In this study, only four out of five UVC lamps (4 W UVC with 254 and 185 nm emission lines) were used, leading to a maximum O3 concentration of 120 mg/m3. The UVA lamp located above the second quartz chamber in the MSC was switched off. The setup for coating a particle with SOM has been automated and miniaturized after this study through a novel system called an organic coating unit (OCU33).
Aerosol Monitoring and Characterization
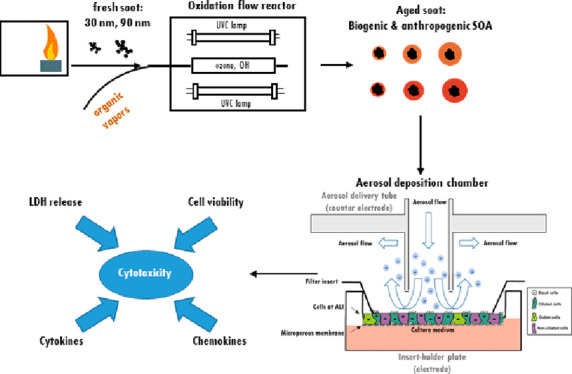
Figure 1 shows a schematic illustration of the experimental setup. The setup and the methods used to characterize the aerosols are similar to what we reported previously.28 In path (a), the aerosol was diluted by a factor of 30–40 with a rotating disc diluter (MD19-1i, Matter Engineering, Switzerland) directly after the MSC. The rotating disc diluter also ensured a constant aerosol flow (1.2 L/min) through the MSC and exchanged the gas phase with dry filtered pressurized air, thus, reducing the amount of water and VOCs from the aerosol. The average residence time of the particles in the MSC was calculated to be approximately 7.6 s, with a 3.8 s residence time in each one of the quartz chambers.28 Subsequently, the aerosol passed through a denuder filled with activated charcoal and a silica gel diffusion dryer to remove any residual gas-phase organics or water. For aerosol characterization before cell exposure, the aerosol was split in four parts and delivered to (i) a scanning mobility particle sizer (SMPS+C with L-DMA, Am-241 neutralizer, CPC model 5.403, Grimm Aerosol Technik, Germany), (ii) an aethalometer (AE33, Magee Scientific, U.S.A.), (iii) a photoacoustic extinctiometer (PAX, 870 nm wavelength, Droplet Measurement Technologies, U.S.A.), and (iv) a tapered element oscillating microbalance (TEOM 1405, Thermo Scientific, U.S.A.), respectively. In path (b), the aerosol was sampled undiluted, after passing through a denuder filled with activated charcoal and a silica gel diffusion dryer, on different filter materials for subsequent analysis. For particle imaging with cryo-TEM (Tecnai F20 G2, FEI, U.S.A.), carbon and Formvar coated TEM grids (S160-4, Agar Scientific Ltd., U.K.) were placed in the NACIVT chamber operated under dry conditions. Particles were collected on the TEM grids during 1 h by means of electrostatic precipitation and thereafter stored in liquid nitrogen until analysis. During cell exposure (path (a) in Figure 1), the aerosol was split in three parts and delivered to the SMPS, TEOM, and NACIVT, to monitor particle size, as well as particle number and mass concentrations parallel to cell exposure (more details on the SMPS and TEOM settings can be found in ref (28)). An OC/EC Analyzer (Lab OC-EC Aerosol Analyzer, Sunset Laboratory Inc., U.S.A.) was used to classify the carbonaceous material as EC and OC using a modified EUSAAR-2 protocol as described elsewhere.28 EC/OC analysis was only performed for 90 nm soot particles and their coated counterparts. Due to the small particle size and therefore low mass concentration of the 30 nm particles, it was not possible to collect enough material on quartz filters for reliable assessment of EC/TC ratios. Optical properties, such as the single scattering albedo (SSA) and Ångström absorption exponent (AAE) were monitored for quality assurance as explained in the Supporting Information (Text S1). Polycyclic aromatic hydrocarbons (PAH) were extracted from the filter samples using an automated Soxhlet extraction (Soxtherm Sox 416 Macro, C. Gerhardt GmbH & Co. KG, Germany) with dichloromethane and analyzed using a gas chromatograph–mass spectrometer (GC-MS, Agilent 6890N and 5973). Aerosol mass spectrometry (AMS) was performed offline using a high-resolution AMS34 operating under default configuration with the vaporizer at 600 °C and using 70 eV electron ionization. Each sample was measured for at least 300 s, with data recorded every 30 s. A dwell time of 7.5 s was used. More information on filter materials, extraction, measurement procedure, and data analysis for EC/OC, GC-MS, and AMS can be found in the Supporting Information (Text S2).
Figure 1.

Schematic illustration of the experimental setup for aerosol characterization and cell exposure in the NACIVT chamber. For experiments with uncoated soot, the oxidation flow reactor was bypassed. During cell exposure, we solely used the instruments connected with solid lines. For aerosol characterization, the additional instruments connected with dotted lines (PAX and AE33) were used.
Cell Cultures, Aerosol Exposure, and Cell Analysis
Normal human bronchial epithelial cells were isolated from lungs deemed unsuitable for transplant. Lungs were donated for research purposes and recovered by the Life Alliance Organ Recovery Agency (LAORA) at the University of Miami. The Institutional Review Board (IRB) declared that consent for organ donation for research covers the use of these cells and no other approval was needed for the here carried out experiments. Cells were collected from the proximal conducting airways, and ALI cultures of redifferentiated HBE were generated as previously described.23,35–37 After approximately 28 days, the cells revealed a pseudostratified ciliated epithelium. Cell morphology, mucus secretion, and ciliary beating were evaluated visually and by phase-contrast light microscopy. Apical cell surfaces were washed with Dulbecco’s phosphate-buffered saline (DPBS, with Ca2+ and Mg2+, Invitrogen, Lucerne, Switzerland) 2 h before exposure. Fully differentiated HBE were exposed to the aerosols in the NACIVT chamber23,24,30), allowing efficient deposition of particles directly out of a conditioned air flow (RH 85–95%, 5% CO2) under physiological conditions (37 °C) onto 24 ALI cell cultures simultaneously. Cell cultures were exposed to the particles for 60 min at comparable aerosol particle number concentrations within one series of aerosols. Apical cell surfaces were washed with DPBS 4 h after aerosol exposure to remove unbound particles. Cell analyses were performed at 24 h after exposure. We conducted at least three independent experiments with each aerosol, with a minimum of triplicate HBE cultures in each experiment. Cytotoxicity was assessed by measuring lactate dehydrogenase (LDH) in apical washes, as previously described.30 The LDH values obtained from cells exposed to either aerosol or particle-filtered (p-free) air were then compared to those of untreated cells (negative control). The p-free air control was carried out by inserting a HEPA filter upstream of the NACIVT chamber; i.e., the cells were exposed to the gas phase of the synthetic aerosols. According to gas phase analysis with the Model 49C Ozone Calibrator (Thermo Scientific, U.S.A.), the ozone amount fractions were lower than 100 ppb throughout the experiment. The NOx amount fraction was measured directly at the miniCAST exhaust with a portable emission analyzer (Model 350, Testo, Germany) and found to be about 2 ppm. The NOx amount fraction in the model aerosols delivered to NACIVT was therefore <70 ppb depending on the aerosol dilution ratio. The inflammatory response was evaluated by measuring the release of 102 cytokines and chemokines from cells by high-throughput screening using the Proteome profiler Human XL Cytokine Array (ARY022, R&D Systems, Minneapolis, MN, U.S.A.).
Data Analysis
The results are presented as mean values ± standard deviation (SD) or standard error of the mean (SEM). Statistical analyses were performed using GraphPad Prism 7.04 (GraphPad Software Inc., San Diego, U.S.A.). Mean values were compared using Multiple comparison one-way ANOVA, Bonferroni’s multiple comparison test with **p < 0.005, ***p < 0.0005, and ****p < 0.0001. The data passed the Brown–Forsythe normality test (alpha = 0.05).
Results and Discussion
We generated six series of model aerosols (Table 1). In series nos. 1–4, soot particles with geometric mean mobility diameter (GMDmob) of 30 or 90 nm were coated with different amounts of SOM from the photo-oxidation of α-pinene or mesitylene. Particles with GMDmob = 90 nm are representative of the main particle size mode (i.e., accumulation mode) of soot emitted by diesel engines.38,39 The smaller size mode of GMDmob = 30 nm covers emissions from other engine operation points, injection technologies, and/or fuels. A review by Giechaskiel and colleagues40 shows that both diesel and petrol engines can emit nonvolatile particles with a count median diameter CMD < 60 nm. Furthermore, petrol, ethanol, and compress natural gas engines have been shown to produce soot particles with modal sizes around 20 to 30 nm for a variety of engine conditions and different fuel injection technologies.41,42 In series no. 5, soot particles coated with SOM from the ozonolysis of α-pinene were generated at three different concentrations to evaluate any dose–response relationship. Finally, in series no. 6, particles consisting of pure SOM (i.e., particles formed by homogeneous nucleation) were generated aiming at “decoupling” the toxic effects of SOM from those of the soot core. Note that the 30 nm soot particles were generated at higher number concentrations than their 90 nm counterparts, enabling mass concentration measurements by TEOM within a reasonable time frame. It is reasonable to assume that changes in toxic effects during coating experiments will mainly come from SOM rather than from oxidation of the core due to several reasons. First, gas phase reactions are much faster than heterogeneous reactions.43 This favors the formation of coating prior to interaction with surface-bound species like PAH, preventing formation of toxic materials like oxy- or nitro-PAH. Furthermore, SOM coating has been shown to protect the particle-bound PAH, reducing their interaction with gas-phase reactive species and lowering the overall particle surface interaction with reactive species.44 Nevertheless, the role of oxy- and nitro-PAH cannot be ruled out.
Table 1. GMDmob, GSDmob (Geometric Standard Deviation), EC/TC Mass Fraction, SOM Mass/Total Particle Mass, Particle Number Concentration Cn, and Total Particle Mass Concentration Cma.
| Series | Labelb | VOC | GMDmob (nm) | GSDmob (−) | EC/TC (%) | C (cm–3) | Cm (μg/m3) | SOM mass/total mass (%)e | Estimated deposition (Ndep/cm2)f | Estimated deposition (ng/cm2) |
|---|---|---|---|---|---|---|---|---|---|---|
| 1 | 90 nm | N/A | 91.5 ± 0.3 | 1.61 | 99 ± 10 | (1.3 ± 0.1) × 105 | 62 ± 1 | 0 | 1.5 × 10⁸ | 53 |
| 1 | c_85 nm | α-pinene | 88.4 ± 0.6 | 1.47 | 54 ± 5 | (1.3 ± 0.1) × 105 | 116 ± 1 | 47 | 1.5 × 10⁸ | 110 |
| 1 | c_100 nm | 103.3 ± 1.5 | 1.34 | 31 ± 3 | (1.3 ± 0.1) × 105 | 173 ± 1 | 64 | 1.4 × 10⁸ | 167 | |
| 1 | c_120 nm | 121.8 ± 2.1 | 1.28 | 26 ± 2 | (1.3 ± 0.1) × 105 | 279 ± 2 | 78 | 1.3 × 10⁸ | 256 | |
| 2 | 90 nm | N/A | 94.3 ± 0.2 | 1.61 | 92 ± 10 | (1.4 ± 0.1) × 105 | 64 ± 1 | 0 | 1.5 × 10⁸ | 54 |
| 2 | c_85 nm | mesitylene | 84.4 ± 0.6 | 1.55 | 74 ± 6 | (1.3 ± 0.1) × 105 | 73 ± 3 | 19 | 1.5 × 10⁸ | 67 |
| 2 | c_100 nm | 102.4 ± 1.7 | 1.37 | 51 ± 4 | (1.3 ± 0.1) × 105 | 154 ± 2 | 61 | 1.4 × 10⁸ | 148 | |
| 2 | c_120 nm | 119.0 ± 0.4 | 1.33 | ≈12c | (1.3 ± 0.1) × 105 | 192 ± 1 | 69 | 1.3 × 10⁸ | 177 | |
| 3 | 30 nm | N/A | 28.7 ± 0.3 | 1.59 | ≈76c | (3.6 ± 0.2) × 105 | 12 ± 3 | 0d | 5.9 × 10⁸ | 16 |
| 3 | c_35 nm | α-pinene | 37.5 ± 0.4 | 1.42 | - | (3.4 ± 0.2) × 105 | 26 ± 1 | 56 | 5.2 × 10⁸ | 35 |
| 3 | c_45 nm | 45.4 ± 0.3 | 1.37 | - | (3.7 ± 0.1) × 105 | 44 ± 1 | 72 | 5.4 × 10⁸ | 57 | |
| 3 | c_50 nm | 51.7 ± 0.6 | 1.33 | - | (3.7 ± 0.1) × 105 | 66 ± 1 | 81 | 5.2 × 10⁸ | 84 | |
| 4 | 30 nm | N/A | 28.6 ± 0.5 | 1.69 | ≈76c | (2.7 ± 0.2) × 105 | 9 ± 2 | 0d | 4.5 × 10⁸ | 12 |
| 4 | c_35 nm | mesitylene | 36.7 ± 0.5 | 1.45 | - | (2.5 ± 0.2) × 105 | 17 ± 1 | 51 | 3.9 × 10⁸ | 23 |
| 4 | c_45 nm | 44.6 ± 0.6 | 1.41 | - | (2.5 ± 0.1) × 105 | 25 ± 1 | 67 | 3.8 × 10⁸ | 32 | |
| 4 | c_50 nm | 50.5 ± 0.3 | 1.41 | 14 ± 3 | (2.9 ± 0.1) × 105 | 38 ± 1 | 74 | 4.1 × 10⁸ | 47 | |
| 5, 1 | c_135 nm | α-pinene | 134.5 ± 2.0 | 1.25 | 17 ± 1 | (1.3 ± 0.1) × 105 | 351 ± 2 | 82 | 1.3 × 10⁸ | 313 |
| 5 | c_135 nm_2 | 135.6 ± 1.6 | 1.25 | - | (6.5 ± 0.1) × 104 | 153 ± 1 | ∼82 | 6.3 × 10⁷ | 136 | |
| 5 | c_135 nm_3 | 135.0 ± 0.9 | 1.25 | - | (3.2 ± 0.1) × 104 | 77 ± 4 | ∼82 | 3.1 × 10⁷ | 69 | |
| 6 | SOM_120 | 120.5 ± 2.7 | 1.56 | ≈0.3 | (1.3 ± 0.1) × 105 | 338 ± 1 | 100 | 1.3 × 10⁸ | 290 | |
| 6 | SOM_116 | 116.4 ± 5.9 | 1.58 | - | (1.0 ± 0.1) × 105 | 287 ± 2 | 100 | 1.0 × 10⁸ | 250 |
The deposited particle number per cm2 of cell culture area (Ndep/cm2) and deposited particle mass per cm2 of cell culture area (ng/cm2) have also been evaluated. Measurement uncertainties correspond to one standard deviation.
Uncoated soot particles are labeled by their nominal mobility diameter, e.g., “90 nm” stands for uncoated soot particles with a nominal GMDmob of 90 mm. Coated soot particles are distinguished by the prefix “c”; e.g., “c_120 nm” refers to coated soot particles with nominal GMDmob of 120 mm. Particles formed by homogeneous nucleation of SOM are labeled as SOM_120 and SOM_116, with the index indicating measured GMDmob.
Indicative value. Because of the low mass of material on the filter, the measurement is subject to high uncertainty.
Soot particles with GMDmob of 30 nm contain primary organic carbon (POC) from incomplete combustion. POC was not volatile and could not be removed with thermal treatment of the soot aerosol at 300 °C.25,46
Calculated as 100·(Cm,coated – Cm,uncoated)/Cm,coated based on the mass concentrations measured by the TEOM (listed in the eighth column of the table). Whenever the particle number concentrations C of the uncoated and coated particles were not identical (see 7th column of the table), Cm,uncoated was scaled accordingly.
The method to evaluate the number of particles deposited per cm2 of cell culture area is described in the Supporting Information (Text S3).
The deposited mass of particles per surface area of cell culture is also reported in Table 1. We can relate this value to an equivalent ambient mass concentration of particles during a determined amount of time using the human tracheobronchial deposition model discussed by Miller and colleagues.45 The doses used in our study correspond to 1 week of exposure to the following ambient concentrations: (i) 17 μg/m3 of uncoated soot to 114 μg/m3 for c_135 nm, the maximum coating of series no. 1; (ii) 18 μg/m3 of uncoated soot to 61 μg/m3 for c_120 nm, the maximum coating of series no. 2; (iii) 2 μg/m3 of uncoated soot to 16 μg/m3 for c_50 nm, the maximum coating of series no. 3; (iv) 5 μg/m3 of uncoated soot up to 9 μg/m3 for c_50 nm, the maximum coating of series no. 4; and (v) for series no. 5, 106 μg/m3 for SOM_120 and 93 μg/m3 for SOM_116. The mass-based concentrations correspond to medium or high urban soot concentrations. However, due to the small size of the particles, the equivalent ambient number-based concentrations for a one week exposure would be unrealistically high, in all cases of the order of 1010 cm–3. Thus, regarding the particle number, such high doses can only be reached during longer exposure periods.
Uncoated soot particles exhibited a broad size distribution with a geometric standard deviation (GSDmob) of 1.6, a SSA close to 0, and an AAE close to 1 (Table S1). By coating the soot particles with SOM, the GMDmob increased, while the size distribution became narrower (GSDmob dropped to about 1.25, see Table 1 and Figure S1). This is mainly due to SOA condensation making the particle size more uniform and, in the case of 90 nm soot, due to the collapse of the soot cores as revealed by cryo-TEM images (Figure S2). At the same time, the EC/TC mass fraction of the particles decreased from >90% for uncoated soot with GMDmob of 90 nm to about 15% for coated soot with GMDmob of 135 nm, which corresponds to an increase of the percentage of SOM mass/total aerosol mass up to about 80% (Table 1). As expected, the optical properties of the particles changed, with the SSA and AAE increasing to 0.5 and 1.6, respectively (Table S1). This is primarily the result of weakly light-absorbing SOM condensing on strongly light-absorbing BC cores. As discussed by Ess and colleagues, the physical (particle size, effective density) and optical (AAE, SSA) properties, as well as the EC/TC mass fractions of soot, generated by the same setup (i.e., miniCAST burner coupled to the MSC), are within the range observed for ambient combustion aerosols.28 Similar trends were observed for the aerosols with 30 nm soot cores, with the percentage of the SOM mass fraction increasing up to about 80% for the coated particles with GMDmob = 50 nm.
Analysis of soot samples by GC-MS confirmed the presence of PAH, especially of phenanthrene and other semivolatile 3- or 4-ring PAH. Usually in ambient air samples, semivolatile 3- and 4-ring PAH concentrations are at the same level as less volatile 5- and 6-ring PAH concentrations.47,48 The results are presented in Table S2 as percentage of PAH mass to total soot mass on the filter (% w/w). The 90 nm soot particles have a very low PAH content of 0.034% (w/w), in agreement with the very high EC/TC mass fraction (Table 1). The 30 nm soot particles have a higher PAH mass fraction of 0.487% (w/w). Please note that GC-MS analysis of PAH was performed on undiluted aerosol samples (see Figure 1). Part of the volatile 3-ring PAH might evaporate during aerosol dilution before being injected into the NACIVT chamber.
To gain better insight into the chemical composition, we analyzed selected model aerosols (Table 1, series nos. 1 and 6) by aerosol mass spectrometry regarding atomic ratios (oxygen to carbon O/C, hydrogen to carbon H/C) and the ratio of water-soluble organic mass (WSOM) to water-soluble organic carbon (WSOC). For quality assurance and to evaluate the reproducibility of the measurements, we analyzed two filters for each aerosol type. The results are summarized in Table S3, and the fraction f CO2+ is plotted vs f C2H3O+ in Figure S3. The elemental ratios O/C and H/C agree very well with ambient urban organic aerosols (OA) sampled in Mexico City, the Los Angeles area, and other sites,49−52 especially with the oxygenated OA, type OOA-II, previously characterized as surrogate for “fresh” SOM, which exhibited O/C ∼ 0.52–0.64 and OM/OC ∼ 1.83–1.98.49 The H/C ratio of the coated soot aerosols (range 1.68–1.77) is also within the range of the diurnal H/C ratio observed in the aforementioned sites.49,51 It is noteworthy that the chemical composition of ambient OOA is extremely complex53 and cannot be adequately simulated in the laboratory by the oxidation of a single VOC, α-pinene. Nevertheless, the AMS results imply that the laboratory aging of soot with the MSC produces SOM with realistic features. Figure S4 shows the comparison of our filter samples based AMS spectra against a reference spectrum for dark ozonolysis of α-pinene taken from the literature.54 Our spectra show the presence of the main features with similar relative contributions. Even though the angles between our spectra and the reference are around 36° (Table S4), they may still be considered as similar, given that we compare experiments performed under different conditions (both in terms of SOM production as well as sample collection) and by using different mass spectrometers. In addition, similarity to literature spectra has been confirmed by LC-MS measurements using the automated version of our particle generation system.33
Cellular Effects
Figure 2 shows the release of LDH in HBE at 24 h after exposure to 30 and 90 nm soot cores, which were either uncoated or coated with SOM from the ozonolysis of α-pinene and oxidation of mesitylene. Cell exposures to both uncoated and coated soot particles led to an increase in LDH release in comparison to the incubator control (I.C.). In most experiments, there was hardly any increase in LDH release in HBE exposed to particle-free air compared to the incubator control, indicating negligible effects by the gas phase components of the aerosols. The only exception was series no. 2, where 90 nm soot cores were coated with SOM from the oxidation of mesitylene. In this case, the particle-free air control resulted in higher LDH release compared to the incubator control, whereby effects by gas phase components may be ruled out. The variability in the release of LDH from HBE cells in response to aerosol exposure may be allocated to cell culture heterogeneity. There was no statistical significance between I.C. and p-free air.
Figure 2.

Cell membrane damage in normal human bronchial epithelia (HBE) at 24 h after exposure to soot particles, either uncoated or coated with SOM from the ozonolysis of α-pinene and oxidation of mesitylene. The release of lactate dehydrogenase (LDH) is presented as the percentage of maximal releasable LDH into the apical compartment. Untreated HBE (incubator control, I.C.) and HBE exposed to particle-filtered (p-free) air represent negative controls. “c_XXnm” denotes the corresponding soot cores (30 or 90 nm) coated to a GMDmob of XX nm (Table 1). Box plots calculated using the 1.5 IQR method, with outliers marked as full circles and crosses showing the mean value.
The cytotoxicity of uncoated soot particles with GMDmob of 30 nm was higher for series no. 4 (mesitylene as VOC) than for no. 3 (α-pinene as VOC), despite the lower particle number concentration (Table 1). This is probably due to instabilities in soot generation at this small mobility diameter, which is at the lowest limit of the miniCAST 5201 BC burner. Even though GMDmob was set to 30 nm during these experiments, instabilities in the flame might have influenced the chemical composition (e.g., PAH amount) of the soot surface, resulting in the differences in LDH release for 30 nm soot in these two experimental series.
Figure 2 shows a general increase in LDH release, when soot particles are coated with either type of SOM. This is in agreement with previous studies, where SOA compounds induced higher toxicity than uncoated soot particles, when cell cultures were exposed at ALI.20 More specifically, in Figure 3A, LDH release has been plotted as a function of the deposited particle mass per cm2 of cell culture area, for series nos. 1 and 3 (α-pinene as SOM precursor). The data indicate that increase in total mass concentration alone cannot explain the observed trends in LDH release. For instance, soot coated with SOM from the ozonolysis of α-pinene with a GMDmob of 50 nm (c_50 nm, light orange triangles) led to higher LDH release than the coated 85 nm soot particles (dark blue dots) corresponding to a higher mass loading. Similar results were obtained with mesitylene as SOM-precursor (series nos. 2 and 4) as shown in Figure S5.
Figure 3.

(A) LDH release as a function of the deposited particle mass per cm2 of cell culture area for series nos. 1 and 3 (α-pinene as SOM precursor). The arithmetic mean values are marked with a cross. The dashed lines denote the regression lines (orange and blue color for the 30 nm and the 90 nm soot series, respectively) forced through the LDH release value of the p-free control (blue horizontal line) at zero deposition. (B) LDH release as a function of the SOM mass to total particle mass ratio for series nos. 1 and 3 (α-pinene as SOM precursor). The figure is divided in three regions based on the morphology of the soot particles: (i) fractal-like, (ii) partially collapsed, and (iii) compact structure (from left to right). (C) LDH release as a function of the deposited particle mass per cm2 of cell culture area for series nos. 1 and 2 (α-pinene and mesitylene as SOM precursor, respectively). The green and blue dashed lines denote regression lines (forced through the p-free air control at zero deposition) for α-pinene and mesitylene as SOM precursor, respectively. The horizontal solid lines designate LDH release due to the p-free air controls. (D) Cell membrane damage in normal human bronchial epithelia (HBE) at 24 h after exposure to soot particles coated with SOM from the ozonolysis of α-pinene or to homogeneously nucleated SOM particles from the ozonolysis of α-pinene (i.e., without soot core). The dashed gray line (linear fit forced through the p-free air control at zero deposition) is plotted to guide the eye. The p-values for all experiments are listed in Table S5.
In Figure 3B, LDH release is plotted as a function of the SOM mass to total particle mass ratio. Three different regions are shown: (i) uncoated particles (90 nm soot, light gray dots; 30 nm soot, dark gray triangles) have a fractal-like morphology, and (ii) soot coated with a small amount of SOM (c_85 nm, dark blue dots) have a more compact structure due to a partial collapse of the soot core, while (iii) all the other coated soot particles have a compact morphology (see TEM images in Figure S2). According to previous studies, upon condensation of SOM, the major morphological transformation occurs stepwise, by filling of void space and subsequent growth of diameter.55 This might explain why the soot particles with partially collapsed soot structure (c_85 nm) result in similar LDH release as the uncoated soot particles (90 and 30 nm) despite a SOM/total mass ratio of about 47%. Part of the SOM has filled the open voids of the soot with minimum change in particle size. At higher SOM mass/total mass ratios (>55%), the particles have already become compact and SOM condenses increasingly on the outer surface of the soot particles, thus being bioavailable to interact with the epithelial cells. Indeed, in this case, LDH release increases as a function of the SOM mass/total mass ratio. Another explanation for these findings may be a threshold in dose–response. Further studies are necessary to clarify the observed trend in LDH release presented in Figure 3B.
Note that the coated particles labeled “c_120 nm” and “c_50 nm”, which both have about 80% SOM mass/total mass, induce a very similar LDH release despite the fact that particles with a GMDmob of 120 nm have an about 6 times larger surface area (assuming spherical particle morphology) than those with a GMDmob of 50 nm. This is largely compensated by the fact that the estimated number of deposited particles per cm2 of cell culture area in the case of the “c_50 nm” aerosol is about 4 times higher than that of the “c_120 nm” ones (Table 1). As a result, the total surface area of the “c_120 nm” particles as an ensemble is only 1.5 times higher than that of the “c_50 nm” aerosol. In future experiments, it would be interesting to repeat a similar series of experiments by adjusting the particle number concentration of the “c_50 nm” aerosol in such a way that the total aerosol surface area matches that of the “c_120 nm” aerosol. This would allow investigating whether LDH release depends on particle size, when the SOM mass and total aerosol surface area remain the same.
A recent study has reported more pronounced adverse effects for anthropogenic SOM (naphthalene as precursor) compared to biogenic SOM (β-pinene as precursor).20 In our study, to compare the cytotoxicity of SOM from the oxidation of α-pinene (biogenic VOC) and mesitylene (anthropogenic VOC), LDH release was plotted as a function of the deposited particle mass per cm2 of cell culture area for series nos. 1 and 2 (Figure 3C). The particle number concentration in series no. 1 (α-pinene as SOM precursor) and no. 2 (mesitylene as SOM precursor) was kept constant at (1.3 ± 0.1) × 105 cm–3. In addition, the GMDmob values of the uncoated soot cores were in both cases very similar (91.5 and 94.3 nm, respectively). As a result, the deposited mass per cm2 of cell culture area of the uncoated 90 nm soot particles (Table 1) was almost identical (∼62 ng/cm2) in both experiments. This implies that the increase in deposited mass was solely due to the increasing amount of SOM condensing on the soot particle surface. At first sight, it might look as if LDH release is higher for series no. 2 (dashed green line, mesitylene as SOM precursor) compared to series no. 1 (dashed blue line, α-pinene as SOM precursor). However, the p-free air control led to a considerably higher LDH release (11.9%, solid green line) in the first case than in the latter (4.2%, solid blue line). Considering the control tests, there is no significant evidence that SOM from the oxidation of mesitylene causes higher levels of cell membrane damage than that from the ozonolysis of α-pinene under the experimental conditions used in our study. Finally, we evaluated in series no. 6 the dose effect on HBE regarding particle number concentration and SOM particle mass concentration of one type of coated particles, thus eliminating any particle size effect (Figure 3D). SOM_120 had almost identical deposited particle number and mass per cm2 of cell culture as c_135. The LDH release remained constant, showing that the presence/absence of a fully embedded soot core has little to no effect on cytotoxicity. Moreover, the stepwise aerosol dilution of c_135 and therefore the decrease of the deposited particle mass from 313 ng/cm2 to 69 ng/cm2 (series no. 5, Table 1) resulted in a significant drop in LDH release, nearly to the level of the p-free air control.
In addition, we assessed the inflammatory response of HBE by semiquantitatively measuring the release of 102 cytokines and chemokines into the basal media at 24 h post-exposure. The activation of pro-inflammatory mediators may lead to a systemic inflammatory response. Our results showed that both HBE exposed to soot coated with SOM from the oxidation of α-pinene and of mesitylene exhibited pronounced secretion of cytokines and chemokines compared to unexposed as well as p-free air exposed HBE. Consequently, there is a need to discriminate cytokines and chemokines regarding their involvement in biological processes concurrently with the magnitude of the effect. This analysis revealed a considerable number of deregulated cytokines (mainly upregulation) in comparison to unexposed HBE. The proteome screening revealed common signatures of deregulated proteins for both types of coated soot particles (biogenic and anthropogenic VOC) compared to the controls (unexposed and p-free air exposed HBE). The heat map summarizing the biological response shown in Figure S6 reveals 32 and 30 deregulated cytokines and chemokines in HBE exposed to soot coated with SOM from the oxidation of α-pinene and mesitylene.
Figure 4 depicts the alteration of two distinct pathways among the chemokines and cytokines evaluated in more detail. With both soot types, cytokines and chemokines related to (i) cell interaction and adhesion (Figure 4A,C) as well as (ii) inflammation and immunity (Figure 4B,D) were deregulated. To average the response and to compare α-pinene and mesitylene exposure among the cytokines deregulated for cell interaction and adhesion, we used Intercellular Adhesion Molecule 1 (ICAM-1), urokinase-type Plasminogen Activator Receptor (uPAR), and Extracellular Matrix Metalloproteinase INducer (EMMPRIN), while for the immunity and inflammation pathway, the most common deregulated cytokines between the two different SOM were Dickkopf WNT Signaling Pathway Inhibitor 1 (DKK-1), Interleukin-8 (IL-8), Monocyte Chemoattractant Protein-1 (MCP-1), Macrophage migration Inhibitory Factor (MIF), and Granulocyte-Macrophage Colony-Stimulating Factor (GM-CSF). These data together with the results obtained for cytotoxicity confirm that 30 nm soot particles caused more pronounced cellular effects than the 90 nm soot particles, independently of exposure to biogenic or anthropogenic-derived SOM (Figures 4A,B and S6A,B). In particular, the release of cytokines and chemokines related to cell interaction and adhesion as well as those related to inflammation and immunity were statistically significantly different for 30 nm as well as c_35 nm and c_50 nm coatings for α-pinene (Figure 4A,B, blue bars). Exposure to mesitylene-derived SOM appears statistically significantly different when comparing c_35 nm and the maximum coating c_50 nm, providing evidence for substantial interference of the coated soot particles (Figure 4A,B, green bars).
Figure 4.

Screening of cytokines and chemokines involved in cell interaction and adhesion (A, C) and inflammation and immunity (B, D). Fold changes relative to unexposed cells (incubator control, I.C.). The data are presented as mean values of a minimum of 3 cell cultures and standard error of the mean (SEM). Statistical analysis was performed using Tukey’s multiple comparisons test (*p-value < 0.05; **p-value < 0.01).
Conversely, cells exposed to 90 nm soot particles coated with mesitylene-derived SOM showed abnormal expression of mainly the Dickkopf WNT Signaling Pathway Inhibitor 1 (Dkk-1) involved in the inflammatory pathway, upon increasing the coating thickness (Figure S6D). The other cytokines and chemokines related to inflammation were not affected (Figures 4D and S6C,D). Overall, for the 90 nm coated particles there was no significant deregulation upon increasing of the coating (Figure 4C,D) for both α-pinene and mesitylene derived SOM.
In line with our experiments, we evaluated the proteome profile of HBE from series no. 5, with specific regard to cytokines and chemokines involved in inflammation and cell adhesion. We found similar alterations as described for HBE exposed to 30 and 90 nm soot, i.e., upregulation of these two pathways with mainly the same cytokines and chemokines (Figure S7) involved. Despite a decrease of deposited particles resulting in a significant drop of cytotoxicity, we did not find any significant difference in protein release between pure SOM and decreasing dose (c_135; c_135_2, and c_135_3; Figure 5A,B, Table 1, series no. 5). The results demonstrate that the presence of the encapsulated soot core has no effect on the activation and involvement of inflammatory processes or on cell interactions (Figure 5A,B).
Figure 5.

Screening of cyto- and chemokines involved in cell interaction and adhesion (A) and inflammation and immunity (B) for series no. 5. Fold changes relative to unexposed cells (incubator control, I.C.). The data are presented as mean values of a minimum of three cell cultures and standard error of the mean (SEM). Statistical analysis was performed using Tukey’s multiple comparisons test (*p-value < 0.05; **p-value < 0.01).
The experimental setup presented in this study allowed us to accurately control the amount of SOM condensed on the core particles. This enables the reproducible generation of different model aerosols with well-defined SOM mass/total particle mass ratios. The data indicate that the increase in total particle mass concentration alone cannot explain the observed trends in LDH release. The chemical composition of the coating and its bioavailability seem to be important for cytotoxicity. The release of LDH was found to increase with increasing SOM mass/total particle mass ratio, but only when SOM had condensed on the outer surface of the soot cores. Moreover, exposure of HBE to soot particles coated with SOM from the oxidation of mesitylene and the ozonolysis of α-pinene resulted in a similar increase in LDH release compared to the control with particle-free air, under the experimental conditions used in this study. The presence of the soot core seemed to have little or no effect on cytotoxicity, when it was fully embedded in SOM. In line with the data on the chemical composition, the biological results revealed a more pronounced cellular response upon exposure to 30 nm soot particles from biogenic or anthropogenic derived SOM. These data clearly demonstrate an increase in cytotoxicity, as well as of cell remodeling and inflammatory processes upon exposure to the aerosols with 30 nm particles but not for the 90 nm series.
Our findings highlight the role of SOM for in vitro toxicological outcomes and suggest that, in addition to total particle mass concentration, the percentage of the SOM fraction in PM2.5 may be a useful metric to characterize the potential of particles to cause adverse health effects. Future studies will focus on a more detailed characterization of the model aerosols, and postexposure cytotoxic responses will be measured using a variety of approaches including cell proliferation assays as well as proteomic and transcriptomic analyses.
Acknowledgments
This study was supported by the Swiss Federal Office for the Environment (FOEN), Project No. 17.0094.PJ (funding granted to M.G., K.V., and A.K.). This work has also received funding from the 18HLT02 AeroTox project of the European Union through the European Metrology Programme for Innovation and Research (EMPIR). EMPIR is jointly funded by the EMPIR participating countries within EURAMET and the European Union. Further, M.S. and N.B. acknowledge funding by the National Institute of Health, NIH (R01 HL133240 and R01 HL157942). We thank Barbara Kupferschmid for help with the cell cultures and Marek Kaminek (Institute of Anatomy, University of Bern) for cryo-TEM preparation and imaging of the particles.
Supporting Information Available
The Supporting Information is available free of charge at https://pubs.acs.org/doi/10.1021/acs.est.2c03692.
Additional details of experimental procedures and methods and additional data and figures of the physicochemical characterization of the test aerosol and the cell analysis (PDF)
Author Contributions
∇ Z.L. and M.N.E. contributed equally to this paper. Z.L. performed in vitro cytotoxicity, M.N.E. generated and characterized the physical properties of the aerosols, A.K. advised on aerosol generation and performed data analysis and interpretation, J.D.A. performed AMS, H.H. and K.S. performed GC-MS, K.R.W. extracted the filters for AMS, A.S.B. performed AMS data interpretation, M.S. and N.B. provided the HBE cells, and K.V. and M.G. designed, coordinated, and supervised the study and performed data analysis and interpretation. All authors contributed to the writing of the manuscript and approved the final version.
The authors declare no competing financial interest.
Supplementary Material
References
- Chen H.; Kwong J. C.; Copes R.; Hystad P.; van Donkelaar A.; Tu K.; Brook J. R.; Goldberg M. S.; Martin R. V.; Murray B. J.; et al. Exposure to Ambient Air Pollution and the Incidence of Dementia : A Population-Based Cohort Study. Environ. Int. 2017, 108, 271–277. 10.1016/j.envint.2017.08.020. [DOI] [PubMed] [Google Scholar]
- Kim K.-H.; Kabir E.; Kabir S. A Review on the Human Health Impact of Airborne Particulate Matter. Environ. Int. 2015, 74, 136–143. 10.1016/j.envint.2014.10.005. [DOI] [PubMed] [Google Scholar]
- Loomis D.; Grosse Y.; Lauby-Secretan B.; Ghissassi F. El; Bouvard V.; Benbrahim-Tallaa L.; Guha N.; Baan R.; Mattock H.; Straif K. The Carcinogenicity of Outdoor Air Pollution. Lancet Oncol. 2013, 14 (13), 1262–1263. 10.1016/S1470-2045(13)70487-X. [DOI] [PubMed] [Google Scholar]
- Peters R.; Ee N.; Peters J.; Booth A.; Mudway I.; Anstey K. J. Air Pollution and Dementia: A Systematic Review. J. Alzheimer’s Dis. 2019, 70, S145–S163. 10.3233/JAD-180631. [DOI] [PMC free article] [PubMed] [Google Scholar]
- WHO . Preventing disease through healthy environments: a global assessment of the burden of disease from environmental risks. https://www.who.int/publications/i/item/9789241565196 (accessed Oct. 7, 2022).
- Pope C. A.; Coleman N.; Pond Z. A.; Burnett R. T. Fine Particulate Air Pollution and Human Mortality: 25+ Years of Cohort Studies. Environ. Res. 2020, 183, 108924. 10.1016/j.envres.2019.108924. [DOI] [PubMed] [Google Scholar]
- Cohen A. J.; Brauer M.; Burnett R.; Anderson H. R.; Frostad J.; Estep K.; Balakrishnan K.; Brunekreef B.; Dandona L.; Dandona R.; et al. Estimates and 25-Year Trends of the Global Burden of Disease Attributable to Ambient Air Pollution: An Analysis of Data from the Global Burden of Diseases Study 2015. Lancet 2017, 389 (10082), 1907–1918. 10.1016/S0140-6736(17)30505-6. [DOI] [PMC free article] [PubMed] [Google Scholar]
- EEA . Europe’s air quality status 2022. https://www.eea.europa.eu//publications/status-of-air-quality-in-Europe-2022 (accessed Oct. 7, 2022).
- Cassee F. R.; Héroux M.-E.; Gerlofs-Nijland M. E.; Kelly F. J. Particulate Matter beyond Mass: Recent Health Evidence on the Role of Fractions, Chemical Constituents and Sources of Emission. Inhal. Toxicol. 2013, 25 (14), 802–812. 10.3109/08958378.2013.850127. [DOI] [PMC free article] [PubMed] [Google Scholar]
- Park M.; Joo H. S.; Lee K.; Jang M.; Kim S. D.; Kim I.; Borlaza L. J. S.; Lim H.; Shin H.; Chung K. H.; et al. Differential Toxicities of Fine Particulate Matters from Various Sources. Sci. Rep. 2018, 8 (1), 17007. 10.1038/s41598-018-35398-0. [DOI] [PMC free article] [PubMed] [Google Scholar]
- Wyzga R. E.; Rohr A. C. Long-Term Particulate Matter Exposure: Attributing Health Effects to Individual PM Components. J. Air Waste Manag. Assoc. 2015, 65 (5), 523–543. 10.1080/10962247.2015.1020396. [DOI] [PubMed] [Google Scholar]
- Daellenbach K. R.; Uzu G.; Jiang J.; Cassagnes L.-E.; Leni Z.; Vlachou A.; Stefenelli G.; Canonaco F.; Weber S.; Segers A.; et al. Sources of Particulate-Matter Air Pollution and Its Oxidative Potential in Europe. Nature 2020, 587, 414–419. 10.1038/s41586-020-2902-8. [DOI] [PubMed] [Google Scholar]
- Delfino R. J.; Staimer N.; Tjoa T.; Arhami M.; Polidori A.; Gillen D. L.; George S. C.; Shafer M. M.; Schauer J. J.; Sioutas C. Associations of Primary and Secondary Organic Aerosols With Airway and Systemic Inflammation in an Elderly Panel Cohort. Epidemiology 2010, 21 (6), 892–902. 10.1097/EDE.0b013e3181f20e6c. [DOI] [PMC free article] [PubMed] [Google Scholar]
- Trojanowski R.; Fthenakis V. Nanoparticle Emissions from Residental Wood Combustion: A Critical Literature Review, Characterization and Recommendations. Renew. Sustain. Energy Rev. 2019, 103, 515–528. 10.1016/j.rser.2019.01.007. [DOI] [Google Scholar]
- Gren L.; Malmborg V. B.; Jacobsen N. R.; Shukla P. C.; Bendtsen K. M.; Eriksson A. C.; Essig Y. J.; Krais A. M.; Loeschner K.; Shamun S. Effect of Renewable Fuels and Intake O2 Concentration on Diesel Engine Emission Characteristics and Reactive Oxygen Species (ROS) Formation. Atmosphere (Basel) 2020, 11 (6), 641. 10.3390/atmos11060641. [DOI] [Google Scholar]
- Modrzynska J.; Berthing T.; Ravn-Haren G.; Jacobsen N. R.; Weydahl I. K.; Loeschner K.; Mortensen A.; Saber A. T.; Vogel U. Primary Genotoxicity in the Liver Following Pulmonary Exposure to Carbon Black Nanoparticles in Mice. Part. Fibre Toxicol. 2018, 15 (1), 2. 10.1186/s12989-017-0238-9. [DOI] [PMC free article] [PubMed] [Google Scholar]
- Hakkarainen H.; Salo L.; Mikkonen S.; Saarikoski S.; Aurela M.; Teinilä K.; Ihalainen M.; Martikainen S.; Marjanen P.; Lepistö T.; et al. Black Carbon Toxicity Dependence on Particle Coating: Measurements with a Novel Cell Exposure Method. Sci. Total Environ. 2022, 838, 156543. 10.1016/j.scitotenv.2022.156543. [DOI] [PubMed] [Google Scholar]
- Rohr A.; McDonald J. Health Effects of Carbon-Containing Particulate Matter: Focus on Sources and Recent Research Program Results. Crit. Rev. Toxicol. 2016, 46 (2), 97. 10.3109/10408444.2015.1107024. [DOI] [PubMed] [Google Scholar]
- Almeida A. S.; Ferreira R. M. P.; Silva A. M. S.; Duarte A. C.; Neves B. M.; Duarte R. M. B. O. Structural Features and Pro-Inflammatory Effects of Water-Soluble Organic Matter in Inhalable Fine Urban Air Particles. Environ. Sci. Technol. 2020, 54 (2), 1082–1091. 10.1021/acs.est.9b04596. [DOI] [PubMed] [Google Scholar]
- Offer S.; Hartner E.; Di Bucchianico S.; Bisig C.; Bauer S.; Pantzke J.; Zimmermann E. J.; Cao X.; Binder S.; Kuhn E.; et al. Effect of Atmospheric Aging on Soot Particle Toxicity in Lung Cell Models at the Air-Liquid Interface: Differential Toxicological Impacts of Biogenic and Anthropogenic Secondary Organic Aerosols (SOAs). Environ. Health Perspect. 2022, 130 (2), 027003. 10.1289/EHP9413. [DOI] [PMC free article] [PubMed] [Google Scholar]
- Docherty K. S.; Stone E. A.; Ulbrich I. M.; DeCarlo P. F.; Snyder D. C.; Schauer J. J.; Peltier R. E.; Weber R. J.; Murphy S. M.; Seinfeld J. H.; et al. Apportionment of Primary and Secondary Organic Aerosols in Southern California during the 2005 Study of Organic Aerosols in Riverside (SOAR-1). Environ. Sci. Technol. 2008, 42 (20), 7655–7662. 10.1021/es8008166. [DOI] [PubMed] [Google Scholar]
- Fulcher M. L.; Gabriel S.; Burns K. A.; Yankaskas J. R.; Randell S. H.. Well-Differentiated Human Airway Epithelial Cell Cultures. In Methods in Molecular Medicine; Picot J., Ed.; Humana Press Inc.: Totowa, NJ, 2005; Vol. 107, pp 183–206. [DOI] [PubMed] [Google Scholar]
- Künzi L.; Krapf M.; Daher N.; Dommen J.; Jeannet N.; Schneider S.; Platt S.; Slowik J. G.; Baumlin N.; Salathe M.; et al. Toxicity of Aged Gasoline Exhaust Particles to Normal and Diseased Airway Epithelia. Sci. Rep. 2015, 5, 11801. 10.1038/srep11801. [DOI] [PMC free article] [PubMed] [Google Scholar]
- Geiser M.; Jeannet N.; Fierz M.; Burtscher H. Evaluating Adverse Effects of Inhaled Nanoparticles by Realistic in Vitro Technology. Nanomaterials 2017, 7 (2), 49. 10.3390/nano7020049. [DOI] [PMC free article] [PubMed] [Google Scholar]
- Ess M. N.; Vasilatou K. Characterization of a New MiniCAST with Diffusion Flame and Premixed Flame Options: Generation of Particles with High EC Content in the Size Range 30 Nm to 200 Nm. Aerosol Sci. Technol. 2019, 53 (1), 29–44. 10.1080/02786826.2018.1536818. [DOI] [Google Scholar]
- Ess M. N.; Bertò M.; Irwin M.; Modini R. L.; Gysel-Beer M.; Vasilatou K. Optical and Morphological Properties of Soot Particles Generated by the MiniCAST 5201 BC Generator. Aerosol Sci. Technol. 2021, 55 (7), 828–847. 10.1080/02786826.2021.1901847. [DOI] [Google Scholar]
- Keller A.; Burtscher H. A Continuous Photo-Oxidation Flow Reactor for a Defined Measurement of the SOA Formation Potential of Wood Burning Emissions. J. Aerosol Sci. 2012, 49 (12), 9–20. 10.1016/j.jaerosci.2012.02.007. [DOI] [Google Scholar]
- Ess M. N.; Bertò M.; Keller A.; Gysel-Beer M.; Vasilatou K. Coated Soot Particles with Tunable, Well-Controlled Properties Generated in the Laboratory with a MiniCAST BC and a Micro Smog Chamber. J. Aerosol Sci. 2021, 157, 105820. 10.1016/j.jaerosci.2021.105820. [DOI] [Google Scholar]
- Kalbermatter D. M.; Močnik G.; Drinovec L.; Visser B.; Röhrbein J.; Oscity M.; Weingartner E.; Hyvärinen A.-P.; Vasilatou K. Comparing Black-Carbon- and Aerosol-Absorption-Measuring Instruments – a New System Using Lab-Generated Soot Coated with Controlled Amounts of Secondary Organic Matter. Atmos. Meas. Technol. 2022, 15 (2), 561–572. 10.5194/amt-15-561-2022. [DOI] [Google Scholar]
- Jeannet N.; Fierz M.; Kalberer M.; Burtscher H.; Geiser M. Nano Aerosol Chamber for In-Vitro Toxicity (NACIVT) Studies. Nanotoxicology 2015, 9 (1), 34–42. 10.3109/17435390.2014.886739. [DOI] [PubMed] [Google Scholar]
- Kesselmeier J.; Staudt M. An Overview on Emission, Physiology and Ecology. J. Atmos. Chem. 1999, 33, 23–88. 10.1023/A:1006127516791. [DOI] [Google Scholar]
- Zeng P.; Guo H.; Cheng H.; Wang Z.; Zeng L.; Lyu X.; Zhan L.; Yang Z. Aromatic Hydrocarbons in Urban and Suburban Atmospheres in Central China: Spatiotemporal Patterns, Source Implications, and Health Risk Assessment. Atmosphere (Basel) 2019, 10 (10), 565. 10.3390/atmos10100565. [DOI] [Google Scholar]
- Keller A.; Kalbermatter D. M.; Specht P.; Steigmeier P.; Resch J.; Kalberer M.; Hammer T.; Vasilatou K.; Wolfer K. The Organic Coating Unit, an All-in-One System for Reproducible Generation of Secondary Organic Matter Aerosol. Aerosol Sci. Technol. 2022, 56 (10), 947–958. 10.1080/02786826.2022.2110448. [DOI] [Google Scholar]
- DeCarlo P. F.; Kimmel J. R.; Trimborn A.; Northway M. J.; Jayne J. T.; Aiken A. C.; Gonin M.; Fuhrer K.; Horvath T.; Docherty K. S.; et al. Field-Deployable, High-Resolution, Time-of-Flight Aerosol Mass Spectrometer. Anal. Chem. 2006, 78 (24), 8281–8289. 10.1021/ac061249n. [DOI] [PubMed] [Google Scholar]
- Schmid A.; Sutto Z.; Schmid N.; Novak L.; Ivonnet P.; Horvath G.; Conner G.; Fregien N.; Salathe M. Decreased Soluble Adenylyl Cyclase Activity in Cystic Fibrosis Is Related to Defective Apical Bicarbonate Exchange and Affects Ciliary Beat Frequency Regulation. J. Biol. Chem. 2010, 285 (39), 29998–30007. 10.1074/jbc.M110.113621. [DOI] [PMC free article] [PubMed] [Google Scholar]
- Künzi L.; Mertes P.; Schneider S.; Jeannet N.; Menzi C.; Dommen J.; Baltensperger U.; Prévôt A. S. H.; Salathe M.; Kalberer M.; et al. Responses of Lung Cells to Realistic Exposure of Primary and Aged Carbonaceous Aerosols. Atmos. Environ. 2013, 68, 143–150. 10.1016/j.atmosenv.2012.11.055. [DOI] [Google Scholar]
- Delaval M.; Egli D.; Schüpfer P.; Benarafa C.; Geiser M.; Burtscher H. Novel Instrument to Generate Representative E-Cigarette Vapors for Physicochemical Particle Characterization and in-Vitro Toxicity. J. Aerosol Sci. 2019, 129, 40–52. 10.1016/j.jaerosci.2018.11.011. [DOI] [Google Scholar]
- Burtscher H. Physical Characterization of Particulate Emissions from Diesel Engines: A Review. J. Aerosol Sci. 2005, 36 (7), 896–932. 10.1016/j.jaerosci.2004.12.001. [DOI] [Google Scholar]
- Rana S.; Saxena M. R.; Maurya R. K. A Review on Morphology, Nanostructure, Chemical Composition, and Number Concentration of Diesel Particulate Emissions. Environmental Science and Pollution Research. 2022, 29, 15432–15489. 10.1007/s11356-021-15999-5. [DOI] [PubMed] [Google Scholar]
- Giechaskiel B.; Mamakos A.; Andersson J.; Dilara P.; Martini G.; Schindler W.; Bergmann A. Measurement of Automotive Nonvolatile Particle Number Emissions within the European Legislative Framework: A Review. Aerosol Sci. Technol. 2012, 46 (7), 719–749. 10.1080/02786826.2012.661103. [DOI] [Google Scholar]
- Samaras Z.; Rieker M.; Papaioannou E.; van Dorp W. F.; Kousoulidou M.; Ntziachristos L.; Andersson J.; Bergmann A.; Hausberger S.; Keskinen J.; et al. Perspectives for Regulating 10 Nm Particle Number Emissions Based on Novel Measurement Methodologies. J. Aerosol Sci. 2022, 162, 105957. 10.1016/j.jaerosci.2022.105957. [DOI] [Google Scholar]
- Di Iorio S.; Catapano F.; Magno A.; Sementa P.; Vaglieco B. M. Investigation on Sub-23 nm Particles and Their Volatile Organic Fraction (VOF) in PFI/DI Spark Ignition Engine Fueled with Gasoline, Ethanol and a 30% v/v Ethanol Blend. J. Aerosol Sci. 2021, 153, 105723. 10.1016/j.jaerosci.2020.105723. [DOI] [Google Scholar]
- Donahue N. M.; Chuang W.; Epstein S. A.; Kroll J. H.; Worsnop D. R.; Robinson A. L.; Adams P. J.; Pandis S. N. Why Do Organic Aerosols Exist? Understanding Aerosol Lifetimes Using the Two-Dimensional Volatility Basis Set. Environ. Chem. 2013, 10 (3), 151–157. 10.1071/EN13022. [DOI] [Google Scholar]
- Zhou S.; Shiraiwa M.; McWhinney R. D.; Pöschl U.; Abbatt J. P. D. Kinetic Limitations in Gas-Particle Reactions Arising from Slow Diffusion in Secondary Organic Aerosol. Faraday Discuss. 2013, 165, 391–406. 10.1039/C3FD00030C. [DOI] [PubMed] [Google Scholar]
- Miller F. J.; Asgharian B.; Schroeter J. D.; Price O. Improvements and Additions to the Multiple Path Particle Dosimetry Model. J. Aerosol Sci. 2016, 99, 14–26. 10.1016/j.jaerosci.2016.01.018. [DOI] [Google Scholar]
- Maricq M. M. Examining the Relationship between Black Carbon and Soot in Flames and Engine Exhaust. Aerosol Sci. Technol. 2014, 48 (6), 620–629. 10.1080/02786826.2014.904961. [DOI] [Google Scholar]
- Dat N.-D.; Chang M. B. Science of the Total Environment Review on Characteristics of PAHs in Atmosphere, Anthropogenic Sources and Control Technologies. Sci. Total Environ. 2017, 609, 682–693. 10.1016/j.scitotenv.2017.07.204. [DOI] [PubMed] [Google Scholar]
- Vestenius M.; Leppänen S.; Anttila P.; Kyllönen K.; Hatakka J.; Hellén H.; Hyvärinen A.-P.; Hakola H. Background Concentrations and Source Apportionment of Polycyclic Aromatic Hydrocarbons in South-Eastern Finland. Atmos. Environ. 2011, 45 (20), 3391–3399. 10.1016/j.atmosenv.2011.03.050. [DOI] [Google Scholar]
- Aiken A. C.; DeCarlo P. F.; Kroll J. H.; Worsnop D. R.; Huffman J. A.; Docherty K. S.; Ulbrich I. M.; Mohr C.; Kimmel J. R.; Sueper D.; et al. O/C and OM/OC Ratios of Primary, Secondary, and Ambient Organic Aerosols with High-Resolution Time-of-Flight Aerosol Mass Spectrometry. Environ. Sci. Technol. 2008, 42 (12), 4478–4485. 10.1021/es703009q. [DOI] [PubMed] [Google Scholar]
- Chen Q.; Heald C. L.; Jimenez J. L.; Canagaratna M. R.; Zhang Q.; He L.; Huang X.; Campuzano-Jost P.; Palm B. B.; Poulain L.; et al. Elemental Composition of Organic Aerosol: The Gap between Ambient and Laboratory Measurements. Geophys. Res. Lett. 2015, 42, 4182–4189. 10.1002/2015GL063693. [DOI] [Google Scholar]
- Ortega A. M.; Hayes P. L.; Peng Z.; Palm B. B.; Hu W.; Day D. A.; Li R.; Cubison M. J.; Brune W. H.; Graus M.; et al. Real-Time Measurements of Secondary Organic Aerosol Formation and Aging from Ambient Air in an Oxidation Flow Reactor in the Los Angeles Area. Atmos. Chem. Phys. 2016, 16 (11), 7411–7433. 10.5194/acp-16-7411-2016. [DOI] [Google Scholar]
- Shah R. U.; Robinson E. S.; Gu P.; Robinson A. L.; Apte J. S.; Presto A. A. High-Spatial-Resolution Mapping and Source Apportionment of Aerosol Composition in Oakland, California, Using Mobile Aerosol Mass Spectrometry. Atmos. Chem. Phys. 2018, 18 (22), 16325–16344. 10.5194/acp-18-16325-2018. [DOI] [Google Scholar]
- Hallquist M.; Wenger J. C.; Baltensperger U.; Rudich Y.; Simpson D.; Claeys M.; Dommen J.; Donahue N. M.; George C.; Goldstein A. H.; et al. The Formation, Properties and Impact of Secondary Organic Aerosol: Current and Emerging Issues. Atmos. Chem. Phys. 2009, 9, 5155–5236. 10.5194/acp-9-5155-2009. [DOI] [Google Scholar]
- Bahreini R.; Keywood M. D.; Ng N. L.; Varutbangkul V.; Gao S.; Flagan R. C.; Seinfeld J. H.; Worsnop D. R.; Jimenez J. L. Measurements of Secondary Organic Aerosol from Oxidation of Cycloalkenes, Terpenes, and m-Xylene Using an Aerodyne Aerosol Mass Spectrometer. Environ. Sci. Technol. 2005, 39 (15), 5674–5688. 10.1021/es048061a. [DOI] [PubMed] [Google Scholar]
- Pei X.; Hallquist M.; Eriksson A. C.; Pagels J.; Donahue N. M.; Mentel T.; Svenningsson B.; Brune W.; Pathak R. K. Morphological Transformation of Soot : Investigation of Microphysical Processes during the Condensation of Sulfuric Acid and Limonene Ozonolysis Product Vapors. Atmos. Chem. Phys. 2018, 18, 9845–9860. 10.5194/acp-18-9845-2018. [DOI] [Google Scholar]
Associated Data
This section collects any data citations, data availability statements, or supplementary materials included in this article.