

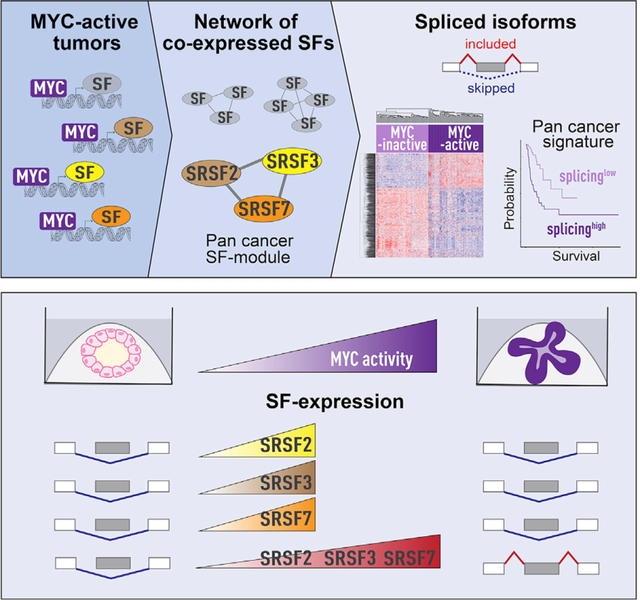
SUMMARY
MYC is dysregulated in >50% of cancers, but direct targeting of MYC has been clinically unsuccessful. Targeting downstream MYC effector pathways represents an attractive alternative. MYC regulates alternative mRNA splicing, but the mechanistic links between MYC and the splicing machinery in cancer remain under-explored. Here, we identify a network of co-expressed splicing factors (SF-modules) in MYC-active breast tumors. Of these, one is a pan-cancer SF-module correlating with MYC activity across 33 tumor types. In mammary cell models, MYC activation leads to co-upregulation of pan-cancer module SFs and to changes in >4,000 splicing events. In breast cancer organoids, co-overexpression of the pan-cancer SF-module induces MYC-regulated splicing events and increases organoid size and invasiveness, while knockdown decreases organoid size. Finally, we uncover a MYC-activity pan-cancer splicing signature correlating with survival across tumor types. Our findings provide insight into the mechanisms of MYC-regulated splicing and for the development of therapeutics for MYC-driven tumors.
In brief
Urbanski et al. identify a network of co-expressed splicing factors driven by the MYC oncogene in tumors. Co-upregulation of splicing factors leads to downstream splicing changes and increased invasiveness in breast cancer models. Pan-cancer splicing factors and spliced isoforms are found across all MYC-active tumor types and correlate with survival.
Graphical Abstract
INTRODUCTION
Alternative RNA splicing (AS) is a key step in gene expression regulation, contributing to transcriptomic and proteomic diversity by controlling exon inclusion in distinct transcript isoforms. Disruption of AS in cancer, through mutation and/or altered expression of splicing factors (SFs), affects cancer hallmarks.1 Mutations in spliceosome components are common in hematological malignancies, whereas solid tumors, including breast, often exhibit changes in SF copy number and/or expression.2 SFs directly bind pre-mRNA targets and regulate AS in a concentration-dependent manner,3 and SF expression changes as low as 2-fold are linked with cancer.2,4 Therefore, defining the mechanisms of SF-level regulation in normal and cancer cells is crucial for understanding SF-mediated transformation and the development of splicing-targeted therapies.4,5
Several SFs are directly regulated by the oncogenic transcription factor MYC.6–9 MYC dysregulation occurs in >50% of tumors and is associated with poor clinical outcome10–12; yet direct targeting of MYC has proven clinically difficult due to the lack of a small-molecule binding site.13–15 Alternative approaches, including modulating MYC transcription, translation, protein stability, or activity, show preclinical promise, but there are no FDA-approved MYC-targeting therapies.12 Elucidating the molecular mechanisms linking MYC with AS offers opportunities to target the MYC effector pathway.
MYC is frequently upregulated in the aggressive and difficult-to-treat basal-like and triple-negative breast cancer subtypes.16 In breast cancer models, MYC-induced upregulation of the individual SFs SRSF1, TRA2β, and BUD31 is necessary for MYC-driven tumorigenesis.6–8,17 Although disrupted SF expression is often observed in human breast tumors, the full extent of SF alterations and their consequences are only beginning to be unraveled. Altering the expression of a single SF can be sufficient to promote breast tumor formation or metastasis7,18–21; however, not all SFs overexpressed in breast tumors are sufficient, alone, to drive oncogenesis in breast cancer models.7
AS of a given isoform results from positive and negative regulation by multiple SFs.22 Thus, SFs may act together in tumorigenesis or tumor maintenance. Indeed, alterations in multiple SFs are often observed in the same tumor, yet most studies investigate individual SFs.7,18,20,23–27 Further, previous studies focused on a limited number of MYC-dependent tumor types and did not investigate if MYC-regulated SFs are tumor type specific or shared. Therefore, although SF co-regulation has been postulated to drive cancer progression,28,29 experimental demonstration of SFs functioning as a coordinated network of MYC effectors, and whether SFs have synergistic, cooperative, or even antagonistic effects, is lacking.
Here, we implement a classifier to score MYC activity and define an AS signature of MYC-active breast tumors. We identify >150 MYC-regulated SFs co-expressed as modules. One pan-cancer module correlates with MYC activity across 33 tumor types, and its expression is controlled by MYC activation in mammary cells. Co-overexpression of SFs from the pan-cancer module leads to increased cell invasiveness in breast cancer models and induces MYC-regulated AS events, while SF knockdown reduces breast cancer organoid size. Finally, we uncover a pan-cancer AS signature of MYC-active tumors that correlates with patient survival.
RESULTS
MYC-active human breast tumors display a distinct AS signature
We first characterized the AS landscape in breast tumors with high vs. low MYC activity using RNA-sequencing (RNA-seq) data from 1,073 TCGA breast tumors (Table S1A).30,31 We evaluated MYC activity rather than mRNA expression because the MYC protein requires binding partners to regulate transcription,32 and its stability can be altered post-translationally.33 MYC mRNA expression was significantly higher in adjacent normal tissue compared with breast tumors (Figure S1A), highlighting that MYC expression is not an adequate proxy for MYC’s function. We adapted a rank-based scoring method34, with each sample scored based on the expression of 200 known MYC target genes35 (see STAR Methods). Samples with the highest activity score had on average the highest expression of MYC target genes, and MYC activity was higher in breast tumors compared with adjacent normal tissues (Figure S1B).
We classified MYC activity across breast tumor subtypes. Basal tumors, of which 77% are classified as triple negative,36 had the highest MYC activity (Figure S1C). High levels of MYC protein and MYC-driven pathways in basal tumors vs. other subtypes have been observed in other cohorts,37,38 further validating our classifier. We defined 78 MYC-active and 74 MYC-inactive breast tumors as those with a MYC-activity Z score of >1.5 and <−1.5, respectively (Figures 1A and S1D and Table S1B). Of the MYC-active tumors, 72% were basal-like, 15% luminal B, 10% Her2+, and 3% luminal A subtype (Figure S1E).
Figure 1. MYC-active breast tumors exhibit a unique AS signature.
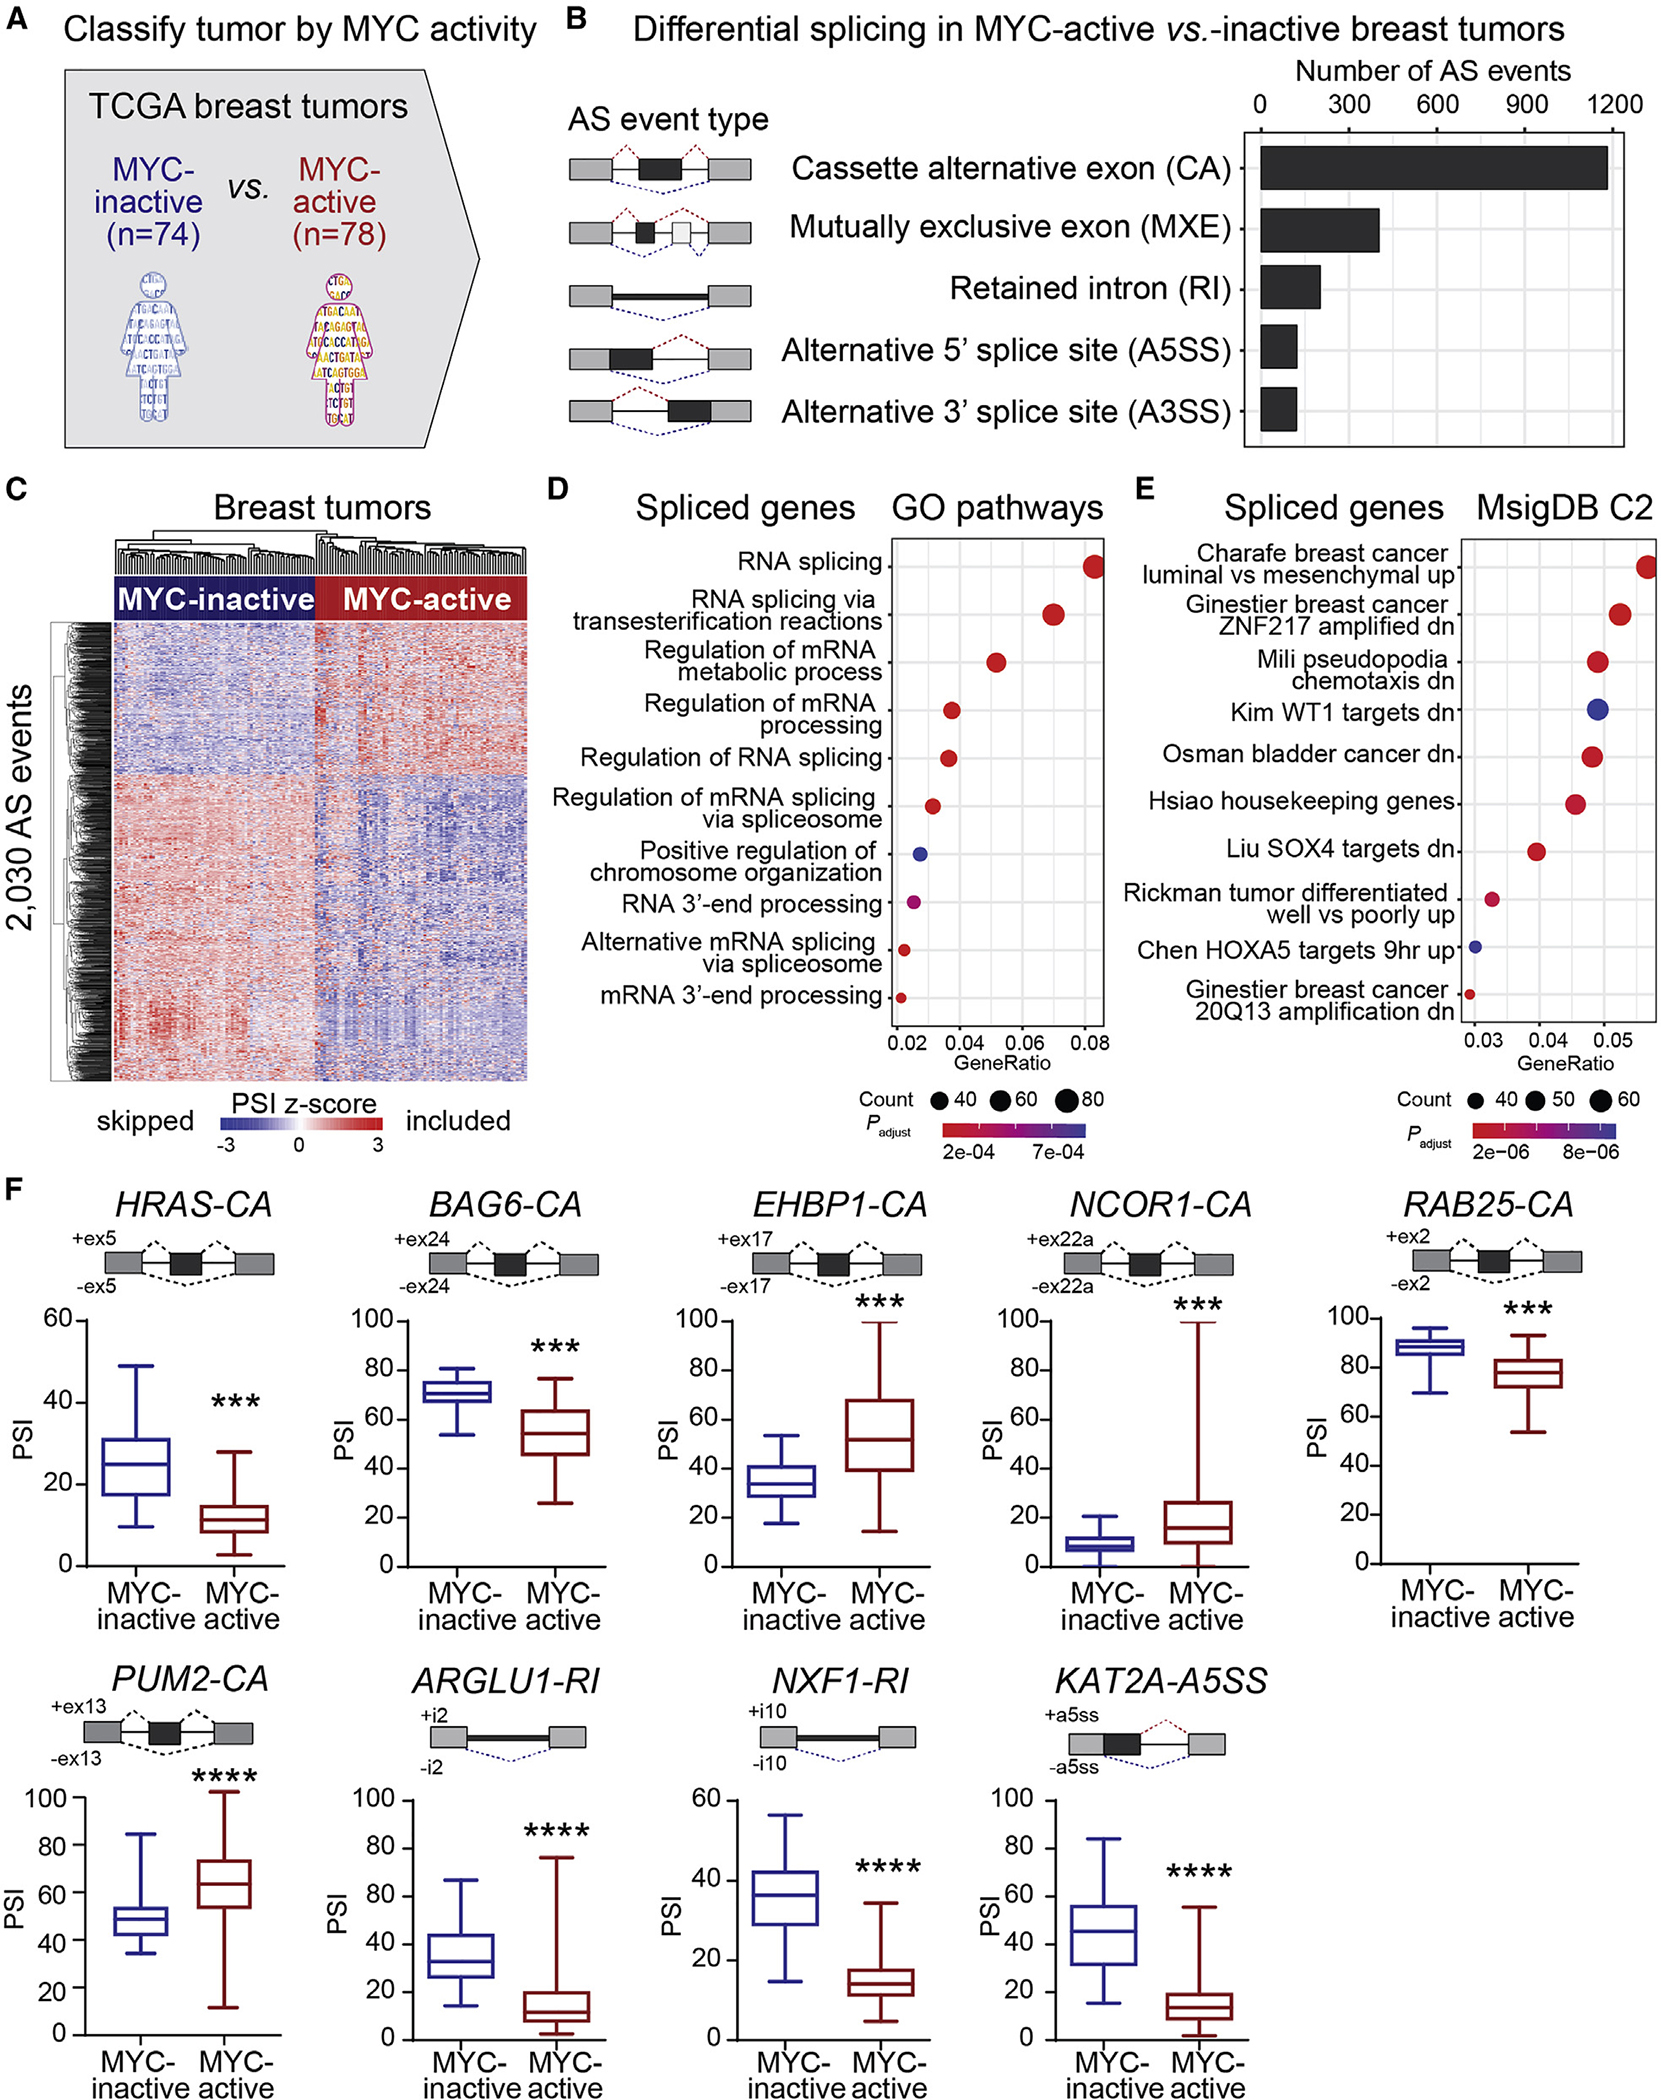
(A) TCGA breast tumors were classified by MYC activity, calculated using MYC target expression. MYC-active and MYC-inactive tumors were defined by a Z score >1.5 and <−1.5, respectively.
(B) AS events in MYC-active vs. MYC-inactive breast tumors (ΔPSI > |10%|, FDR < 0.05).
(C) Hierarchical clustering of AS events in MYC-active and MYC-inactive breast tumors. Rows represent PSI normalized across samples per AS event.
(D and E) Gene ontology analysis using GO gene sets (D) and MSigDB signatures (E) for MYC-active spliced genes.
(F) PSI for AS events in MYC-active vs. MYC-inactive breast tumors (median ± interquartile range; t test, ****p < 0.0001, ***p < 0.001). Gene name and event types are indicated. See also Figure S1 and Table S1.
We characterized AS profiles in MYC-active vs. MYC-inactive TCGA breast tumors using an in-house cloud-operated computational pipeline incorporating STAR for transcript assembly,39 StringTie for reference-guided transcriptome reconstruction to identify novel AS isoforms,40 and rMATS for AS quantification41 (Figure S1F) (see STAR Methods). AS quantification at the event level used both exon body and junction reads, deriving for each AS event a percentage spliced in (PSI) value measuring reads supporting exon inclusion vs. all reads.41 We identified 2,030 differential AS events between MYC-active and MYC-inactive breast tumors with at least 10% PSI change and false discovery rate (FDR) < 0.05 (Figure 1B and Table S1C). Cassette alternative (CA) exons were the most common AS event type, followed by mutually exclusive exons (MXEs), retained introns (RIs), and alternative 5′ or 3′ splice sites (A5′/3′SSs). Principal-component analysis (PCA) of the top variable AS events clustered tumors based on MYC activity (Figure S1G). These 2,030 AS events provide an AS signature that defines MYC-active tumors (Figure 1C). Gene ontology of the spliced genes revealed an enrichment in RNA splicing and processing, breast cancer, epithelial-to-mesenchymal transition (EMT), and chemotaxis (Figures 1D and 1E). We compared matched breast tumors and adjacent normal tissues, identifying 1,287 differential AS events (Figure S1H and Table S1D), of which 346 overlapped with MYC-active breast tumors (Figure S1I), accounting for 17% of MYC-active AS events. Thus, a small subset of the AS events detected in MYC-active breast tumors are associated with changes in AS between normal and tumoral cell states, while others are more likely associated with a more aggressive MYC-driven state. Further, we identified 842 differential AS events between basal and non-basal breast tumors (Figure S1J and Table S1E), of which 499 overlapped with MYC-active breast tumors (Figure S1K), accounting for 25% of MYC-active AS events. In addition, comparing basal with non-basal MYC-active tumors revealed 672 AS events (Figure S1L and Table S1F), of which 341 overlapped with MYC-active breast tumors (Figure S1M), accounting for 17% of MYC-active AS events.
MYC-active tumors exhibit AS changes in known cancer genes, such as skipping of a CA exon in the HRAS oncogene (Figure 1F). This AS event produces a longer HRAS p21 tumorigenic isoform instead of the truncated HRAS p19 isoform, which may act as a tumor suppressor.42–44 This shift from p19 to p21 may contribute to MYC oncogenicity and is associated with MYC expression in prostate cancer.45 Another AS event was detected in BAG6, which is involved in apoptosis and ubiquitin-mediated metabolism.46 MYC-active tumors display increased skipping of exon 24 (Figure 1F) leading to a BAG6 isoform that lacks the protein domain required to keep newly synthesized proteins unfolded and protect cells from misfolded protein accumulation.46 Other spliced genes are involved in cellular organization (EHBP1), transcriptional regulation or chromatin remodeling (NCOR1, KAT2A), membrane trafficking and cell survival (RAB25), and RNA processing (PUM2, ARGLU1, NXF1) (Figure 1F). While some AS events are predicted to disrupt exons encoding known protein domains leading to protein isoforms with potentially distinct biological functions (HRAS, BAG6, NCOR1, PUM2, KAT2A), others introduce a premature termination codon and are predicted to decrease protein levels (RAB25, ARGLU1, NXF1). Some AS events do not disrupt the reading frame or any known domain (EHBP1), and therefore their functional roles are more challenging to predict.
SF co-expression modules correlate with MYC activity in breast tumors
To identify SFs regulating the above AS events, we performed differential gene expression analysis in MYC-active vs. MYC-inactive TCGA breast tumors and looked for changes in SF levels, using a list of 334 RNA binding proteins (RBPs) with an annotated role in AS.47–54 We identified 140 upregulated and 23 downregulated SFs in MYC-active breast tumors (Figure 2A and Table S2A). This represents a large fraction of the >300 known SFs,47–49,54 highlighting MYC’s role as a regulator of AS in cancer. Only 56 of the SFs differentially expressed in MYC-active breast tumors were also differentially expressed in breast tumors vs. adjacent matched normal tissue (Tables S2B and S2C).
Figure 2. SF co-expression modules correlate with MYC activity in breast tumors and across multiple cancer types.
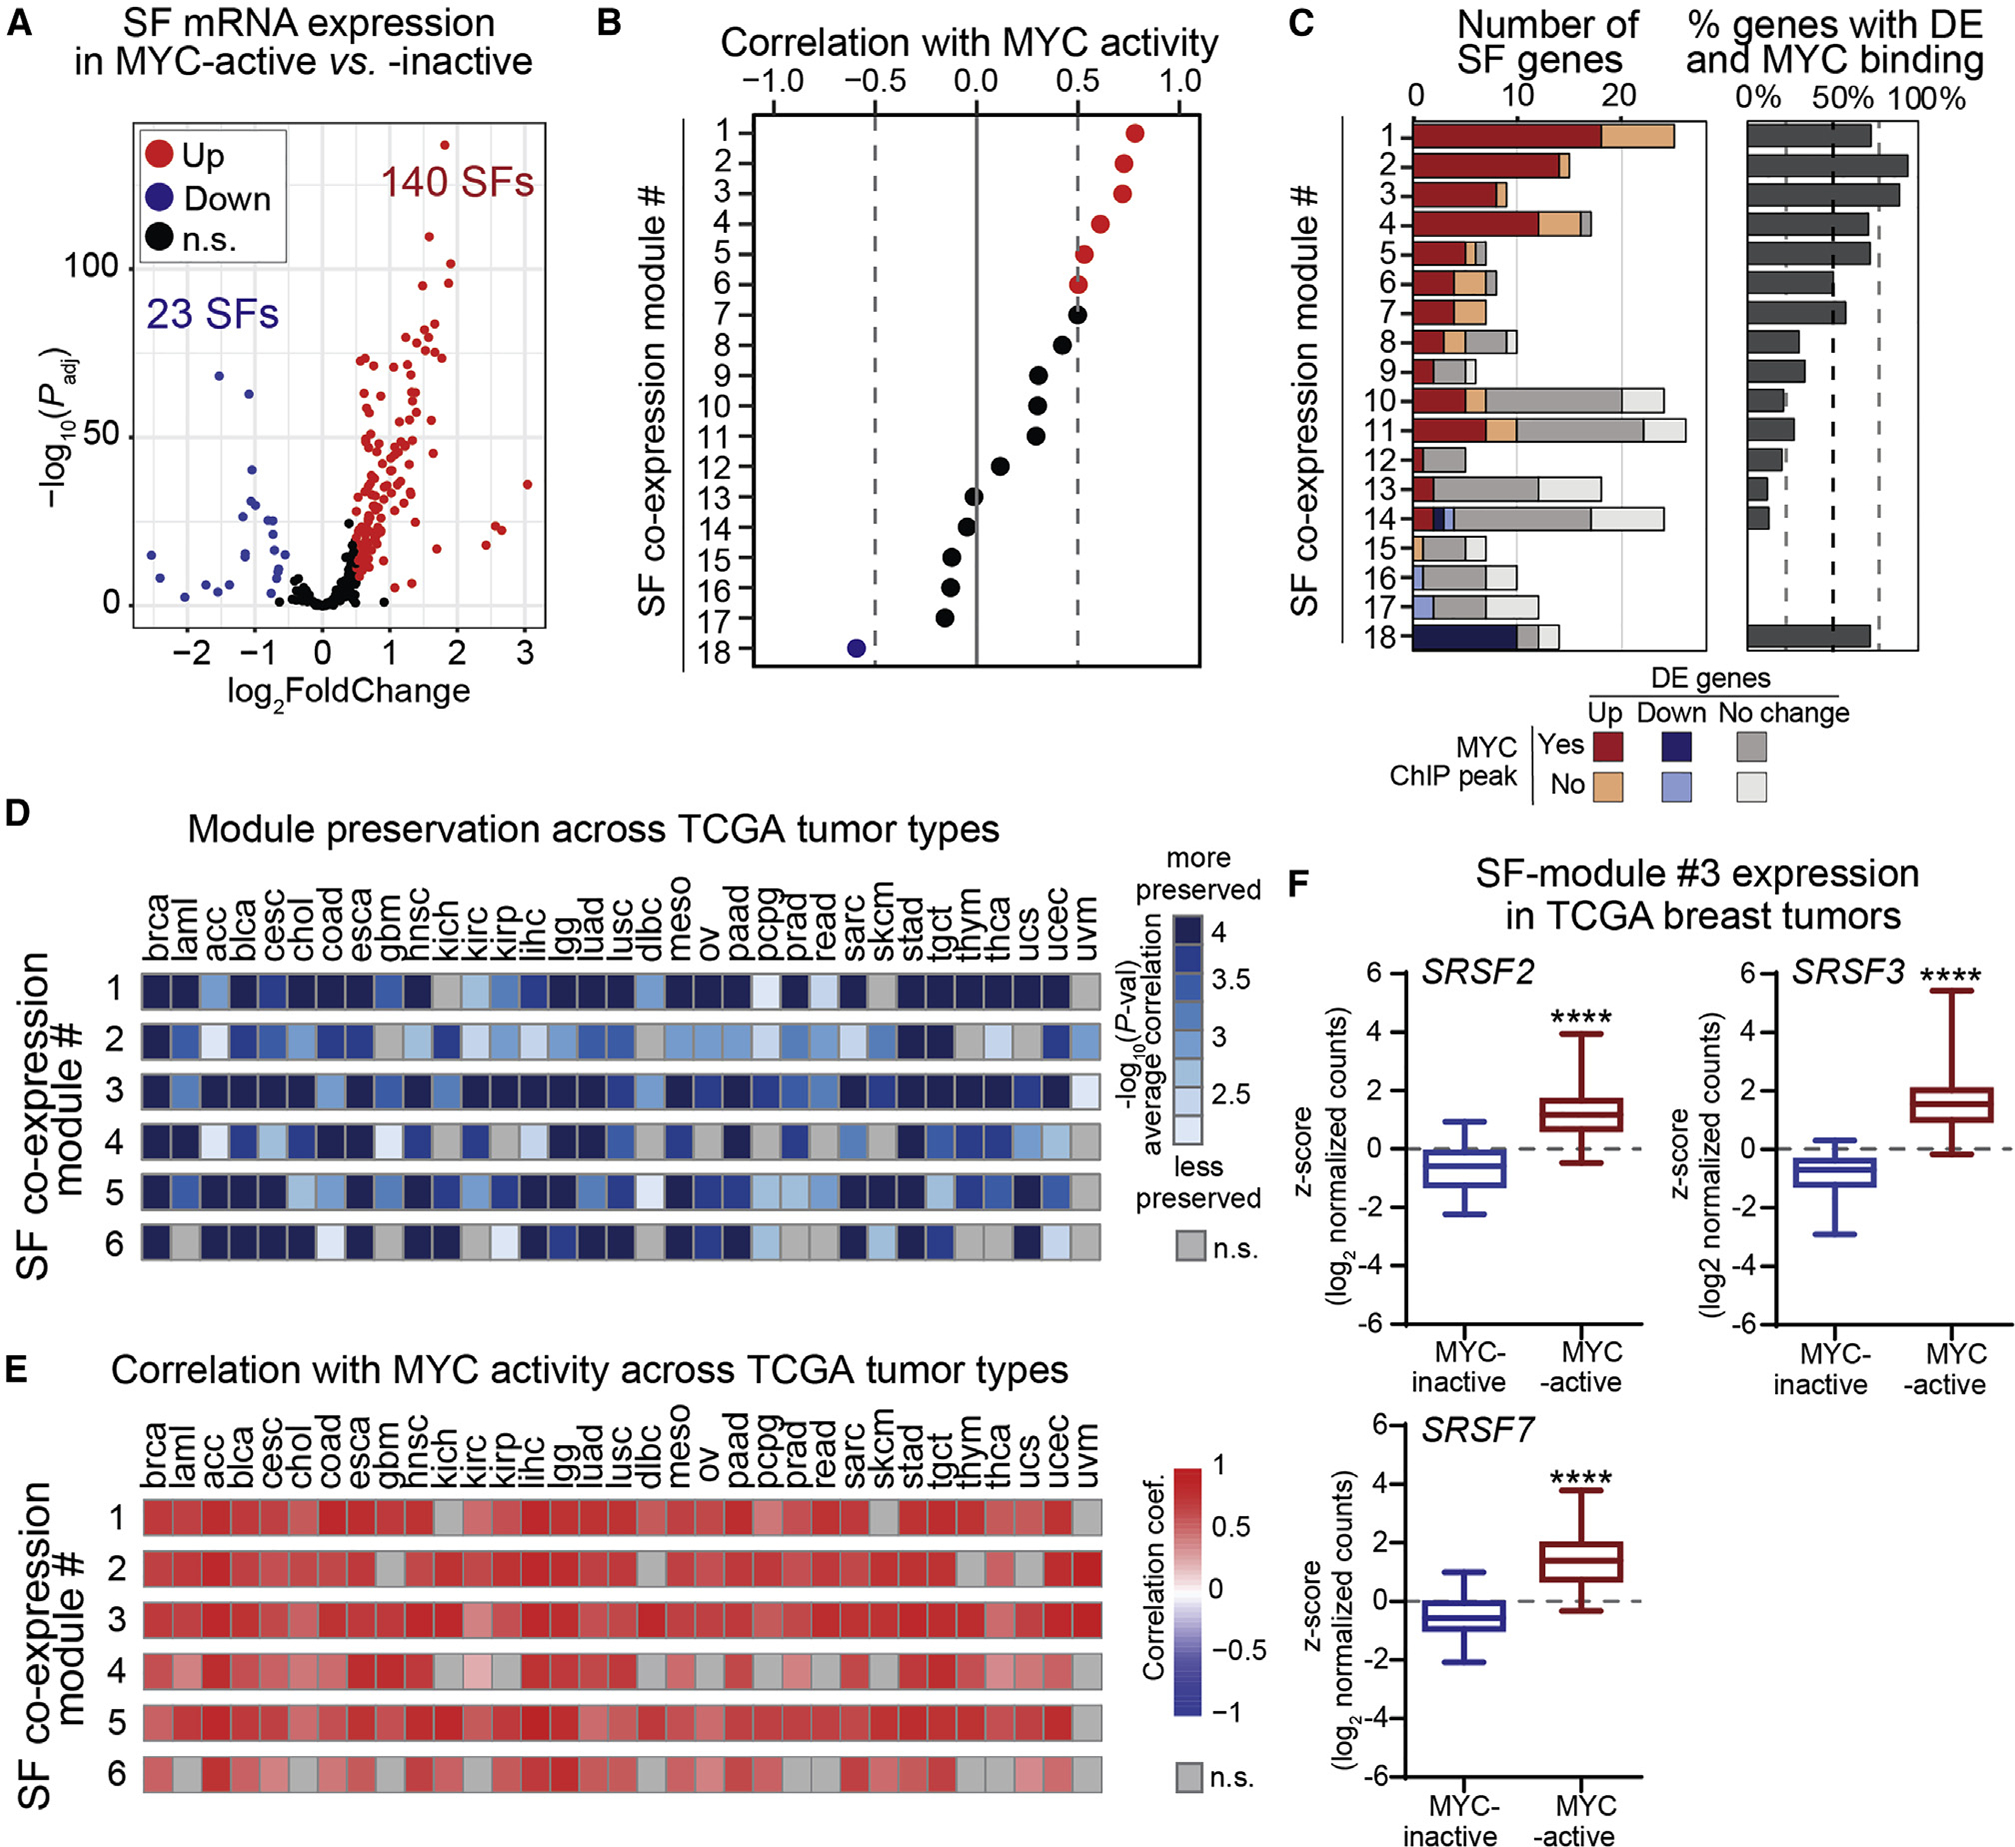
(A) SF differential expression in MYC-active vs. MYC-inactive TCGA breast tumors (log2FoldChange > |0.5|; FDR < 0.05).
(B) Correlation of SF-module expression with MYC activity in TCGA breast tumors.
(C) Gene number per SF-module, including differentially expressed (DE) genes in MYC-active tumors and genes with MYC promoter binding peaks in MCF-10A ChIP-seq data.23,47,55,56
(D) Preservation of the top six breast SF-modules across TCGA tumor types using NetRep.57
(E) Correlation co-efficient of the top six breast SF-modules with MYC activity across TCGA tumor types.
(F) Expression of pan-cancer SF-module hub genes in MYC-active vs. MYC-inactive TCGA breast tumors (median ± interquartile range; t test, ****p < 0.0001). See also Figure S2 and Table S2.
To define whether SFs function as a coordinated network regulated by MYC, we performed weighted gene correlation network analysis (WGCNA), which uses hierarchical clustering and co-expression networks to identify modules of co-expressed genes.58,59 WGCNA identified 18 groups of co-expressed splicing factors (SF-modules), ranging in size from 5 to 26 genes, in TCGA breast tumors (Figures 2B and 2C and Table S2D). Modules are generated using expression profiles across all samples, and therefore genes in different modules are less correlated than those within modules. For each SF-module we designated “hub” genes based on module membership correlation, a parameter of similarity in expression of a gene compared with the others in the module. All but modules 17 and 18 were more highly expressed in MYC-active tumors (Figure S2A). We next evaluated the correlation between SF-module expression and MYC activity. Expression of SF-modules 1–6 was positively correlated with MYC activity, while module 18 was negatively correlated (Figure 2B). The first three SF-modules displayed stronger correlation with MYC activity than any of four SFs directly regulated by MYC, i.e., TRA2β, SRSF1, HNRNPA1, and PRMT56–9 (Tables S2D and S2F).
To assess whether SF-module genes are direct targets of MYC, we mapped MYC chromatin immunoprecipitation sequencing (ChIP-seq) binding peaks in their promoter regions using ENCODE data from human mammary MCF-10A cells.47,55,56 More than 70% of SFs in modules 1–5 and 18 displayed changes in gene expression in MYC-active tumors and contained MYC binding peaks, suggesting they are direct targets of MYC (Figure 2C and Table S2D).
We next assessed the preservation and correlation of SF-module expression with MYC activity in 2,969 tumors from the Sweden Cancerome Analysis Network Breast (SCAN-B) cohort.60 Validating the TCGA results, SCAN-B basal-like tumors had higher MYC activity scores than less aggressive subtypes (Figure S2B). We then used NetRep to perform permutation tests to evaluate the preservation of TCGA co-expression modules in the SCAN-B cohort57 (see STAR Methods). All but one of the 18 TCGA SF-modules were preserved across SCAN-B tumors. Of these, 10 TCGA modules strongly correlated with MYC activity in the SCAN-B cohort (Figures S2C and S2D). In particular, SF-modules 1–6 were preserved and correlated with MYC activity in both cohorts (Figures 2D and S2E and Table S2E), suggesting MYC regulates their expression in breast cancer. We also repeated WGCNA analysis on SCAN-B tumors, revealing 23 SF-co-expression modules, ranging in size from 5 to 41 genes (Figure S2F). Of these, 11 SCAN-B modules positively correlated with MYC activity (r > 0.5) (Figure S2F). We found shared genes between 15 SCAN-B SF-modules and TCGA SF-modules, and several modules specific to either TCGA or SCAN-B (Figure S2G). Importantly, SRSF2, SRSF3, and SRSF7, the hub genes of TCGA SF-module 3, were found in SCAN-B module 1 (Figure S2G), demonstrating their co-expression across multiple cohorts.
In sum, MYC activity correlates with the expression of SF-modules, the majority of which are directly bound by MYC, and might regulate AS in MYC-active breast tumors.
SF-module pan-cancer preservation and correlation with MYC activity
We next assessed whether these MYC-regulated SF-modules were preserved in other TCGA tumor types, focusing on TCGA-derived SF-modules 1–6, which strongly correlated with MYC activity in both breast cancer cohorts. The most preserved, SF-module 3, was found across all 32 tested tumor types, and the least preserved, SF-module 6, in 23 other cancers (Figures 2D and S2H). All six SF-modules maintained a strong correlation with MYC activity in tumor types in which they were significantly preserved (Figure 2E), suggesting MYC regulates these modules across tumor types. The hub genes of pan-cancer SF-module 3, SRSF2, SRSF3, and SRSF7, are members of the SR protein family, a group of SFs often dysregulated in tumors.2,7,19,61–65 These SFs are each significantly upregulated in MYC-active tumors in both TCGA and SCAN-B breast cohorts (Figures 2F and S2I) and contain ChIP-seq MYC binding peaks (Table S2B).
MYC activation induces AS changes and upregulates the pan-cancer SF-module in mammary cells
We next aimed to experimentally validate that the SF-modules preserved across cancers and AS events detected in TCGA tumors are regulated by MYC. To study the effects of MYC activation in a controlled inducible model, we used non-transformed human mammary epithelial MCF-10A cells expressing MYC fused to a portion of the estrogen receptor (MYC-ER).66,67 Addition of 4-hydroxytamoxifen (4-OHT) promotes translocation of the MYC-ER protein into the nucleus and induces transcription of MYC target genes. We assessed MYC activation by measuring the protein levels of the MYC targets SRSF1 and TRA2β over time (Figures S3A and S3B).7,18 Based on these results, we performed RNA-seq on 3D-grown MCF-10A MYC-ER cells at 0, 8, and 24 h after MYC activation. To control for 4-OHT-induced effects, cells lacking the MYC-ER protein were treated with 4-OHT. Based on gene expression, samples clustered by MYC-activation time point, whereas 4-OHT had minor effects in control cells (Figure S3C). MYC activation was confirmed using the expression of known MYC target genes35 (Figure S3D).
MYC activation altered the expression of specific SFs in MCF-10A cells, including 138 and 119 upregulated SFs at 8 and 24 h, respectively, and 28 and 21 downregulated SFs (Figures 3A and 3B, Tables S3A and S3B). One hundred twenty-one SFs were differentially expressed in the same direction at 8 and 24 h (Figure S3E). Eighty-seven SFs were differentially expressed in MYC-active MCF-10A cells and tumors in the same direction (Figure 3C). At least 50% of genes in TCGA SF modules 1–6, the modules most associated with MYC activity, were upregulated in MYC-active MCF-10A cells, and the majority contained MYC ChIP-seq promoter peaks in MCF-10A cells (Figure 3D). Conversely, <50% of genes in SF-modules 12–17, the modules with weaker correlation with MYC activity, were upregulated in MYC-active MCF-10A cells. Module 18, which was anti-correlated with MYC activity in TCGA tumors, had 65% genes downregulated. Thus, we saw a remarkable overlap in SFs associated with MYC activity between our in vitro model and TCGA breast tumors. Given the pan-cancer preservation and correlation of SF-module 3 with MYC activity, we further investigated whether these SFs are directly induced by MYC and regulate AS in a cooperative manner. Pan-cancer SF-module 3 hub genes exhibit MYC ChIP-seq promoter binding peaks (Figure S3F and Table S2B), and their expression increases after MYC activation in MCF-10A cells (Figure 3E).
Figure 3. MYC activation induces changes in SF expression and AS in human mammary epithelial cells.
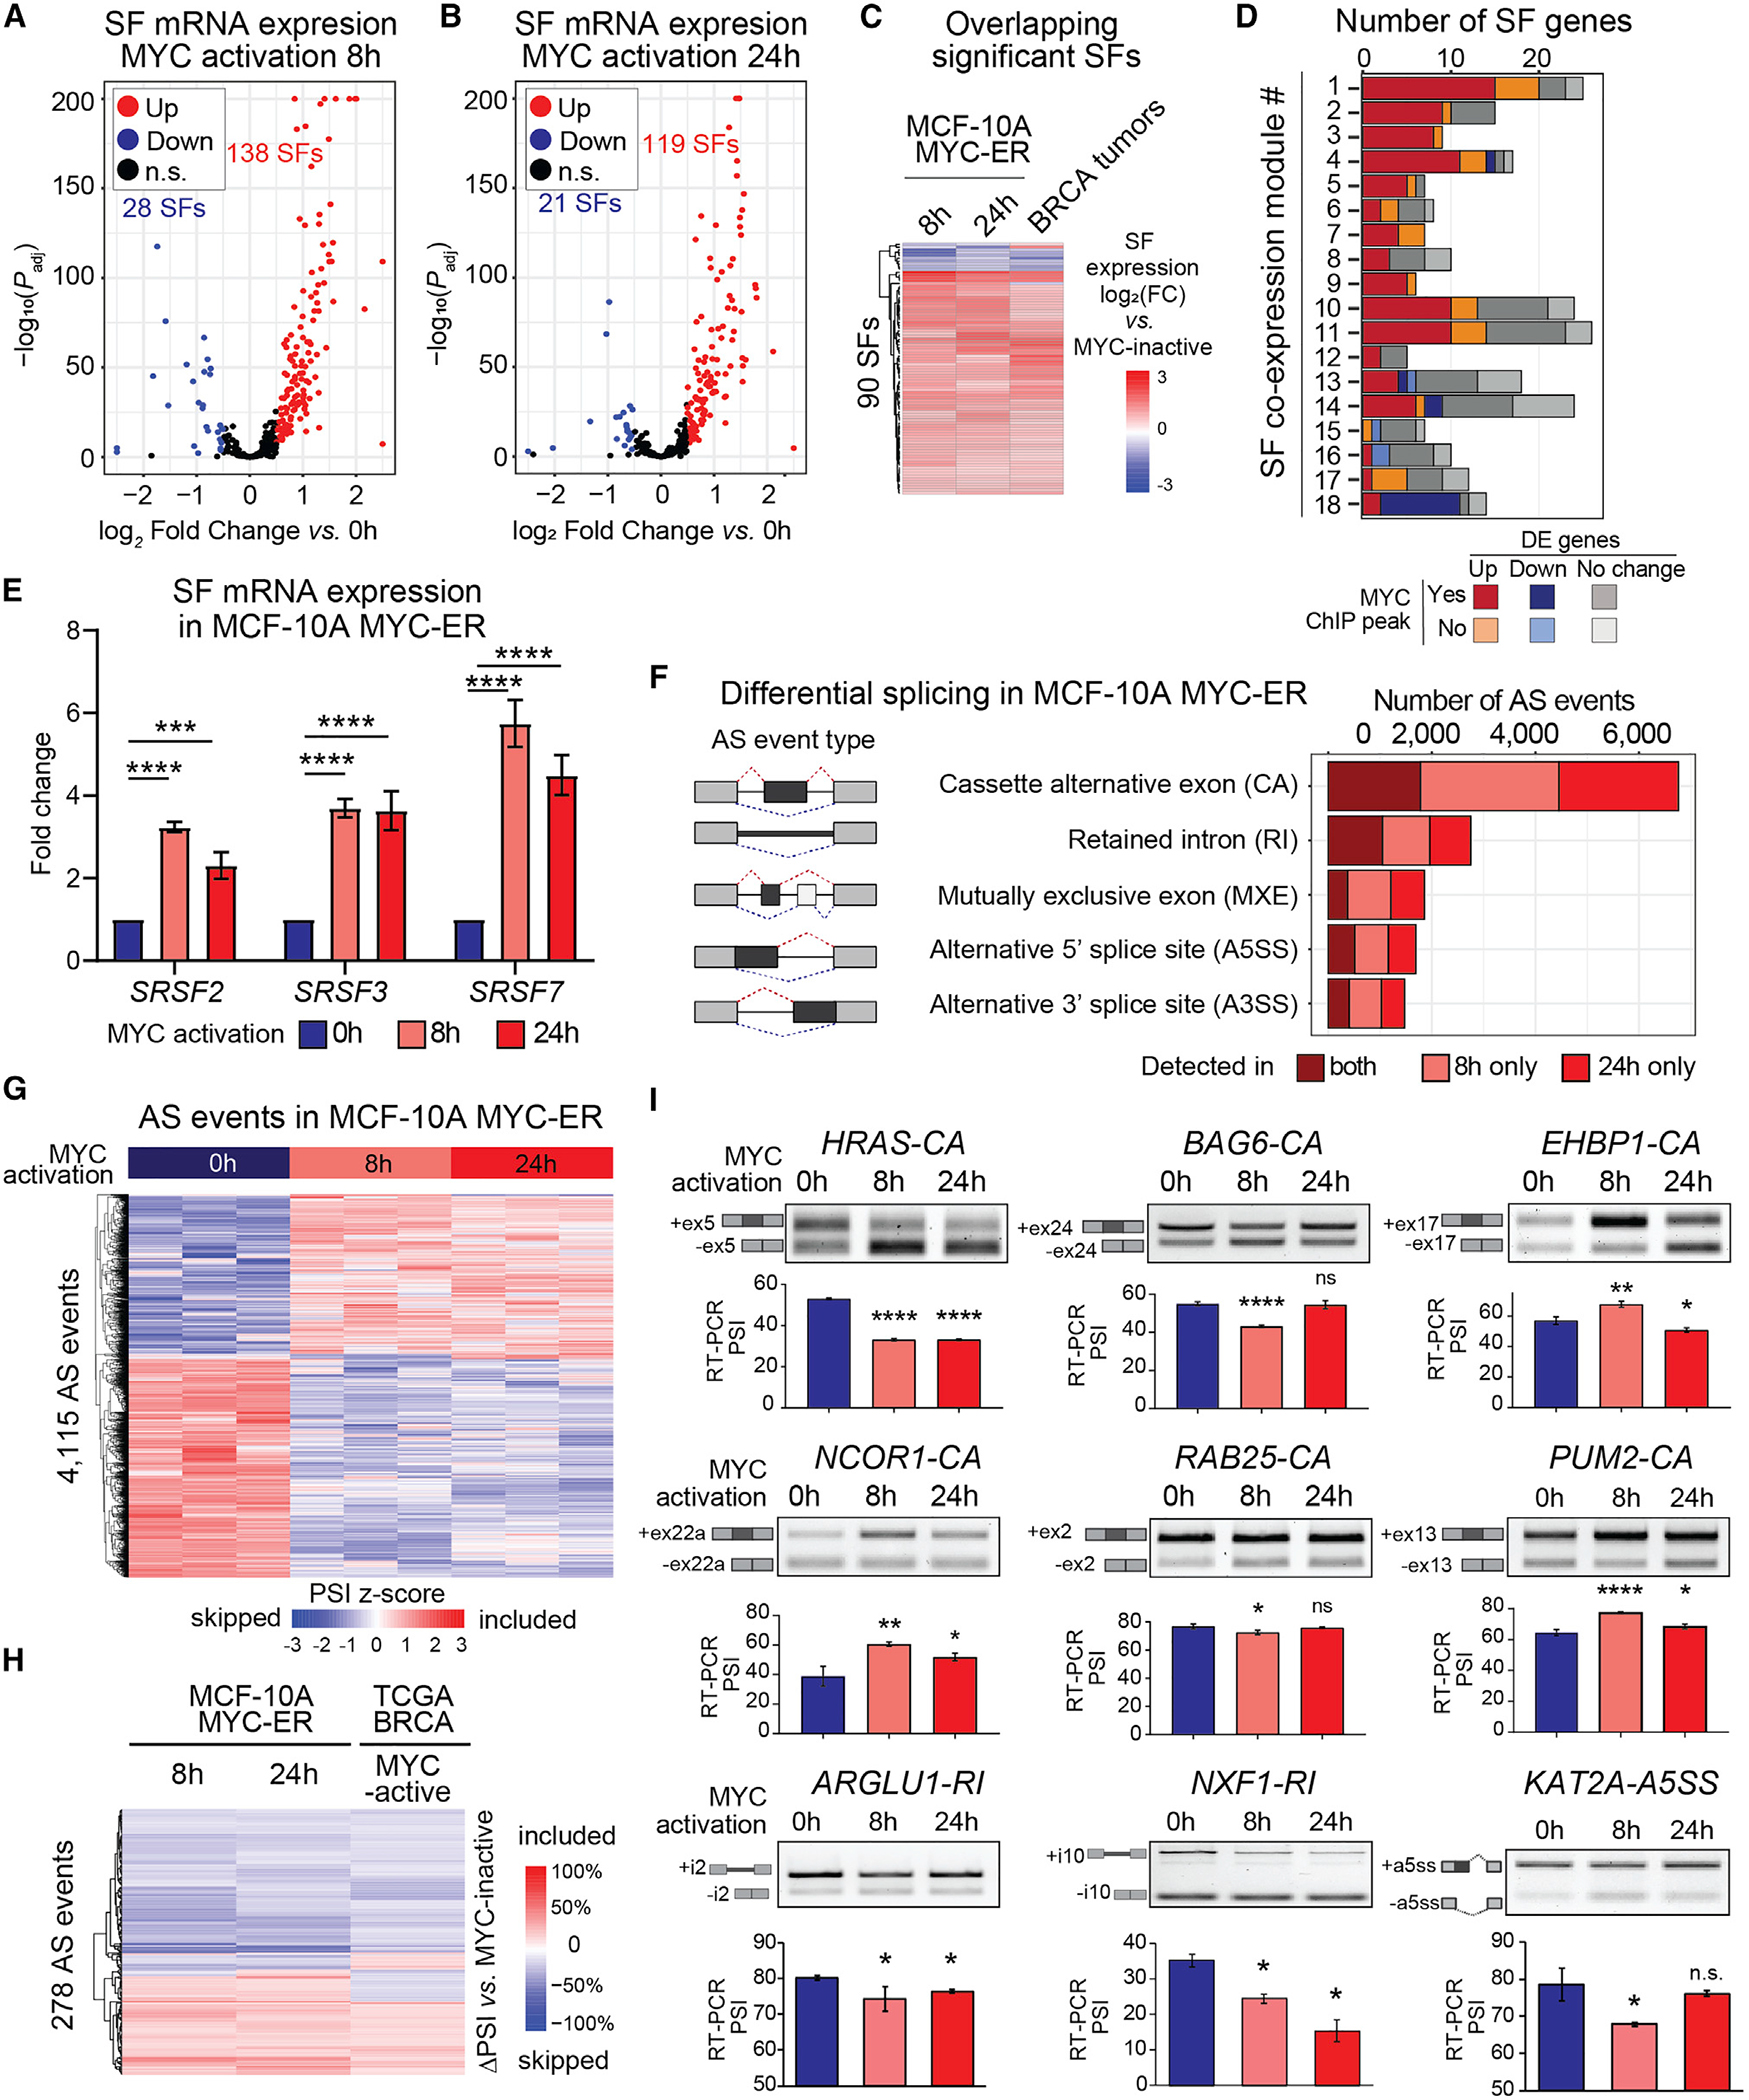
(A and B) SF differential expression in MCF-10A MYC-ER cells at 8 h (A) or 24 h (B) vs. 0 h after MYC activation (n = 3; log2FoldChange > |0.5|; FDR < 0.05).
(C) Differentially expressed (DE) SFs shared across MYC-active MCF-10A cells and TCGA breast tumors (log2FoldChange > |0.5|; FDR < 0.05).
(D) Gene number per SF-module in MYC-active MCF-10A, including DE genes and genes with MYC promoter binding peaks in MCF-10A ChIP-seq data.23,47,55,56
(E) mRNA expression (qPCR) of pan-cancer SF-module hub genes in MYC-active MCF-10A cells, normalized to 0 h and GAPDH (n = 3; mean ± SD; two-way ANOVA; ***p < 0.001, ****p < 0.0001).
(F) AS events in MYC-active MCF-10A cells (n = 3; |ΔPSI| ≥ 10%; FDR < 0.05).
(G) Hierarchical clustering of AS events in MYC-active MCF-10A cells (n = 3/condition; |ΔPSI| ≥ 10%; FDR < 0.05). Rows represent PSI normalized across samples per AS event.
(H) Overlapping AS events in MYC-active MCF-10A cells and TCGA breast tumors (|ΔPSI| ≥ 10%; FDR < 0.05).
(I) RT-PCR validation of MYC-regulated AS events in MYC-active MCF-10A cells. Representative gels show isoform structures with AS quantified as PSI from RT-PCR (n = 3; mean ± SD; t test, *p < 0.05, **p < 0.01, ****p < 0.0001, n.s., not significant). Gene names and event types are indicated. See also Figure S3 and Table S3.
We performed differential AS analysis comparing MYC-active (8 or 24 h) with inactive (0 h) MCF-10A MYC-ER cells. We identified >9,000 AS events after 8 h of MYC activation and >8,000 AS events after 24 h, with ≥10% ΔPSI and FDR < 0.05 cutoffs (Figure 3F, Tables S3C and S3D). Approximately 40% of the AS events detected at 8 h were detected at 24 h, the majority of which changed in the same direction (i.e., included or excluded) (Figures 3G and S3G, Tables S3E and S3H). Most MYC-induced AS events were CA events, followed by RI and MXE. Spliced genes at 8 or 24 h of MYC activation were enriched in RNA processing and cancer-related pathways (Figures S3H–S3K). Finally, 706 AS events were detected in both MYC-active MCF-10A cells at 8 or 24 h and MYC-active breast tumors (Tables S3F–S3H), including 278 events detected in all three datasets, of which >80% changed in the same direction (Figure 3H).
We validated by RT-PCR 17 AS events in MCF-10A MYC-ER cells (Figures 3I and S3L) affecting genes involved in cancer-related processes, e.g., cellular organization (EHBP1), transcriptional regulation or chromatin remodeling (NCOR1, KAT2A), trafficking and survival (RAB25, TEPSIN), RNA processing (PUM2, ARGLU1, NXF1), signal transduction (APLP2, FAM126A, HPS1), metabolism (BTN2A1, LSR), cell cycle (CENPX), or autophagy (WDR45). Of these, nine were also detected in TCGA MYC-active breast tumors (Figure 1F), including skipping of HRAS CA exon.
Pan-cancer SF-module hub genes control AS of MYC-regulated exons
We next determined which MYC-regulated AS events detected in both MYC-active MCF-10A cells and TCGA breast tumors are directly regulated by pan-cancer SF-module hub genes SRSF2, SRSF3, and SRSF7. Although SR proteins evolved from a common ancestor, exhibit motif similarities, and share some targets, they also regulate distinct sets of AS events.3,7,49,68 Using RBPmap,69 we mapped known SRSF2, SRSF3, and SRSF7 binding motifs23,50,69–72 (see STAR Methods) in CA exons spliced at 8 or 24 h in MYC-active MCF10A cells. SRSF2 or SRSF3 motifs within the CA exon correlated with an increased probability of exon inclusion or skipping, in a position-dependent manner. SRSF7 motifs in the upstream and downstream introns within 50 nt of the CA exon, but not in the CA itself, correlated with an increased probability of exon inclusion or skipping, in a position-dependent manner (Figures S3M and S3N).
We then mapped SRSF2, SRSF3, and SRSF7 binding motifs in six of the validated MYC-regulated AS events, revealing that all exhibit motifs in either the CA exon or the surrounding introns (Figures 4A–4C and S4A). We found evidence of overlapping and non-overlapping motifs for each event, suggesting that SRSF2, SRSF3, and SRSF7 regulate AS of these exons by binding simultaneously, by competing at overlapping motifs, or by a combination of both. To experimentally define cooperative or antagonistic effects, we co-transfected one, two, or all three SF-encoding plasmids (Figures 4D–4F, S4B, and S4C). We uncovered AS events regulated in the same direction by multiple SFs, e.g., in HRAS. Expression of SRSF2 alone decreased HRAS exon inclusion, while SRSF3 had a milder effect, and SRSF7 had no effect vs. control (Figure 4D). Co-expression of SRSF2 together with SRFS7 promoted more skipping than either SF alone, while SRSF2 and SRSF3 together had no stronger effect than either SF alone. Co-expression of all three SFs led to the strongest HRAS exon skipping. Conversely, SR proteins can also regulate AS events in opposite directions, e.g., in BAG6 and EHBP1 (Figures 4E and 4F). While SRSF3 expression decreased BAG6 exon inclusion, SRSF2 or SRSF7 increased inclusion vs. control (Figure 4E). Co-expression of SRSF3 and SRSF7 decreased exon skipping vs. SRSF3 alone. In the case of EHBP1, exon inclusion was positively regulated by SRSF7 and negatively by SRSF3, while SRSF2 had no effect vs. control (Figure 4F). Co-expression of SRSF3 and SRFS7 decreased exon inclusion vs. SRSF3 alone (Figure 4F). These results demonstrate that SR proteins can cooperate to regulate specific AS events, e.g., SRSF2 and SRSF3 in HRAS, or compete, e.g., SRSF3 and SRSF7 in BAG6 and EHBP1.
Figure 4. MYC-regulated AS events display binding motifs for and are regulated by pan-cancer SF-module hub genes.
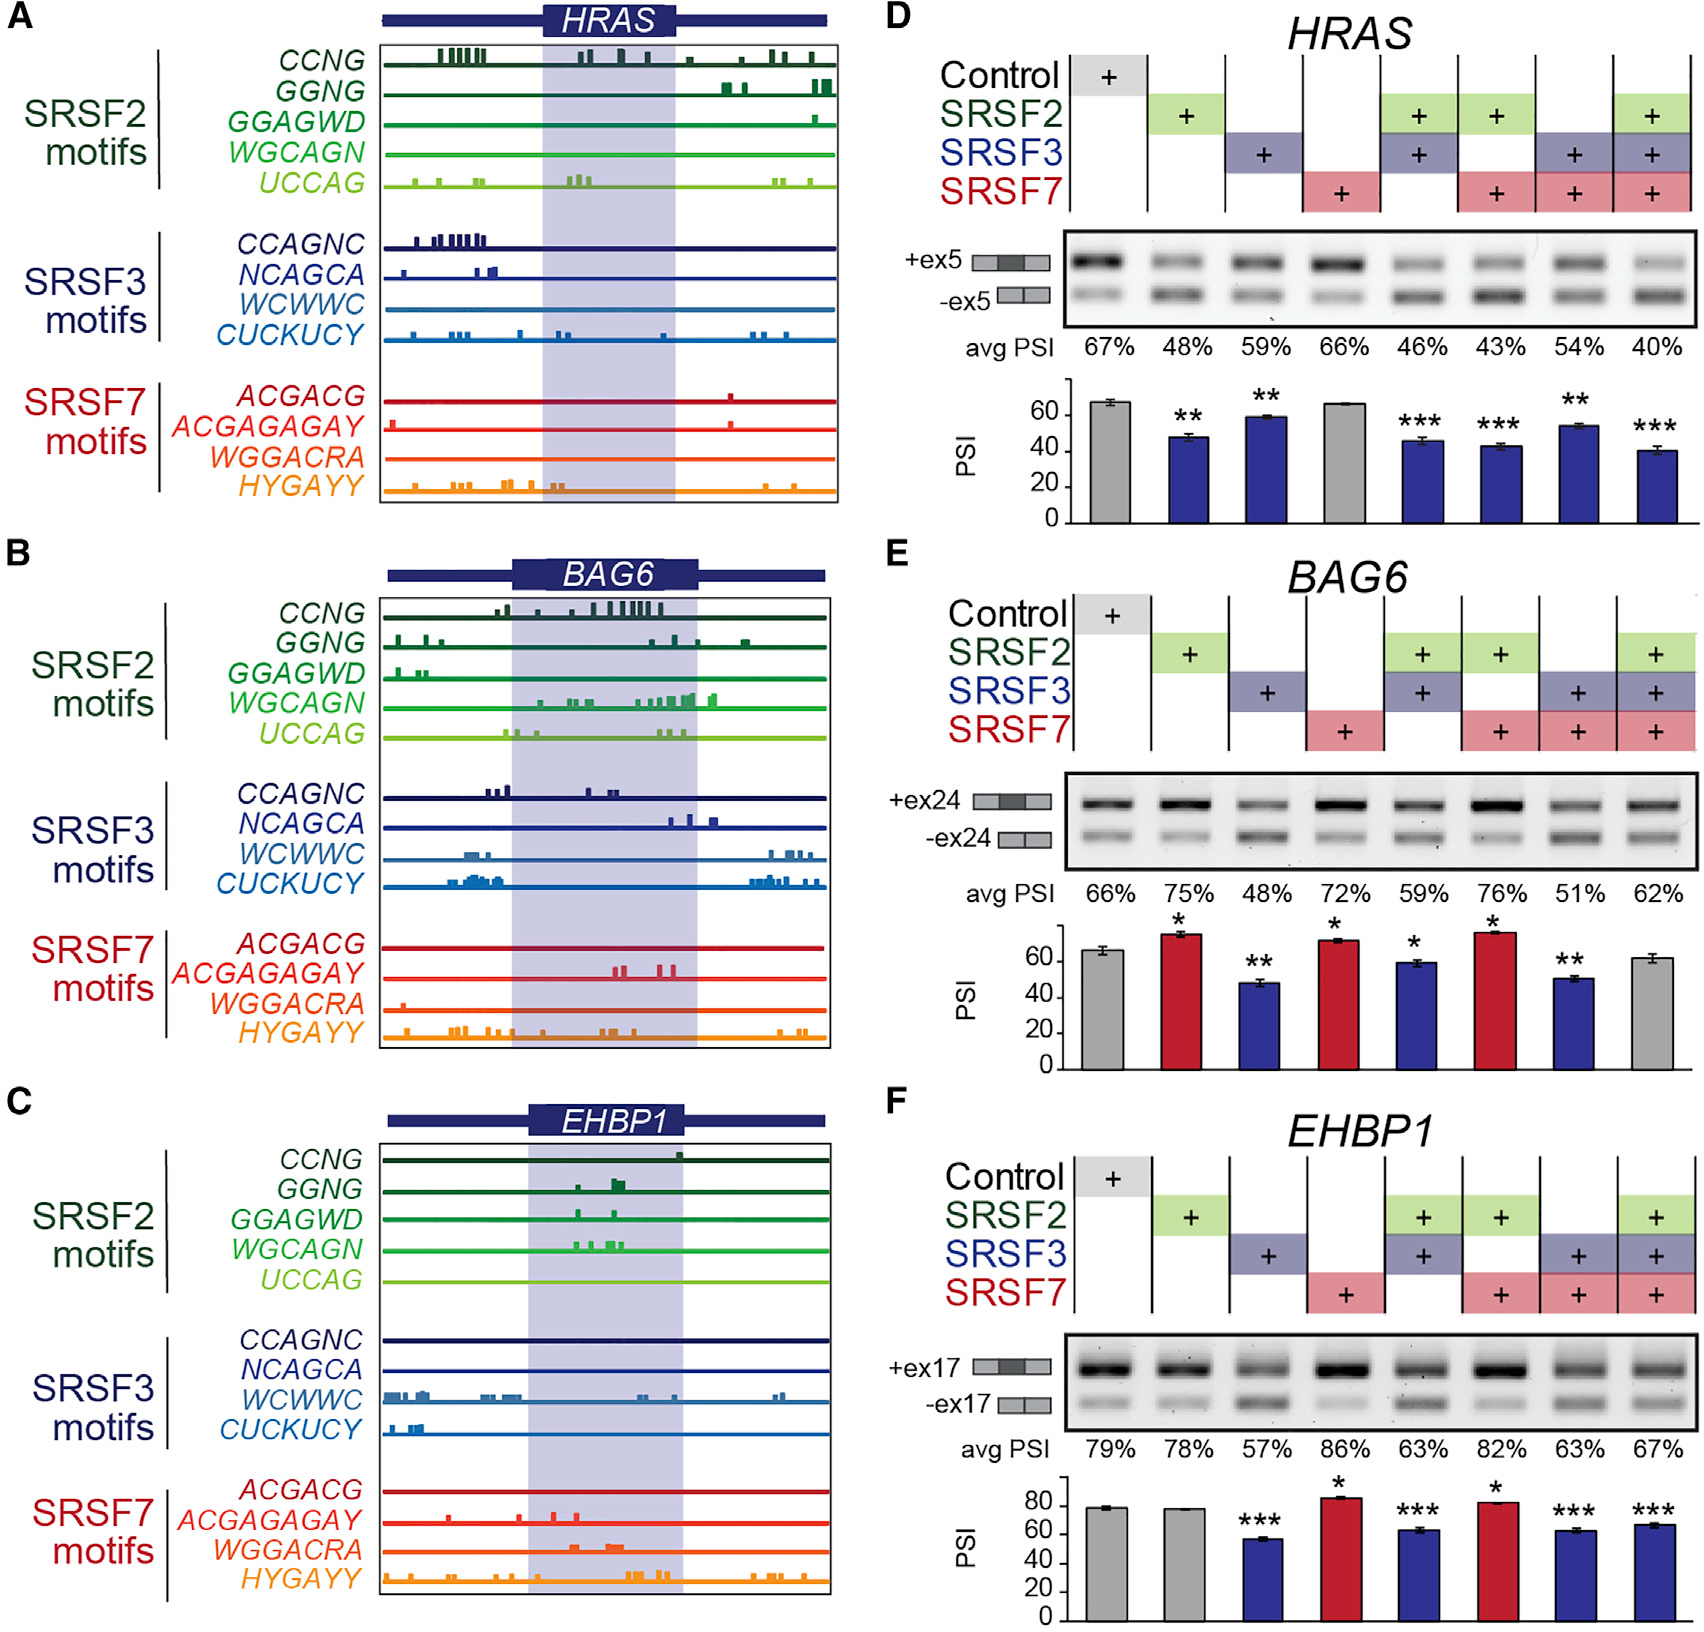
(A–C) Predicted binding motifs for SRSF2, SRSF3, and SRSF7 in spliced sequences (boxed) and surrounding introns (100 bp) of MYC-regulated AS events.
(D–F) MYC-regulated AS events in HEK293 cells transfected with the coding sequence of one, two, or three SFs, or control plasmids, measured by RT-PCR. Representative gels show isoform structures with AS quantified as PSI from RT-PCR (n = 3; mean ± SD; t test, *p < 0.05, **p < 0.001, ***p < 0.0001). See also Figures S4 and S5.
We mapped cis elements regulating HRAS AS using CRISPR-guided artificial SFs (CASFx), which leverage the RNA-targeting activity of catalytically inactive RfxCas13d (dCasRx) fused to an arginine/serine rich (RS) domain, which confers AS activity73,74 (Figures S4D and S4E). We designed overlapping 22-nt-long guide RNAs (gRNAs) that target CASFx to HRAS exon 5 and the surrounding introns (Figure S4F). First, using a catalytically inactive dCasRx without an RS domain, we demonstrated that exon 5 and upstream intron 4 contain regulatory elements that, when blocked, increased exon skipping (gRNAs i2–i4, e1–e4, and i6), whereas the downstream intron 5 contains regulatory elements that, when blocked, increased inclusion (gRNAs i6, i10) (Figures S4F and S4G). Using dCASRx-SRSF2, SRSF3, or SRSF7, we compared their positional effects within the HRAS exon and surrounding introns. Binding of SRSF2 at position e3, e6, or i6 increased exon skipping vs. dCasRx alone (Figures S4F and S4G). Conversely, binding of SRSF3 at position e1 or e2 decreased exon skipping, whereas binding in the downstream intron (gRNAs i5, i6, i7, i10) increased skipping (Figures S4F and S4G). Finally, binding of SRSF7 within the CA exon (gRNAs e3, e6) has similar effects on skipping compared with SRSF2, whereas its binding within the downstream intron (gRNAs i5, i6, i7) has similar effects compared with SRSF3 (Figures S4F and S4G). In sum, our analysis uncovers splicing cis regulatory elements within the HRAS exon that act as negative regulators, and elements in the downstream intron that act as positive regulators, revealing distinct positional effects for SRSF2, SRSF3, and SRSF7.
Finally, we determined if MYC-regulated AS events are controlled by MYC-regulated pan-cancer SF-module 3 in established breast cancer cells. Using RNA-seq data from the Cancer Cell Line Encyclopedia (CCLE),75 we ranked breast cancer cell lines by MYC activity and selected MDA-MB231 cells as a representative MYC-active triple-negative breast cancer cell line (Figure S5A). We generated stable cell lines expressing a tetracycline-regulated transactivator (rTTA3), along with doxycycline (DOX)-inducible shRNAs targeting each of the SF-module 3 hub genes (Figures S5B and S5C). We evaluated the effects of SF knockdown (KD) in MDA-MB231 cells on AS of MYC targets previously identified in breast tumors. KD of SRSF3, but not SRSF2 or SRSF7, increased BAG6 exon inclusion (Figure S5D), thus mimicking the effects of low MYC activity detected in TCGA tumors and MCF-10A cells and promoting the reverse pattern observed in SRSF3-overexpressing cells. Reduced EHBP1 exon inclusion, as detected in MYC-inactive cells and tumors, was triggered by SRSF7 KD, while SRSF3 KD increased exon inclusion of EHBP1 (Figure S5D). SRSF2 or SRSF3 KD decreased NCOR1 exon inclusion, while SRSF7 KD promoted exon inclusion (Figure S5D). Finally, SRSF2 or SRSF7 KD promoted PUM2 exon inclusion, while SRSF3 KD promoted skipping (Figure S5D). None of the KDs significantly affected HRAS splicing, which at baseline is mostly skipped in these established cancer cells (Figure S5D).
Together, our data from SF overexpression and KD suggest that MYC-associated AS events are regulated by pan-cancer SF-module hub genes. Their effects on targets are dependent on the expression level of individual SFs as well as their coordinated ability to regulate AS.
Pan-cancer SF-module hub genes control breast cancer organoid growth and invasiveness
We next evaluated the effect of SF KD in 3D-grown MDA-MB231 cells. KD of either SRSF3 or SRSF7 significantly decreased both the size of organoids and the presence of invasive cellular projections (Figure 5A), with the shRNA targeting SRSF3 exhibiting the strongest phenotype. In addition, both SRSF3 and SRSF7 KD slightly decreased cell proliferation, while SRSF2 had no effect (Figure S5E). SRSF2 KD had minimal effects on measured cellular phenotypes, possibly due to a milder KD efficiency (Figure S5B). Overall, KD of either SRSF3 or SRSF7 mimicked the effect of MYC KD (Figures 5A and S5E). Validating these findings using a second shRNA per target revealed an shRNA dose-dependent effect on organoid size (Figures S5B, S5C, and S5F).
Figure 5. Pan-cancer SF-module hub genes control breast cancer organoid size and invasiveness.
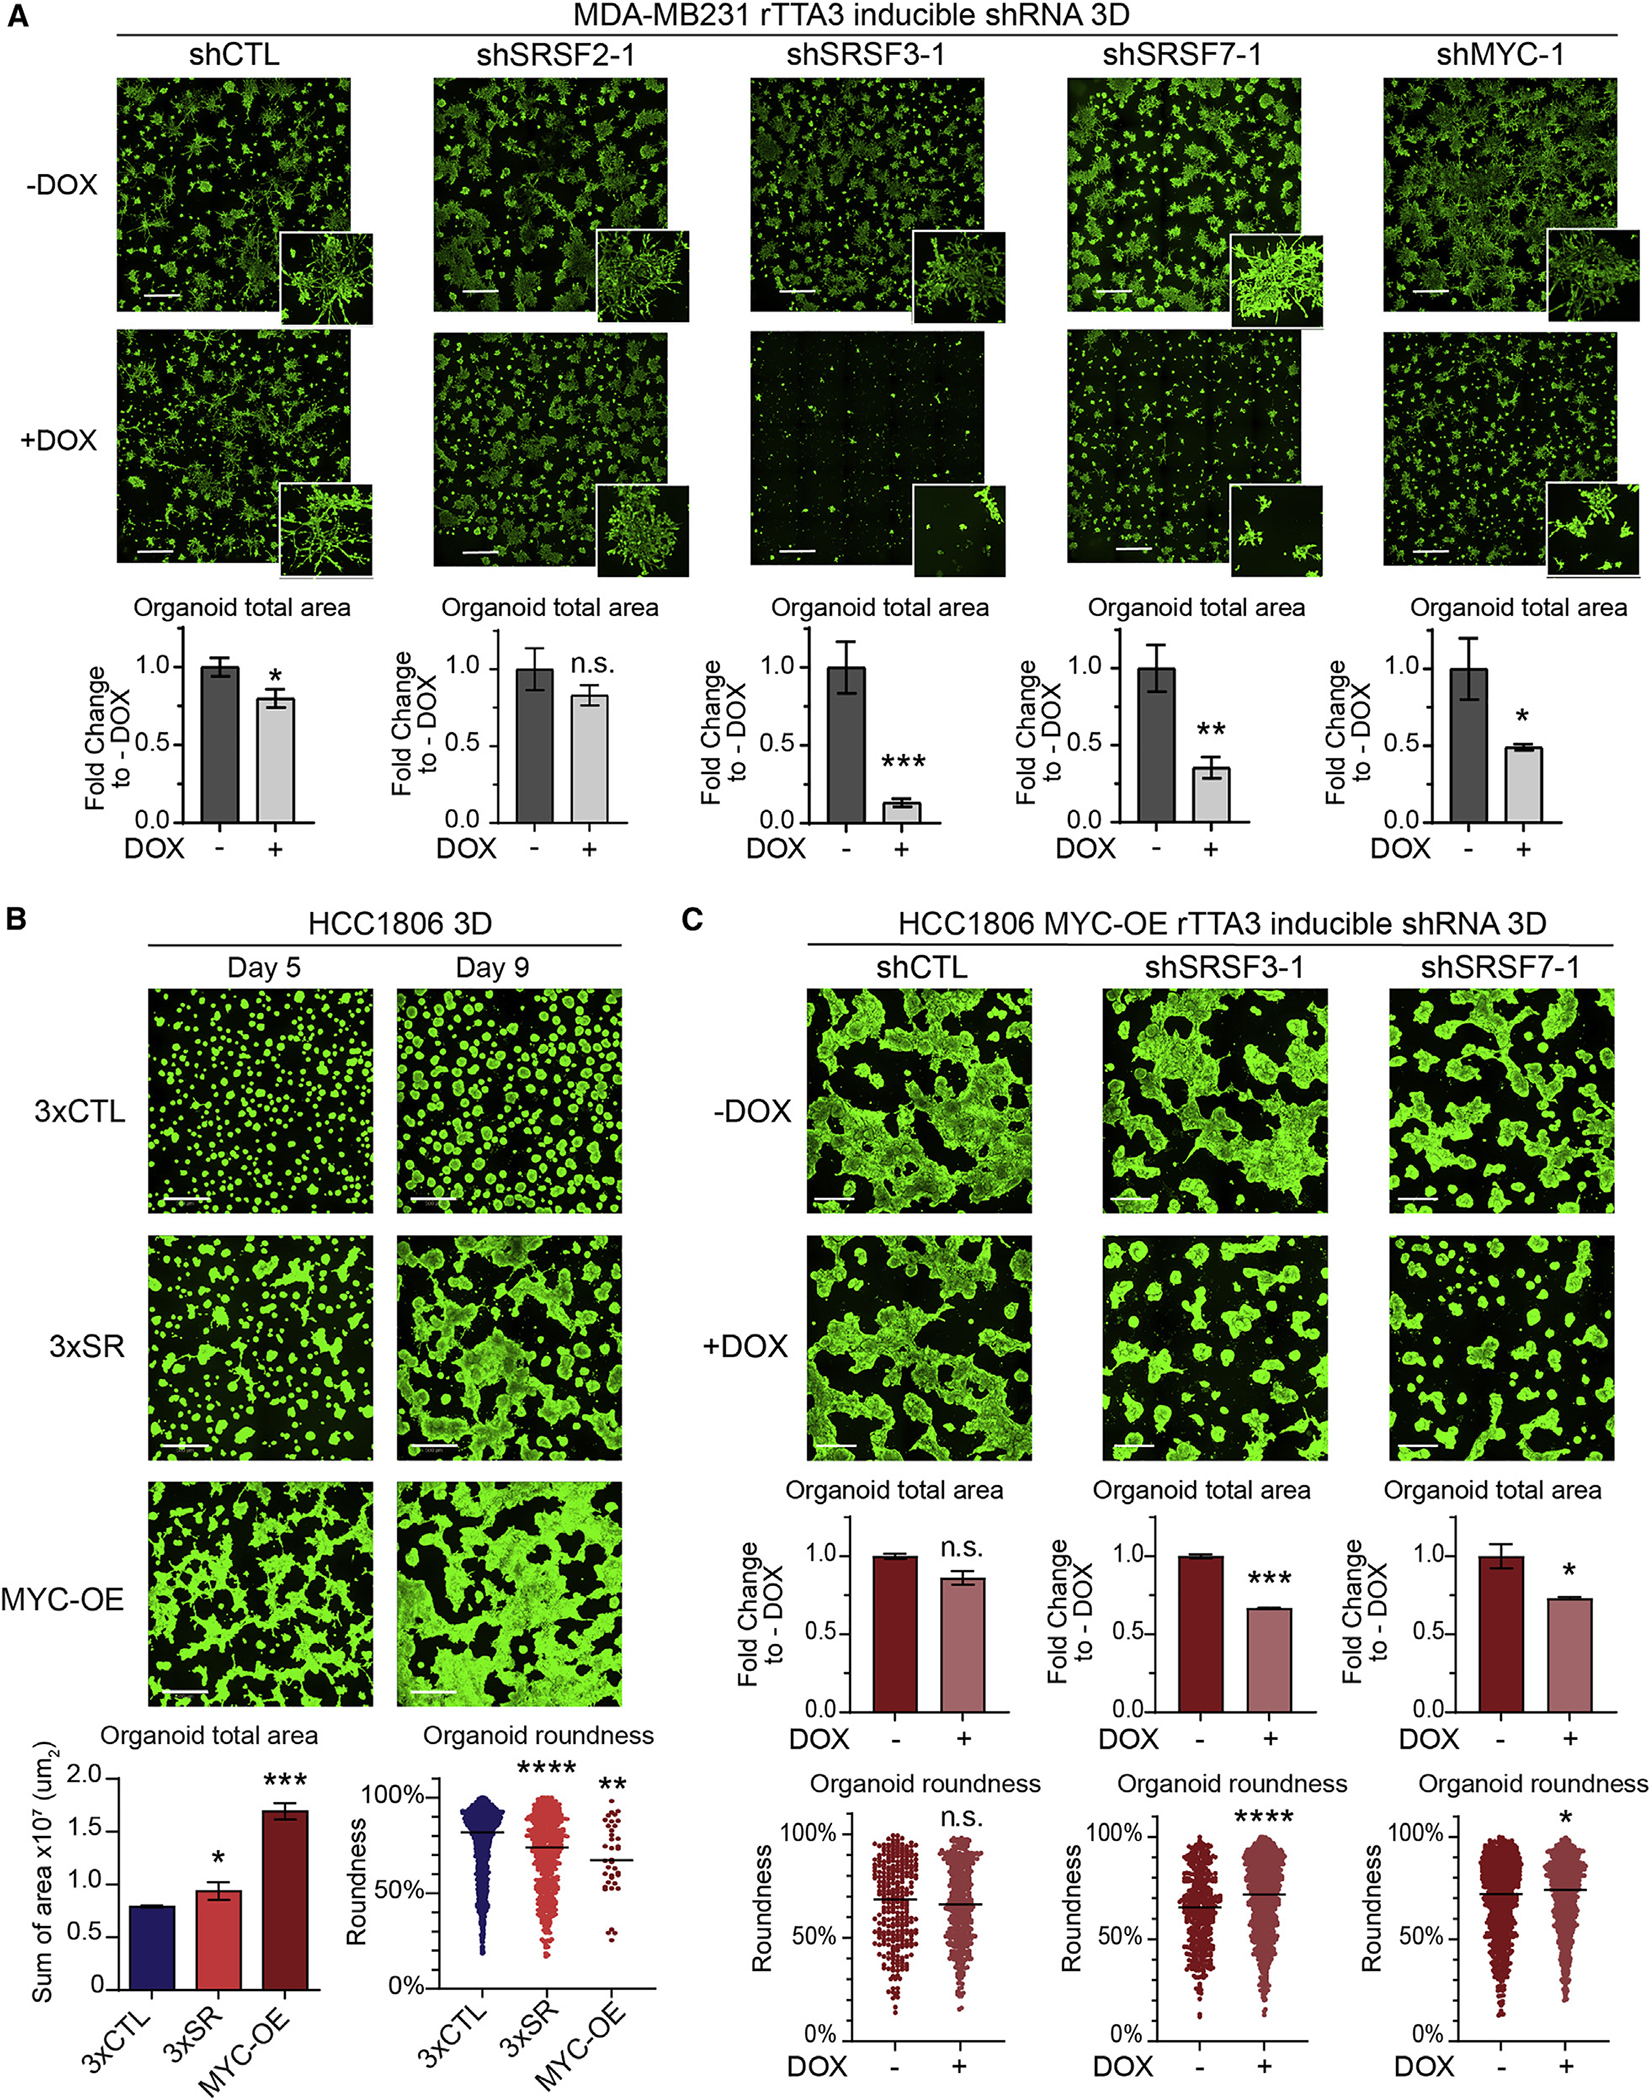
(A) Representative images of 3D-grown MDA-MB231-rTTA3 cells expressing DOX-inducible shRNA targeting SRSF2, SRSF3, SRSF7, MYC, or control (CTL) stained with calcein (scale bars, 1 mm) and total organoid area quantified at day 9 (n = 3, 25 fields/replicate; mean ± SD; t test, *p < 0.05, **p < 0.01, ***p < 0.0001; n.s., not significant). Insets show a zoomed-in view of representative organoids morphology.
(B) Representative images of 3D-grown 3×CTL, 3×SR, and MYC-OE HCC1806 organoids at days 5 and 9 stained with calcein (scale bars, 500 μm) and total organoid area (n = 3, 15 fields/replicate; mean ± SD; t test, *p < 0.05, ***p < 0.001) and roundness (n = 3, 15 fields/replicate; median; t test, **p < 0.01, ****p < 0.0001) quantified at day 9.
(C) Representative images of 3D-grown MYC-OE-rTTA3 HCC1806 organoids expressing DOX-inducible shRNA targeting SRSF3, SRSF7, or CTL stained with calcein (scale bars, 500 μm), and total organoid area (n = 2–3, 25 fields/replicate; mean ± SD; t test, *p < 0.05, ***p < 0.001; n.s., not significant) and roundness (n = 2–3, 25 fields/replicate; median; t test, *p < 0.05, ****p < 0.0001) quantified at day 9. See also Figures S5 and S6.
We next assayed the functional consequences of overexpressing all three hub SFs together in a representative MYC-inactive breast cancer cell line, HCC1806 (Figure S5A). We overexpressed: (1) the coding sequences for all three SFs, i.e., SRSF2, SRSF3, and SRSF7 (3×SR); (2) the corresponding three empty vector controls (3×CTL); or (3) the coding sequence of MYC (MYC-OE). The 3×SR cell line exhibited ≥1.5-fold increase in expression of each of the SF transcripts (Figure S6A), which is within the levels of SF overexpression in MYC-active breast tumors (Figures 2F and S2I, Table S2A) and MCF-10A cells (Figure 3E).
We characterized the phenotypes of 3×SR cells in 2D and 3D cultures. Co-overexpression of SRSF2, SRSF3, and SRSF7 did not confer any proliferative advantage to HCC1806 cells in 2D (Figure S6B). In fact, 3×SR cells grew slower than 3×CTL, which could reflect cell stress from overexpressing three SFs. However, 3×SR and MYC-OE were more invasive than 3×CTL cells in cell migration assays in 2D (Figure S6C). The 3×SR and MYC-OE cells exhibited changes in cell morphology, including increased appearance of actin-rich filopodia (Figure S6D), consistent with increased migration. In 3D growth assays, 3×SR and MYC-OE cells formed larger and less round organoids vs. 3×CTRL (Figure 5B). Since the 3×SR HCC1806 cell line was generated using successive infections of plasmids, we evaluated the effects of each sequential SF and found that each increased the invasive phenotype compared with control, suggesting that SRSF2, SRSF3, and SRSF7 cooperate to increase invasion of cancer organoids (Figures S6E and S6F). Finally, in 3D invasion assays, 3×SR HCC1806 formed more invasive structures vs. 3×CTL organoids (Figure S6G).
To evaluate how each SF-module hub gene contributes to MYC-induced phenotypes, we generated MYC-OE HCC1806 cells that stably express rTTA3 along with DOX-inducible shRNAs targeting the two SFs that affected cellular phenotypes in MDA-MB231 cells (Figure S6H). KD of either SRSF3 or SRSF7 led to an ~40% decrease in the size of MYC-OE HCC1806 organoids (Figure 5C). Despite a significant but modest (<10%) increase in organoid roundness, KD of either SRSF3 or SRSF7 alone was not sufficient to revert the organoids to the same round morphology as MYC-inactive parental HCC1806 (Figure 5B). In sum, our findings demonstrate that pan-cancer SF-module hub genes are sufficient to cooperatively promote cell invasion in MYC-inactive cells and required for maintenance of invasiveness in MYC-active cells.
Co-expression of pan-cancer SF-module hub genes leads to AS changes in breast cancer cells
We performed RNA-seq and differential AS analysis on 3×SR, 3×CTL, and MYC-OE HCC1806 cells (Figure S7A). In concordance with increased cell migration and invasion, 3×SR and MYC-OE cells increased expression of the mesenchymal marker vimentin and EMT-inducing transcription factors TWIST1, TWIST2, and SNAI1 (Figures S7B–S7D). At the AS level, we identified 5,696 AS events in 3×SR HCC1806 cells, and 7,058 in MYC-OE, vs. 3×CTL (Figures 6A and 6B and Tables S4A–S4B). We found that 1,353 AS events were differentially spliced in both 3×SR-OE and MYC-OE cells, of which 94% (p < 2.2 × 10⁻¹⁶) changed in the same direction, representing 24% of AS events in 3×SR-OE and 19% in MYC-OE cells (Figures 6C and 6F, Tables S4C and S4L). In addition, 1,861 differentially spliced genes were shared between 3×SR-OE and MYC-OE cells (p < 2.2 × 10⁻¹⁶), representing 60% of spliced genes in 3×SR-OE and 50% in MYC-OE cells (Table S4M). These overlaps suggest that SRSF2, SRSF3, and SRSF7 regulate a significant subset of AS events downstream of MYC in HCC1806 cells. Spliced genes were enriched in similar cancer-associated pathways in 3×SR and MYC-OE (Figures 6D, 6E, S7E, and S7F). We validated five AS events by RT-PCR (Figure S7I), including skipping of exon 11a in ENAH, which regulates actin polymerization and cell motility. Decreased inclusion of exon 11a is detected in HCC1806 3×SR and MYC-OE and has been associated with mesenchymal markers and invasion.76 We also validated an AS event in PUM2 (Figure S7I), additionally detected in MYC-active MCF-10A cells and TCGA breast tumors. PUM2 is an RBP implicated in stemness of breast cancer cells and migration in glioblastoma.77,78
Figure 6. Overexpression of pan-cancer SF-module hub genes together leads to changes in MYC-regulated AS events.
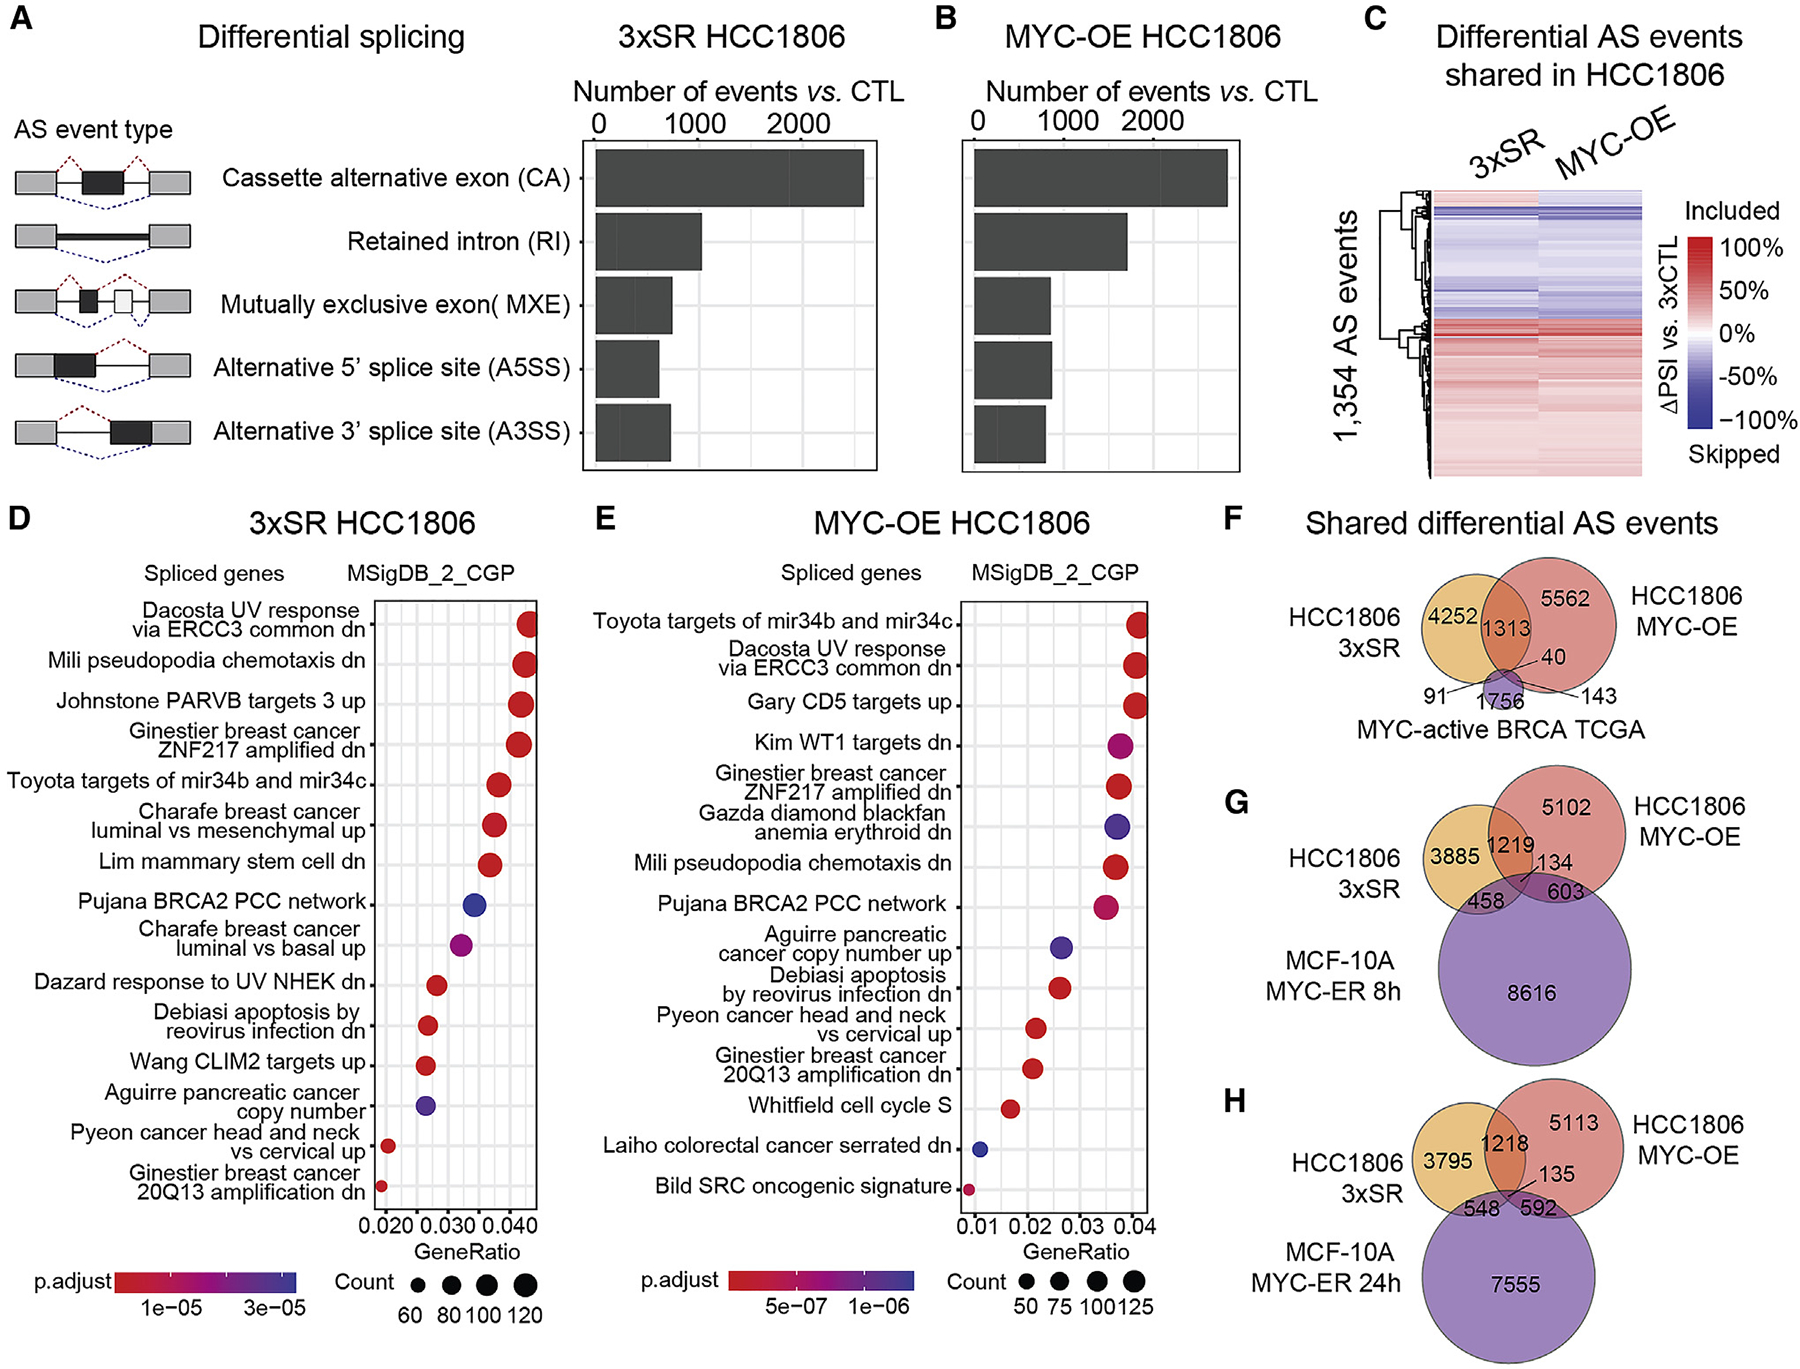
(A and B) AS events in 3×SR (A) or MYC-OE (B) vs. 3×CTL HCC1806 cells (n = 3/condition; ΔPSI ≥ |10%|; FDR < 0.05).
(C) Overlapping AS events in 3×SR and MYC-OE vs. 3×CTL HCC1806 cells.
(D and E) Gene ontology analysis using MSigDB signatures for spliced genes in 3×SR (D) and MYC-OE (E) HCC1806 cells.
(F–H) Overlapping AS events in 3×SR cells and MYC-OE HCC1806 cells and in MYC-active TCGA breast tumors (F) or MYC-active MCF-10A cells (G and H). See also Figures S7 and S8 and Table S4.
We investigated the overlap of AS events between 3×SR or MYC-OE HCC1806 cells and MYC-active breast TCGA tumors. One hundred thirty-one differential AS events were detected in both 3×SR cells and MYC-active breast tumors (p < 2.2 × 10⁻¹⁶), 73% of which changed in the same direction (Figure 6F, Tables S4D and S4L). In comparison, 183 AS events were detected in both MYC-OE cells and MYC-active breast tumors (p = 4.4 × 10⁻¹⁶), of which 58% changed in the same direction (Figure 6F, Tables S4E and S4L). Forty AS events were differentially spliced in all three datasets (Figures 6F and S7G and Table S4F), suggesting that MYC-regulated AS events detected in breast tumors and cell lines are in part controlled by changes in SRSF2, SRSF3, and SRSF7 levels.
We assessed AS event overlap between HCC1806 and MYC-active MCF-10A cells, identifying 592 AS events shared between 3×SR HCC1806 and MYC-ER 8 h MCF-10A cells, of which 38% changed in the same direction (p = 2.9 × 10⁻¹) (Figure 6G, Tables S4G and S4L), and 683 shared between 3×SR HCC1806 and MYC-ER 24 h MCF-10A cells, of which 30% changed in the same direction (p = 2.2 × 10⁻¹) (Figure 6H, Tables S4J and S4L). In comparison, 737 AS events overlapped between MYC-OE HCC1806 and MYC-ER 8 h MCF-10A cells, of which 60% changed in the same direction (p < 2.2 × 10⁻¹⁶) (Figure 6G, Tables S4H and S4L), and 727 overlapped between MYC-OE HCC1806 and MYC-ER 24 h MCF-10A cells, of which 64% changed in the same direction (p < 2.2 × 10⁻¹⁶) (Figure 6H, Tables S4H and S4L). One hundred thirty-four AS events were common between all three datasets (Figures 6G and S7H and Table S4I), suggesting overlapping roles for MYC in non-transformed and cancer mammary cells.
To elucidate how SR proteins act individually on AS regulation, we performed RNA-seq and AS analysis on HCC1806 cells expressing SRSF2, SRSF3, or SRSF7 alone, uncovering >5,000 AS events regulated by each (Figure S8A and Tables S4N–S4P). We compared cells expressing each SF with one another and with 3×SR cells. We found that 1,396 AS events from SRSF3-OE cells were shared in the same direction with SRSF2-OE (p < 2.2 × 10⁻¹⁶), and 1,075 with SRSF7-OE (p < 2.2 × 10⁻¹⁶), and 1,200 AS events were shared between SRSF3- and SRSF7-OE (p < 2.2 × 10⁻¹⁶) (Table S4Q). In addition, 1,636 spliced genes overlapped between SRSF2- and SRSF3-OE (p < 2.2 × 10⁻¹⁶), 1,571 between SRSF2- and SRSF7-OE (p < 2.2 × 10⁻¹⁶), and 1,685 between SRSF2- and SRSF7-OE (p < 2.2 × 10⁻¹⁶) (Table S4R). A number of AS events regulated in the same direction by 3×SR were found in SRSF2-OE (360, p < 2.2 × 10⁻¹⁶), SRSF3-OE (421, p < 2.2 × 10⁻¹⁶), and SRSF7-OE (227, p < 2.2 × 10⁻¹⁶) (Table S4Q). Overlaps at the AS event level were 4%–7%, and 43%–53% at the spliced gene level (Table S4R).
To determine how these SFs act alone or together, we mapped their binding motifs in CA exons included or skipped in SRSF2-OE, SRSF3-OE, SRSF7-OE, 3×SR, or MYC-OE (Figure S8E). SRSF2 or SRSF3 motifs within the CA exon, and SRSF7 motifs in the upstream and downstream introns but not in the CA exon itself, correlated with an increased probability of exon inclusion or skipping, in a position-dependent manner across all conditions (Figure S8E). These findings suggest that SRSF2, SRSF3, and SRSF7 regulate a significant subset of shared AS events or AS events in a set of unique genes downstream of MYC.
Pan-cancer AS signature of MYC activity
We investigated if MYC-regulated AS events are limited to breast tumors, profiling AS events correlated with MYC activity across 32 additional TCGA tumor types. We quantified AS events between MYC-active and MYC-inactive tumors per tumor type (Table S5), ranging from 218 AS events for uveal melanoma to 2,549 for testicular germ cell tumors (Figure 7A and Table S5). We first focused on AS events associated with MYC activity in breast tumors and validated in our cell models. For example, skipping of HRAS exon 5 was significant (FDR < 0.05) across 25 tumor types but exhibited varying ΔPSI magnitudes (Figure 7B).
Figure 7. Pan-cancer AS signature correlates with MYC activity and worse patient survival.
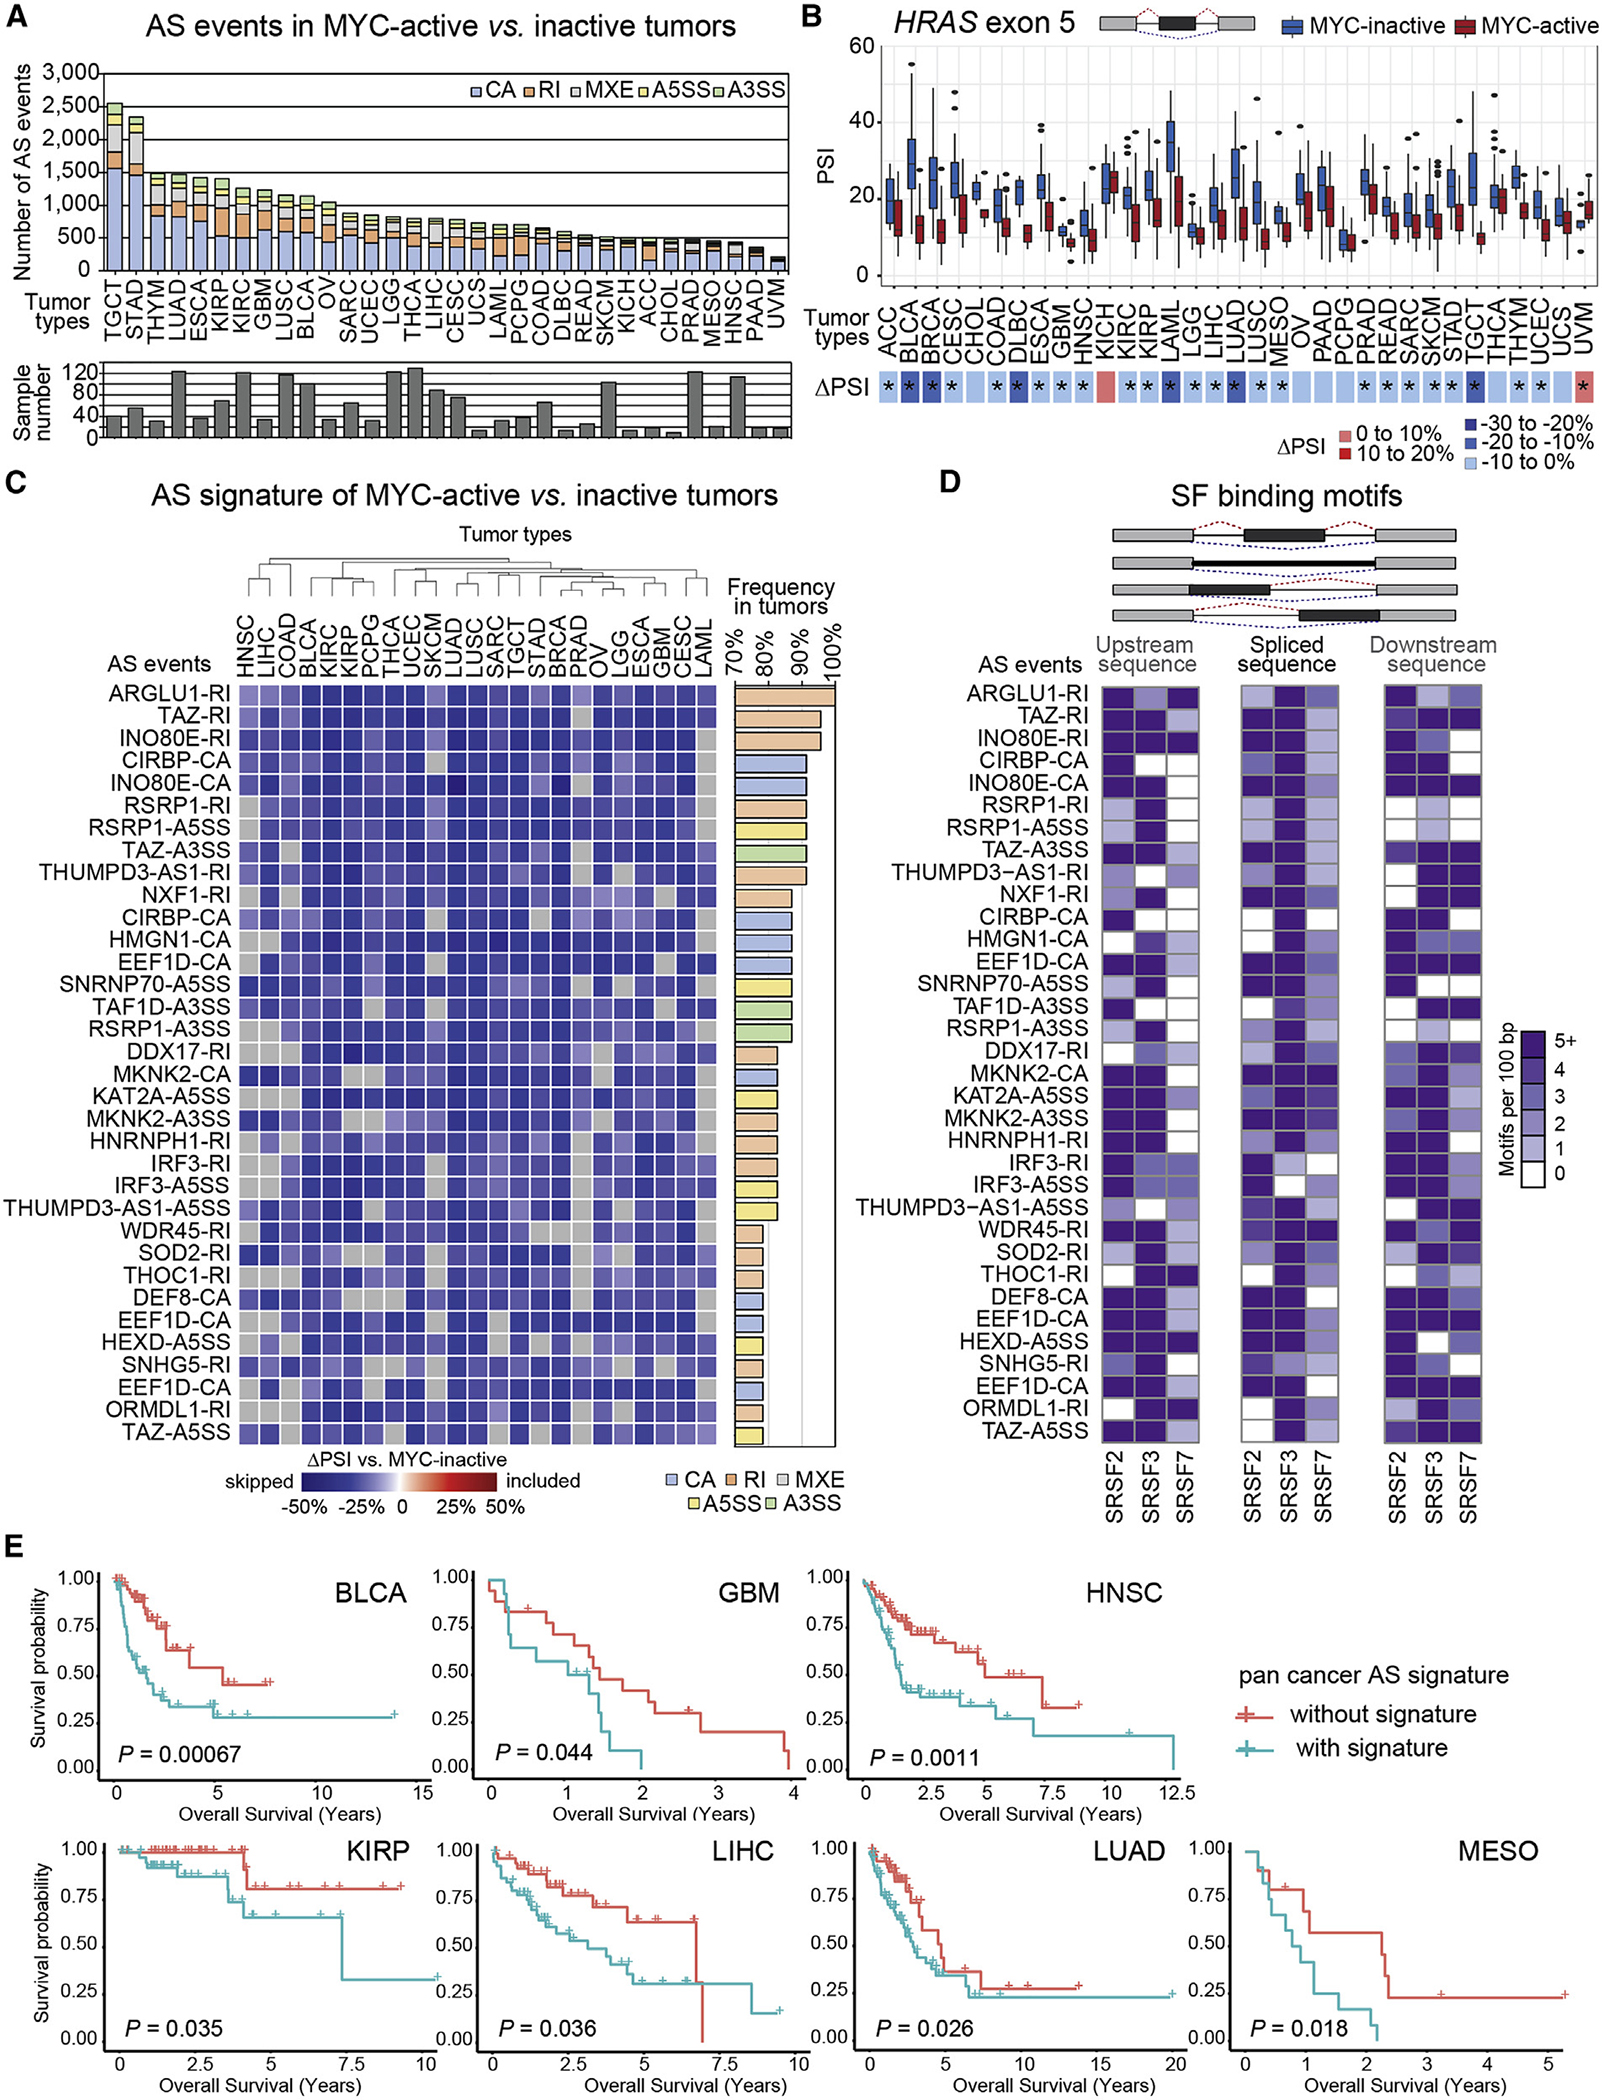
(A) AS events in MYC-active vs. MYC-inactive TCGA tumors (ΔPSI > |10%|, FDR < 0.05), across tumor types (see Table S2E).
(B) PSI of HRAS AS event in MYC-active vs. MYC-inactive tumors, shown per tumor type (median ± interquartile range). ΔPSI (MYC-active vs. MYC-inactive) by tumor type is shown via heatmap; asterisks indicate significant changes, FDR < 0.05.
(C) ΔPSI of 34 pan-cancer AS events in MYC-active vs. MYC-inactive tumors across 75% of 23 TCGA tumor types (n > 15/group). Event type and gene name, and their frequency, are shown.
(D) Frequency per 100 bp of predicted binding motifs for SRSF2, SRSF3, or SRSF7 in pan-cancer MYC-regulated AS events, in upstream, spliced, and downstream sequences. Individual motifs are scored and summed by SF.
(E) Overall survival with or without the pan-cancer MYC AS event signature shown by tumor type (log-rank test p values). See also Figure S9 and Table S5.
We filtered for shared AS events detected in ≥25% of all MYC-active tumors at |ΔPSI| ≥ 10% and FDR < 0.05 cutoffs (Figure S9A). These spliced genes were enriched in pathways involved in RNA splicing and processing (Figure S9B). To further identify AS changes shared by most tumors, we focused on 23 tumor types that had RNA-seq data for ≥15 samples in both MYC-active and MYC-inactive groups. We identified 34 pan-cancer AS events differentially spliced in ≥75% of MYC-active tumors that were enriched for decreased RI events (Figure 7C). Spliced genes included cancer-associated kinases (MKNK2), genes implicated in RNA processing (ARGLU1, CIRBP, SNRNP70, NXF1, DDX17, RSRP1, HNRNPH1, THOC1), transcriptional regulation or chromatin remodeling (ARGLU1, TAZ, INO80E, HMGN1, KAT2A, TAF1D, ZGPAT), translational regulation (EEF1D), autophagy (WDR45), or metabolism (HEXD, SOD2, ORMDL1) (Figures 7C and S9C). Pan-cancer AS events in ARGLU1, NXF1, KAT2A, and WDR45 were validated by RT-PCR in MYC-active MCF-10A cells (Figures 3I and S3L). All 34 pan-cancer AS events contained binding motifs for SRSF2, SRSF3, and/or SRSF7 (Figure 7D), with the majority containing motifs for all three.
Finally, patients with the pan-cancer AS signature had worse overall survival79 compared with patients without the signature across multiple tumor types (Figure 7E and Table S5). These 34 AS events represent a pan-cancer MYC-active signature of potential clinical utility and indicate shared splicing regulatory networks across tumor types.
DISCUSSION
Previous studies have shown that MYC regulates individual SFs that cooperate with MYC to promote tumorigenesis,6,8,18 and that MYC is associated with expression of certain CA or RI events in prostate, lymphoma, and breast cancers.8,17,45 However, a global understanding of how, and to what extent, MYC regulates AS has been missing. This study provides a comprehensive view of MYC-regulated AS across 33 tumor types.
We identified 18 SF co-expression modules in two independent breast cancer cohorts, six of which highly correlated with MYC activity and were preserved in other tumor types. We validated MYC-induced co-expression of SFs in multiple cell models. We demonstrated that SFs SRSF2, SRSF3, and SRSF7 are co-expressed hub genes of a pan-cancer module in MYC-active human cancers. This pan-cancer SF-module controls cell invasion and induces expression of a subset of MYC-regulated spliced isoforms, including some implicated in invasion (e.g., ENAH, PUM2).76,77 Our findings suggest that coordinated expression of SRSF2, SRSF3, and SRSF7 plays a role in MYC-driven tumorigenesis. SRSF2, SRSF3, and SRSF7 have been implicated in cancer individually and are upregulated in several tumor types.2,7 SRSF2 is commonly mutated in hematopoietic malignancies and is upregulated in breast and liver cancers.7,61 SRSF3 is a putative oncogene upregulated in breast, brain, ovarian, stomach, bladder, colon, and liver cancers.2,19,62 SRSF7 has been implicated in lung and colon cancer.2,64,65 Overexpression of SRSF2 or SRSF3 individually in non-transformed mammary epithelial cells did not result in an oncogenic phenotype,7 suggesting their co-expression is required to promote tumor formation and maintenance.
Several SFs previously associated with MYC clustered in SF-modules. BUD31 and hnRNPA19,17 were found in SF-modules 4 and 5, respectively, suggesting these modules are important for MYC oncogenesis. PRMT5, a known MYC target, was not found in breast SF-modules, suggesting its role may be specific to lymphomas.8 Several SF-modules were highly preserved only in certain tumor types, suggesting tumor-specific biological roles. Module preservation per se does not establish that its expression is regulated by MYC; we thus examined MYC activity correlation with module expression across tumors. While four SF-modules with the highest correlation with MYC activity in breast tumors maintained high correlation in most tumor types, SF-modules 4 and 6 showed variable correlation across tumors. Thus, some SF-modules may be important for MYC-driven oncogenesis in multiple tumor types and others may be controlled by MYC in a more tumor-type-specific manner. Indeed, MYC has tissue-specific roles and inactivation of MYC in different tumor types has varying outcomes.11,80
While most SF-modules positively correlated with MYC activity in TCGA breast tumors, SF-module 18 had a negative correlation, and genes in this module were downregulated in MYC-active MCF-10A. Although MYC is commonly thought of as a transcription activator, MYC can induce transcriptional repression of select genes.80 Two of the top genes in SF-module 18 are CLK1 and CLK4, part of the CDC2-like family of kinases phosphorylating SR-proteins.81 CLK inhibitors are under investigation as cancer therapeutics, and MYC amplification is associated with sensitivity to CLK inhibitors.82
Co-expression of pan-cancer SF-module 3 hub genes has an impact on a subset of AS events also detected in MYC-active tumors and cell models. We and others have shown that SRSF2, SRSF3, and SRSF7 have both distinct and overlapping AS targets, yet prior studies examined the effects of an individual SF.3,7,49,68 We demonstrate that co-expression of these three SFs influences MYC-driven AS via a combination of mechanisms. First, each SF has distinct AS targets, resulting in expression of different isoforms that together might promote tumor invasion. Second, SFs share targets to promote either skipping or inclusion of the same exon; this cooperation could lead to even higher levels of an oncogenic isoform. This could occur by multiple SFs binding the same transcript, increasing the likelihood of splicing that exon, or increased SF expression could mean more SF is present to bind and promote AS. Third, SFs have opposing effects on shared AS targets, as an SF could outcompete another by differences in affinity or number and/or location of binding sites. Our study showcases examples of MYC-regulated AS events that fall into these distinct categories, suggesting complex regulatory consequences of SF co-expression. However, the precise AS events required to drive tumorigenesis remain to be determined. Although modulation of a single AS event is unlikely to affect all MYC-activation phenotypes, the contribution of individual AS events and their combinatorial effects should be further investigated. Finally, SR proteins exhibit splicing-independent functions,83–88 and we acknowledge that their roles in other RNA-processing steps may influence the phenotype of MYC-active tumors.
While our data suggest that MYC-driven expression of SR proteins promotes tumor formation and maintenance, they also point to a relationship between MYC activity or SR expression with known cancer-associated copy number alterations or mutations. In TCGA breast tumors, SRSF2 expression significantly correlated with ERBB2 copy number and TP53 mutations, SRSF3 with PIK3CA copy number and TP53 mutations, and SRSF7 with TP53 mutations (Tables S2G and S2H). In addition, MYC activity correlated with increased copy number of ERBB2 or PIK3CA and with TP53 mutations (Tables S2G and S2H).
While we demonstrated MYC-driven expression of SRFS2, SRSF3, and SRSF7, these genes may also be activated and function independent of MYC, and be regulated by additional post-transcriptional mechanisms. Indeed, these SFs are expressed in a variety of tumors, and each is classified as essential by the Cancer Dependency Map project.89 Further, our findings suggest that these SFs are not MYC dependent per se, as, if they were, one would expect no associated phenotypes when the SF-module is expressed in MYC-inactive HCC1806 cells, contrary to our findings. Our results point to the fact that higher activity of MYC in tumors leads to higher levels of the SF-module, which in turn regulates downstream AS events that have an impact on protumorigenic phenotypes.
We identified a MYC-active AS signature shared across >75% of 23 tumor types, providing a pan-cancer tumor classifier of MYC status that could be used to predict prognosis and identify patients likely to benefit from AS-modulating therapies. MYC status is typically classified based on MYC copy number and/or expression, but these do not reflect MYC activity because they do not consider MYC regulators.32,33 Thus, an AS signature measuring MYC activity may be superior for classifying tumors, for prognosis, and/or for predicting treatment responses. The use of prognostic AS signatures was proposed for several individual tumor types,90–92 but remains to be implemented more broadly in the clinic.
Since MYC itself cannot be easily targeted, targeting downstream SFs or their targets represents an attractive strategy for MYC-active tumors. Yet, it may not be enough to target individual SFs, but necessary to consider how genes cooperate. In particular, the degree to which the genes in pan-cancer SF-module 3 must be modulated to provide therapeutic benefit remains to be determined. SFs are being investigated as therapeutic targets in preclinical or clinical trials testing small molecules that target the splicing machinery,1 directly inhibit specific SFs,8 or target SF stability.93 Further, SF activity and localization are often controlled by phosphorylation,94 and inhibition of upstream kinases to diminish activity of oncogenic SFs95–99 should be tested in MYC-driven tumors. Finally, RNA-based approaches to modulate the expression of SR proteins have revealed a therapeutic window for targeting SFs in cancer without notable toxicity in normal cells.74 MYC-active tumors are especially susceptible to AS inhibition, for example, using spliceosomal or PRMT5 inhibitors or SF-targeting shRNAs8,17,82,100,101; yet it remains to be determined whether these treatments affect MYC-regulated AS and SFs and whether such effects are a cause for, or a correlate of, selective sensitivity. If so, should clinical trials characterize MYC activity and MYC-regulated AS profiles in tumors prior to treatment? Such questions will be important to address for other emerging AS-modulating therapies in MYC-driven tumors.
Limitations of the study
Between datasets, some AS events changed in opposing directions or were not detected under some conditions, possibly due to technical and biological differences. Differences between RNA-seq datasets, particularly smaller libraries, shorter read length, and lower quality of TCGA data (~30–40 million 50 bp reads) vs. cell models (>100 million 150 bp reads), limit detecting events in low-expressed genes. Tumor genomic and transcriptomic heterogeneity renders detecting recurring AS events across samples difficult. MCF-10A cells are non-transformed mammary cells and some non-overlapping effects of MYC in established tumors are expected. A subset of the AS events specific to MCF-10A or TCGA tumors may reflect early vs. sustained MYC activation, respectively, similar to MYC-induced gene expression differences in tumor initiation vs. regression.102 HCC1806 are MYC-inactive cells harboring additional mutations that may influence MYC activity; elevated baseline expression of certain isoforms was unaffected by MYC activation. Overexpression levels in cell lines are comparable to those in MYC-active breast tumors, but SF-module 3 overexpression in HCC1806 is milder than in MCF-10A, likely due to higher expression of multiple SFs being toxic to cancer cells. Our study was not designed to assess the extent to which the role of SF-modules is MYC dependent. While we uncover several SF-modules activated downstream of MYC, mechanisms other than MYC likely regulate these SFs in other cell types. However, this in no way undermines our conclusion that these SFs represent a real vulnerability in MYC-active tumors.
We found a high proportion of MXE AS events. Although we used stringent parameters to minimize false positives, a subset of MXE events may be CA events. However, our findings are consistent with studies showing increased MXEs in cancer vs. normal cells/tissues using rMATS,45,103,104 MISO, or SUPPA.105–110 Long-read RNA-seq of tumors reveals expression of full-length transcripts containing MXEs, many unannotated in reference transcriptomes,111,112 supporting the existence of MXE switches in tumors.
STAR★METHODS
RESOURCE AVAILABILITY
Lead contact
Further information and requests for resources and reagents should be directed to and will be fulfilled by Olga Anczukow (olga.anczukow@jax.org).
Materials availability
Plasmid and cell lines generated are available from the lead contact without restrictions with reasonable compensation by requestor for its processing and shipping.
Data and code availability
RNA-sequencing data for MCF-10A MYC-ER and HCC1806 cells have been deposited on GEO as GSE181968 and GSE181956 and are publicly available as of the date of this publication. Raw image data is available on Mendeley and are publicly available as of the date of this publication: https://doi.org/10.17632/ggxxghn2mb.1.
All original code has been deposited on GitHub and is publicly available as of the date of publication. DOIs are listed in the key resources table.
Any additional information required to reanalyze the data reported in this paper is available from the lead contact upon request.
KEY RESOURCES TABLE.
| REAGENT or RESOURCE | SOURCE | IDENTIFIER |
|---|---|---|
|
| ||
| Antibodies | ||
|
| ||
| Anti-SRSFI mouse | CSHL antibody facility | Ak96322 |
| Anti-SRSF3 rabbit | MBLI | #RN080PW |
| Anti-SRSF7 rabbit | MBLI | #RN079PW |
| Anti-TRA2B rabbit | Abcam | #Ab31353; RRID: AB_778565 |
| Anti-Beta-Catenin rabbit | ThermoFisher | #71-2700; RRID: AB_2533982 |
| Anti-alpha-Tubulin mouse | GenScript | #A01410 |
| Anti-beta-Actin mouse | GenScript | #A00702 |
| Anti-c-MYC rabbit | Cell Signaling | #18583; RRID: AB_2895543 |
| Phalloidin-A647 | ThermoFisher | #A22287; RRID: AB_2620155 |
| Alexa Fluor 568 anti-mouse | Invitrogen | #A-11031; RRID: AB_144696 |
| Alexa Fluor 488 anti-rabbit | Invitrogen | #A-11034; RRID: AB_2576217 |
| IRDye 800CW Goat anti-Rabbit IgG (H + L) | Li-Cor | #926-32211; RRID: AB_621843 |
| IRDye 680 Goat anti-Mouse IgG (H + L) | Li-Cor | #926-68070; RRID: AB_10956588 |
|
| ||
| Chemicals, peptides, and recombinant proteins | ||
|
| ||
| Hoechst | Invitrogen | #62249 |
| Calcein, AM | Invitrogen | #C3099 |
| Matrigel Growth Factor Reduced Phenol-free | BD/Corning | #356238 |
| SYBRSafe | Invitrogen | #S33102 |
| Superscript III reverse transcriptase | Invitrogen | #18080044 |
| Trypsin-EDTA 0.25% | Gibco | #25200056 |
|
| ||
| Critical commercial assays | ||
|
| ||
| RNAeasy kit | Qiagen | #74106 |
| Lipofectamine 2000 | Invitrogen | #11668019 |
| Phusion flash high fidelity master mix | Thermo Fisher | #F548L |
| Phusion hot start II DNA polymerase | Thermo Fisher | #F549L |
| iTaq Universal SYBR green Supermix | BioRad | #1725122 |
| TrueSeq stranded mRNA kit with polyA selection | Illumina | #20020594 |
| Cell Recovery Solution | BD/Corning | #354253 |
|
| ||
| Deposited data | ||
|
| ||
| RNA-seq MCF-10A MYC-ER | This paper | GSE181968 |
| RNA-seq HCC1806 | This paper | GSE181956 |
| Code for mRNA splicing analysis pipeline | This paper | https://doi.org/10.5281/zenodo.7186962 |
|
| ||
| Experimental models: Cell lines | ||
|
| ||
| MCF-10A | Muthuswamy lab (BIDMC) | N/A |
| MCF-10A MYC-ER | Muthuswamy lab (BIDMC) | N/A |
| HEK293T | ATCC | CRL-3216 |
| 293GPG | Muthuswamy lab (BIDMC) | N/A |
| HCC1806 | Liu Lab (JAX) | N/A |
| MDA-MB231 GFP-luciferase rTTA3-Puro | Park et al. 7 | N/A |
|
| ||
| Recombinant DNA | ||
|
| ||
| pBABE-Puromycin | AdGene | #1764 |
| pWZL-Hygromycin | Lowe Lab (MSKCC) | N/A |
| pWZL-MYC-Hygro | Lowe Lab (MSKCC) | N/A |
| PWZL-T7-SRSF2-Hygro | Park et al. 7 | N/A |
| pBABE-T7-SRSF3-Puro | This paper | N/A |
| PWZL-HA-SRSF7-PuroG418 | This paper | N/A |
| TRMPV-Neo | Zuberetal. 113 | N/A |
| TRMPV-Neo shRNA control | (Park et al.)7 | N/A |
| TRMPV-Neo shRNA SRSF2 | This paper | N/A |
| TRMPV-Neo shRNA SRSF3 | This paper | N/A |
| TRMPV-Neo shRNA SRSF7 | This paper | N/A |
| pCI-neo | Krainer Lab (CSHL) | Huaetal.114 |
| pCI-neo-HA-empty vector | Leclair et al. 74 | N/A |
| pCI-neo-HA-SRSF2 | Leclair et al. 74 | N/A |
| pCI-neo-HA-SRSF3 | Leclair et al. 74 | N/A |
| pCI-neo-HA-SRSF7 | Leclair et al. 74 | N/A |
| pMAX-dCasRx | Leclair et al. 74 | N/A |
| pMAX-dCasRx-SRSF2-RS-C | Leclair et al. 74 | N/A |
| pMAX-dCasRx-SRSF3-RS-C | Leclair et al. 74 | N/A |
| pMAX-dCasRx-SRSF7-RS-C | Leclair et al.74 | N/A |
| pCR8-Cas13d-DR-gRNA-CTL | Addgene | #118645 |
|
| ||
| Oligonucleotides | ||
|
| ||
| RT-PCR primer sequences | IDT | See Table S6 |
| SLIC cloning primers | IDT | See Table S6 |
| gRNA sequences | IDT | See Table S6 |
|
| ||
| Software and algorithms | ||
|
| ||
| STAR (v.2.7.3a) | Dobin et al. 39 | https://github.com/alexdobin/STAR |
| Stringtie (v.2.0.6) | Pertea et al. 40 | https://ccb.jhu.edu/software/stringtie/ |
| Trimmomatic (v.039) | Bolger et al. 115 | http://www.usadellab.org/cms/?page=trimmomatic |
| DESeq2 | Love et al. 116 | N/A |
| rMATS (v.4.0.2) | Shen et al.41; Phillips et al.45 | https://github.com/Xinglab/rmats-turbo |
| splicing-pipelines-nf v1.0 | This paper | https://github.com/TheJacksonLaboratory/splicing-pipelines-nf |
| WGCNA | Langfelder et al.58 | N/A |
| NetRep | Ritchie et al.57 | https://github.com/sritchie73/NetRep |
| RStudio | N/A | N/A |
| GraphPad Prism | GraphPad | N/A |
| Harmony High-Content Imaging and Analysis Software | Perkin Elmer | N/A |
| ImageJ Digital Image Processing Software | Schneider et al.117 | https://imagej.nih.gov/ij/ |
| RBPmap | Paz et al.69 | http://rbpmap.technion.ac.il/ |
| Photoshop and Illustrator CC2019 | Adobe | N/A |
| TCGAbiolinks | Colaprico et al.118; Mouniretal.119; Silva et al.120 | N/A |
| ChemiDoc MP Imaging System | BioRad | N/A |
| QuantStudio Real-Time software | ThermoFisger | N/A |
EXPERIMENTAL MODEL AND SUBJECT DETAILS
Human cell lines
MCF-10A and MCF-10A MYC-ER cells were a gift from Senthil K. Muthuswamy (Beth Israel Deaconess Medical Center) and were maintained in DMEM/F12 (Gibco) supplemented with 5% horse serum (GIBCO), 1% penicillin streptomycin (Sigma), 20 ng/mL EGF (Peprotech), 2 ug/mL hydrocortisone 0.5 ug/mL (Sigma), 100 ng/mL cholera toxin (Sigma), and 10 ug/mL insulin (Sigma).121 HCC1806 cells, a gift from Edison Liu (Jackson Laboratory), were maintained in DMEM (Gibco) supplemented with 15% FBS and 1% penicillin streptomycin (Sigma). HEK293T cells (ATCC), were maintained in DMEM (Gibco) supplemented with 10% FBS, 1% penicillin streptomycin (Sigma). MDA-MB231 GFP-luciferase rTTA3-puro7 were maintained in DMEM (Gibco) supplemented with 20% FBS, 1% penicillin streptomycin (Sigma). All cell lines were grown at 37°C under a humidified atmosphere with 5% CO2. Cells routinely tested negative for mycoplasma using the MycoAlert™ Mycoplasma Detection Kit (Lonza). Cell aliquots from early passages were used.
METHOD DETAILS
Plasmids
The pBABE-T7-SRSF3-Puro plasmid was previously described.7 The pWZL-T7-SRSF2-Puro plasmid was created by subcloning T7-SRSF2 cDNA from a pWZL-T7-SRSF2-Hygro7 into a pBABE-Puro plasmid (a gift from S. Lowe, Memorial Sloan Kettering Cancer Center) using sequence and ligation independent cloning (SLIC). The pWZL-G418 plasmid was created by replacing the hygromycin resistance DNA sequence in pWZL-Hygro (a gift from S. Lowe, Memorial Sloan Kettering Cancer Center) by G418 resistance DNA sequence from TRMP-Neo.113 The PWZL-HA-SRSF7-G418 plasmid was created by subcloning HA-SRSF7 cDNA from the pCI-neo-HA-SRSF7 plasmid74 into the pWZL-G418 plasmid using SLIC. The pBABE-HA-MYC-Hygro used here was a gift from S. Lowe (Memorial Sloan Kettering Cancer Center). Corresponding empty vector plasmids, pBABE-Puro, pWZL-Hygro, and PWZL-G418 were used as control. SLIC cloning primers are shown in Table S6A.
The pCI-neo-HA-SR-CDS plasmids were previously described,74 and contain the coding sequence (CDS) of each human SR protein along with an sequence encoding the HA-tag cloned into a pCI-neo mammalian expression plasmid.114
Short hairpins targeting SR proteins were designed using SplashRNA122 and subcloned into a TRMPV-Neo plasmids113 as previously described.7 shRNA sequences are shown in Table S6D.
CASFx plasmids (pMAX-dCasRx-SR) were previously described,74 and contain the dCasRx domain fused to the RS domain of human SRSF2, SRSF3, or SRSF7. CasRx-gRNA plasmids (pCR8-gRNA) were previously described.74 Spacer sequences were ordered as forward and reverse DNA oligos (IDT), containing a 5′AAAC or 5′AAAA overhang sequence respectively (Table S6E). 20pmol of forward and reverse oligos were annealed in 1x annealing buffer (10mM TRIS pH8.0, 50nM NaCl, 1mM EDTA). Annealed oligos were ligated into BbsI digested pCR8-Cas13d-DR-ccdB directly 3′ of the Cas13d Direct Repeat (DR).
All vectors and inserts were verified and authenticated by Sanger sequencing (Eton Bioscience).
Generating stable cell lines
HCC1806 expressing T7-tagged SRSF2, T7-tagged SRSF3, and HA-tagged SRSF7 cDNA, alone or in combination, as well as corresponding empty vector controls and HA-tagged MYC, were generated by retroviral transduction as described7,18 via successive rounds of infection and selection. Virus was produced by transfection 15 ug of plasmid in 293GPG cells (a gift from S. Muthuswamy, BIDMC) using Lipofectamine 3000 (Invitrogen) per manufacturer instructions, along with helper packaging plasmids. Virus collected after transfection was concentrated by adding 0.09x PBS, 0.3M NaCl and 8.5% PEG6000, the solution was gently mixed at 4°C overnight, and the viral concentrate was spun for 15 min at 7000g and the supernatant gently removed. Viral particles were resuspended with appropriate volume of OptiMem (Invitrogen) and either immediately used or frozen at −80C. Stable cells were selected using 1–2 μg/mL puromycin (Gibco), 30–50 μg/mL hygromycin (Invitrogen), or 500 μg/mL Geneticin (G418) (GoldBio) until non-infected control cells were all dead. Cell lines were then maintained in media supplemented with 0.5 μg/mL puromycin, 15 μg/mL hygromycin and 500 μg/mL Geneticin (G418) to reduce excessive antibiotic stress on the cell lines.
MDA-MB231-luciferase-GFP-rTTA3 and HCC1806-MYC -rTTA3 lines expressing SF and control-shRNA-TRMPV-Neo were generated as retroviral transduction and selection as described.7 Multiple shRNAs were tested for each target, and the most efficient RNA was selected. shRNA sequences are shown in Table S6C.
SR protein co-expression in HEK293T cells
HEK293T cells were reverse transfected in 24 well plates at a seeding density of 600,000 cells/mL using Lipofectamine 3000 (Invitrogen) according to manufacturer’s instructions. At the time of transfection 750ng of total plasmid was diluted into 100uL OptiMem (Invitrogen). For individual SR protein transfections this included 250 ng of pCI-neo-HA-SR with 500ng of pCI-neo-HA-empty vector, double SR protein transfections included 250ng of each SR encoding plasmid with 250ng of the control plasmid, triple SR protein transfections included 250ng of each SR encoding plasmid, and the control well was 750ng of HA-empty vector. 48h after transfection the cells were collected by lifting with 2mM EDTA in PBS.
CASFx transfections and gRNAs screen
24h prior to transfection HEK293T cells were seeded into a 12 well plate at 400,000 cells per well. 1000ng of Cas effector plasmid (pMAX-CASFx-SR) and 1000ng of gRNA plasmid (pCR8-gRNA) were transfected using lipofectamine 3000 (Invitrogen) as per manufacturer’s protocol. Cells were collected 48h after transfection by lifting with 2mM EDTA in PBS and analyzed by RT-PCR for HRAS splicing. gRNA sequences are shown in Table S6E.
2D transwell migration assays
HCC1806 cells were starved in serum-free media for 4h before seeding 200,000 cells in serum free media on top of an 8- μm PET membrane transwell (BD-Biosciences) in a 24-well format and allowed to migrate into the lower compartment containing media supplemented with 15% of FBS for 24 hours. After 24h the cells on the top of the filter were removed by scraping with a Q-tip and remaining cells under the filter were fixed using 5% Formalin (Sigma), then permeabilized with 0.5% Triton X-100 (Sigma) and stained with DAPI (Invitrogen). DAPI-positive cells were imaged using Zoe Fluorescent Cell Imager (Bio-Rad).
2D cell proliferation assays
HCC1806 or MDA-MB231cells were plated in 96-well plate at 5,000 cells per well. For MDA-MB231 cells media was supplemented with 2 μg/mL of doxycycline (Sigma) or mock. Cell number was inferred via luminescence measurement using the Cell Titer Glo (Promega) assay per manufacturer instructions at day 1, 3, 5 and 7 for HCC1806, or day 1, 2, 3, 4 for MDA-MB231, using a Synergy H1 microplate reader and imager. For each sample, relative luminescence was normalized to luminescence on day 1, for 3–4 biological replicates at each timepoint.
3D cell culture assays and imaging
For 3D culture assays, MCF-10A and MCF-10A MYC-ER cells were seeded at a density of 10,000 cells per well in triplicate on a 4-well glass chamber slide coated with Matrigel Growth Factor Reduced (BD Biosciences) as described.35,121 Media was replaced at 72h. Starting on day 3, cells were treated with 1μM 4-hydroxy tamoxifen (4-OHT) (Sigma) for 48h, 24h, 16h, 8h, 4h, or 0h, prior to collection. All samples were collected at the same time on day 5.
For 3D-culture assays, HCC1806 cells were seeded at a density of 15,000 cells per well in a 48-well tissue culture plate coated with 125μL of Matrigel Growth Factor Reduced (BD Biosciences). Media was replaced every 72h and growth was monitored for 9 days. For HCC1806-MYC-OE-rTTA3-shRNA cells, media was supplemented with 2 μg/mL of doxycycline (Sigma) or mock. At days 5 or 9, organoids were treated for 15 minutes with Calcein AM (1μM final concentration, Invitrogen) and Hoechst (1x final concentration, Invitrogen) diluted in 1x PBS, and multiple fields and z-stacks were imaged for each well using the Opera Phenix High-Content Screening System (PerkinElmer). Maximal projection was used to reconstruct representative Z-stack fluorescent confocal images of 15 fields with >20 Z-stack images spaced every 55 μm using the Harmony High-Content Imaging and Analysis Software (PerkinElmer). Maximal projection of all imaged fields and z-stacks was analyzed using ImageJ digital processing software (https://imagej.nih.gov/ij/)117 to calculate organoid area, only structures with a total area bigger than 700 μm2 were considered in the analysis. All assays were performed in triplicates.
For 3D invasion assays, 15,000 HCC1806 cells were seeded on a 1:1 mix of collagen:matrigel (to reach a final concentration of Collagen of 1.6 mg/mL and pH was adjusted to be at ~7.6) in a 48-well tissue culture plate. Media was replaced every 3–4 days. At day 9 organoids were treated for 15 minutes with Calcein AM (1μM final concentration, Invitrogen) in DMEM and multiple fields and z-stacks were imaged on the Opera-Phenix High-Content Screening System (PerkinElmer). Maximal projection was used to reconstruct representative Z-stack fluorescent confocal images of 15 fields with >20 Z-stack images spaced every 55 μm using the Harmony High-Content Imaging and Analysis Software (PerkinElmer). All assays were performed in triplicates.
For 3D culture assays, MDA-MB231-rTTA3-shRNA cells were seeded at a density of 7,000 cells per well in triplicate for control and DOX-treated lines, on a 48-well plate coated with Matrigel Growth Factor Reduced (BD Biosciences). Media was replaced every 72h and supplemented with 2 μg/mL of doxycycline (ADD) or mock, and growth was monitored for 9 days. On day 9, organoids were treated for 15 minutes with 1μM final Calcein AM (Invitrogen) diluted in growth media. Multiple fields and z-stacks were imaged for each well using the Opera Phenix High-Content Screening System (PerkinElmer). Maximal projection was used to reconstruct representative Z-stack fluorescent confocal images of 25 fields with >30 Z-stack images spaced every 55 μm using the Harmony High-Content Imaging and Analysis Software (PerkinElmer). Maximal projection of all imaged fields and z-stacks was analyzed using ImageJ digital processing software (https://imagej.nih.gov/ij/) to calculate organoid area. All assays were performed in triplicates.
2D confocal imaging
HCC-1806 control, 3xSR, and MYC-OE cell lines were plated onto coverslips at low density. 24h later cells were fixed using 4% paraformaldehyde (Sigma), permeabilized, and stained with 5ug/mL of anti-β-catenin antibody (ThermoFisher) overnight at 4°C. Samples were then counterstained with 4 ug/mL Alexa-488 secondary antibody (Invitrogen), as well as 0.005 U/ul Alexa647-conjugated phalloidin (ThermoFisher), and 1 ug/mL DAPI (Invitrogen), and mounted onto slides using Prolong Gold Antifade reagent (Invitrogen). High resolution images were acquired using the 60x objective of an Dragonfly confocal microscope (Andor). Images represent the maximum intensity projection of an approximately 10 μm Z-stack encompassing the entirety of the cell. All post-acquisition image adjustments were made using ImageJ (https://imagej.nih.gov/ij/).
RNA extraction
3D-grown MCF-10A cells were washed with PBS (1X) and the Matrigel was dissolved by incubating slides at 4°C in Cell Recovery Solution (BD Biosciences). 2D-grown HEK293T, HCC1806, or MDA-MB231 cells were harvested by scraping adherent cells in PBS once ~90% confluence was reached. Total RNA was extracted using the RNeasy kit (Qiagen) including DNase I treatment per manufacturer instructions.
RNA-sequencing
Barcoded RNA libraries were prepared starting with 1ug for MCF-10A and 500ng for HCC1806 cell lines of total RNA using the TrueSeq stranded mRNA kit with polyA selection (Illumina), and quantified using a Bioanalyzer DNA 1000 chip (Agilent). Libraries were sequenced as 150bp paired-end reads at 100–200 million reads per library on an Illumina HiSeq (MCF-10A) or NextSeq (HCC1806) instrument. For MCF-10A, equal amounts of 3 libraries were pooled per lane. For HCC1806, equal amounts of 18 libraries were pooled per lane. At least 3 independent biological samples were sequenced for each experimental condition, and run on separate lanes whenever feasible.
Quantitative RT-PCR analysis
Total RNA from 3D-grown MCF-10A cells or 2D-grown MDA-MB231 or HCC1806 cells was extracted as described above. 1ug of total RNA was reverse-transcribed using Superscript III reverse transcriptase (Invitrogen). qPCR was used to amplify endogenous transcripts with SF specific primers (Table S6B) using cDNA corresponding to 5–20ng of total RNA. qPCR was performed with iTaq Universal SYBR green Supermix (Bio-Rad) in 384-well plates (Life Technologies) using a ViiA7 Real-Time PCR system (Life Technologies) per manufacturer instructions and analyzed with QuantStudio Real-Time software. SF-expression was normalized to housekeeping gene GAPDH.
Semi-quantitative RT-PCR analysis
Total RNA from 3D-grown MCF-10A cells was extracted as described above. 1ug of total RNA was reverse-transcribed using Superscript III reverse transcriptase (Invitrogen). Semi-quantitative PCR was used to amplify endogenous transcripts with with SF specific primers (Table S6B) using cDNA corresponding to 5–20ng of total RNA. Optimal PCR conditions were defined for each primer pair by testing amplification from 26–30 cycles to select semi-quantitative conditions. PCR products were separated by 2% agarose gel stained with SYBRSafe (Invitrogen), and bands were quantified with a ChemiDoc MP Imaging System (Bio-Rad). SF-expression was normalized to housekeeping gene GAPDH.
RT-PCR splicing event validation
Total RNA from 3D-grown MCF-10A cells or 2D-grown HEK293T, MDA-MB231, or HCC1806 cells, was extracted as described above. 1ug of total RNA was reverse-transcribed using Superscript III reverse transcriptase (Invitrogen). Semi-quantitative PCR was used to amplify endogenous transcripts with primers that amplify both the included and skipped isoforms (Table S6C) using cDNA corresponding to 5–20ng of total RNA. Optimal PCR conditions were defined for each primer pair by testing amplification from 26–30 cycles to select semi-quantitative conditions. PCR products were separated by 2% agarose gel stained with SYBRSafe (Invitrogen), and bands were quantified with a ChemiDoc MP Imaging System (Bio-Rad). The ratio of each isoform was first normalized to the sum of the different isoforms, and changes were then expressed as the fold increase compared to the levels obtained for cells or organoids expressing the control vector.
Western blot analysis
3D-grown MCF-10A and MCF-10A MYC-ER cells were washed with PBS (1X) and the Matrigel was dissolved by incubating slides at 4°C in Cell Recovery Solution (BD Biosciences). 2D-grown MDA-MB231 rTTA3 lines and HCC1806-MYC rTTA3 cells were washed with 1xPBS.Cells were lysed in Laemmli buffer (50 mM Tris-HCl pH 6.2, 5% (v/v) β-mercaptoethanol, 10% (v/v) glycerol, 3% (w/v) SDS). Equal amounts of total protein were loaded on a stain-free 12% SDS-polyacrylamide gel (Biorad), transferred onto a nitrocellulose membrane (Millipore) and blocked in 5% (w/v) milk in Tween 20-TBST (50 mM Tris pH 7.5, 150 mM NaCl, 0.05% (v/v) Tween 20). Blots were incubated with TRA2β (Abcam), SRSF1 (CSHL), SRSF3 (MBL), SRSF7 (MBL), c-MYC (Cell Signaling), Actin (GenScript), Tubulin (GenScript) or β-catenin (ThermoFisher) primary antibodies. IR-Dye 680 anti-mouse or IR-Dye 800 anti-rabbit immunoglobulin G (IgG) secondary antibodies (LI-COR) were used for infrared detection and quantification with a ChemiDoc MP Imaging System (Bio-rad).
Differential splicing analysis
Paired-end reads were preprocessed by trimming of low-quality regions by Trimmomatic (v. 0.39).115 Reads were then mapped to the human reference genome using STAR in 2-pass mode (v.2.7.3a)39 with the Gencode GRCh38 v.32 reference transcript annotation.123 To include novel exons and introns in our analysis, we performed an annotation-guided transcriptome reconstruction and merged the resulting transcriptome (GTF) from each sample into one comprehensive transcript annotation using Stringtie (v.2.0.6)40. We utilized an in-house pipeline that implemented rMATS (v.4.0.2)41 to detect splicing events using both splice junction read counts and alternatively spliced exon body counts (https://github.com/TheJacksonLaboratory/splicing-pipelines-nfv1.0). For each event, a percent spliced in (PSI) score was calculated. A ΔPSI is calculated for each event to compare the change in inclusion between MYC active and MYC inactive samples, such that a positive ΔPSI indicates increased inclusion in MYC active tumors whereas a negative ΔPSI indicates increased skipping. Differentially spliced events (DSEs) were filtered based on the following: i) ΔPSI = |mean PSIcase − mean PSIcontrol |≥0.1; and ii) FDR≤0.05; and iii) at least 5 reads (averaged across biological replicates) detected in both the control and case that support either exon skipping or exon inclusion, i.e., (inclusion count ≥5 in either control OR case) AND (skipping count ≥5 in either control OR case).
To account for any 4-OHT-induced splicing in MCF-10A MYC-ER samples, we compared MCF-10A and MCF-10A MYC-ER differential splicing events at each time point, i.e., MCF-10A 8h vs. MCF-10A MYC-ER 8h. 4-OHT induced differential splicing events were removed from downstream analysis if they met the following conditions: i) significant in both samples, and ii) had a ΔPSI with the same sign indicating a change in the same direction.
Differential gene expression analysis
Preprocessing of reads and mapping steps were performed as described above using only the Gencode GRCh38 v.32 reference transcript annotation. A gene-level count matrix was generated using GTF files from Stringtie. Differential gene expression was performed using DESeq2.116 Genes with <10 total reads across samples were removed. A Wald test was used to calculate p-values, and Benjamini-Hochberg procedure was used to calculate corrected p-values. Differential genes were selected based on corrected p-value<0.05 and log2 fold change >0.5 or <−0.5. SF genes were defined using a curated list of 324 proteins with an annotated role in RNA splicing regulation collected from published literature and GO term annotations47–54
To account for 4-OHT induced changes in expression in MCF-10A MYC-ER samples, genes that were significantly differentially expressed in the same direction in both MCF-10A control and MCF-10A MYC-ER sample were removed from further analysis.
TCGA data gene expression and splicing analysis
Tumor and corresponding normal tissue samples were downloaded as bam files from the NCI Genomic Data Commons and processed on the used Lifebit’s Google Cloud Platform. Sample IDs are listed in Tables S1 and S5. Differential gene expression and splicing analysis were performed as described above. For the gene expression analysis of TCGA breast tumors vs. paired adjacent normal breast tissues, we used gene counts for the 108 paired samples and performed differential gene expression analysis as described above.
SF protein motif analysis
SR protein RNA binding motifs were compiled from literature and from the RBPmap default list69: SRSF2 motif#1 CCNG,23 SRSF2 motif#2 GGNG,23 SRSF2 motif#3 GGAGWD,124 SRSF2 motif#4 WGCAGN,70 SRSF2 motif#5 UCCAG70; SRSF3 motif#1 CCAGNC,71 SRSF3 motif#2 NCAGCA,71 SRSF3 motif#3 WCWWC,69 SRSF3 motif#4 CUCKUCY69; SRSF7 motif#1 ACGACG,125 SRSF7 motif#2 ACGAGAGAY,69 SRSF7 motif#3 WGGACRA,69 SRSF7 motif#4 HYGAYY.72 Motifs were mapped to alternative exons and either surrounding 100 nt or upstream and downstream exons using the RBPmap webtool (http://rbpmap.technion.ac.il/) with default stringency and conservation filter cutoffs. The resulting motifs were visualized in the UCSC genome browser.
To generate positional maps, we mapped SRSF2, SRSF3, or SRSF7 motifs using RBPmap in significant CA events from rMATS that were either included (ΔPSI≥10%, FDR≤0.05) or skipped (ΔPSI≤−10%, FDR≤0.05) in case vs. control. As background, we randomly selected CA events detected by rMATS but not significantly different between case and control (−1%≤ΔPSI≤1%), with the background CA events being twice the number of significant CA events. We focused on cassette exons since these represent the majority of AS events detected in each dataset, and also because SR proteins are known to directly regulate exon inclusion of cassette exons. Motif density for each position was then calculated. Because the biological significance of motif density values is not intuitive to interpret and background motif densities vary by motif and dataset, we further calculated Bayesian probabilities by subtracting background motif density from motif density in significantly included or skipped CA events. Bayesian probabilities for included and skipped events were quantified by comparing motif density of significant events to the background dataset. Probabilities were then plotted for each nucleotide position as an aggregate of all CA events mapped across a meta-transcript with the CA exon and upstream/downstream exons as well as surrounding intron (see coordinates specified below) with a cutoff of 0.5 considered enrichment of motifs above the background dataset. For CA events, motifs were mapped from −50nt to −2nt and +2nt to 200nt from the end of exon 1, −200nt to −2nt and +2nt to +50nt from the start of exon 2, −50nt to −2nt and +2nt to +200nt from the end of exon 2, and −200nt to −2nt and +2nt to +50nt from the start of exon 3. For events with coordinates less than 100nt, half of the sequence was used as an input.
Gene ontology enrichment
Gene enrichment was performed using the clusterProfiler package.126 For AS enrichment analysis, we generated a gene list with all genes that contained a significant differential AS event detected using the reference GTF.
Chromatin precipitation sequencing analysis
Peaks from ENCODE MYC ChIP-seq data from MCF-10A cells (ENCFF013XMV)47,55 were annotated using the ChIPseeker R package,127 with promoters defined as being within 1000 bp of the transcription start site.
MYC-activity scoring in tumor samples
We implemented a MYC activity scoring system adapted from Jung et al.34 Each sample is assigned a MYC activity score based on the expression of 200 known MYC target genes in the ‘Hallmark MYC TARGETS V1” in the Molecular Signature Database,35 which is compiled from previous studies. The expression of the genes from Hallmark MYC TARGETS V1 signature correlated with MYC protein measured by reverse phase protein array (RPA) in cancer cell lines grown in 2D (p = 4.8E-7).35 This scoring system was used to classify TCGA samples and for breast tumors from The Sweden Cancerome Analysis Network Breast Initiative (SCAN-B; GSE96058). Gene expression (normalized counts for TCGA samples and FPKM from SCAN-B tumors) were obtained, and all samples in each dataset were ranked based on their expression of MYC target genes in ascending order. The sum of all rank values (rank sum) was calculated for each sample and we then divided the rank sums by the average rank sum for the entire dataset. In order to compare TCGA normal breast with tumor samples, we classified all 1186 samples (113 normal adjacent, 1073 tumor) together. In order to classify MYC-active and -inactive TCGA tumors, normal adjacent samples were removed and MYC-activity scores were re-calculated. We then calculated MYC-activity z-scores for all tumors and MYC-active tumors were classified by having a z-score >1.5 whereas MYC-inactive tumors by z-score <−1.5. SCAN-B tumors were classified in the same manner. Since the number of tumors in other TCGA datasets is much less than that in breast, the threshold values for MYC-active z-scores were >1.2 and <−1.2 for all other TCGA tumor types, with the exception of CHOL which had a threshold of ±1.
Weighted gene correlation network analysis (WGCNA)
SF co-expression analysis in TCGA and SCAN-B breast tumors was performed with the WGCNA R package58,59 using log2 transformed gene expression normalized counts for 334 SFs. We used a signed network construction and a soft-thresholding power of 14, per WGCNA guidelines. To detect co-expression modules, we utilized the blockwiseModules function with a biweight mid-correlation, per WGCNA. Module eigengenes (1st principal component) were calculated for each module and were used to calculate module membership (MM). MM is defined as the correlation of the module eigengene with gene expression profile and represents how close a gene is to that module. MM can be used to identify top genes, or hub genes, within a given module. For our analysis, we defined top genes for each module by having a MM>0.75.
Co-expressed SF-module preservation analysis
Module preservation was determined for TCGA tumors and for breast tumors from the Sweden Cancerome Analysis Network Breast Initiative (SCAN-B, GSE96058). Gene expression data (FPKM) for 33 tumor types was obtained from TCGAbiolinks.118–120 To evaluate preservation of the BRCA modules in other datasets, we utilized the R package NetRep.57 NetRep was specifically designed to assess preservation of WGCNA-derived modules in another dataset. This is the preferred method for module analysis rather than re-running WGCNA because the statistics used to determine preservation take into account multiple factors. We first generated adjacency matrices as well as correlation matrices based on FPKM data for all 334 SFs, and utilized the modulePreservation function. Since our modules were considered small, some of which had fewer than 10 nodes or genes, we only considered four parameters to determine if the module was significantly preserved as per NetRep guidelines: average edge weight (avg.weight) - how connected the genes in each module are to each other, module coherence (coherence) - the amount of variance in the module, average node contribution (avg.contrib) - the degree to which a gene contributes to the module, and average correlation coefficient (avg.cor) - how tightly correlated the module is on average. A module was classified as preserved if three out of four preservation statistics reached a threshold p-value ≤ 0.01.
Survival analysis
Splicing inclusion values (PSI) for each of the 34 pan-cancer AS events were obtained as described above for each TCGA tumor type, and all samples in each dataset were ranked based on their PSI values. The sum of all rank values was calculated for each sample and we then divided the rank sums by the average rank sum for the entire dataset. We then calculated splicing z-scores for all tumors and tumors were classified based on their levels of inclusion of the signature using a z-score threshold >1.2. Survival data from TCGA was retrieved from79 and Kaplan-Meier survival curves were plotted using R packages survival and survminer.
Mutation and copy number analysis
Copy number variation and single nucleotide variation data for TCGA breast tumors were downloaded from the TCGAbiolinks database.118–120 We used MYC activity scores derived as described above along with mutation or copy number data to determine the numbers of MYC active and inactive tumors with or without a mutation or copy number alteration in known oncogenes including ERBB2, TP53, BRCA1/2, and PIK3CA. Additionally, we ranked all TCGA breast tumors by expression of either SRSF2, SRSF3, or SRSF7 and classified tumors as high or low based on expression z-score >1.5 or <−1.5. We then used MYC-activity scores to categorize tumors by expression of SRSF2, SRSF3, or SRSF7 and compared SR protein expression to copy number or mutation status. Fisher exact tests were used to evaluate statistical significance. Benjamini Hochberg method was used to calculate corrected p-values.
Graphs and figures
Plots were generated using Microsoft Excel and R. Figures were generated using Adobe CC 2019 Illustrator and Photoshop software in compliance with the Nature Publishing Group policy concerning image integrity.
QUANTIFICATION AND STATISTICAL ANALYSIS
Where appropriate, the data are presented as the mean±s.d., as indicated. Data points were compared using an unpaired two-tailed, Student t-test or two-tailed Mann-Whitney test, as indicated in the legends. For quantification of proliferation and apoptosis markers, a two-tailed Fisher test was used. p-values are indicated in the figure legends.
ADDITIONAL RESOURCES
RNA-sequencing data has been deposited on GEO as GSE181968 for MCF-10A MYC-ER experiments, and GSE181956 for HCC1806 experiments.
RNA-sequencing data from TCGA tumors (The Cancer Genome Atlas Network, 2012) is available via ISB-CGC cloud. Sample IDs are listed in Tables S1 and S5.
ChIP-seq datasets (ENCFF013XMV) are available from https://www.encodeproject.org/.
Gene expression data for breast tumors from the Sweden Cancerome Analysis Network Breast Initiative is available on GEO (SCAN-B, GSE96058).
Our splicing analysis pipeline v1.0 is available on https://github.com/TheJacksonLaboratory/splicing-pipelines-nf.
Supplementary Material
Highlights.
MYC-active tumors exhibit a specific splicing signature
MYC regulates a network of co-expressed splicing factors in cancers
SRSF2, SRSF3, and SRSF7 correlate with MYC activity across 33 tumor types
A MYC-activity pan-cancer splicing signature correlates with patient survival
ACKNOWLEDGMENTS
We thank Drs. Chuang, Graveley, Pinter, Carmichael, and Lau for helpful discussions; Dr. Helenius for manuscript edits; Drs. Muthuswamy and Liu for MCF-10A and HCC1806 cells; and C. Chatzipantsiou and A.D. Mays for assistance with pipeline cloud implementation. We acknowledge the Microscopy, Single Cell Biology, and Genome Technologies Cores at The Jackson Laboratory (JAX) supported by the JAX Cancer Center (NCI P30CA034196). This work was supported by NIH grants R00CA178206, R01CA248317, R01GM138541, and T32AG062409A. We acknowledge the use of data generated by TCGA, managed by NCI and NHGRI, downloaded using ISB Cancer Genome Cloud and processed using Google Cloud Platform Research Credits. The content is solely the responsibility of the authors and does not necessarily represent NIH official views. The results published here are in part based upon data generated by the TCGA Research Network (https://www.cancer.gov/tcga) and CCLE (https://portals.broadinstitute.org/ccle).
INCLUSION AND DIVERSITY
We support inclusive, diverse, and equitable conduct of research.
Footnotes
DECLARATION OF INTERESTS
O.A. and N.K.L. are inventors on a patent application filed by The Jackson Laboratory related to modulating splicing factors.
SUPPLEMENTAL INFORMATION
Supplemental information can be found online at https://doi.org/10.1016/j.celrep.2022.111704.
REFERENCES
- 1.Bonnal SC, López-Oreja I, and Valcárcel J (2020). Roles and mechanisms of alternative splicing in cancer - implications for care. Nat. Rev. Clin. Oncol. 17, 457–474. 10.1038/s41571-020-0350-x. [DOI] [PubMed] [Google Scholar]
- 2.Urbanski LM, Leclair N, and Anczukow O (2018). Alternative-splicing defects in cancer: splicing regulators and their downstream targets, guiding the way to novel cancer therapeutics. Wiley Interdiscip. Rev. RNA 9, e1476. 10.1002/wrna.1476. [DOI] [PMC free article] [PubMed] [Google Scholar]
- 3.Long JC, and Caceres JF (2009). The SR protein family of splicing factors: master regulators of gene expression. Biochem. J. 417, 15–27. 10.1042/BJ20081501. [DOI] [PubMed] [Google Scholar]
- 4.Dvinge H, Kim E, Abdel-Wahab O, and Bradley RK (2016). RNA splicing factors as oncoproteins and tumour suppressors. Nat. Rev. Cancer 16, 413–430. 10.1038/nrc.2016.51. [DOI] [PMC free article] [PubMed] [Google Scholar]
- 5.Bonnal S, Vigevani L, and Valcárcel J (2012). The spliceosome as a target of novel antitumour drugs. Nat. Rev. Drug Discov. 11, 847–859. 10.1038/nrd3823. [DOI] [PubMed] [Google Scholar]
- 6.Das S, Anczuków O, Akerman M, and Krainer AR (2012). Oncogenic splicing factor SRSF1 is a critical transcriptional target of MYC. Cell Rep. 1, 110–117. 10.1016/j.celrep.2011.12.001. [DOI] [PMC free article] [PubMed] [Google Scholar]
- 7.Park S, Brugiolo M, Akerman M, Das S, Urbanski L, Geier A, Kesarwani AK, Fan M, Leclair N, Lin KT, et al. (2019). Differential functions of splicing factors in mammary transformation and breast cancer metastasis. Cell Rep. 29, 2672–2688.e7. 10.1016/j.celrep.2019.10.110. [DOI] [PMC free article] [PubMed] [Google Scholar]
- 8.Koh CM, Bezzi M, Low DHP, Ang WX, Teo SX, Gay FPH, Al-Haddawi M, Tan SY, Osato M, Sabò A, et al. (2015). MYC regulates the core pre-mRNA splicing machinery as an essential step in lymphomagenesis. Nature 523, 96–100. 10.1038/nature14351. [DOI] [PubMed] [Google Scholar]
- 9.David CJ, Chen M, Assanah M, Canoll P, and Manley JL (2010). HnRNP proteins controlled by c-Myc deregulate pyruvate kinase mRNA splicing in cancer. Nature 463, 364–368. 10.1038/nature08697. [DOI] [PMC free article] [PubMed] [Google Scholar]
- 10.Beroukhim R, Mermel CH, Porter D, Wei G, Raychaudhuri S, Donovan J, Barretina J, Boehm JS, Dobson J, Urashima M, et al. (2010). The landscape of somatic copy-number alteration across human cancers. Nature 463, 899–905. 10.1038/nature08822. [DOI] [PMC free article] [PubMed] [Google Scholar]
- 11.Gabay M, Li Y, and Felsher DW (2014). MYC activation is a hallmark of cancer initiation and maintenance. Cold Spring Harb. Perspect. Med. 4, a014241. 10.1101/cshperspect.a014241. [DOI] [PMC free article] [PubMed] [Google Scholar]
- 12.Chen H, Liu H, and Qing G (2018). Targeting oncogenic Myc as a strategy for cancer treatment. Signal Transduct. Target. Ther. 3, 5. 10.1038/s41392-018-0008-7. [DOI] [PMC free article] [PubMed] [Google Scholar]
- 13.Soucek L, Whitfield J, Martins CP, Finch AJ, Murphy DJ, Sodir NM, Karnezis AN, Swigart LB, Nasi S, and Evan GI (2008). Modelling Myc inhibition as a cancer therapy. Nature 455, 679–683. 10.1038/nature07260. [DOI] [PMC free article] [PubMed] [Google Scholar]
- 14.Wang YH, Liu S, Zhang G, Zhou CQ, Zhu HX, Zhou XB, Quan LP, Bai JF, and Xu NZ (2005). Knockdown of c-Myc expression by RNAi inhibits MCF-7 breast tumor cells growth in vitro and in vivo. Breast Cancer Res. 7, R220–R228. 10.1186/bcr975. [DOI] [PMC free article] [PubMed] [Google Scholar]
- 15.Whitfield JR, Beaulieu ME, and Soucek L (2017). Strategies to inhibit myc and their clinical applicability. Front. Cell Dev. Biol. 5, 10. 10.3389/fcell.2017.00010. [DOI] [PMC free article] [PubMed] [Google Scholar]
- 16.Xu J, Chen Y, and Olopade OI (2010). MYC and breast cancer. Genes Cancer 1, 629–640. 10.1177/1947601910378691. [DOI] [PMC free article] [PubMed] [Google Scholar]
- 17.Hsu TYT, Simon LM, Neill NJ, Marcotte R, Sayad A, Bland CS, Echeverria GV, Sun T, Kurley SJ, Tyagi S, et al. (2015). The spliceosome is a therapeutic vulnerability in MYC-driven cancer. Nature 525, 384–388. 10.1038/nature14985. [DOI] [PMC free article] [PubMed] [Google Scholar]
- 18.Anczuków O, Rosenberg AZ, Akerman M, Das S, Zhan L, Karni R, Muthuswamy SK, and Krainer AR (2012). The splicing factor SRSF1 regulates apoptosis and proliferation to promote mammary epithelial cell transformation. Nat. Struct. Mol. Biol. 19, 220–228. 10.1038/nsmb.2207. [DOI] [PMC free article] [PubMed] [Google Scholar]
- 19.Jia R, Li C, McCoy JP, Deng CX, and Zheng ZM (2010). SRp20 is a proto-oncogene critical for cell proliferation and tumor induction and maintenance. Int. J. Biol. Sci. 6, 806–826. 10.7150/ijbs.6.806. [DOI] [PMC free article] [PubMed] [Google Scholar]
- 20.Karni R, de Stanchina E, Lowe SW, Sinha R, Mu D, and Krainer AR (2007). The gene encoding the splicing factor SF2/ASF is a proto-oncogene. Nat. Struct. Mol. Biol. 14, 185–193. 10.1038/nsmb1209. [DOI] [PMC free article] [PubMed] [Google Scholar]
- 21.Nguyen A, Yoshida M, Goodarzi H, and Tavazoie SF (2016). Highly variable cancer subpopulations that exhibit enhanced transcriptome variability and metastatic fitness. Nat. Commun. 7, 11246. 10.1038/ncomms11246. [DOI] [PMC free article] [PubMed] [Google Scholar]
- 22.Smith CW, and Valcárcel J (2000). Alternative pre-mRNA splicing: the logic of combinatorial control. Trends Biochem. Sci. 25, 381–388. 10.1016/s0968-0004(00)01604-2. [DOI] [PubMed] [Google Scholar]
- 23.Kim E, Ilagan JO, Liang Y, Daubner GM, Lee SCW, Ramakrishnan A, Li Y, Chung YR, Micol JB, Murphy ME, et al. (2015). SRSF2 mutations contribute to myelodysplasia by mutant-specific effects on exon recognition. Cancer Cell 27, 617–630. 10.1016/j.ccell.2015.04.006. [DOI] [PMC free article] [PubMed] [Google Scholar]
- 24.Xu Y, Gao XD, Lee JH, Huang H, Tan H, Ahn J, Reinke LM, Peter ME, Feng Y, Gius D, et al. (2014). Cell type-restricted activity of hnRNPM promotes breast cancer metastasis via regulating alternative splicing. Genes Dev. 28, 1191–1203. 10.1101/gad.241968.114. [DOI] [PMC free article] [PubMed] [Google Scholar]
- 25.Hu X, Harvey SE, Zheng R, Lyu J, Grzeskowiak CL, Powell E, Piwnica-Worms H, Scott KL, and Cheng C (2020). The RNA-binding protein AKAP8 suppresses tumor metastasis by antagonizing EMT-associated alternative splicing. Nat. Commun. 11, 486. 10.1038/s41467-020-14304-1. [DOI] [PMC free article] [PubMed] [Google Scholar]
- 26.Yang Y, Park JW, Bebee TW, Warzecha CC, Guo Y, Shang X, Xing Y, and Carstens RP (2016). Determination of a comprehensive alternative splicing regulatory network and combinatorial regulation by key factors during the epithelial-to-mesenchymal transition. Mol. Cell Biol. 36, 1704–1719. 10.1128/MCB.00019-16. [DOI] [PMC free article] [PubMed] [Google Scholar]
- 27.Ho JS, Di Tullio F, Schwarz M, Low D, Incarnato D, Gay F, Tabaglio T, Zhang J, Wollmann H, Chen L, et al. (2021). HNRNPM controls circRNA biogenesis and splicing fidelity to sustain cancer cell fitness. Elife 10, e59654. 10.7554/eLife.59654. [DOI] [PMC free article] [PubMed] [Google Scholar]
- 28.Koedoot E, Smid M, Foekens JA, Martens JWM, Le Dévédec SE, and van de Water B (2019). Co-regulated gene expression of splicing factors as drivers of cancer progression. Sci. Rep. 9, 5484. 10.1038/s41598-019-40759-4. [DOI] [PMC free article] [PubMed] [Google Scholar]
- 29.Wang E, Lu SX, Pastore A, Chen X, Imig J, Chun-Wei Lee S, Hockemeyer K, Ghebrechristos YE, Yoshimi A, Inoue D, et al. (2019). Targeting an RNA-binding protein network in acute myeloid leukemia. Cancer Cell 35, 369–384.e7. 10.1016/j.ccell.2019.01.010. [DOI] [PMC free article] [PubMed] [Google Scholar]
- 30.ICGC/TCGA Pan-Cancer Analysis of Whole Genomes Consortium (2020). Pan-cancer analysis of whole genomes. Nature 578, 82–93. 10.1038/s41586-020-1969-6. [DOI] [PMC free article] [PubMed] [Google Scholar]
- 31.Cancer Genome Atlas Network (2012). Comprehensive molecular portraits of human breast tumours. Nature 490, 61–70. 10.1038/nature11412. [DOI] [PMC free article] [PubMed] [Google Scholar]
- 32.Conacci-Sorrell M, McFerrin L, and Eisenman RN (2014). An overview of MYC and its interactome. Cold Spring Harb. Perspect. Med. 4, a014357. 10.1101/cshperspect.a014357. [DOI] [PMC free article] [PubMed] [Google Scholar]
- 33.Hann SR (2006). Role of post-translational modifications in regulating c-Myc proteolysis, transcriptional activity and biological function. Semin. Cancer Biol. 16, 288–302. 10.1016/j.semcancer.2006.08.004. [DOI] [PubMed] [Google Scholar]
- 34.Jung M, Russell AJ, Liu B, George J, Liu PY, Liu T, DeFazio A, Bowtell DDL, Oberthuer A, London WB, et al. (2017). A myc activity signature predicts poor clinical outcomes in myc-associated cancers. Cancer Res. 77, 971–981. 10.1158/0008-5472.CAN-15-2906. [DOI] [PubMed] [Google Scholar]
- 35.Liberzon A, Birger C, Thorvaldsdóttir H, Ghandi M, Mesirov JP, and Tamayo P (2015). The Molecular Signatures Database (MSigDB) hallmark gene set collection. Cell Syst. 1, 417–425. 10.1016/j.cels.2015.12.004. [DOI] [PMC free article] [PubMed] [Google Scholar]
- 36.Alluri P, and Newman LA (2014). Basal-like and triple-negative breast cancers: searching for positives among many negatives. Surg. Oncol. Clin. North Am. 23, 567–577. 10.1016/j.soc.2014.03.003. [DOI] [PMC free article] [PubMed] [Google Scholar]
- 37.Chandriani S, Frengen E, Cowling VH, Pendergrass SA, Perou CM, Whitfield ML, and Cole MD (2009). A core MYC gene expression signature is prominent in basal-like breast cancer but only partially overlaps the core serum response. PLoS One 4, e6693. 10.1371/journal.pone.0006693. [DOI] [PMC free article] [PubMed] [Google Scholar]
- 38.Fallah Y, Brundage J, Allegakoen P, and Shajahan-Haq AN (2017). MYC-driven pathways in breast cancer subtypes. Biomolecules 7, E53. 10.3390/biom7030053. [DOI] [PMC free article] [PubMed] [Google Scholar]
- 39.Dobin A, Davis CA, Schlesinger F, Drenkow J, Zaleski C, Jha S, Batut P, Chaisson M, and Gingeras TR (2013). STAR: ultrafast universal RNA-seq aligner. Bioinformatics 29, 15–21. 10.1093/bioinformatics/bts635. [DOI] [PMC free article] [PubMed] [Google Scholar]
- 40.Pertea M, Pertea GM, Antonescu CM, Chang TC, Mendell JT, and Salzberg SL (2015). StringTie enables improved reconstruction of a transcriptome from RNA-seq reads. Nat. Biotechnol. 33, 290–295. 10.1038/nbt.3122. [DOI] [PMC free article] [PubMed] [Google Scholar]
- 41.Shen S, Park JW, Lu ZX, Lin L, Henry MD, Wu YN, Zhou Q, and Xing Y (2014). rMATS: robust and flexible detection of differential alternative splicing from replicate RNA-Seq data. Proc. Natl. Acad. Sci. USA 111, E5593–E5601. 10.1073/pnas.1419161111. [DOI] [PMC free article] [PubMed] [Google Scholar]
- 42.Cohen JB, Broz SD, and Levinson AD (1989). Expression of the H-ras proto-oncogene is controlled by alternative splicing. Cell 58, 461–472. 10.1016/0092-8674(89)90427-3. [DOI] [PubMed] [Google Scholar]
- 43.Guil S, de La Iglesia N, Fernández-Larrea J, Cifuentes D, Ferrer JC, Guinovart JJ, and Bach-Elias M (2003). Alternative splicing of the human proto-oncogene c-H-ras renders a new Ras family protein that trafficks to cytoplasm and nucleus. Cancer Res. 63, 5178–5187. [PubMed] [Google Scholar]
- 44.Camats M, Kokolo M, Heesom KJ, Ladomery M, and Bach-Elias M (2009). P19 H-ras induces G1/S phase delay maintaining cells in a reversible quiescence state. PLoS One 4, e8513. 10.1371/journal.pone.0008513. [DOI] [PMC free article] [PubMed] [Google Scholar]
- 45.Phillips JW, Pan Y, Tsai BL, Xie Z, Demirdjian L, Xiao W, Yang HT, Zhang Y, Lin CH, Cheng D, et al. (2020). Pathway-guided analysis identifies Myc-dependent alternative pre-mRNA splicing in aggressive prostate cancers. Proc. Natl. Acad. Sci. USA 117, 5269–5279. 10.1073/pnas.1915975117. [DOI] [PMC free article] [PubMed] [Google Scholar]
- 46.Kuwabara N, Minami R, Yokota N, Matsumoto H, Senda T, Kawahara H, and Kato R (2015). Structure of a BAG6 (Bcl-2-associated athanogene 6)-Ubl4a (ubiquitin-like protein 4a) complex reveals a novel binding interface that functions in tail-anchored protein biogenesis. J. Biol. Chem. 290, 9387–9398. 10.1074/jbc.M114.631804. [DOI] [PMC free article] [PubMed] [Google Scholar]
- 47.ENCODE Project Consortium (2012). An integrated encyclopedia of DNA elements in the human genome. Nature 489, 57–74. 10.1038/nature11247. [DOI] [PMC free article] [PubMed] [Google Scholar]
- 48.ENCODE Project Consortium; Moore JE, Purcaro MJ, Pratt HE, Epstein CB, Shoresh N, Adrian J, Kawli T, Davis CA, Dobin A, et al. (2020). Expanded encyclopaedias of DNA elements in the human and mouse genomes. Nature 583, 699–710. 10.1038/s41586-020-2493-4. [DOI] [PMC free article] [PubMed] [Google Scholar]
- 49.Van Nostrand EL, Freese P, Pratt GA, Wang X, Wei X, Xiao R, Blue SM, Chen JY, Cody NAL, Dominguez D, et al. (2020). A large-scale binding and functional map of human RNA-binding proteins. Nature 583, 711–719. 10.1038/s41586-020-2077-3. [DOI] [PMC free article] [PubMed] [Google Scholar]
- 50.Ray D, Kazan H, Cook KB, Weirauch MT, Najafabadi HS, Li X, Gueroussov S, Albu M, Zheng H, Yang A, et al. (2013). A compendium of RNA-binding motifs for decoding gene regulation. Nature 499, 172–177. 10.1038/nature12311. [DOI] [PMC free article] [PubMed] [Google Scholar]
- 51.Cook KB, Kazan H, Zuberi K, Morris Q, and Hughes TR (2011). RBPDB: a database of RNA-binding specificities. Nucleic Acids Res. 39, D301–D308. 10.1093/nar/gkq1069. [DOI] [PMC free article] [PubMed] [Google Scholar]
- 52.Hegele A, Kamburov A, Grossmann A, Sourlis C, Wowro S, Weimann M, Will CL, Pena V, Lührmann R, and Stelzl U (2012). Dynamic protein-protein interaction wiring of the human spliceosome. Mol. Cell 45, 567–580. 10.1016/j.molcel.2011.12.034. [DOI] [PubMed] [Google Scholar]
- 53.Cvitkovic I, and Jurica MS (2013). Spliceosome database: a tool for tracking components of the spliceosome. Nucleic Acids Res. 41, D132–D141. 10.1093/nar/gks999. [DOI] [PMC free article] [PubMed] [Google Scholar]
- 54.Van Nostrand EL, Pratt GA, Yee BA, Wheeler EC, Blue SM, Mueller J, Park SS, Garcia KE, Gelboin-Burkhart C, Nguyen TB, et al. (2020). Principles of RNA processing from analysis of enhanced CLIP maps for 150 RNA binding proteins. Genome Biol. 21, 90. 10.1186/s13059-020-01982-9. [DOI] [PMC free article] [PubMed] [Google Scholar]
- 55.Davis CA, Hitz BC, Sloan CA, Chan ET, Davidson JM, Gabdank I, Hilton JA, Jain K, Baymuradov UK, Narayanan AK, et al. (2018). The Encyclopedia of DNA elements (ENCODE): data portal update. Nucleic Acids Res. 46, D794–D801. 10.1093/nar/gkx1081. [DOI] [PMC free article] [PubMed] [Google Scholar]
- 56.Lou S, Li T, Kong X, Zhang J, Liu J, Lee D, and Gerstein M (2020). TopicNet: a framework for measuring transcriptional regulatory network change. Bioinformatics 36, i474–i481. 10.1093/bioinformatics/btaa403. [DOI] [PMC free article] [PubMed] [Google Scholar]
- 57.Ritchie SC, Watts S, Fearnley LG, Holt KE, Abraham G, and Inouye M (2016). A scalable permutation approach reveals replication and preservation patterns of network modules in large datasets. Cell Syst. 3, 71–82. 10.1016/j.cels.2016.06.012. [DOI] [PubMed] [Google Scholar]
- 58.Langfelder P, and Horvath S (2008). WGCNA: an R package for weighted correlation network analysis. BMC Bioinf. 9, 559. 10.1186/1471-2105-9-559. [DOI] [PMC free article] [PubMed] [Google Scholar]
- 59.Langfelder P, and Horvath S (2012). Fast R functions for robust correlations and hierarchical clustering. J. Stat. Softw. 46, i11. [PMC free article] [PubMed] [Google Scholar]
- 60.Brueffer C, Vallon-Christersson J, Grabau D, Ehinger A, Hakkinen J, and Hegardt C (2018). Clinical value of RNA sequencing–based classifiers for prediction of the five conventional breast cancer biomarkers: a report from the population-based multicenter Sweden Cancerome analysis network—breast initiative. JCO Precision Oncol 2, PO.17.00135. 10.1200/PO.17.00135. [DOI] [PMC free article] [PubMed] [Google Scholar]
- 61.Luo C, Cheng Y, Liu Y, Chen L, Liu L, Wei N, Xie Z, Wu W, and Feng Y (2017). SRSF2 regulates alternative splicing to drive hepatocellular carcinoma development. Cancer Res. 77, 1168–1178. 10.1158/0008-5472.CAN-16-1919. [DOI] [PubMed] [Google Scholar]
- 62.Song X, Wan X, Huang T, Zeng C, Sastry N, Wu B, James CD, Horbinski C, Nakano I, Zhang W, et al. (2019). SRSF3-Regulated RNA alternative splicing promotes glioblastoma tumorigenicity by affecting multiple cellular processes. Cancer Res. 79, 5288–5301. 10.1158/0008-5472.CAN-19-1504. [DOI] [PMC free article] [PubMed] [Google Scholar]
- 63.Wang JL, Guo CR, Sun TT, Su WY, Hu Q, Guo FF, Liang LX, Xu J, Xiong H, and Fang JY (2020). SRSF3 functions as an oncogene in colorectal cancer by regulating the expression of ArhGAP30. Cancer Cell Int. 20, 120. 10.1186/s12935-020-01201-2. [DOI] [PMC free article] [PubMed] [Google Scholar]
- 64.Saijo S, Kuwano Y, Masuda K, Nishikawa T, Rokutan K, and Nishida K (2016). Serine/arginine-rich splicing factor 7 regulates p21-dependent growth arrest in colon cancer cells. J. Med. Invest. 63, 219–226. 10.2152/jmi.63.219. [DOI] [PubMed] [Google Scholar]
- 65.Fu Y, and Wang Y (2018). SRSF7 knockdown promotes apoptosis of colon and lung cancer cells. Oncol. Lett. 15, 5545–5552. 10.3892/ol.2018.8072. [DOI] [PMC free article] [PubMed] [Google Scholar]
- 66.Eilers M, Picard D, Yamamoto KR, and Bishop JM (1989). Chimaeras of myc oncoprotein and steroid receptors cause hormone-dependent transformation of cells. Nature 340, 66–68. 10.1038/340066a0. [DOI] [PubMed] [Google Scholar]
- 67.Littlewood TD, Hancock DC, Danielian PS, Parker MG, and Evan GI (1995). A modified oestrogen receptor ligand-binding domain as an improved switch for the regulation of heterologous proteins. Nucleic Acids Res. 23, 1686–1690. 10.1093/nar/23.10.1686. [DOI] [PMC free article] [PubMed] [Google Scholar]
- 68.Bradley T, Cook ME, and Blanchette M (2015). SR proteins control a complex network of RNA-processing events. RNA 21, 75–92. 10.1261/rna.043893.113. [DOI] [PMC free article] [PubMed] [Google Scholar]
- 69.Paz I, Kosti I, Ares M Jr., Cline M, and Mandel-Gutfreund Y (2014). RBPmap: a web server for mapping binding sites of RNA-binding proteins. Nucleic Acids Res. 42, W361–W367. 10.1093/nar/gku406. [DOI] [PMC free article] [PubMed] [Google Scholar]
- 70.Dominguez D, Freese P, Alexis MS, Su A, Hochman M, Palden T, Bazile C, Lambert NJ, Van Nostrand EL, Pratt GA, et al. (2018). Sequence, structure, and context preferences of human RNA binding proteins. Mol. Cell 70, 854–867.e9. 10.1016/j.molcel.2018.05.001. [DOI] [PMC free article] [PubMed] [Google Scholar]
- 71.Ajiro M, Tang S, Doorbar J, and Zheng ZM (2016). Serine/Arginine-rich splicing factor 3 and heterogeneous nuclear ribonucleoprotein A1 regulate alternative RNA splicing and gene expression of human papillomavirus 18 through two functionally distinguishable cis elements. J. Virol. 90, 9138–9152. 10.1128/JVI.00965-16. [DOI] [PMC free article] [PubMed] [Google Scholar]
- 72.Königs V, de Oliveira Freitas Machado C, Arnold B, Blümel N, Solovyeva A, Löbbert S, Schafranek M, Ruiz De Los Mozos I, Wittig I, McNicoll F, et al. (2020). SRSF7 maintains its homeostasis through the expression of Split-ORFs and nuclear body assembly. Nat. Struct. Mol. Biol. 27, 260–273. 10.1038/s41594-020-0385-9. [DOI] [PMC free article] [PubMed] [Google Scholar]
- 73.Du M, Jillette N, Zhu JJ, Li S, and Cheng AW (2020). CRISPR artificial splicing factors. Nat. Commun. 11, 2973. 10.1038/s41467-020-16806-4. [DOI] [PMC free article] [PubMed] [Google Scholar]
- 74.Leclair NK, Brugiolo M, Urbanski L, Lawson SC, Thakar K, Yurieva M, George J, Hinson JT, Cheng A, Graveley BR, and Anczuków O (2020). Poison exon splicing regulates a coordinated network of SR protein expression during differentiation and tumorigenesis. Mol. Cell 80, 648–665.e9. 10.1016/j.molcel.2020.10.019. [DOI] [PMC free article] [PubMed] [Google Scholar]
- 75.Ghandi M, Huang FW, Jané-Valbuena J, Kryukov GV, Lo CC, McDonald ER 3rd, Barretina J, Gelfand ET, Bielski CM, Li H, et al. (2019). Next-generation characterization of the cancer cell line encyclopedia. Nature 569, 503–508. 10.1038/s41586-019-1186-3. [DOI] [PMC free article] [PubMed] [Google Scholar]
- 76.Balsamo M, Mondal C, Carmona G, McClain LM, Riquelme DN, Tadros J, Ma D, Vasile E, Condeelis JS, Lauffenburger DA, and Gertler FB (2016). The alternatively-included 11a sequence modifies the effects of Mena on actin cytoskeletal organization and cell behavior. Sci. Rep. 6, 35298. 10.1038/srep35298. [DOI] [PMC free article] [PubMed] [Google Scholar]
- 77.Zhang L, Chen Y, Li C, Liu J, Ren H, Li L, Zheng X, Wang H, and Han Z (2019). RNA binding protein PUM2 promotes the stemness of breast cancer cells via competitively binding to neuropilin-1 (NRP-1) mRNA with miR-376a. Biomed. Pharmacother. 114, 108772. 10.1016/j.biopha.2019.108772. [DOI] [PubMed] [Google Scholar]
- 78.Wang Y, Sun W, Yang J, Yang L, Li C, Liu H, Liu X, and Jiao B (2019). PUM2 promotes glioblastoma cell proliferation and migration via repressing BTG1 expression. Cell Struct. Funct. 44, 29–39. 10.1247/csf.18030. [DOI] [PMC free article] [PubMed] [Google Scholar]
- 79.Liu J, Lichtenberg T, Hoadley KA, Poisson LM, Lazar AJ, Cherniack AD, Kovatich AJ, Benz CC, Levine DA, Lee AV, et al. (2018). An integrated TCGA pan-cancer clinical data resource to drive high-quality survival outcome analytics. Cell 173, 400–416.e11. 10.1016/j.cell.2018.02.052. [DOI] [PMC free article] [PubMed] [Google Scholar]
- 80.Kress TR, Sabò A, and Amati B (2015). MYC: connecting selective transcriptional control to global RNA production. Nat. Rev. Cancer 15, 593–607. 10.1038/nrc3984. [DOI] [PubMed] [Google Scholar]
- 81.Bates DO, Morris JC, Oltean S, and Donaldson LF (2017). Pharmacology of modulators of alternative splicing. Pharmacol. Rev. 69, 63–79. 10.1124/pr.115.011239. [DOI] [PMC free article] [PubMed] [Google Scholar]
- 82.Iwai K, Yaguchi M, Nishimura K, Yamamoto Y, Tamura T, Nakata D, Dairiki R, Kawakita Y, Mizojiri R, Ito Y, et al. (2018). Anti-tumor efficacy of a novel CLK inhibitor via targeting RNA splicing and MYC-dependent vulnerability. EMBO Mol. Med. 10, e8289. 10.15252/emmm.201708289. [DOI] [PMC free article] [PubMed] [Google Scholar]
- 83.Cáceres JF, Screaton GR, and Krainer AR (1998). A specific subset of SR proteins shuttles continuously between the nucleus and the cytoplasm. Genes Dev. 12, 55–66. [DOI] [PMC free article] [PubMed] [Google Scholar]
- 84.Huang Y, and Steitz JA (2001). Splicing factors SRp20 and 9G8 promote the nucleocytoplasmic export of mRNA. Mol. Cell 7, 899–905. 10.1016/s1097-2765(01)00233-7. [DOI] [PubMed] [Google Scholar]
- 85.Müller-McNicoll M, Botti V, de Jesus Domingues AM, Brandl H, Schwich OD, Steiner MC, Curk T, Poser I, Zarnack K, and Neugebauer KM (2016). SR proteins are NXF1 adaptors that link alternative RNA processing to mRNA export. Genes Dev. 30, 553–566. 10.1101/gad.276477.115. [DOI] [PMC free article] [PubMed] [Google Scholar]
- 86.Zhang Z, and Krainer AR (2004). Involvement of SR proteins in mRNA surveillance. Mol. Cell 16, 597–607. [DOI] [PubMed] [Google Scholar]
- 87.Sanford JR, Gray NK, Beckmann K, and Cáceres JF (2004). A novel role for shuttling SR proteins in mRNA translation. Genes Dev. 18, 755–768. [DOI] [PMC free article] [PubMed] [Google Scholar]
- 88.Maslon MM, Heras SR, Bellora N, Eyras E, and Cáceres JF (2014). The translational landscape of the splicing factor SRSF1 and its role in mitosis. Elife 3, e02028. 10.7554/eLife.02028. [DOI] [PMC free article] [PubMed] [Google Scholar]
- 89.Tsherniak A, Vazquez F, Montgomery PG, Weir BA, Kryukov G, Cowley GS, Gill S, Harrington WF, Pantel S, Krill-Burger JM, et al. (2017). Defining a cancer dependency map. Cell 170, 564–576.e16. 10.1016/j.cell.2017.06.010. [DOI] [PMC free article] [PubMed] [Google Scholar]
- 90.Duan Y, and Zhang D (2020). Identification of novel prognostic alternative splicing signature in papillary renal cell carcinoma. J. Cell. Biochem. 121, 672–689. 10.1002/jcb.29314. [DOI] [PubMed] [Google Scholar]
- 91.Zhang XHF, Arias MA, Ke S, and Chasin LA (2009). Splicing of designer exons reveals unexpected complexity in pre-mRNA splicing. RNA 15, 367–376. 10.1261/rna.1498509. [DOI] [PMC free article] [PubMed] [Google Scholar]
- 92.Wang L, Wang Y, Su B, Yu P, He J, Meng L, Xiao Q, Sun J, Zhou K, Xue Y, and Tan J (2020). Transcriptome-wide analysis and modelling of prognostic alternative splicing signatures in invasive breast cancer: a prospective clinical study. Sci. Rep. 10, 16504. 10.1038/s41598-020-73700-1. [DOI] [PMC free article] [PubMed] [Google Scholar]
- 93.Han T, Goralski M, Gaskill N, Capota E, Kim J, Ting TC, Xie Y, Williams NS, and Nijhawan D (2017). Anticancer sulfonamides target splicing by inducing RBM39 degradation via recruitment to DCAF15. Science 356, eaal3755. 10.1126/science.aal3755. [DOI] [PubMed] [Google Scholar]
- 94.Howard JM, and Sanford JR (2015). The RNAissance family: SR proteins as multifaceted regulators of gene expression. Wiley Interdiscip. Rev. RNA 6, 93–110. 10.1002/wrna.1260. [DOI] [PMC free article] [PubMed] [Google Scholar]
- 95.Sohail M, Shkreta L, Toutant J, Rabea S, Babeu JP, Huard C, Coulombe-Huntington J, Delannoy A, Placet M, Geha S, et al. (2021). A novel class of inhibitors that target SRSF10 and promote p53-mediated cytotoxicity on human colorectal cancer cells. NAR Cancer 3, zcab019. 10.1093/narcan/zcab019. [DOI] [PMC free article] [PubMed] [Google Scholar]
- 96.Hatcher JM, Wu G, Zeng C, Zhu J, Meng F, Patel S, Wang W, Ficarro SB, Leggett AL, Powell CE, et al. (2018). SRPKIN-1: a covalent SRPK1/2 inhibitor that potently converts VEGF from pro-angiogenic to anti-angiogenic isoform. Cell Chem. Biol. 25, 460–470.e6. 10.1016/j.chembiol.2018.01.013. [DOI] [PMC free article] [PubMed] [Google Scholar]
- 97.Batson J, Toop HD, Redondo C, Babaei-Jadidi R, Chaikuad A, Wearmouth SF, Gibbons B, Allen C, Tallant C, Zhang J, et al. (2017). Development of potent, selective SRPK1 inhibitors as potential topical therapeutics for neovascular eye disease. ACS Chem. Biol. 12, 825–832. 10.1021/acschembio.6b01048. [DOI] [PubMed] [Google Scholar]
- 98.Babu N, Pinto SM, Biswas M, Subbannayya T, Rajappa M, Mohan SV, Advani J, Rajagopalan P, Sathe G, Syed N, et al. (2020). Phosphoproteomic analysis identifies CLK1 as a novel therapeutic target in gastric cancer. Gastric Cancer 23, 796–810. 10.1007/s10120-020-01062-8. [DOI] [PubMed] [Google Scholar]
- 99.Uzor S, Porazinski SR, Li L, Clark B, Ajiro M, Iida K, Hagiwara M, Alqasem AA, Perks CM, Wilson ID, et al. (2021). CDC2-like (CLK) protein kinase inhibition as a novel targeted therapeutic strategy in prostate cancer. Sci. Rep. 11, 7963. 10.1038/s41598-021-86908-6. [DOI] [PMC free article] [PubMed] [Google Scholar]
- 100.Hubert CG, Bradley RK, Ding Y, Toledo CM, Herman J, Skutt-Kakaria K, Girard EJ, Davison J, Berndt J, Corrin P, et al. (2013). Genome-wide RNAi screens in human brain tumor isolates reveal a novel viability requirement for PHF5A. Genes Dev. 27, 1032–1045. 10.1101/gad.212548.112. [DOI] [PMC free article] [PubMed] [Google Scholar]
- 101.Bowling EA, Wang JH, Gong F, Wu W, Neill NJ, Kim IS, Tyagi S, Orellana M, Kurley SJ, Dominguez-Vidaña R, et al. (2021). Spliceosome-targeted therapies trigger an antiviral immune response in triple-negative breast cancer. Cell 184, 384–403.e21. 10.1016/j.cell.2020.12.031. [DOI] [PMC free article] [PubMed] [Google Scholar]
- 102.Lawlor ER, Soucek L, Brown-Swigart L, Shchors K, Bialucha CU, and Evan GI (2006). Reversible kinetic analysis of Myc targets in vivo provides novel insights into Myc-mediated tumorigenesis. Cancer Res. 66, 4591–4601. 10.1158/0008-5472.CAN-05-3826. [DOI] [PubMed] [Google Scholar]
- 103.Cieśla M, Ngoc PCT, Cordero E, Martinez ÁS, Morsing M, Muthukumar S, Beneventi G, Madej M, Munita R, Jönsson T, et al. (2021). Oncogenic translation directs spliceosome dynamics revealing an integral role for SF3A3 in breast cancer. Mol. Cell 81, 1453–1468.e12. 10.1016/j.molcel.2021.01.034. [DOI] [PubMed] [Google Scholar]
- 104.Kahles A, Lehmann KV, Toussaint NC, H00FCser M, Stark SG, Sachsenberg T, Stegle O, Kohlbacher O, Sander C, and Cancer Genome Atlas Research Network; and Rätsch G (2018). Comprehensive analysis of alternative splicing across tumors from 8, 705 patients. Cancer Cell 34, 211–224.e6. 10.1016/j.ccell.2018.07.001. [DOI] [PMC free article] [PubMed] [Google Scholar]
- 105.Chang Y, Zhao Y, Wang L, Wu M, He C, Huang M, Lei Z, Yang J, Han S, Wang B, et al. (2021). PHF5A promotes colorectal cancer-progression by alternative splicing of TEAD2. Mol. Ther. Nucleic Acids 26, 1215–1227. 10.1016/j.omtn.2021.10.025. [DOI] [PMC free article] [PubMed] [Google Scholar]
- 106.Shapiro IM, Cheng AW, Flytzanis NC, Balsamo M, Condeelis JS, Oktay MH, Burge CB, and Gertler FB (2011). An EMT-driven alternative splicing program occurs in human breast cancer and modulates cellular phenotype. PLoS Genet. 7, e1002218. 10.1371/journal.pgen.1002218. [DOI] [PMC free article] [PubMed] [Google Scholar]
- 107.Ray D, Yun YC, Idris M, Cheng S, Boot A, Iain TBH, Rozen SG, Tan P, and Epstein DM (2020). A tumor-associated splice-isoform of MAP2K7 drives dedifferentiation in MBNL1-low cancers via JNK activation. Proc. Natl. Acad. Sci. USA 117, 16391–16400. 10.1073/pnas.2002499117. [DOI] [PMC free article] [PubMed] [Google Scholar]
- 108.Zhang D, Hu Q, Liu X, Ji Y, Chao HP, Liu Y, Tracz A, Kirk J, Buonamici S, Zhu P, et al. (2020). Intron retention is a hallmark and spliceosome represents a therapeutic vulnerability in aggressive prostate cancer. Nat. Commun. 11, 2089. 10.1038/s41467-020-15815-7. [DOI] [PMC free article] [PubMed] [Google Scholar]
- 109.Escobar-Hoyos LF, Penson A, Kannan R, Cho H, Pan CH, Singh RK, Apken LH, Hobbs GA, Luo R, Lecomte N, et al. (2020). Altered RNA splicing by mutant p53 activates oncogenic RAS signaling in pancreatic cancer. Cancer Cell 38, 198–211.e8. 10.1016/j.ccell.2020.05.010. [DOI] [PMC free article] [PubMed] [Google Scholar]
- 110.Sebestyén E, Singh B, Miñana B, Pagès A, Mateo F, Pujana MA, Valcárcel J, and Eyras E (2016). Large-scale analysis of genome and transcriptome alterations in multiple tumors unveils novel cancer-relevant splicing networks. Genome Res. 26, 732–744. 10.1101/gr.199935.115. [DOI] [PMC free article] [PubMed] [Google Scholar]
- 111.Huang KK, Huang J, Wu JKL, Lee M, Tay ST, Kumar V, Ramnarayanan K, Padmanabhan N, Xu C, Tan ALK, et al. (2021). Long-read transcriptome sequencing reveals abundant promoter diversity in distinct molecular subtypes of gastric cancer. Genome Biol. 22, 44. 10.1186/s13059-021-02261-x. [DOI] [PMC free article] [PubMed] [Google Scholar]
- 112.Veiga DFT, Nesta A, Zhao Y, Deslattes Mays A, Huynh R, Rossi R, Wu TC, Palucka K, Anczukow O, Beck CR, and Banchereau J (2022). A comprehensive long-read isoform analysis platform and sequencing resource for breast cancer. Sci. Adv. 8, eabg6711. 10.1126/sciadv.abg6711. [DOI] [PMC free article] [PubMed] [Google Scholar]
- 113.Zuber J, McJunkin K, Fellmann C, Dow LE, Taylor MJ, Hannon GJ, and Lowe SW (2011). Toolkit for evaluating genes required for proliferation and survival using tetracycline-regulated RNAi. Nat. Biotechnol. 29, 79–83. 10.1038/nbt.1720. [DOI] [PMC free article] [PubMed] [Google Scholar]
- 114.Hua Y, Vickers TA, Baker BF, Bennett CF, and Krainer AR (2007). Enhancement of SMN2 exon 7 inclusion by antisense oligonucleotides targeting the exon. PLoS Biol. 5, e73. 10.1371/journal.pbio.0050073. [DOI] [PMC free article] [PubMed] [Google Scholar]
- 115.Bolger AM, Lohse M, and Usadel B (2014). Trimmomatic: a flexible trimmer for Illumina sequence data. Bioinformatics 30, 2114–2120. 10.1093/bioinformatics/btu170. [DOI] [PMC free article] [PubMed] [Google Scholar]
- 116.Love MI, Huber W, and Anders S (2014). Moderated estimation of fold change and dispersion for RNA-seq data with DESeq2. Genome Biol. 15, 550. 10.1186/s13059-014-0550-8. [DOI] [PMC free article] [PubMed] [Google Scholar]
- 117.Schneider CA, Rasband WS, and Eliceiri KW (2012). NIH Image to ImageJ: 25 years of image analysis. Nat. Methods 9, 671–675. 10.1038/nmeth.2089. [DOI] [PMC free article] [PubMed] [Google Scholar]
- 118.Colaprico A, Silva TC, Olsen C, Garofano L, Cava C, Garolini D, Sabedot TS, Malta TM, Pagnotta SM, Castiglioni I, et al. (2016). TCGAbiolinks: an R/Bioconductor package for integrative analysis of TCGA data. Nucleic Acids Res. 44, e71. 10.1093/nar/gkv1507. [DOI] [PMC free article] [PubMed] [Google Scholar]
- 119.Mounir M, Lucchetta M, Silva TC, Olsen C, Bontempi G, Chen X, Noushmehr H, Colaprico A, and Papaleo E (2019). New functionalities in the TCGAbiolinks package for the study and integration of cancer data from GDC and GTEx. PLoS Comput. Biol. 15, e1006701. 10.1371/journal.pcbi.1006701. [DOI] [PMC free article] [PubMed] [Google Scholar]
- 120.Silva TC, Colaprico A, Olsen C, D’Angelo F, Bontempi G, Ceccarelli M, and Noushmehr H (2016). TCGA Workflow: analyze cancer genomics and epigenomics data using Bioconductor packages. F1000Res. 5, 1542. 10.12688/f1000research.8923.2. [DOI] [PMC free article] [PubMed] [Google Scholar]
- 121.Debnath J, Muthuswamy SK, and Brugge JS (2003). Morphogenesis and oncogenesis of MCF-10A mammary epithelial acini grown in three-dimensional basement membrane cultures. Methods 30, 256–268. 10.1016/s1046-2023(03)00032-x. [DOI] [PubMed] [Google Scholar]
- 122.Pelossof R, Fairchild L, Huang CH, Widmer C, Sreedharan VT, Sinha N, Lai DY, Guan Y, Premsrirut PK, Tschaharganeh DF, et al. (2017). Prediction of potent shRNAs with a sequential classification algorithm. Nat. Biotechnol. 35, 350–353. 10.1038/nbt.3807. [DOI] [PMC free article] [PubMed] [Google Scholar]
- 123.Frankish A, Diekhans M, Ferreira AM, Johnson R, Jungreis I, Loveland J, Mudge JM, Sisu C, Wright J, Armstrong J, et al. (2019). GENCODE reference annotation for the human and mouse genomes. Nucleic Acids Res. 47, D766–D773. 10.1093/nar/gky955. [DOI] [PMC free article] [PubMed] [Google Scholar]
- 124.Cavaloc Y, Bourgeois CF, Kister L, and Stévenin J (1999). The splicing factors 9G8 and SRp20 transactivate splicing through different and specific enhancers. RNA 5, 468–483. 10.1017/s1355838299981967. [DOI] [PMC free article] [PubMed] [Google Scholar]
- 125.Le Gal La Salle G (1976). Unitary responses in the amygdaloid complex following stimulation of various diencephalic structures. Brain Res. 118, 475–478. 10.1016/0006-8993(76)90315-2. [DOI] [PubMed] [Google Scholar]
- 126.Yu G, Wang LG, Han Y, and He QY (2012). clusterProfiler: an R package for comparing biological themes among gene clusters. OMICS 16, 284–287. 10.1089/omi.2011.0118. [DOI] [PMC free article] [PubMed] [Google Scholar]
- 127.Yu G, Wang LG, and He QY (2015). ChIPseeker: an R/Bioconductor package for ChIP peak annotation, comparison and visualization. Bioinformatics 31, 2382–2383. 10.1093/bioinformatics/btv145. [DOI] [PubMed] [Google Scholar]
Associated Data
This section collects any data citations, data availability statements, or supplementary materials included in this article.
Supplementary Materials
Data Availability Statement
RNA-sequencing data for MCF-10A MYC-ER and HCC1806 cells have been deposited on GEO as GSE181968 and GSE181956 and are publicly available as of the date of this publication. Raw image data is available on Mendeley and are publicly available as of the date of this publication: https://doi.org/10.17632/ggxxghn2mb.1.
All original code has been deposited on GitHub and is publicly available as of the date of publication. DOIs are listed in the key resources table.
Any additional information required to reanalyze the data reported in this paper is available from the lead contact upon request.
KEY RESOURCES TABLE.
| REAGENT or RESOURCE | SOURCE | IDENTIFIER |
|---|---|---|
|
| ||
| Antibodies | ||
|
| ||
| Anti-SRSFI mouse | CSHL antibody facility | Ak96322 |
| Anti-SRSF3 rabbit | MBLI | #RN080PW |
| Anti-SRSF7 rabbit | MBLI | #RN079PW |
| Anti-TRA2B rabbit | Abcam | #Ab31353; RRID: AB_778565 |
| Anti-Beta-Catenin rabbit | ThermoFisher | #71-2700; RRID: AB_2533982 |
| Anti-alpha-Tubulin mouse | GenScript | #A01410 |
| Anti-beta-Actin mouse | GenScript | #A00702 |
| Anti-c-MYC rabbit | Cell Signaling | #18583; RRID: AB_2895543 |
| Phalloidin-A647 | ThermoFisher | #A22287; RRID: AB_2620155 |
| Alexa Fluor 568 anti-mouse | Invitrogen | #A-11031; RRID: AB_144696 |
| Alexa Fluor 488 anti-rabbit | Invitrogen | #A-11034; RRID: AB_2576217 |
| IRDye 800CW Goat anti-Rabbit IgG (H + L) | Li-Cor | #926-32211; RRID: AB_621843 |
| IRDye 680 Goat anti-Mouse IgG (H + L) | Li-Cor | #926-68070; RRID: AB_10956588 |
|
| ||
| Chemicals, peptides, and recombinant proteins | ||
|
| ||
| Hoechst | Invitrogen | #62249 |
| Calcein, AM | Invitrogen | #C3099 |
| Matrigel Growth Factor Reduced Phenol-free | BD/Corning | #356238 |
| SYBRSafe | Invitrogen | #S33102 |
| Superscript III reverse transcriptase | Invitrogen | #18080044 |
| Trypsin-EDTA 0.25% | Gibco | #25200056 |
|
| ||
| Critical commercial assays | ||
|
| ||
| RNAeasy kit | Qiagen | #74106 |
| Lipofectamine 2000 | Invitrogen | #11668019 |
| Phusion flash high fidelity master mix | Thermo Fisher | #F548L |
| Phusion hot start II DNA polymerase | Thermo Fisher | #F549L |
| iTaq Universal SYBR green Supermix | BioRad | #1725122 |
| TrueSeq stranded mRNA kit with polyA selection | Illumina | #20020594 |
| Cell Recovery Solution | BD/Corning | #354253 |
|
| ||
| Deposited data | ||
|
| ||
| RNA-seq MCF-10A MYC-ER | This paper | GSE181968 |
| RNA-seq HCC1806 | This paper | GSE181956 |
| Code for mRNA splicing analysis pipeline | This paper | https://doi.org/10.5281/zenodo.7186962 |
|
| ||
| Experimental models: Cell lines | ||
|
| ||
| MCF-10A | Muthuswamy lab (BIDMC) | N/A |
| MCF-10A MYC-ER | Muthuswamy lab (BIDMC) | N/A |
| HEK293T | ATCC | CRL-3216 |
| 293GPG | Muthuswamy lab (BIDMC) | N/A |
| HCC1806 | Liu Lab (JAX) | N/A |
| MDA-MB231 GFP-luciferase rTTA3-Puro | Park et al. 7 | N/A |
|
| ||
| Recombinant DNA | ||
|
| ||
| pBABE-Puromycin | AdGene | #1764 |
| pWZL-Hygromycin | Lowe Lab (MSKCC) | N/A |
| pWZL-MYC-Hygro | Lowe Lab (MSKCC) | N/A |
| PWZL-T7-SRSF2-Hygro | Park et al. 7 | N/A |
| pBABE-T7-SRSF3-Puro | This paper | N/A |
| PWZL-HA-SRSF7-PuroG418 | This paper | N/A |
| TRMPV-Neo | Zuberetal. 113 | N/A |
| TRMPV-Neo shRNA control | (Park et al.)7 | N/A |
| TRMPV-Neo shRNA SRSF2 | This paper | N/A |
| TRMPV-Neo shRNA SRSF3 | This paper | N/A |
| TRMPV-Neo shRNA SRSF7 | This paper | N/A |
| pCI-neo | Krainer Lab (CSHL) | Huaetal.114 |
| pCI-neo-HA-empty vector | Leclair et al. 74 | N/A |
| pCI-neo-HA-SRSF2 | Leclair et al. 74 | N/A |
| pCI-neo-HA-SRSF3 | Leclair et al. 74 | N/A |
| pCI-neo-HA-SRSF7 | Leclair et al. 74 | N/A |
| pMAX-dCasRx | Leclair et al. 74 | N/A |
| pMAX-dCasRx-SRSF2-RS-C | Leclair et al. 74 | N/A |
| pMAX-dCasRx-SRSF3-RS-C | Leclair et al. 74 | N/A |
| pMAX-dCasRx-SRSF7-RS-C | Leclair et al.74 | N/A |
| pCR8-Cas13d-DR-gRNA-CTL | Addgene | #118645 |
|
| ||
| Oligonucleotides | ||
|
| ||
| RT-PCR primer sequences | IDT | See Table S6 |
| SLIC cloning primers | IDT | See Table S6 |
| gRNA sequences | IDT | See Table S6 |
|
| ||
| Software and algorithms | ||
|
| ||
| STAR (v.2.7.3a) | Dobin et al. 39 | https://github.com/alexdobin/STAR |
| Stringtie (v.2.0.6) | Pertea et al. 40 | https://ccb.jhu.edu/software/stringtie/ |
| Trimmomatic (v.039) | Bolger et al. 115 | http://www.usadellab.org/cms/?page=trimmomatic |
| DESeq2 | Love et al. 116 | N/A |
| rMATS (v.4.0.2) | Shen et al.41; Phillips et al.45 | https://github.com/Xinglab/rmats-turbo |
| splicing-pipelines-nf v1.0 | This paper | https://github.com/TheJacksonLaboratory/splicing-pipelines-nf |
| WGCNA | Langfelder et al.58 | N/A |
| NetRep | Ritchie et al.57 | https://github.com/sritchie73/NetRep |
| RStudio | N/A | N/A |
| GraphPad Prism | GraphPad | N/A |
| Harmony High-Content Imaging and Analysis Software | Perkin Elmer | N/A |
| ImageJ Digital Image Processing Software | Schneider et al.117 | https://imagej.nih.gov/ij/ |
| RBPmap | Paz et al.69 | http://rbpmap.technion.ac.il/ |
| Photoshop and Illustrator CC2019 | Adobe | N/A |
| TCGAbiolinks | Colaprico et al.118; Mouniretal.119; Silva et al.120 | N/A |
| ChemiDoc MP Imaging System | BioRad | N/A |
| QuantStudio Real-Time software | ThermoFisger | N/A |