Abstract
Background
Prognosis varies among stage IV colorectal cancer (CRC). Our study aimed to build a robust prognostic nomogram for predicting overall survival (OS) of patients with stage IV CRC in order to provide evidence for individualized treatment.
Method
We collected the information of 16,283 patients with stage IV CRC in the Surveillance, Epidemiology, and End Results (SEER) database and then randomized these patients in a ratio of 7:3 into a training cohort and an internal validation cohort. In addition, 501 patients in the Sixth Affiliated Hospital of Sun Yat-sen University (Guangzhou, China) database were selected and used as an external validation cohort. Univariate and multivariate Cox analyses were used to screen out significant variables for nomogram establishment. The nomogram model was assessed using time-dependent receiver-operating characteristic curve (time-dependent ROC), concordance index (C-index), calibration curve, and decision curve analysis. Survival curves were plotted using the Kaplan–Meier method.
Result
The C-index of the nomogram for OS in the training, internal validation, and external validation cohorts were 0.737, 0.727, and 0.655, respectively. ROC analysis and calibration curves pronounced robust discriminative ability of the model. Further, we divided the patients into a high-risk group and a low-risk group according to the nomogram. Corresponding Kaplan–Meier curves showed that the prediction of the nomogram was consistent with the actual practice. Additionally, model comparisons and decision curve analysis proved that the nomogram for predicting prognosis was significantly superior to the tumor-node-metastasis (TNM) staging system.
Conclusions
We constructed a nomogram to predict OS of the stage IV CRC and externally validate its generalization, which was superior to the TNM staging system.
Keywords: stage IV CRC, nomogram, overall survival, prognosis, SEER
Introduction
Colorectal cancer (CRC) is the second most common cause of cancer death and second most lethal cancer, with 149,500 new cases and 52,980 cancer-related deaths in the USA in 2021 [1, 2]. Notably, the incidence of stage IV CRC appears to be increasing [3]. Despite the rapid development of chemotherapy, immunotherapy, and targeted drugs in recent years, the prognosis for stage IV CRC is still not satisfactory [4]. In many previous studies, various prognostic factors of patients with stage IV CRC have been investigated, and several demographic and clinicopathological variables have been demonstrated to be independent prognostic factors, including age at diagnosis, tumor location, tumor size, histological differentiation, lymph metastasis, and tumor budding [5–9]. However, due to the small size or single-center analysis, these studies cannot fully reflect the prognosis for patients with stage IV CRC. Therefore, further studies to identify predictors that may affect patient long-term survival are warranted, and a more precise prognostic model for personalized prediction is needed for patients with stage IV CRC.
As is known to all, the tumor-node-metastasis (TNM) staging system is widely used to evaluate the prognosis for CRC in the present clinics, while its performance in predicting personal prognosis is rough and poor. Due to the complexity and heterogeneity of CRC, TNM classification by itself is not sufficient to cover cancer biology or predict the outcome of all CRC cases [10]. Our study aimed at building and validating a prognostic nomogram for patients with stage IV CRC, which adopted the Surveillance, Epidemiology, and End Results (SEER) database and validation cohort from the Sixth Affiliated Hospital of Sun Yat-sen University, Guangzhou, China (SYSU). We also performed further analyses to determine whether the nomogram could more accurately predict prognosis compared with the TNM staging system.
Patients and methods
Patient cohort
SEER cohort
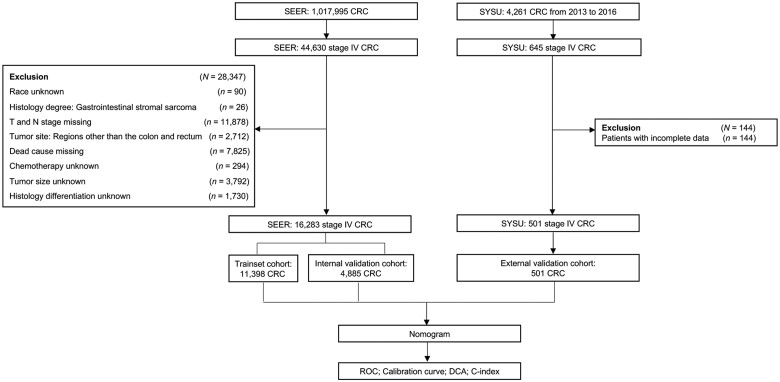
The SEER program collects and provides cancer registration information for a subset of the population (∼28%) from 20 geographic areas of the USA [11], which represents the underlying demographic data of the entire population in the USA and provides a large number of population-based CRC patients. All patients’ information was obtained from the SEER database using the SEER ∗ Stat software (version 8.3.5; National Cancer Institute, USA) [12]. In our study, all patients diagnosed with stage IV CRC between 2010 and 2015 were eligible for the nomogram construction. Available patient information includes age, sex, race, tumor location, tumor size, TNM stage, histological differentiation, number of lymph nodes (LNs) examined, organ metastasis, radiotherapy, and chemotherapy. The exclusion criteria were as follows: (i) unknown race information of the patient, (ii) missing T/N stage data, (iii) missing survival status data, (iv) tumor site other than colon and rectum, (v) unknown exact tumor size, (vi) ambiguous information of chemotherapy, or (vii) unknown histological differentiation (Figure 1).
Figure 1.
Flow chart of patient selection. SEER, Surveillance, Epidemiology, and End Results Cohort; SYSU, the Sixth Affiliated Hospital of Sun Yat-sen University; CRC, colorectal cancer; DCA, decision curve analysis; ROC, receiver-operating characteristic curve; C-index, concordance index.
SYSU cohort
Patients diagnosed with stage IV CRC in the Sixth Affiliated Hospital of Sun Yat-sen University between 2013 and 2016 were initially included in our study as the external validation cohort. The inclusion and exclusion criteria were the same as those of the SEER database (Figure 1).
Variable definition
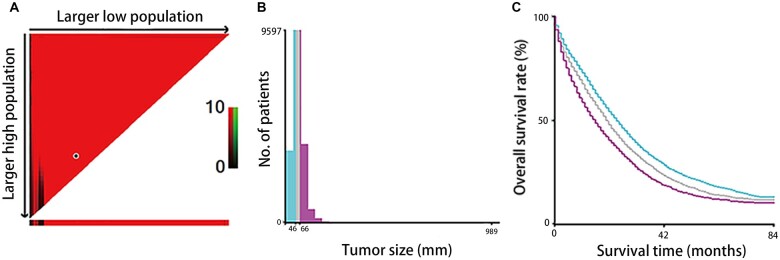
In our study, for analysis sake, variables were converted to other forms as appropriate. X-tile software (Yale University, New Haven, Connecticut, USA) was utilized to evaluate the optimal cut-off values for tumor size (Figure 2). Since X-tile suggested that we should divide that tumor size into three parts, the optimal cut-off values for tumor size were 46 and 66 mm. Given the clinical application of tumor size, we rounded up the data and divided tumor sizes into <50, 50–69, and ≥70 mm. When regarding the definition of tumor location, right-sided colon was the cecum, ascending colon, hepatic flexure, and/or transverse colon, whereas left-sided colon arose in the splenic flexure, descending, and sigmoid colon. Staging was performed according to the American Joint Committee on Cancer (AJCC) TNM Staging Classification for Carcinoma of the Colon and rectum (Seventh Edition). Number of LNs examined was according to the National Comprehensive Cancer Network (NCCN) guidelines of colon cancer (version 2.2021) [13]. Overall survival (OS) was defined as the time from surgery to death or the last follow-up. The predetermined cut-off date in the SEER database was 31 December 2017 because the SEER submission database contained death information until 2017 [11]. The last follow-up time of the SYSU data set was 7 April 2021.
Figure 2.
The optimal cut-off value of preoperative circulating tumor size in the Surveillance, Epidemiology, and End Results Cohort (SEER) database of 16,283 patients with stage IV colorectal cancer using X-tile software. (A) The data are presented as a right triangle grid graph, where each point represents a set of data for a given partition and the optimal cut-off point is highlighted by a black circle. (B) The cut-offs of tumor size are 46 (mm) and 66 (mm), and patients were divided into three groups by locating the brightest pixels on the X-tile. Given the clinical application of tumor size, we rounded up the data and divided tumor sizes into <50, 50–69, and ≥70 mm. (C) Kaplan–Meier curves show overall survival of three groups (<50, 50–69, and ≥70 mm).
Ethic statement
This retrospective study was approved by the ethics committee of the Sixth Affiliated Hospital of Sun Yat-sen University (2022ZSLYEC-302). We anonymously retrieved data from electronic databases, so the patients did not give informed consent.
Statistical analysis
The discontinuous variables of the patient cohort were compared using a χ2 test. Survival curves were estimated using the Kaplan–Meier method and differences were evaluated using the log-rank test. Prognostic factors were investigated using a univariate and multivariate Cox regression model and only significant variables were retained in the multivariate Cox model. A nomogram was established based on the independent predictors selected by the training cohort through multivariate analysis. Concordance index (C-index) and area under the receiver-operating characteristic curve (AUROC) calculated using bootstrapping were used to evaluate discrimination. Calibration curves were performed to prevent overfitting. Decision curve analysis (DCA) is a method to evaluate the clinical benefit of alternative models [14], which was applied to the nomogram by quantifying the net benefit under different threshold probabilities. SPSS 22.0 package (IBM, Chicago, IL, USA) and R 4.0.2 software were used for statistical analyses. A two-sided P-value of <0.05 was pronounced as statistically significant.
Results
Clinicopathological characteristics of patients included
A total of 16,283 out of 44,630 patients registered with stage IV CRC between 2010 and 2015 were enrolled from the SEER database according to the inclusion and exclusion criteria. The patients were randomly divided into the training cohort (n = 11,398) and internal validation cohort (n = 4,885) by a ratio of 7:3. In the SYSU database, 501 stage IV CRC patients from the database treated between 2013 and 2016 were selected as an external validation cohort. As shown in Table 1, the baseline of the training cohort was aligned to that of the internal validation cohort. However, patients in the external validation cohort were younger, had more rectal cancer cases, and had better N stage and histological differentiation than those in the training and internal validation cohorts. Besides, patients were all Asian in the external validation cohort.
Table 1.
Baseline characteristics of patients with stage IV colorectal cancer in training, internal validation, and external validation cohorts
| Characteristic | Training cohort | Internal validation cohort | External validation cohort |
|---|---|---|---|
| (n = 11,398) | (n = 4,885) | (n = 501) | |
| Age (years) | |||
| <50 | 1,959 (17.2) | 895 (18.3) | 117 (23.4) |
| 50–74 | 7,066 (62.0) | 2,967 (60.7) | 327 (65.3) |
| ≥75 | 2,373 (20.8) | 1,023 (20.9) | 57 (11.3) |
| Sex | |||
| Female | 5,343 (46.9) | 2,212 (45.3) | 186 (37.1) |
| Male | 6,055 (53.1) | 2,673 (54.7) | 315 (62.9) |
| Race | |||
| Black | 1,687 (14.8) | 700 (14.3) | – |
| White | 8,645 (75.8) | 3,727 (76.3) | – |
| Others | 1,066 (9.4) | 458 (9.4) | 501 (100) |
| Tumor location | |||
| Right colon | 5,135 (45.1) | 2,209 (45.2) | 120 (24.0) |
| Left colon | 4,472 (39.2) | 1,935 (39.6) | 185 (36.9) |
| Rectum | 1,791 (15.7) | 741 (15.2) | 196 (39.1) |
| Tumor size | |||
| <50 mm | 4,748 (41.7) | 1,977(40.5) | 338 (67.5) |
| 50–69 mm | 3,630 (31.8) | 1,668 (34.1) | 100 (20.0) |
| ≥70 mm | 3,020 (26.5) | 1,240 (25.4) | 63 (12.6) |
| T stage | |||
| T1 | 618 (5.4) | 293 (6.0) | 1 (0.2) |
| T2 | 365 (3.2) | 142 (2.9) | 13 (2.6) |
| T3 | 5,797 (50.9) | 2,548 (52.2) | 373(74.5) |
| T4 | 4,618 (40.5) | 1,902 (38.9) | 114 (22.8) |
| N stage | |||
| N0 | 2,288 (20.1) | 1,007 (20.6) | 140(27.9) |
| N1 | 4,445 (39.0) | 1,915 (39.2) | 236 (47.1) |
| N2 | 4,665 (40.9) | 1,963 (40.2) | 125 (25.0) |
| Histological differentiation | |||
| Highly | 544 (4.8) | 228 (4.7) | 84 (16.8) |
| Moderate | 7,342 (64.4) | 3,147 (64.4) | 376 (75.0) |
| Poorly | 2,816 (24.7) | 1,222(25.0) | 33 (6.6) |
| Undifferentiated | 696 (6.1) | 288 (5.9) | 8 (1.6) |
| Number of LNs examined | |||
| <12 | 3,338 (29.3) | 1,478 (30.3) | 263 (52.5) |
| ≥12 | 8,060 (70.7) | 3,407 (69.7) | 238 (47.5) |
| Organ metastasis | |||
| 0 | 2,425 (21.3) | 10,080 (20.6) | 268 (53.5) |
| 1 | 7,384 (64.8) | 3,186 (65.2) | 178 (35.5) |
| >1 | 1,589 (13.9) | 691 (14.1) | 55 (11.0) |
| Radiotherapy | |||
| No | 10,428 (91.5) | 4,495 (92.0) | 491 (98.0) |
| Yes | 970 (8.5) | 390 (8.0) | 10 (2.0) |
| Chemotherapy | |||
| No | 3,378 (29.6) | 1,427 (29.2) | 366 (73.1) |
| Yes | 8,020 (70.4) | 3,458 (70.8) | 135 (26.9) |
Risk factors associated with the prognosis in stage IV CRC
We investigated risk factors affecting the OS of the training cohort. Univariate Cox analysis showed that the prognosis for patients with different age (P < 0.001), race (P = 0.003), tumor location (P < 0.001), tumor size (P < 0.001), T stage (P < 0.001), N stage (P < 0.001), histological differentiation (P < 0.001), number of LNs examined (P < 0.001), number of organ metastases (P < 0.001), radiotherapy (P < 0.001), and chemotherapy (P < 0.001) varied significantly in the training cohort. The factors found to be significant in univariate analysis were used in the multivariate Cox regression models for OS. Multivariate analysis indicated that age, race, tumor location, tumor size, T stage, N stage, histological differentiation, number of LNs examined, number of organ metastases, radiotherapy, and chemotherapy were independent prognostic factors for stage IV CRC (Table 2).
Table 2.
Univariate and multivariate Cox regression analyses predicting overall survival (OS) for training cohort
| Characteristic | Univariate |
Multivariate |
||
|---|---|---|---|---|
| HR (95% CI) | P | HR (95% CI) | P | |
| Age (years) | ||||
| <50 | 1 | 1 | ||
| 50–74 | 1.30 (1.22–1.38) | <0.001 | 1.18 (1.11–1.26) | <0.001 |
| ≥75 | 2.60 (2.42–2.80) | <0.001 | 1.84 (1.71–1.99) | <0.001 |
| Sex | ||||
| Female | 1 | |||
| Male | 0.99 (0.94–1.03) | 0.54 | ||
| Race | ||||
| Black | 1 | |||
| White | 0.92 (0.87–0.98) | 0.01 | 0.89 (0.84–0.94) | <0.001 |
| Others | 0.86 (0.78–0.94) | <0.001 | 0.82 (0.75–0.90) | <0.001 |
| Tumor location | ||||
| Right colon | 1 | 1 | ||
| Left colon | 0.64 (0.61–0.68) | <0.001 | 0.76 (0.72–0.80) | <0.001 |
| Rectum | 0.66 (0.62–0.70) | <0.001 | 0.84 (0.78–0.90) | <0.001 |
| Tumor size (mm) | ||||
| <50 | 1 | 1 | ||
| 50–69 | 1.19 (1.13–1.25) | <0.001 | 1.13 (1.07–1.19) | <0.001 |
| ≥70 | 1.38 (1.31–1.45) | <0.001 | 1.24 (1.18–1.31) | <0.001 |
| T stage | ||||
| T1 | 1 | 1 | ||
| T2 | 0.52 (0.44–0.61) | <0.001 | 0.58 (0.49–0.69) | <0.001 |
| T3 | 0.66 (0.60–0.72) | <0.001 | 0.74 (0.67–0.82) | <0.001 |
| T4 | 0.97 (0.88–1.07) | 0.58 | 1.00 (0.90–1.11) | 0.97 |
| N stage | ||||
| N0 | 1 | 1 | ||
| N1 | 1.01 (0.95–1.08) | 0.64 | 1.13 (1.06–1.21) | <0.001 |
| N2 | 1.36 (1.29–1.45) | <0.001 | 1.55 (1.46–1.66) | <0.001 |
| Histological differentiation | ||||
| Highly | 1 | 1 | ||
| Moderate | 1.03 (0.93–1.15) | 0.55 | 1.19 (1.06–1.32) | <0.001 |
| Poorly | 1.79 (1.60–2.01) | <0.001 | 1.90 (1.70–2.13) | <0.001 |
| Undifferentiated | 1.92 (1.68–2.19) | <0.001 | 1.99 (1.74–2.28) | <0.001 |
| Number of LN examination | ||||
| <12 | 11 | 1 | ||
| ≥12 | 0.69 (0.66–0.72) | <0.001 | 0.61 (0.58–0.65) | <0.001 |
| Organ metastasis | ||||
| 0 | 11 | 1 | ||
| 1 | 0.96 (0.91–1.01) | 0.12 | 1.30 (1.23–1.37) | <0.001 |
| >1 | 1.68 (1.56–1.80) | <0.001 | 2.20 (2.05–2.38) | <0.001 |
| Radiotherapy | ||||
| No | 1 | 1 | ||
| Yes | 0.57 (0.52–0.62) | <0.001 | 0.79 (0.72–0.87) | <0.001 |
| Chemotherapy | ||||
| No | 1 | 1 | ||
| Yes | 0.35 (0.33–0.36) | <0.001 | 0.37 (0.35–0.39) | <0.001 |
HR, hazard ratio; CI, confidence interval.
Nomogram construction
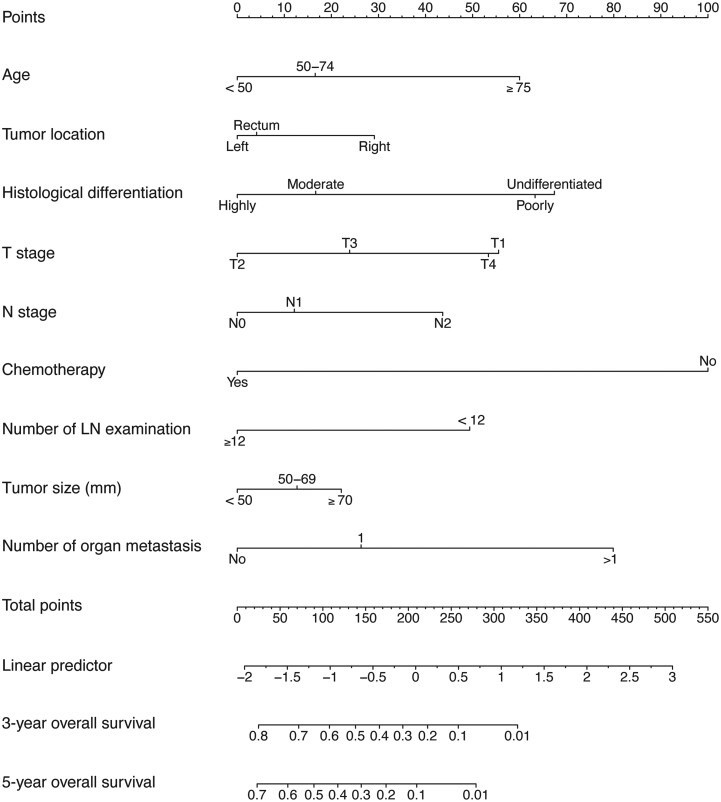
The 3- and 5-year survival probability-predictive nomogram was established based on the factors of a multivariate Cox regression model from the training cohort to predict long-term survival in patients with stage IV CRC (Figure 3). Each category of these variables was assigned a score on the points scale. After summing up the total score and positioning it on the total points scale, the 3- and 5-year survival probability scales were drawn down the straight line, displaying the estimated survival time or probability at each time point.
Figure 3.
A nomogram for predicting 3- and 5-year overall survival of patients with stage IV colorectal cancer. The importance of each variable is ranked according to the standard deviation along nomogram scales. The nomogram is used by summing all points identified on the scale for each variable. The total points projected on the bottom scales indicate the probabilities of 3- and 5-year overall survival. LN, lymph node.
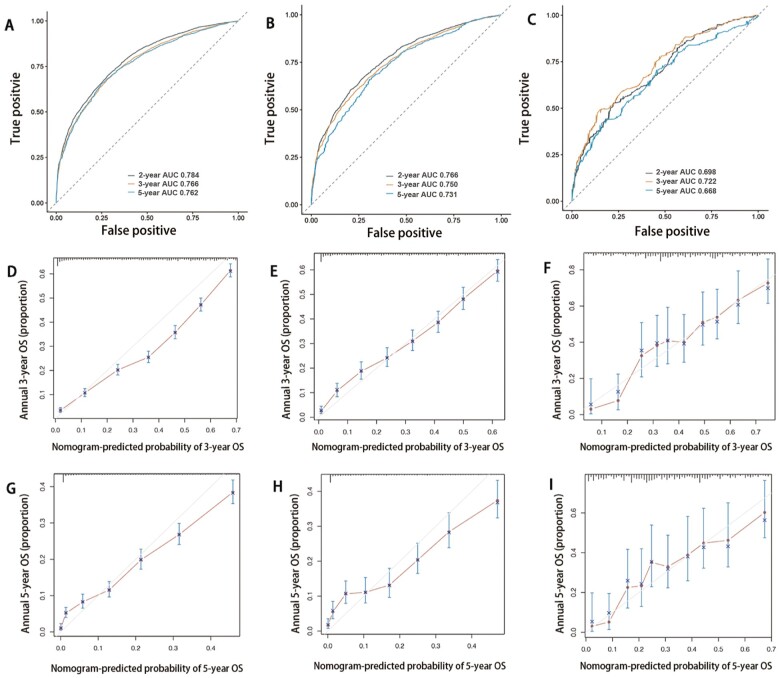
The C-index of the nomogram for OS in the training cohort was 0.737. The discrimination of the nomogram was measured using 2-, 3-, and 5-year integrated AUROCs. In the training cohort, the nomogram showed good performance in the discriminative ability [2-year area under the curve (AUC), 0.784; 3-year AUC, 0.766; 5-year AUC, 0.762] (Figure 4A). In addition, the 3- and 5-year calibration curves in the training cohort were near the perfect curve (corresponding to a perfect case in which the nomogram-predicted OS rates were the same as the actual OS rates) (Figure 4 D and G). In addition, the nomogram showed that chemotherapy made the most significant contribution to the survival outcome, closely followed by the number of organ metastases.
Figure 4.
Time-dependent receiver-operating characteristic curve (ROC) and calibration curves of the nomogram. Time-dependent ROC of overall survival for patients with stage IV colorectal cancer in the training cohort (A), internal validation cohort (B) and external validation cohort (C). Calibration curves of 3- and 5-year overall survival for patients with stage IV colorectal cancer in the training cohort (D, G), internal validation cohort (E, H), and external validation cohort (F, I).
The internal and external validation of the nomogram
The C-indexes of the nomograms for OS in the internal validation cohort and external validation cohort were 0.727 and 0.655, respectively. In the internal validation cohort, values of 2-, 3-, and 5-year AUC were 0.766, 0.750, and 0.731, respectively (Figure 4B). Furthermore, values of 2-, 3-, and 5-year AUC in the external validation cohort were 0.698, 0.722, and 0.668, respectively (Figure 4C). Besides, the internal and external calibration diagram of the nomogram showed that the prediction based on the nomogram was in good agreement with the actual results (Figure 4E, F, H, and I).
Risk stratification based on the nomogram
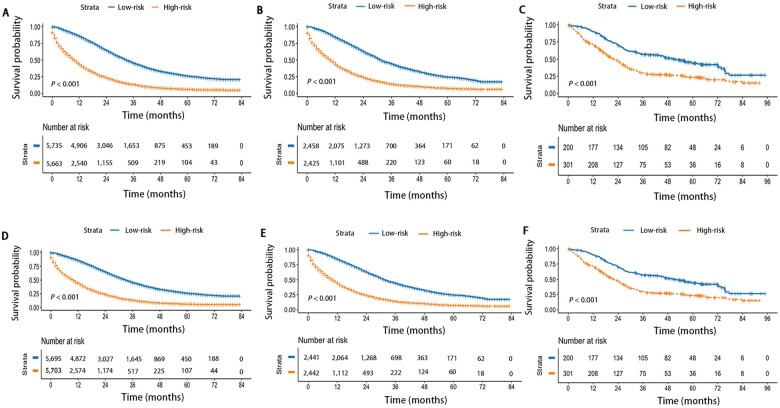
We made a risk stratification based on 3- and 5-year median survival probability calculated using the nomogram. The median 3-year survival probability of the nomogram was 28.0%; patients were divided into low-risk (survival probability≥28.0%) and high-risk (survival probability<28.0%) groups. Similarly, the median 5-year survival probability of the nomogram was 12.7%; patients were divided into low-risk (survival probability ≥ 12.7%) and high-risk groups (survival probability<12.7%). Regardless of the 3-year survival probability and 5-year survival probability predicted by the nomogram, the results indicated that patients with higher risk had worse survival outcomes (P < 0.001) and the Kaplan–Meier OS curves showed great discrimination between the two risk groups in the training, internal, and external validation cohorts (Figure 5).
Figure 5.
Overall survival of the training and validation cohorts according to risk groups. Based on 3- and 5-year median survival probability calculated using the nomogram, patients were divided into low-risk and high-risk groups. The 3- and 5-year Kaplan–Meier survival curves of the nomogram in the training cohort (A, D), internal validation cohort (B, E), and external validation cohort (C, F).
Comparison of the nomogram with the TNM staging system
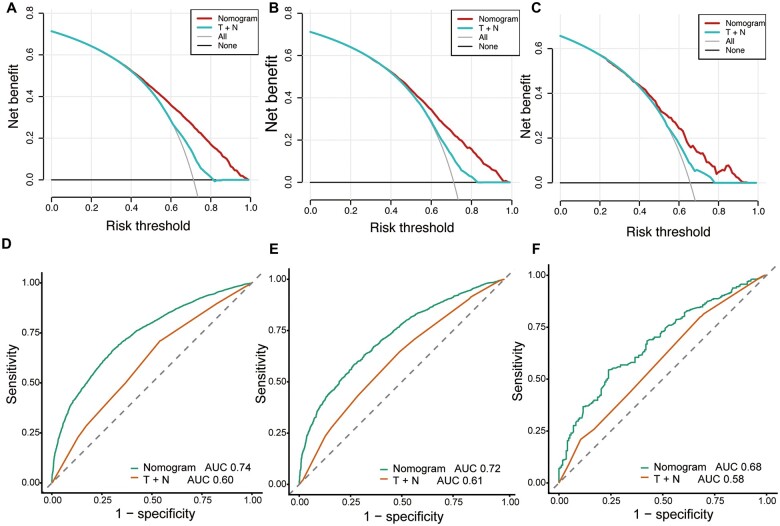
In order to calculate the discrimination ability of the nomogram and the TNM staging system, we used a ROC curve to compare the prognostic capabilities of the nomogram with those of the TNM staging system. The nomogram for OS in the training cohort (AUC: 0.74 vs 0.60), internal validation cohort (AUC: 0.72 vs 0.61), and external validation cohort (AUC: 0.72 vs 0.51) was superior to the TNM staging system (Figure 6). The DCA curve showed that the nomogram was superior to the TNM staging system in predicting OS (Figure 6). Besides, the DCA results in the three cohorts also indicated that the nomogram showed better clinical applicability than the TNM staging system.
Figure 6.
Decision curve analysis (DCA) and receiver-operating characteristic curve (ROC) for comparison of nomogram with T stage and N stage. (A) DCA in the training cohort. (B) DCA in the internal validation cohort. (C) DCA in the external validation cohort. (D) ROC in the training cohort. (E) ROC in the internal validation cohort. (F) ROC in the external validation cohort.
Discussion
We constructed a nomogram for patients with stage IV CRC containing all significant independent factors (age, tumor location, tumor size, T and N stages, histological differentiation, chemotherapy, number of LNs examined, and number of organ metastases) for predicting 3- and 5-year OS. The nomogram showed good performance in the discriminative ability and was well validated internally and externally. Besides, the performance of our nomogram in predicting prognosis was better than that of the TNM staging system. In addition, our study had a large number of patients analysed with long-term follow-up from two centers, which made the conclusion more solid.
The nomogram in our study showed that chemotherapy made the most significant contribution to the survival outcome, which was consistent with the result of a previous SEER study [15]. Although palliative surgery benefits stage IV CRC in cancer survival, comprehensive treatment based on chemotherapy is the only way to treat patients with a curative intent. Surgery only relieves the local tumor burden in patients with stage IV CRC, but chemotherapy works by killing whole-body cells. Palliative chemotherapy is the main treatment, which is consistent with clinical cognition [16, 17]. Our results support this viewpoint again. We also studied the racial factor of patients and found that black patients had the poorer prognosis. Several studies have concluded that the right colon was more likely to be associated with poor survival due to increased expression of the BRAF mutation [18–20] or the different expression of microsatellite instability status [20, 21]. Our result was consistent with the previous results [22, 23]. Interestingly, the prediction model built by Hua et al. [24] showed that the survival rate for patients with tumors in the rectum was higher than that for patients with tumors in other sites; however, we got the opposite result. The reason may be that the definition of the colon and the rectum in the study by Hua et al. [24] was different from that in our study. Their research did not involve the exact attribution of the rectosigmoid junction, but our study included the site of the rectosigmoid junction. The nomogram achieved appreciable predictive accuracy, considerable reliability, and significant clinical validity with a wide range of threshold probabilities using C-index and time-dependent ROC. DCA also demonstrated the remarkable clinical applicability of the nomogram with threshold probabilities.
In addition, we categorized patients into low-risk and high-risk groups based on the median 5-year predicted survival probability calculated by using the nomogram to validate the predictive ability of the nomogram. Using our nomogram risk-predicting model, we found that the 5-year survival curves showed great discrimination between the two risk groups in the training cohort, addressing that the predictive performance was no departure from the perfect fit. The favorable results were also replicated well in the two validation cohorts. It was obvious that the predictive model presented satisfactory discrimination and calibration, and thus may be useful in making individualized predictions of OS in patients with stage IV CRC.
TNM staging has certain limitations in predicting patients’ prognosis and many promising prognostic parameters remain important predictors of patient prognosis [10]. In order to compare the predictive ability of our nomogram and TNM staging system, we plotted the ROC curves. The nomogram was remarkably superior to the TNM staging system for predicting prognosis in the training cohort, internal validation cohort, and external validation cohort. The DCA curve presented that the nomogram was superior to the TNM staging system in predicting OS. Thus, we believed that our nomogram can be used for providing reference for survival estimation and individualized treatment for patients with stage IV CRC.
There are several limitations in our study. First, the SEER database does not provide information related to disease recurrence, so we were unable to construct a nomogram for predicting disease-free survival of stage IV CRC patients. Second, although our model was based on a large sample size of patients with a long-term overall observation, the nomogram was established retrospectively using the SEER and SYSU database, which may lead to potential selection bias. Finally, the details of microsatellite stability, BRAF and KRAS mutations, vascular invasion, and curability of stage IV CRC were inaccessible, which limited the analysis.
Despite the limitations above, we constructed a high-accuracy nomogram using easily available clinical pathological data, which can provide a reference for prognosis evaluation and individualized treatment for clinical stage IV CRC patients.
Authors’ Contributions
M.Y.L., X.J.C. and J.G.C. contributed equally to this study. M.Y.L., X.J.C., J.G.C., and X.S.H. contributed to the study concept and design; the acquisition, analysis, and interpretation of data; and the drafting of the manuscript. B.Z., Y.Y.L., T.Z.H., D.G.H., K.W., Z.J.C., and J.C.H. contributed to the data collections and manuscript reviews. All authors read and approved the final manuscript, and reached an agreement with all participants in this study to publish this document.
Acknowledgements
This work is supported by the National Key Clinical Discipline. This is a retrospective study from public data sets with demonstrated minimal risk and we petition for waiver of ethics consent.
Contributor Information
Min-Yi Lv, Department of Colorectal Surgery, The Sixth Affiliated Hospital, Sun Yat-sen University, Guangzhou, Guangdong, P. R. China; Guangdong Institute of Gastroenterology, Guangzhou, Guangdong, P. R. China; Department of Colorectal Surgery, Guangdong Provincial Key Laboratory of Colorectal and Pelvic Floor Diseases, The Sixth Affiliated Hospital, Sun Yat-sen University, Guangzhou, Guangdong, P. R. China.
Xi-Jie Chen, Department of Colorectal Surgery, The Sixth Affiliated Hospital, Sun Yat-sen University, Guangzhou, Guangdong, P. R. China; Guangdong Institute of Gastroenterology, Guangzhou, Guangdong, P. R. China; Department of Colorectal Surgery, Guangdong Provincial Key Laboratory of Colorectal and Pelvic Floor Diseases, The Sixth Affiliated Hospital, Sun Yat-sen University, Guangzhou, Guangdong, P. R. China.
Jun-Guo Chen, Department of Colorectal Surgery, The Sixth Affiliated Hospital, Sun Yat-sen University, Guangzhou, Guangdong, P. R. China; Guangdong Institute of Gastroenterology, Guangzhou, Guangdong, P. R. China; Department of Colorectal Surgery, Guangdong Provincial Key Laboratory of Colorectal and Pelvic Floor Diseases, The Sixth Affiliated Hospital, Sun Yat-sen University, Guangzhou, Guangdong, P. R. China.
Bin Zhang, Department of Colorectal Surgery, The Sixth Affiliated Hospital, Sun Yat-sen University, Guangzhou, Guangdong, P. R. China; Guangdong Institute of Gastroenterology, Guangzhou, Guangdong, P. R. China; Department of Colorectal Surgery, Guangdong Provincial Key Laboratory of Colorectal and Pelvic Floor Diseases, The Sixth Affiliated Hospital, Sun Yat-sen University, Guangzhou, Guangdong, P. R. China.
Yan-Yun Lin, Department of Colorectal Surgery, The Sixth Affiliated Hospital, Sun Yat-sen University, Guangzhou, Guangdong, P. R. China; Guangdong Institute of Gastroenterology, Guangzhou, Guangdong, P. R. China; Department of Colorectal Surgery, Guangdong Provincial Key Laboratory of Colorectal and Pelvic Floor Diseases, The Sixth Affiliated Hospital, Sun Yat-sen University, Guangzhou, Guangdong, P. R. China.
Tian-Ze Huang, Department of Colorectal Surgery, The Sixth Affiliated Hospital, Sun Yat-sen University, Guangzhou, Guangdong, P. R. China; Guangdong Institute of Gastroenterology, Guangzhou, Guangdong, P. R. China; Department of Colorectal Surgery, Guangdong Provincial Key Laboratory of Colorectal and Pelvic Floor Diseases, The Sixth Affiliated Hospital, Sun Yat-sen University, Guangzhou, Guangdong, P. R. China.
De-Gao He, Department of Colorectal Surgery, The Sixth Affiliated Hospital, Sun Yat-sen University, Guangzhou, Guangdong, P. R. China; Guangdong Institute of Gastroenterology, Guangzhou, Guangdong, P. R. China; Department of Colorectal Surgery, Guangdong Provincial Key Laboratory of Colorectal and Pelvic Floor Diseases, The Sixth Affiliated Hospital, Sun Yat-sen University, Guangzhou, Guangdong, P. R. China.
Kai Wang, Department of Colorectal Surgery, The Sixth Affiliated Hospital, Sun Yat-sen University, Guangzhou, Guangdong, P. R. China; Guangdong Institute of Gastroenterology, Guangzhou, Guangdong, P. R. China; Department of Colorectal Surgery, Guangdong Provincial Key Laboratory of Colorectal and Pelvic Floor Diseases, The Sixth Affiliated Hospital, Sun Yat-sen University, Guangzhou, Guangdong, P. R. China.
Zeng-Jie Chi, Department of Colorectal Surgery, The Sixth Affiliated Hospital, Sun Yat-sen University, Guangzhou, Guangdong, P. R. China; Guangdong Institute of Gastroenterology, Guangzhou, Guangdong, P. R. China; Department of Colorectal Surgery, Guangdong Provincial Key Laboratory of Colorectal and Pelvic Floor Diseases, The Sixth Affiliated Hospital, Sun Yat-sen University, Guangzhou, Guangdong, P. R. China.
Jian-Cong Hu, Department of Colorectal Surgery, The Sixth Affiliated Hospital, Sun Yat-sen University, Guangzhou, Guangdong, P. R. China; Guangdong Institute of Gastroenterology, Guangzhou, Guangdong, P. R. China; Department of Colorectal Surgery, Guangdong Provincial Key Laboratory of Colorectal and Pelvic Floor Diseases, The Sixth Affiliated Hospital, Sun Yat-sen University, Guangzhou, Guangdong, P. R. China.
Xiao-Sheng He, Department of Colorectal Surgery, The Sixth Affiliated Hospital, Sun Yat-sen University, Guangzhou, Guangdong, P. R. China; Guangdong Institute of Gastroenterology, Guangzhou, Guangdong, P. R. China; Department of Colorectal Surgery, Guangdong Provincial Key Laboratory of Colorectal and Pelvic Floor Diseases, The Sixth Affiliated Hospital, Sun Yat-sen University, Guangzhou, Guangdong, P. R. China.
Funding
This study was supported by the National Natural Science Foundation of China [no. 81970482, X.S.H.], National Natural Science Foundation of China [no.82172561, X.S.H.], and Guangdong Basic and Applied Basic Research Foundation [no. 2019A1515011313, X.S.H.].
Conflict of Interest
None declared.
References
- 1. Siegel RL, Miller KD, Fuchs HE. et al. Cancer Statistics, 2021. CA Cancer J Clin 2021;71:7–33. [DOI] [PubMed] [Google Scholar]
- 2. Xie Y, Shi L, He X. et al. Gastrointestinal cancers in China, the USA, and Europe. Gastroenterol Rep (Oxf) 2021;9:91–104. [DOI] [PMC free article] [PubMed] [Google Scholar]
- 3. van der Geest LGM, Lam-Boer J, Koopman M. et al. Nationwide trends in incidence, treatment and survival of colorectal cancer patients with synchronous metastases. Clin Exp Metastasis 2015;32:457–65. [DOI] [PubMed] [Google Scholar]
- 4. Lee RM, Cardona K, Russell MC.. Historical perspective: two decades of progress in treating metastatic colorectal cancer. J Surg Oncol 2019;119:549–63. [DOI] [PubMed] [Google Scholar]
- 5. Shida D, Ahiko Y, Tanabe T. et al. Shorter survival in adolescent and young adult patients, compared to adult patients, with stage IV colorectal cancer in Japan. BMC Cancer 2018;18:334. [DOI] [PMC free article] [PubMed] [Google Scholar]
- 6. Hawk NN, Long TE, Imam MH. et al. Clinicopathologic features and outcome of young adults with stage IV colorectal cancer. Am J Clin Oncol 2015;38:543–9. [DOI] [PubMed] [Google Scholar]
- 7. Jin M, Frankel WL.. Lymph node metastasis in colorectal cancer. Surg Oncol Clin N Am 2018;27:401–12. [DOI] [PubMed] [Google Scholar]
- 8. Ishizuka M, Nagata H, Takagi K. et al. Clinical significance of tumor pathology for postoperative survival of patients undergoing surgery for stage IV colorectal cancer. Anticancer Res 2012;32:3291–7. [PubMed] [Google Scholar]
- 9. Lugli A, Karamitopoulou E, Zlobec I.. Tumour budding: a promising parameter in colorectal cancer. Br J Cancer 2012;106:1713–7. [DOI] [PMC free article] [PubMed] [Google Scholar]
- 10. Maguire A, Sheahan K.. Controversies in the pathological assessment of colorectal cancer. World J Gastroenterol 2014;20:9850–61. [DOI] [PMC free article] [PubMed] [Google Scholar]
- 11. National Cancer Institute Surveillance Program. List of SEER Registries 2021. https://seer.cancer.gov/data-software/documentation/seerstat/nov2017/.
- 12. Surveillance Research Program. National Cancer Institute SEERStat Software, Version 8.3.5. 2021. https://seer.cancer.gov/seerstat/.
- 13. Wong SL, Ji H, Hollenbeck BK. et al. Hospital lymph node examination rates and survival after resection for colon cancer. JAMA 2007;298:2149–54. [DOI] [PubMed] [Google Scholar]
- 14. Tataranni T, Piccoli C.. Dichloroacetate (DCA) and cancer: an overview towards clinical applications. Oxid Med Cell Longev 2019;2019:8201079. [DOI] [PMC free article] [PubMed] [Google Scholar]
- 15. Liu Z, Xu Y, Xu G. et al. Nomogram for predicting overall survival in colorectal cancer with distant metastasis. BMC Gastroenterol 2021;21:103. [DOI] [PMC free article] [PubMed] [Google Scholar]
- 16. Messersmith WA. NCCN guidelines updates: management of metastatic colorectal cancer. J Natl Compr Canc Netw 2019;17:599–601. [DOI] [PubMed] [Google Scholar]
- 17. Benson AB, Venook AP, Al-Hawary MM. et al. Colon cancer, version 2.2021, NCCN clinical practice guidelines in oncology. J Natl Compr Canc Netw 2021;19:329–59. [DOI] [PubMed] [Google Scholar]
- 18. Tapia Rico G, Price T, Tebbutt N. et al. Right or left primary site of colorectal cancer: outcomes from the molecular analysis of the AGITG MAX trial. Clin Colorectal Cancer 2019;18:141–8. [DOI] [PubMed] [Google Scholar]
- 19. Lièvre A, de la Fouchardière C, Samalin E. et al. BRAF V600E-mutant colorectal cancers: where are we? Bull Cancer 2020;107:881–95. [DOI] [PubMed] [Google Scholar]
- 20. Lee MS, Menter DG, Kopetz S.. Right versus left colon cancer biology: integrating the consensus molecular subtypes. J Natl Compr Canc Netw 2017;15:411–9. [DOI] [PubMed] [Google Scholar]
- 21. Papagiorgis PC, Zizi AE, Tseleni S. et al. The pattern of epidermal growth factor receptor variation with disease progression and aggressiveness in colorectal cancer depends on tumor location. Oncol Lett 2012;3:1129–35. [DOI] [PMC free article] [PubMed] [Google Scholar]
- 22. Ghidini M, Petrelli F, Tomasello G.. Right versus left colon cancer: resectable and metastatic disease. Curr Treat Options Oncol 2018;19:31. [DOI] [PubMed] [Google Scholar]
- 23. Yahagi M, Okabayashi K, Hasegawa H. et al. The worse prognosis of right-sided compared with left-sided colon cancers: a systematic review and meta-analysis. J Gastrointest Surg 2016;20:648–55. [DOI] [PubMed] [Google Scholar]
- 24. Ge H, Yan Y, Xie M. et al. Construction of a nomogram to predict overall survival for patients with M1 stage of colorectal cancer: a retrospective cohort study. Int J Surg 2019;72;96–101. [DOI] [PubMed] [Google Scholar]


