

Abstract
Purpose:
Our primary purpose was to quantify the proportion of minor hand surgeries performed in the procedure room (PR) setting in a population-based cohort. Given an increase in literature that has emerged since the mid-2000’s that have highlighted the benefits of the PR setting, we hypothesized that a trend analysis would reveal increased utilization over time.
Methods:
We utilized the 2006–2017 MarketScan Commercial Database to identify adults undergoing isolated minor hand surgeries within the United States performed in PR and operation room (OR) surgical settings. The Cochran-Armitage trends test was used to determine whether the proportion of PR of all procedures (PR + OR)) changed over time.
Results:
A total of 257,581 surgeries were included in the analysis, of which 24,966 (11.5%) were PR. There was an increase in the overall number of surgeries under study, as well as increased utilization of the PR setting for open carpal tunnel release (oCTR), trigger digit release (TDR), DeQuervain release (DQR), hand/finger mass excisions, and hand/finger cyst excision. The magnitude of the increases in PR utilization were small: between 2006 and 2017 oCTR increased by 1.4%, TDR increased by 5.4%, DQR increased by 2.9%, hand/finger mass excision increased by 10.1%, and hand/finger cyst excision increased by 6.5%.
Conclusions:
Despite published benefits of the PR, we observed that the majority of five common minor hand surgeries are performed in the OR setting. Between 2006 and 2017, office-based PR utilization increased slightly. Identification of barriers to PR utilization is needed to improve the value of care.
Type of Study: Economic / Decision Analysis
Level of Evidence: II
Keywords: Trend Analysis, MarketScan Database, Procedure Room, Minor Hand Surgeries
Introduction:
Within the United States, there has been an increasing focus on implementing policies that encourage value-based payment models in an effort to improve the value of healthcare delivery.1 Value of care is equivalent to the treatment outcome, or level of improvement, per unit cost.2–5 Providers can increase the value of care by improving functional or clinical outcomes while maintaining commensurate treatment expenditure. Likewise, decreasing treatment costs while continuing comparable functional, clinical and safety outcomes will also improve the value of care. Thus, these efforts are being made to improve healthcare delivery by optimizing treatment outcomes in the most efficient manner possible in order to reduce any avoidable costs.
Within hand surgery, considerable literature on the benefits of utilizing a procedure room (PR) setting for minor hand surgeries rather than the traditional operating room (OR) setting has recently accumulated as a means of improving the value of healthcare. Since 2016, available literature regarding wide awake local anesthesia no tourniquet (WALANT) in the PR setting has increased over 21-fold on the pubmed.gov database. Much of this literature shows that minor hand surgeries performed in the PR surgical setting are associated with substantially lower surgical costs compared to use of the OR.6–16 PR utilization has also been shown to have low complication rates,13,17 as well as similar clinical outcomes as compared to the OR surgical setting.18 PR utilization for minor hand procedures has been reported as an effective means to improve value of care across a variety of population settings in the United States civilian and military populations, Canada, and the United Kingdom.7,9,11,12,15,19–21
In light of these studies highlighting advantages of the PR setting that have emerged in the literature since the mid 2000’s, our primary aim was to quantify the proportion of minor hand surgeries performed in the PR setting in a population-based cohort. Secondarily, we aimed to test the hypothesis that utilization of the PR setting for minor hand surgeries has increased over time by performing a formal trend analysis.
Methods and Materials:
We utilized the IBM MarketScan Commercial Database to identify adults aged 18–64 years undergoing isolated (e.g. no other simultaneous surgical CPT codes) minor hand surgeries between 2006–2017 performed in PR and OR surgical settings. The MarketScan database is an administrative claims database including outpatient pharmacy claims and enrollment information supplied by commercial health insurance plans and employers. The database consists of over 150 million patients throughout the study’s duration. Included in the database are data for dependents, employees, and persons with Consolidated Omnibus Budget Reconciliation Act (COBRA) continuation covered by employer-sponsored health insurance plans, as well as other commercial health insurance plans. The MarketScan database does not include uninsured individuals, individuals with government-sponsored plans, workers compensation, or persons with other types of private insurance. This study was reviewed and considered exempt by the University of Utah Institutional Review Board and the Washington University Human Research Protection Office, as the MarketScan database is a deidentified limited dataset.
We evaluated open carpal tunnel release (oCTR), trigger digit release (TDR), DeQuervain release (DQR), hand/finger benign mass excision, and hand/finger cyst excision. To identify patients undergoing these procedures we used the following CPT codes from provider claims: 64721 (oCTR), 26055 (TDR), 25000 (DQR), 26115 or 26116 (hand/finger benign mass excision) and CPT 26160 (hand/finger cyst excision). These codes were obtained from the inpatient and outpatient medical claims coded by a provider (excluding assistants). Patients were designated as ‘OR’ if their procedure had an associated OR Uniform Billing revenue code at either an inpatient hospital, outpatient hospital, or ambulatory surgical center. Patients were designated as ‘PR’ if they did not have an associated OR revenue code nor an anesthesia charge (Appendix I) on the date of surgery, did not have a facility place of service of 21 (inpatient hospital), 22 (outpatient hospital) or 24 (ambulatory surgical center), but instead had a place of service coded 11 (representing in-office procedures) on the surgery date.
Patients who underwent additional simultaneous surgical procedures (other than the minor hand surgery procedure codes, procedures performed to address intraoperative iatrogenic injuries (e.g. repair or ligation of blood vessel, repair of peripheral nerve, repair of flexor tendon), and nerve block procedures; Appendix I) on the same date of the minor hand surgery were excluded to allow for comparable analysis of outcomes following isolated surgical procedures in either the PR or OR surgical setting. Surgeries performed by a physician other than an orthopedic, neuro-, plastic, or unclassified surgeon and surgeries that were likely non-elective (e.g., place of service in an emergency room, surgery during a hospitalization not performed on the day of admission) were also excluded. In addition, patients who resided in an unknown census region were excluded, in order to restrict the population to known U.S. residents.
Trends analyses were performed using the Cochran-Armitage test. Specifically, we evaluated whether the proportion of the surgeries under study that were performed in the PR setting versus the total number of procedures (PR + OR) changed over the study period. This included trends analyses for each surgery type and breakdown by performing provider (orthopaedic surgeon, plastic surgeon, surgeon (not otherwise classified), neurosurgeon). We additionally quantified and evaluated the proportion of minor hand surgeries in the OR setting during the same timeframe. The procedure rate of each surgery type was reported by year using the total number of eligible patients in the MarketScan database each year (i.e., persons aged 18–64 who were not categorized as residing in an unknown census region; Appendix II) as the denominator, to determine the overall utilization of procedures.
Results:
We identified 976,886 minor hand surgeries over the study period. Surgeries were excluded for the following reasons: surgeries not able to be categorized as OR vs PR (n=520,536), age <18 years (n=10,481), unrelated additional procedure coded on the index surgery date (n=125,169), evidence of ER encounter on the index surgery date (n=368), surgeries took place during an inpatient admission and were not performed on the admission date (n=12), surgeries with unknown geographical region (n=7,104), and surgeries performed by a provider other than an orthopaedic, plastic, surgeon (NEC), or neurosurgeon (n=55,635). Approximately 75% of procedures that could not be classified as “OR” or “PR” had a CPT code for general/regional anesthesia but no revenue code for operating room services, and were therefore not classified as “PR”. After applying the study inclusion and exclusion criteria, a total 257,581 surgeries were included, of which 24,966 were classified as “PR” (11.5%) and 232,615 were classified as “OR” surgeries.
The proportion of PR use by year and surgery type is provided in Table 1, and the rate of each surgery performed in the PR and OR settings per 1,000,000 adults in the MarketScan database, by year and procedure type, is provided in Tables 2 – 6. From 2006 to 2017, there was an increase in the overall number of surgeries under study. The rate of performance of procedures per 1,000,000 adults aged 18–64 years in the database increased significantly from 2006 to 2017 in the PR setting (all p < 0.001 except hand/finger benign mass excision, p = 0.017) and in the OR setting, with the exception of hand/finger benign mass excision, which decreased significantly from 2006 to 2017 (all p < 0.001). Rates of performance of procedures/1,000,000 adults in the PR from 2006 to 2017 ranged from 9.6 to 17.8 for open carpal tunnel release, 1.5 to 4.3 for DeQuervain release, 8.6 to 10.3 for hand/finger benign mass excision, 10.6 to 18.6 for hand/finger ganglion excision, and 23.1 to 53.3 for trigger digit release. Rates of procedures performed in the OR from 2006 to 2017 were much higher than the rates of procedures performed in the PR, ranging from a low of 30.7 in 2006 for DeQuervain release, to a high of 416/1,000,000 adults in 2017 for open carpal tunnel release. Performance of hand/finger benign mass excision in the OR decreased from 2006 to 2017 (35.9 in 2006 to 24.8/1,000,000 adults in 2017).
Table 1:
Proportion of Procedure Room Use by Year and Surgery Type
| Year of Surgery | % of Cases Done in PR | ||||
|---|---|---|---|---|---|
| oCTR | TDR | DQR | Finger/hand mass excision | Finger/hand cyst excision | |
| 2006 | 2.5% | 13.8% | 4.0% | 19.5% | 19.6% |
| 2007 | 2.3% | 15.8% | 5.1% | 20.5% | 19.3% |
| 2008 | 1.9% | 18.0% | 2.4% | 20.7% | 20.7% |
| 2009 | 2.4% | 19.6% | 4.9% | 19.4% | 23.7% |
| 2010 | 2.3% | 18.6% | 4.0% | 23.4% | 24.1% |
| 2011 | 2.7% | 19.2% | 3.5% | 27.5% | 23.0% |
| 2012 | 2.8% | 19.4% | 5.7% | 25.7% | 21.9% |
| 2013 | 2.9% | 20.0% | 5.5% | 27.5% | 21.8% |
| 2014 | 2.1% | 19.2% | 6.6% | 26.3% | 20.4% |
| 2015 | 2.7% | 16.7% | 5.7% | 22.4% | 22.3% |
| 2016 | 2.8% | 19.5% | 6.1% | 27.8% | 21.4% |
| 2017 | 4.3% | 19.9% | 5.9% | 33.2% | 26.7% |
| All | 2.6% | 18.7% | 5.1% | 24.1% | 22.1% |
Table 2:
Rates of Open Carpal Tunnel Release Procedure Room and Operating Room Utilization by Year
| Open Carpal Tunnel Release | ||||
|---|---|---|---|---|
| Year | # PR | PR Utilization Rate per 1,000,000 Adults | # OR | OR Utilization Rate per 1,000,000 Adults |
| 2006 | 222 | 9.6 | 7950 | 343.8 |
| 2007 | 197 | 7.7 | 8744 | 342.8 |
| 2008 | 209 | 6.0 | 11166 | 322.1 |
| 2009 | 250 | 7.2 | 10867 | 312.6 |
| 2010 | 264 | 7.9 | 11359 | 341.4 |
| 2011 | 351 | 9.2 | 14214 | 373.9 |
| 2012 | 393 | 10.2 | 14724 | 381.7 |
| 2013 | 385 | 12.1 | 13182 | 415.3 |
| 2014 | 343 | 9.9 | 15881 | 458.2 |
| 2015 | 259 | 12.1 | 9168 | 427.6 |
| 2016 | 272 | 12.8 | 9060 | 425.6 |
| 2017 | 357 | 17.8 | 8324 | 416.2 |
Table 6:
Rates of Trigger Digit Release Procedure Room and Operating Room Utilization by Year
| Trigger Digit Release | ||||
|---|---|---|---|---|
| Year | # PR | PR Utilization Rate per 1,000,000 Adults | # OR | OR Utilization Rate per 1,000,000 Adults |
| 2006 | 534 | 23.1 | 3091 | 133.7 |
| 2007 | 650 | 25.5 | 3337 | 130.8 |
| 2008 | 943 | 27.2 | 4455 | 128.5 |
| 2009 | 1059 | 30.5 | 4399 | 126.5 |
| 2010 | 1050 | 31.6 | 4646 | 139.6 |
| 2011 | 1239 | 32.6 | 5604 | 147.4 |
| 2012 | 1419 | 36.8 | 5918 | 153.4 |
| 2013 | 1445 | 45.5 | 5858 | 184.6 |
| 2014 | 1505 | 43.4 | 7038 | 203.1 |
| 2015 | 977 | 45.6 | 4742 | 221.2 |
| 2016 | 1084 | 50.9 | 4536 | 213.1 |
| 2017 | 1067 | 53.3 | 4237 | 211.8 |
Although there was an overall statistically significant increase in the proportion of surgeries performed in the PR setting for oCTR, TDR, DQR, and hand/finger mass excisions (p < 0.05 for each) compared to the OR setting (Figure 1), the clinical relevance of these changes are questionable. Specifically, the magnitude of the increase was small for each of these surgeries: between 2006 and 2017, the proportion of oCTR performed in the PR increased by 1.4%, TDR increased by 5.4%, DQR increased by 2.9%, hand/finger mass excision increased by 10.1%, and hand/finger cyst excision increased by 6.5%.
Figure 1:
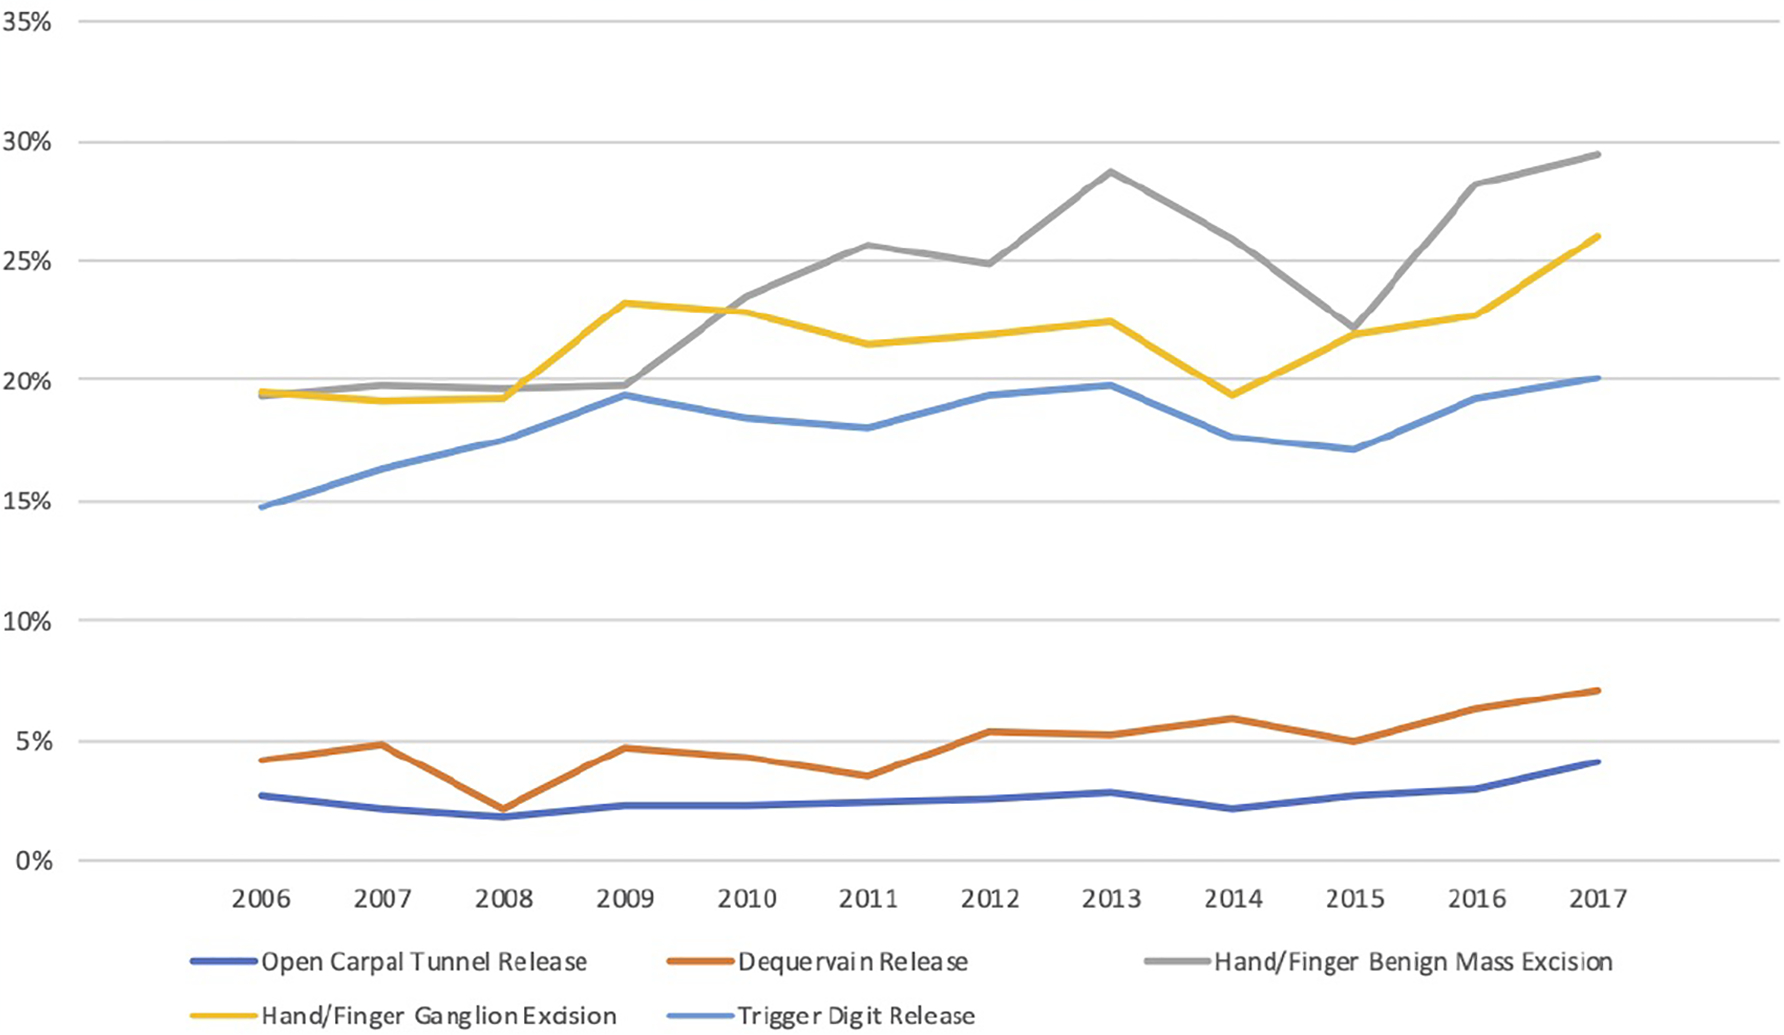
Proportion of Procedures Performed in the Procedure Room (versus Operating Room) by Year and Procedure Type
Discussion:
Despite the numerous well-documented advantages of moving minor hand surgeries out of the traditional OR setting and into the PR, we observed that the vast majority of five common minor hand surgeries are still disproportionately performed in the OR surgical setting in this large commercially-insured population-based cohort. Our main study finding was that between 2006 and 2017, use of the PR surgical setting has increased significantly but not in a clinically meaningful way. The observed increases in PR utilization were trivial and incongruent with the cost-savings,6,8,16 acceptable safety profile,11,17,22–28 and equivalent outcomes18 demonstrated for minor hand surgeries performed in the PR.
Our results parallel the findings of Lalchandani et al,24 in which utilization of wide-awake local-only (WALA) techniques for CTR, DQR, and TDR did not appreciably change over time. Specifically, the rate of WALA use increased from 18% in 2008 to 21% in 2015 in the PearlDiver Database – a large commercially-insured cohort. As in our cohort, we believe that this change is minor even if statistically significant (not reported by the authors) in light of published benefits of the PR setting. Their study evaluated all patients treated with local-only anesthesia in the PearlDiver Database and did not differentiate between PR and OR settings, and therefore their results pertain to the use of local-only anesthesia in any surgical setting. The findings of the current study therefore add to the findings of Lalchandani et al, as we conclude that use of the in-office PR setting has not appreciably changed over time for minor hand surgeries in a separate, large, population-based cohort.
Studies have shown that PR costs are lower for oCTR in a variety of settings, including within the United States,15 Canada,20 and Great Britain.21 Additionally, PR utilization has proven cost-effective among military,9 academic,6 and commercially insured populations.16 Also, PR utilization has been shown to have acceptable or potentially lower complication rates compared to the OR. While Randall et al reported similar pooled major medical, wound/surgical site, and iatrogenic complications for oCTR performed in PR versus OR,22 Kazmers et al reported significantly lower major medical complications with similar wound and iatrogenic complications for PR utilization for trigger digit release surgeries compared to OR.23 Similarly, Billig et al reported lower complications for minor hand surgical procedures in a PR setting compared to hospital outpatient departments and ambulatory surgical centers.16 Given the advantages of PR utilization, our findings clearly show hesitance among hand surgeons to adopt new practice patterns based on new evidence. This problem is not unique to hand surgeons and is pervasive in medicine in general.29,30 New evidence is often slow to change clinical practice, and medical providers across specialties may be slow to adopt new findings and change their practice for a variety of reasons, including financial incentives, ambiguity of study results, cognitive biases in the interpretation of new information, and limited use of decision support by clinicians and patients.31 However, favorable responses to new medical evidence do occur, albeit slowly. Examples in orthopaedics include a moderate reduction in performing vertebroplasty or kyphoplasty for vertebral compression fractures after the publication of two negative randomized trials,32 and a reduction in knee debridement in the setting of arthritis after negative randomized trials.33 Results of these two studies may be explained, at least in part, by changes in insurance coverage for vertebroplasty/kyphoplasty and knee debridement, that was catalyzed by publication of high-level negative randomized trials.32,33 The findings of the current study raise the question as to why the PR surgical setting is under-utilized for minor hand surgeries, and highlight the possibility that major changes in PR utilization may remain minimal in this commercially-insured population so long as payers continue to support use of the OR for isolated minor hand surgeries such as CTR or TFR.
Prior literature suggests that older surgeons who have been in practice longer are less likely to perform minor hand surgeries under local-only anesthesia in the PR setting.34 It is possible that surgeon comfort may limit PR utilization in some circumstances. The ease or difficulty of performing the surgery in PR without the assistance of anesthesia may factor into this as well. It is possible that some patients with medical conditions and comorbidities may require surgery with additional monitoring or standby support of anesthesia, which may make the OR surgical setting more ideal. In regard to surgical volume, low-volume surgeons are less likely to utilize the PR setting, as compared to high-volume surgeons who may have a relative paucity of OR time – it is possible that OR accessibility influences a surgeon’s desire to use the PR setting.34 Clinic staffing, scheduling, PR availability, availability of instrumentation/processing and other equipment, and patient preference could all additionally be potential barriers to PR utilization.
Other systems or institutional barriers to utilizing the PR may exist, including requirements for anesthesia coverage of PR surgeries, which has been noted in a survey-based study by 51% of hand surgeon respondents.34 This requirement would drastically reduce the efficiency of the PR. Another potential barrier to PR implementation relates to finances. Income for specific hospital systems, or surgeon payments in certain reimbursement models, may be greater when the OR is utilized for applicable high-volume minor hand surgeries, as the PR setting is known to lower facility payments and anesthesia payments are absent. For example, total combined payments for oCTR performed in the OR were 1.2- to 2.4-fold greater than for the PR.6 This is particularly relevant to surgeons who are part of a profit-sharing group who may derive compensation through facility fees of a surgical center or other operational setting. These groups may be incentivized to utilize the OR more frequently due to the higher facility fees that have a direct impact on surgeon reimbursement. Likewise, utilizing an anesthesiologist as opposed to surgeon-administered local anesthesia generates more overall revenue. There continues to be a lack of transparency for patients in healthcare costs and financial differences among treatment options and providers. In order to decrease overall healthcare spending and to reduce continuing financial harm to patients, policies that incentivize surgeons and healthcare systems to utilize the PR surgical setting when possible may be warranted. Lastly, patient preference and education on the differences between OR and PR surgical settings may also play a role in limiting PR use.
Study limitations deserve mention. Given the administrative database we used to identify our cohort, there was potential for coding errors. However, as MarketScan database is a claims database in which accurate coding of surgeries is tied to reimbursement, and thus surgeries are likely to be coded more accurately than minor complications or other non-reimbursable clinical events. As previously mentioned, the MarketScan database is limited in scope and data as it represents only commercially insured patients younger than 65 years within the United States. Thus, the ability to generalize the results to other countries as well as older patients or patients with Medicare/Medicaid, VA health care, etc., are unclear. Additionally, there was a large number of patients who did not meet our inclusion criteria and were thus excluded. As we noted that a large number of excluded cases could not be classified as being performed in either OR or PR settings, there is reason to believe that many of these cases were performed in an OR (rather than PR) due to presence of CPT codes for general/regional anesthesia but were not included due to the absence of a revenue code for OR services. Thus, it is possible that the proportion of each surgery type we studied may be overestimated in the PR, as it is likely that some of the cases excluded on this basis were done in the OR. Though it is possible that these exclusions could affect our results, it is unknown if the patients included in our study differ from those excluded. Thus, there is potential for selection bias. It is noteworthy to mention that the database only includes the timeframe from 2006 to 2017. It is possible that there may have been further increases in PR utilization beyond 2017 that were not captured in this study, as the PR cases in this study were performed in-office (place of service code 11). Due to limitations in discriminating between PR and OR settings in other healthcare settings, such as place of service of 21 (inpatient hospital), 22 (outpatient hospital) or 24 (ambulatory surgical center), use of the PR in those settings was not captured by this study and therefore our results apply directly to use of the in-office PR rather than all possible PR settings. It is important to note that the common denominator is the use of surgeon administered local anesthesia outside of the OR and a lack of anesthesia support. We also did not subdivide and analyze the data based on the different OR locations. Finally, the procedure rates we calculated may be an underestimate of the true rates of OR and PR surgery by year, as we used a person-level rather than a person-time denominator, and approximately 85% of full-year person-time is represented in the MarketScan database.
In conclusion, this study performed on a large, population-based US cohort demonstrated that the vast majority of five common minor hand surgeries are being performed in the OR surgical setting rather than the in-office PR. Increases in PR utilization were minimal between 2006 and 2017. In light of the abundance of published literature documenting advantages of PR utilization for minor hand surgeries, we conclude that the PR us underutilized in this population and that addressing barriers to PR utilization warrants further attention in attempt to improve the value of care for patients undergoing minor hand surgeries.
Supplementary Material
Appendix 1: Coding Used to Identify Associated Operating Room Revenue Code or Anesthesia Charge
Appendix 2: Total number of eligible patients in the MarketScan Database (Denominator) by Year
Table 3:
Rates of Dequervain Release Procedure Room and Operating Room Utilization by Year
| Dequervain Release | ||||
|---|---|---|---|---|
| Year | # PR | PR Utilization Rate per 1,000,000 Adults | # OR | OR Utilization Rate per 1,000,000 Adults |
| 2006 | 35 | 1.5 | 709 | 30.7 |
| 2007 | 45 | 1.8 | 770 | 30.2 |
| 2008 | 28 | 0.8 | 1005 | 29.0 |
| 2009 | 53 | 1.5 | 983 | 28.3 |
| 2010 | 50 | 1.5 | 1068 | 32.1 |
| 2011 | 49 | 1.3 | 1286 | 33.8 |
| 2012 | 87 | 2.3 | 1436 | 37.2 |
| 2013 | 79 | 2.5 | 1347 | 42.4 |
| 2014 | 105 | 3.0 | 1476 | 42.6 |
| 2015 | 64 | 3.0 | 1083 | 50.5 |
| 2016 | 81 | 3.8 | 1099 | 51.6 |
| 2017 | 86 | 4.3 | 1000 | 50.0 |
Table 4:
Rates of Hand/Finger Benign Mass Excision Procedure Room and Operating Room Utilization by Year
| Hand/Finger Benign Mass Excision | ||||
|---|---|---|---|---|
| Year | # PR | PR Utilization Rate per 1,000,000 Adults | # OR | OR Utilization Rate per 1,000,000 Adults |
| 2006 | 199 | 8.6 | 829 | 35.9 |
| 2007 | 211 | 8.3 | 854 | 33.5 |
| 2008 | 280 | 8.1 | 1146 | 33.1 |
| 2009 | 279 | 8.0 | 1129 | 32.5 |
| 2010 | 256 | 7.7 | 831 | 25.0 |
| 2011 | 297 | 7.8 | 860 | 22.6 |
| 2012 | 275 | 7.1 | 833 | 21.6 |
| 2013 | 327 | 10.3 | 812 | 25.6 |
| 2014 | 286 | 8.3 | 816 | 23.5 |
| 2015 | 154 | 7.2 | 541 | 25.2 |
| 2016 | 208 | 9.8 | 528 | 24.8 |
| 2017 | 207 | 10.3 | 496 | 24.8 |
Table 5:
Rates of Hand/Finger Ganglion Excision Procedure Room and Operating Room Utilization by Year
| Hand/Finger Ganglion Excision | ||||
|---|---|---|---|---|
| Year | # PR | PR Utilization Rate per 1,000,000 Adults | # OR | OR Utilization Rate per 1,000,000 Adults |
| 2006 | 245 | 10.6 | 1006 | 43.5 |
| 2007 | 283 | 11.1 | 1194 | 46.8 |
| 2008 | 340 | 9.8 | 1421 | 41.0 |
| 2009 | 449 | 12.9 | 1476 | 42.5 |
| 2010 | 427 | 12.8 | 1445 | 43.4 |
| 2011 | 454 | 11.9 | 1655 | 43.5 |
| 2012 | 510 | 13.2 | 1821 | 47.2 |
| 2013 | 510 | 16.1 | 1758 | 55.4 |
| 2014 | 462 | 13.3 | 1916 | 55.3 |
| 2015 | 346 | 16.1 | 1235 | 57.6 |
| 2016 | 352 | 16.5 | 1192 | 56.0 |
| 2017 | 373 | 18.6 | 1059 | 52.9 |
Acknowledgements:
The Center for Administrative Data Research is supported in part by the Washington University Institute of Clinical and Translational Sciences grant UL1 TR002345 from the National Center for Advancing Translational Sciences (NCATS) of the National Institutes of Health (NIH) and Grant Number R24 HS19455 through the Agency for Healthcare Research and Quality (AHRQ).
Footnotes
Publisher's Disclaimer: This is a PDF file of an unedited manuscript that has been accepted for publication. As a service to our customers we are providing this early version of the manuscript. The manuscript will undergo copyediting, typesetting, and review of the resulting proof before it is published in its final form. Please note that during the production process errors may be discovered which could affect the content, and all legal disclaimers that apply to the journal pertain.
References:
- 1.Lee VS, Kawamoto K, Hess R, et al. Implementation of a value-driven outcomes program to identify high variability in clinical costs and outcomes and association with reduced cost and improved quality. JAMA. 2016;316(10):1061–1072. [DOI] [PubMed] [Google Scholar]
- 2.Porter ME, Lee TH. From volume to value in health care: The work begins. JAMA. 2016;316(10):1047–1048. [DOI] [PubMed] [Google Scholar]
- 3.Porter ME. What is value in health care? N Engl J Med. 2010;363(26):2477–2481. [DOI] [PubMed] [Google Scholar]
- 4.Porter ME. A strategy for health care reform--toward a value-based system. N Engl J Med. 2009;361(2):109–112. [DOI] [PubMed] [Google Scholar]
- 5.Porter ME. Value-based health care delivery. Ann Surg. 2008;248(4):503–509. [DOI] [PubMed] [Google Scholar]
- 6.Kazmers NH, Presson AP, Xu Y, Howenstein A, Tyser AR. Cost implications of varying the surgical technique, surgical setting, and anesthesia type for carpal tunnel release surgery. J Hand Surg Am. 2018;43(11):971–977 e971. [DOI] [PMC free article] [PubMed] [Google Scholar]
- 7.Kazmers NH, Stephens AR, Presson AP, Yu Z, Tyser AR. Cost implications of varying the surgical setting and anesthesia type for trigger finger release surgery. Plast Reconstr Surg Glob Open. 2019;7(5):e2231. [DOI] [PMC free article] [PubMed] [Google Scholar]
- 8.Stephens AR, Yu Z, Presson AP, Tyser AR, Kazmers NH. Cost implications of varying the surgical setting and anesthesia type for de quervain release surgery. J Wrist Surg. 2020;9(4):289–297. [DOI] [PMC free article] [PubMed] [Google Scholar]
- 9.Rhee PC, Fischer MM, Rhee LS, McMillan H, Johnson AE. Cost savings and patient experiences of a clinic-based, wide-awake hand surgery program at a military medical center: A critical analysis of the first 100 procedures. J Hand Surg Am. 2017;42(3):e139–e147. [DOI] [PubMed] [Google Scholar]
- 10.Rabinowitz J, Kelly T, Peterson A, Angermeier E, Kokko K. In-office wide-awake hand surgery versus traditional surgery in the operating room: A comparison of clinical outcomes and healthcare costs at an academic institution. Curr Orthop Pract. 2019;30(5):429. [Google Scholar]
- 11.Maliha SG, Cohen O, Jacoby A, Sharma S. A cost and efficiency analysis of the walant technique for the management of trigger finger in a procedure room of a major city hospital. Plast Reconstr Surg Glob Open. 2019;7(11):e2509. [DOI] [PMC free article] [PubMed] [Google Scholar]
- 12.Leblanc MR, Lalonde J, Lalonde DH. A detailed cost and efficiency analysis of performing carpal tunnel surgery in the main operating room versus the ambulatory setting in canada. Hand (N Y). 2007;2(4):173–178. [DOI] [PMC free article] [PubMed] [Google Scholar]
- 13.Leblanc MR, Lalonde DH, Thoma A, et al. Is main operating room sterility really necessary in carpal tunnel surgery? A multicenter prospective study of minor procedure room field sterility surgery. Hand (N Y). 2011;6(1):60–63. [DOI] [PMC free article] [PubMed] [Google Scholar]
- 14.Lalonde D, Martin A. Epinephrine in local anesthesia in finger and hand surgery: The case for wide-awake anesthesia. J Am Acad Orthop Surg. 2013;21(8):443–447. [DOI] [PubMed] [Google Scholar]
- 15.Chatterjee A, McCarthy JE, Montagne SA, Leong K, Kerrigan CL. A cost, profit, and efficiency analysis of performing carpal tunnel surgery in the operating room versus the clinic setting in the united states. Ann Plast Surg. 2011;66(3):245–248. [DOI] [PubMed] [Google Scholar]
- 16.Billig JI, Nasser JS, Chen JS, et al. Comparison of safety and insurance payments for minor hand procedures across operative settings. JAMA Netw Open. 2020;3(10):e2015951. [DOI] [PMC free article] [PubMed] [Google Scholar]
- 17.Stephens AR, Presson AP, Jo YJ, et al. Evaluating the safety of the hand surgery procedure room: A single-center cohort of 1,404 surgical encounters. J Hand Surg Am. 2021;(in press)( [DOI] [PMC free article] [PubMed] [Google Scholar]
- 18.Stephens AR, Tyser AR, Presson AP, et al. A comparison of open carpal tunnel release outcomes between procedure room and operating room settings. J Hand Surg Glob Online. 2021;3(1):12–16. [DOI] [PMC free article] [PubMed] [Google Scholar]
- 19.Davison PG, Cobb T, Lalonde DH. The patient’s perspective on carpal tunnel surgery related to the type of anesthesia: A prospective cohort study. Hand (N Y). 2013;8(1):47–53. [DOI] [PMC free article] [PubMed] [Google Scholar]
- 20.Lalonde D, Martin A. Tumescent local anesthesia for hand surgery: Improved results, cost effectiveness, and wide-awake patient satisfaction. Arch Plast Surg. 2014;41(4):312–316. [DOI] [PMC free article] [PubMed] [Google Scholar]
- 21.Williamson M, Sehjal R, Jones M, James C, Smith A. How critical cost analysis can save money in today’s nhs: A review of carpal tunnel surgery in a district general hospital. BMJ Open Qual. 2018;7(2):e000115. [DOI] [PMC free article] [PubMed] [Google Scholar]
- 22.Randall DJ PK, Nickel KB, Olsen M, Tyser AR, Kazmers NH Population-based comparison of complication risk for open carpal tunnel release performed in-office versus in the operating room. Plastic and Reconstructive Surgery - Global Open. 2021; [DOI] [PMC free article] [PubMed] [Google Scholar]
- 23.Kazmers NH PK, Nickel KB, Stephens AR, Olsen M, Tyser AR Complication risk following trigger digit release performed in-office versus in the operating room: A population-based assessment. . Journal of Hand Surgery 2021; [DOI] [PMC free article] [PubMed] [Google Scholar]
- 24.Lalchandani GR, Halvorson RT, Rahgozar P, Immerman I. Wide-awake local anesthesia for minor hand surgery associated with lower opioid prescriptions, morbidity, and costs: A nationwide database study. Journal of Hand Surgery Global Online. 2020;2(1):7–12. [DOI] [PMC free article] [PubMed] [Google Scholar]
- 25.Lipira AB, Sood RF, Tatman PD, Davis JI, Morrison SD, Ko JH. Complications within 30 days of hand surgery: An analysis of 10,646 patients. J Hand Surg Am. 2015;40(9):1852–1859 e1853. [DOI] [PubMed] [Google Scholar]
- 26.Bismil M, Bismil Q, Harding D, Harris P, Lamyman E, Sansby L. Transition to total one-stop wide-awake hand surgery service-audit: A retrospective review. JRSM Short Rep. 2012;3(4):23. [DOI] [PMC free article] [PubMed] [Google Scholar]
- 27.Tosti R, Fowler J, Dwyer J, Maltenfort M, Thoder JJ, Ilyas AM. Is antibiotic prophylaxis necessary in elective soft tissue hand surgery? Orthopedics. 2012;35(6):e829–833. [DOI] [PubMed] [Google Scholar]
- 28.Werner BC, Teran VA, Deal DN. Patient-related risk factors for infection following open carpal tunnel release: An analysis of over 450,000 medicare patients. J Hand Surg Am. 2018;43(3):214–219. [DOI] [PubMed] [Google Scholar]
- 29.Berwick DM. Disseminating innovations in health care. JAMA. 2003;289(15):1969–1975. [DOI] [PubMed] [Google Scholar]
- 30.Prasad V, Cifu A, Ioannidis JP. Reversals of established medical practices: Evidence to abandon ship. JAMA. 2012;307(1):37–38. [DOI] [PubMed] [Google Scholar]
- 31.Timbie JW, Fox DS, Van Busum K, Schneider EC. Five reasons that many comparative effectiveness studies fail to change patient care and clinical practice. Health Aff (Millwood). 2012;31(10):2168–2175. [DOI] [PubMed] [Google Scholar]
- 32.Smieliauskas F, Lam S, Howard DH. Impact of negative clinical trial results for vertebroplasty on vertebral augmentation procedure rates. J Am Coll Surg. 2014;219(3):525–533 e521. [DOI] [PubMed] [Google Scholar]
- 33.Howard D, Brophy R, Howell S. Evidence of no benefit from knee surgery for osteoarthritis led to coverage changes and is linked to decline in procedures. Health Aff (Millwood). 2012;31(10):2242–2249. [DOI] [PubMed] [Google Scholar]
- 34.Grandizio LC, Graham J, Klena JC. Current trends in walant surgery: A survey of american society for surgery of the hand members. Journal of Hand Surgery Global Online. 2020;2(4):186–190. [DOI] [PMC free article] [PubMed] [Google Scholar]
Associated Data
This section collects any data citations, data availability statements, or supplementary materials included in this article.
Supplementary Materials
Appendix 1: Coding Used to Identify Associated Operating Room Revenue Code or Anesthesia Charge
Appendix 2: Total number of eligible patients in the MarketScan Database (Denominator) by Year