

Abstract
The study was mainly to evaluate the changes of left ventricular (LV) myocardial work (MW) in children with CKD stage 5 within 3 months after kidney transplantation (KTx). Forty‐three successful KTx recipients (mean age 10.6 years, 58% male) in childhood and 28 healthy children were enrolled. General clinical characteristics and laboratory parameters were collected. Cardiac structure, function, and LV MW were assessed by echocardiography before and after KTx. The results showed that significantly improvement was observed in LV global MW index (GWI), constructive MW (GCW), and wasted MW (GWW) (p < .01), but not in MW efficiency (GWE) and global longitudinal strain (GLS) (p > .05). Besides, blood pressure (BP), renal graft function, LV ejection fraction (LVEF), and LV mass index (LVMi) had obviously improved after KTx (p < .05). Nevertheless, compared with healthy children, higher BP, LVMi, GWW, more deteriorated LV diastolic function and lower GWE were still observed in patients after KTx. The ratio of dialysis duration to CKD course were negatively correlated with the improvements of GWE (p = .004), GWI (p = .01), and GCW (p = .01). In conclusion, a portion of LV MW parameters were obviously improved in children received KTx. Thus, LV MW was superior to GLS in evaluating LV systolic function recovery in these patients. Those patients with insignificant MW improvement should be closely monitored, and adjusted the treatment strategies timely to avoid serious and irreversible myocardial injury after KTx.
Keywords: cardiac function, chronic kidney disease, kidney transplantation, myocardial work, pediatric
1. INTRODUCTION
Children with chronic kidney disease (CKD), especially those with CKD stage 5, have an extremely high risk of cardiovascular morbidity and mortality. 1 , 2 Early markers of myocardial involvement, such as left ventricular hypertrophy (LVH), left ventricular (LV) dilatation, systolic and diastolic dysfunction, are frequently exhibited in these children. In recent years, kidney transplantation (KTx) has become the optimal treatment for children with CKD stage 5, which positively modifies certain risk factors for myocardial impairment, such as volume and pressure overload. 3 It was reported that restoration of renal function after KTx could improve cardiac structure and function in adults and children. 4 , 5 , 6 , 7
Despite LV mass and volume have been associated with subsequent reduction in LVEF, LV myocardial deformation may be a more sensitive indicator of early subclinical myocardial dysfunction. Two‐dimensional speckle tracking echocardiography is an advanced method for evaluating myocardial deformation and mechanics, which allows to assess the regional and global myocardial deformation with angle independence, expressed as strain. In previous studies, global longitudinal strain (GLS) has been proven to be a more sensitive marker for myocardial dysfunction compared to LVEF, and a reliable prognostic indicator for major adverse cardiac events. 8 It was showed that myocardial function evaluated by speckle tracking echocardiography had been improved after KTx. 9 , 10 However, subclinical myocardial dysfunction still exists in pediatric KTx recipients and they remain at higher risk of cardiovascular events. 11 , 12
Although speckle tracking echocardiography can semi‐automatically analyze LV myocardial strain by examining longitudinal, circumferential, and radial mechanics, it is load‐dependent and influenced by heart rate. Myocardial work (MW), derived from two‐dimensional speckle tracking echocardiography and combined with blood pressure (BP), is a non‐invasive method to establish the LV pressure‐strain loops, 13 which is recognized as a more sensitive measure to examine the changes of LV MW when LV deforms due to overcoming the afterload. Furthermore, this methodology provides serial parameters of LV function, such as constructive work, wasted work, and energy consumption.
Currently, MW has been used to assess the myocardial function in patients of hypertension, cardiomyopathy, and maintenance hemodialysis, 14 , 15 , 16 but studies about LV function evaluated by MW in children with KTx are few. Therefore, this study was mainly to evaluate the changes of LV MW in children with CKD stage 5 within 3 months after KTx.
2. METHODS
2.1. Study population
A total of 43 successful KTx recipients in childhood at random were enrolled from the inpatient department of the First Affiliated Hospital of Sun Yat‐Sen University (SYSU) between January 2021 to April 2022. This was a single‐center retrospective study complied with the Declaration of Helsinki and approved by the Ethic Committee of SYSU. Written consent was obtained from all enrolled patients.
Inclusion criteria were as follows: age <18 years throughout the study period, approved for KTx, LVEF ≥50%, with normal sinus rhythm, without congenital cardiovascular disease, available echocardiographic assessments prior to KTx. Exclusion criteria included age ≥18 years, decreased LV systolic function (LVEF <50%), complicated with congenital heart disease, loss of follow‐up after KTx, poor echocardiography images, or lacking of recognizable R–R interval.
Twenty‐eight children, with well‐matched age and gender but without any known cardiovascular disease, cardiovascular risk factors (including hypertension), hemodynamically significant cardiovascular abnormalities, active diseases with the potential to interfere with cardiac function, and cardiac or vasoactive medications, were recruited as the control group.
2.2. Clinical and laboratory evaluation
Demographic parameters (age, gender, height, and weight) and clinical variables including heart rate, BP, types and duration of dialysis before KTx, source of graft, causes of CKD, and combined diseases were collected. The formula for calculating body surface area (BSA) was (.0061 × height + .0124 × weight − .0099). 17 Body mass index (BMI) was calculated as weight (kg) divided by squared height (m2). Serum N‐terminal pro‐B type natriuretic peptide (NT‐pro‐BNP), hemoglobin, glucose, urea, creatinine, calcium, phosphorus, albumin, and cystatin C were detected. The estimated glomerular filtration rate (eGFR) was calculated using the abbreviated MDRD formula: eGFR (ml/min/1.73 m2) = 175 × (serum creatinine) − 1.154 × (age) − .203 × (.742 for women) × (1.212 for black patients). 18
2.3. Echocardiography
Echocardiographic data for the pre‐KTx period (on the day or the day before KTx) and the post‐KTx period (1–3 months after KTx) were recorded separately. Commercially available echocardiography system was used. Two‐dimensional echocardiography with pulse, tissue doppler imaging, and speckle tracking echocardiograph was performed in all subjects according to current guideline and recommendations. 19 The diameter of LV at the end of systole and diastole (LVEDd, LVESd), interventricular septum thickness (IVSd), posterior wall thickness (LVPWd) were determined by two‐dimensional echocardiography in parasternal long‐axis view. LV mass was calculated using the Devereux formula. 20 The LVMi was equal to LV mass divided by BSA. LVH was defined as LVMi equal to or exceeding the age‐specific 95th percentile. 21 Considering that LVH is assumed as a surrogate marker for target organ damage, we further divided the recipients into LVH group and non‐LVH group according to LVMi before KTx. LVEF was assessed by Simpson method from apical 4‐and 2‐chamber views. Left atrium volume was measured by area length method and left atrial volume index (LAVi) was equal to left atrium volume divided by BSA. Pulsed wave doppler examination of the mitral inflow was performed to measure the early (E) and late (A) diastolic peak velocity, with their ratio (E/A) calculated. The septal and lateral mitral valve annular peak early diastolic velocity were also recorded by tissue doppler imaging. The peak diastolic velocity of mitral valve annular was the average value of the septal and lateral mitral valve annular (e’ average) and the ratio of E/e’ average was calculated.
2.4. Myocardial work
Global MW analysis was performed offline by dedicated commercially available proprietary software (EchoPac 203, General Electric Vingmed Ultrasound, Horten, Norway). MW was calculated by integrating LV pressure curves and GLS, which named pressure‐strain loops. 22 The systolic brachial artery cuff BP was used to estimate the peak LV systolic pressure. LV pressure curve was automatic constructed by software after setting the duration of isovolumic and ejection phases defined by valvular timing events. Longitudinal strain evaluated by speckle tracking echocardiography was obtained through apical four‐chamber, two‐chamber, and long‐axis imaging with a frame rate between 40 and 80 frames per second. GLS was calculated from the weighted average of the peak systolic longitudinal strain of all 17 segments and expressed by absolute value in this study.
The parameters of MW were defined as following: global MW index (GWI), constructive MW (GCW), wasted MW (GWW), and MW efficiency (GWE). GWE was calculated by GCW/(GCW + GWW).
2.5. Measurement variability
To assess reproducibility, these measurements were repeated by the same observer on the same echocardiographic images in 10 randomly selected patients at least 1 weeks apart. These parameters of GLS and MW were also analyzed by another independent observer blind to the patient grouping to ensure interobserver variability.
2.6. Statistical analysis
Statistical analysis were performed by SPSS 25.0 (IBM SPSS Statistics, Chicago, IL). All continuous variables were expressed as mean ± standard deviations, mean ± standard errors, median (inter‐quartile range) or frequencies (percentages) as appropriate. Chi‐square test or Fisher's exact test were used to compare categorical variables. Student's t‐test or Paired Student's t‐test and Kruskal‐Wallis for continuous variables. The Pearson or Spearman correlation coefficients were used to evaluate the linear relationship between the variables. Univariate and multivariate linear regression analyses were performed to identify the correlation between the changes of clinical variables with the MW parameters. The factors with p ≤ .10 were selected as related variables for multivariate analysis. A two‐sided p‐value of <.05 was considered statistically significant.
3. RESULTS
3.1. General clinical characteristics
Clinical data among the pre‐KTx, post‐KTx and control group in this study was detailed in Table 1. Before KTx, 25 (58.14%) patients received peritoneal dialysis, 11 (25.58 %) patients received hemodialysis, and 7 (16.27 %) patients had preemptive KTx. The median duration of the peritoneal dialysis and hemodialysis were 9.87 (5.83–20.70) months and 10.00 (6.19–23.85) months respectively. There were 32 (74.41%) patients suffering from hypertension. All the kidneys received were from cadaveric donors. It was found that BP, heart rate and all laboratory indicators included were improved significantly in post‐KTx patients than pre‐KTx. Control group had lower BP and heart rate than KTx patients, both before and after KTx.
TABLE 1.
The comparison of clinical characteristics among the control group, pre‐, and post‐KTx group
| Control group (n = 28) | Pre‐KTx group (n = 43) | Post‐KTx group (n = 43) | p (pre‐con) | p (post‐con) | p (pre‐post) | |
|---|---|---|---|---|---|---|
| Age (years) | 9.5 ± 3.3 | 10.6 ± 3.9 | 10.6 ± 3.9 | .239 | – | – |
| Male sex (N, %) | 16 (57.1%) | 25 (58.1%) | 25 (58.1%) | .934 | – | – |
| Height (m) | 1.35 ± .04 | 1.34 ± .23 | 1.35 ± .22 | .931 | .956 | .020 |
| Weight (Kg) | 32.70 ± 14.64 | 29.83 ± 12.26 | 31.46 ± 12.93 | .584 | .902 | .212 |
| BMI (kg/m2) | 17.03 ± 2.92 | 15.89 ± 2.50 | 16.54 ± 3.37 | .083 | .208 | .339 |
| BSA (m2) | 1.10 ± .33 | 1.06 ± .3 | 1.08 ± .3 | .581 | .813 | .093 |
| SBP (mmHg) | 96 ± 13 | 125 ± 18 | 117 ± 12 | < .001 | < .001 | .008 |
| DBP (mmHg) | 60 ± 9 | 85 ± 15 | 79 ± 11 | < .001 | < .001 | .013 |
| Heart Rate (bpm) | 79 ± 15 | 85 ± 13 | 89 ± 12 | .079 | .005 | .074 |
| NT‐Pro‐BNP (pg/ml) | – | 1449 (556–3333) | 798 (190–2112) | – | – | .007 |
| Hemoglobin (g/L) | – | 97.58 ± 21.66 | 112.81 ± 14.54 | – | – | .001 |
| Glucose (mmol/L) | – | 5.53 ± 1.08 | 4.59 ± .47 | – | – | < .001 |
| Urea (mmol/L) | – | 26.86 ± 9.60 | 7.76 ± 2.45 | – | – | < .001 |
| eGFR (ml/min/1.72 m2) | – | 5.38 ± 2.18 | 63.70 ± 19.23 | – | – | < .001 |
| Creatinine(umol/L) | – | 806.37 ± 448.87 | 71.93 ± 25.97 | – | – | < .001 |
| Calcium (mmol/L) | – | 2.45 ± .26 | 2.59 ± .15 | – | – | < .001 |
| Phosphorus (mmol/L) | – | 1.98 ± .68 | 1.20 ± .31 | – | – | < .001 |
| Albumin (g/L) | – | 41.94 ± 5.35 | 45.03 ± 3.15 | – | – | .001 |
| Cystatin C (mg/L) | – | 3.06 ± 1.74 | 1.39 ± .29 | – | – | < .001 |
Abbreviations: BMI, body mass index; BSA, body surface area; DBP, diastolic blood pressure; eGFR, estimated glomerular filtration rate; NT‐Pro‐BNP, N‐terminal pro‐B type natriuretic peptide; SBP, systolic diastolic blood pressure.
3.2. Echocardiographic analysis
The median time of assessment for echocardiography in the post‐KTx period was 31 (28–42) days. After KTx, LVMi was obviously reduced than before (p < .05), while it was still significantly higher than control group (p < .001). Meanwhile, LVEF was obviously higher in post‐KTx patients than pre‐KTx (p < .001), and there was no significant difference comparing with control group. Nevertheless, diastolic function, expressed by E/A and E/e’ average, and GLS were significantly reduced in KTx patients than control group (p < .001), but there were no obvious differences between post‐KTx patients and pre‐KTx patients (Table 2).
TABLE 2.
Comparison of routine echocardiography parameters and LV MW among control group, the pre‐, and post‐KTx group
| Control group (n = 28) | Pre‐KTx group (n = 43) | Post‐KTx group (n = 43) | p (pre‐con) | p (post‐con) | p (pre‐post) | |
|---|---|---|---|---|---|---|
| LAVi (ml/m2) | 24.08 ± 5.54 | 27.67 ± 10.69 | 24.24 ± 5.67 | .300 | .910 | .388 |
| IVSd (mm) | 6.23 ± 1.44 | 8.12 ± 2.01 | 8.02 ± 2.23 | <.001 | .002 | .285 |
| LVEDd (mm) | 40.86 ± 4.96 | 42.74 ± 6.54 | 39.63 ± 5.16 | .197 | .323 | <.001 |
| LVESd (mm) | 25.04 ± 2.89 | 27.91 ± 5.97 | 24.53 ± 3.59 | .071 | .538 | <.001 |
| LVPWd (mm) | 5.61 ± 1.49 | 7.14 ± 1.78 | 6.95 ± 1.72 | <.001 | .003 | .343 |
| LVMi (g/m2) | 63.05 ± 13.75 | 100.63 ± 38.91 | 82.55 ± 25.53 | <.001 | <.001 | .013 |
| LVH (N, %) | – | 25 (58.14%) | 19 (44.19%) | – | – | .281 |
| LVEF (%) | 69.32 ± 3.62 | 64.09 ± 7.55 | 68.40 ± 6.22 | <.001 | .479 | .001 |
| E/A | 1.98 ± .51 | 1.40 ± .40 | 1.33 ± .36 | <.001 | <.001 | .589 |
| E/e' average (m/s) | 6.20 ± .97 | 9.15 ± 2.44 | 8.67 ± 2.02 | <.001 | <.001 | .201 |
| GLS (%) | 21.22 ± 2.60 | 17.66 ± 2.99 | 17.44 ± 3.26 | <.001 | <.001 | .616 |
| GWE (%) | 97 (96‐97) | 93 (91‐95) | 95 (92‐95) | <.001 | <.001 | .107 |
| GWI (mmHg%) | 1444.3 ± 278.47 | 1671.81 ± 357.35 | 1449.37 ± 300.58 | .006 | .944 | .002 |
| GCW (mmHg%) | 1826.21 ± 276.20 | 2085.33 ± 397.54 | 1851.56 ± 336.75 | .002 | .741 | .006 |
| GWW (mmHg%) | 54 (40‐67) | 130 (105‐174) | 87 (72‐122) | <.001 | <.001 | .001 |
Abbreviations: E/A, ratio mitral inflow peak early velocity to mitral inflow peak late velocity; E/e', average ratio mitral inflow peak early velocity to tissue doppler mitral annular early velocity; GCW, global constructive work; GLS, global longitudinal strain; GWE, global work efficiency; GWI, global work index; GWW, global wasted work; IVSd, diameter of inter ventricular septum; LAVi, left atrium volume index; LVEDd, LV diameter at the end of diastolic phase; LVEF, LV ejection fraction; LVESd, LV diameter at the end of systolic phase; LVH, LV hypertrophy; LVMi, the index of LV mass; LVPWd, diameter of LV post wall.
In terms of MW (Figure 1), GWI and GCW were obviously declined in patients after KTx than before (p < .01), and there were no significantly differences comparing with control group. GWW was lower in post‐KTx group than pre‐KTx group (p < .001), but both were higher than control group (p < .001). Besides, a slight elevation was also observed in GWE in post‐KTx patients than pre‐KTx ones, while both were still lower than control group (p < .001).
FIGURE 1.
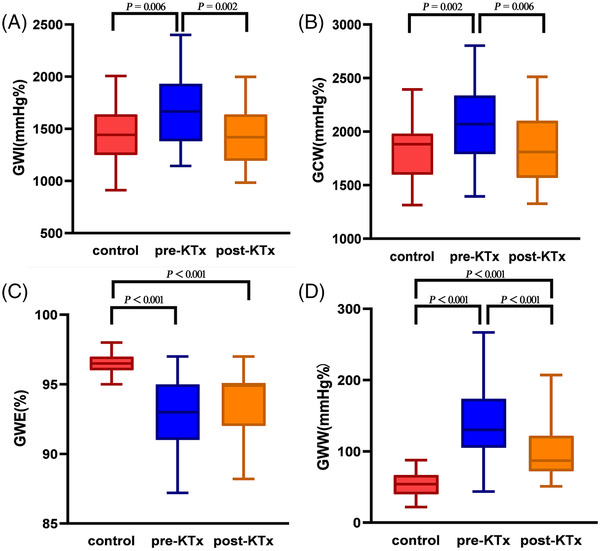
Boxplots showing the comparation of LV MW parameters, GWI (A), GCW (B), GWE (C), and GWW (D) among pre‐KTx patients, post‐KTx patients, and control group. GWI, global work index; GCW, global constructive work; GWE, global work efficiency; GWW, global wasted work
MW also can be showed by color shading, which is similarly to GLS bull's‐eye plots. In pre‐KTx patients, some segments of bull's‐eye showed red in GWI and yellow in GWE, indicating elevated GWI and decreased GWE. After KTx, the red segments in GWI converted to yellow ones, meaning of lower GWI than before, while no changes in GWE. However, the color of the bull's‐eye was homogeneously green in control group, suggesting high GWE and moderate GWI (Figure 2).
FIGURE 2.
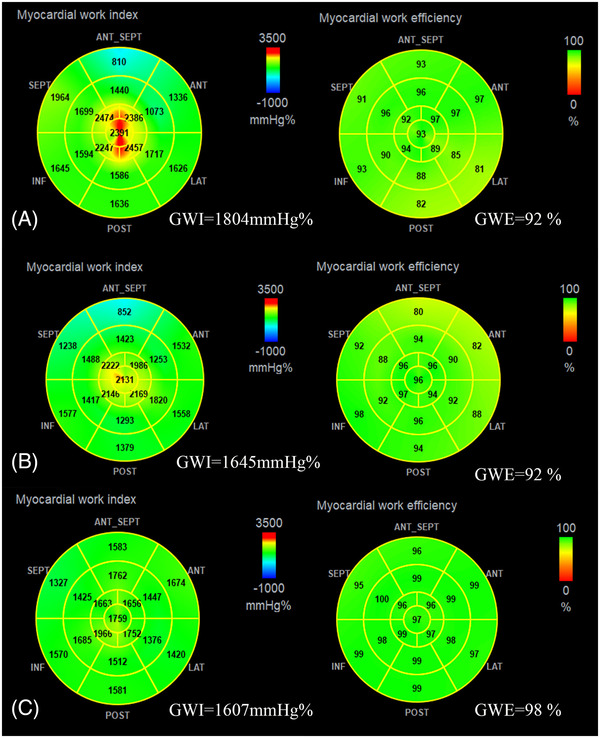
Bull's‐eye plots of GWI and GWE in pre‐KTx patient (A), post‐KTx patient (B), and control individual (C). GWI, global work index; GWE, global work efficiency
3.2.1. Pre‐KTx clinical and echocardiography characteristics according to LVMi categories (Table 3)
TABLE 3.
The clinical and echocardiographic characteristics according to LVMi categories of patients before KTx
| Non‐LVH group (n = 18) | LVH group (n = 25) | p | |
|---|---|---|---|
| Age (years) | 11.0 ± 1.0 | 10.3 ± .8 | .560 |
| Male sex (N, %) | 15 (83.3%) | 10 (40%) | .006 |
| Course of CKD (months) | 30.00 (10.55–45.75) | 13.00 (7.57–28.50) | .164 |
| Dialysis (N, %) | 14 (77.8%) | 22 (88.0%) | .427 |
| Dialysis duration (months) | 8.55 (2.50–22.21) | 6.13 (4.23–13.79) | .711 |
| Ratio of dialysis duration to CKD course | .41 (.13–.90) | .74 (.20–.99) | .287 |
| Height (m) | 1.38 ± .06 | 1.32 ± .04 | .371 |
| Weight (Kg) | 32.87 ± 3.17 | 27.65 ± 2.22 | .171 |
| BMI (kg/m2) | 16.47 ± .55 | 15.47 ± .51 | .200 |
| BSA (m2) | 1.12 ± .08 | 1.01 ± .06 | .245 |
| SBP (mmHg) | 115 ± 4 | 132 ± 3 | .001 |
| DBP (mmHg) | 77 ± 3 | 91 ± 3 | .002 |
| Heart Rate (bpm) | 85 ± 3 | 84 ± 3 | .786 |
| NT‐Pro‐BNP (pg/ml) | 618 (276–1126) | 2920 (160–4670) | .001 |
| Hemoglobin (g/L) | 106.44 ± 5.04 | 91.20 ± 3.98 | .021 |
| Glucose (mmol/L) | 5.54 ± .25 | 5.53 ± .22 | .739 |
| Urea (mmol/L) | 27.52 ± 2.41 | 26.39 ± 1.86 | .707 |
| eGFR (ml/min/1.72 m2) | 5.91 ± .51 | 5.00 ± .43 | .140 |
| Creatinine (umol/L) | 769.94 ± 65.08 | 832.60 ± 108.97 | .844 |
| Calcium (mmol/L) | 2.42 ± .04 | 2.46 ± .06 | .930 |
| Phosphorus (mmol/L) | 2.06 ± .12 | 1.92 ± .16 | .509 |
| Albumin (g/L) | 42.03 ± .92 | 41.88 ± 1.25 | .927 |
| Cystatin C (mg/L) | 2.92 ± .45 | 3.17 ± .33 | .530 |
| LAVi (ml/m2) | 20.72 ± 1.31 | 32.81 ± 2.25 | < .001 |
| IVSD (mm) | 7.07 ± .37 | 8.88 ± .39 | .002 |
| LVEDd (mm) | 40.39 ± 1.14 | 44.44 ± 1.43 | .032 |
| LVESd (mm) | 25.11 ± .96 | 29.92 ± 1.27 | .004 |
| LVPWd (mm) | 6.33 ± .33 | 7.72 ± .36 | .016 |
| LVMi (g/m2) | 70.55 ± 3.05 | 122.28 ± 7.39 | < .001 |
| LVEF (%) | 68.11 ± 1.36 | 61.20 ± .15 | .002 |
| GLS (%) | 18.75 ± .71 | 16.87 ± .55 | .041 |
| GWE (%) | 94 (93‐96) | 92 (90‐94) | .001 |
| GWI (mmHg%) | 1592.5 ± 86.99 | 1728.92 ± 68.96 | .221 |
| GCW (mmHg%) | 2018.5 ± 103.92 | 2133.48 ± 72.97 | .356 |
| GWW (mmHg%) | 115 (56‐133) | 145 (120‐234) | < .001 |
Abbreviations: BMI, body mass index; BSA, body surface area; DBP, diastolic blood pressure; eGFR, estimated glomerular filtration rate; GCW, global constructive work; GLS, global longitudinal strain; GWE, global work efficiency; GWI, global work index; GWW, global wasted work; IVSd, diameter of inter ventricular septum; LAVi, left atrium volume index; LVEDd, LV diameter at the end of diastolic phase; LVEF, LV ejection fraction; LVESd, LV diameter at the end of systolic phase; LVMi, the index of LV mass; LVPWd, diameter of LV post wall; NT‐Pro‐BNP, N‐terminal pro‐B type natriuretic peptide; SBP, systolic diastolic blood pressure.
Gender distribution differed between LVH group and non‐LVH group (p < .01). A total of 25 (58.14%) children defined as LVH before KTx, and girls account for the majority. The mean value of systolic BP (SBP), diastolic BP (DBP) and serum NT‐pro‐BNP was higher, while serum glucose was lower in LVH group than non‐LVH group (p < .05). There were no significantly difference in other clinical characteristics or biomarkers between the LVH and non‐LVH cohorts. In terms of echocardiographic variables, obviously increasing LAVi and LVMi, simultaneously decreasing LVEF and GLS were showed in LVH group comparing with non‐LVH group (p < .05). For MW, GWE (92% vs. 94%) was lower and GWW (145 mmHg% vs. 115 mmHg%) was higher in LVH patients than non‐LVH patients (p < .01), while no obvious difference in GCW and GWI were found in both groups.
3.2.2. Changes in echocardiography and clinical characteristics before and after KTx according to LVMi categories (Table 4)
TABLE 4.
Changes in echocardiography and clinical characteristics before and after KTx according to LVMi categories
| Non‐LVH group (n = 18) | LVH group (n = 25) | p | |
|---|---|---|---|
| Δ SBP (mmHg) | −1.44 ± 4.23 | −12.92 ± 3.70 | .049 |
| Δ DBP (mmHg) | −1.72 ± 3.69 | −9.44 ± 3.07 | .115 |
| Δ IVSd (mm) | .24 ± .34 | −.36 ± .32 | .592 |
| Δ LVEDd (mm) | −.11 ± .91 | −5.28 ± .89 | .019 |
| Δ LVESd (mm) | −.72 ± .82 | −5.23 ± .86 | .462 |
| Δ LVPWd (mm) | .32 ± .18 | −.56 ± .27 | < .001 |
| Δ LVMi (g/m2) | .84 ± 3.28 | −31.71 ± 5.69 | < .001 |
| Δ LVEF (%) | 2.11 ± 1.62 | 5.88 ± 1.66 | .022 |
| Δ GLS (%) | −.48 ± .75 | .72 ± .51 | .331 |
| Δ GWE (%) | −.56 ± .51 | 1.76 ± .60 | .008 |
| Δ GWI (mmHg%) | −101.22 ± 118.27 | −309.72 ± 71.31 | .142 |
| Δ GCW (mmHg%) | −45.67 ± 141.15 | −396.24 ± 89.55 | .062 |
| Δ GWW (mmHg%) | 3.06 ± 13.29 | −70.2 ± 12.58 | < .001 |
| Δ NT‐pro‐BNP (pg/ml) | 42 (−974 to 1758) | −1411 (−4171 to −329) | .001 |
| Δ Hemoglobin (g/L) | 8.00 ± 4.68 | 20.12 ± 5.07 | .099 |
| Δ Glucose (mmol/L) | −1.09 ± .27 | −.83 ± .27 | .278 |
| Δ Creatinine (umol/L) | −693.67 ± 286.33 | −763.80 ± 107.39 | .980 |
| Δ eGFR (ml/min/1.72 m2) | 63.46 ± 5.91 | 53.81 ± 2.81 | .152 |
Abbreviations: Δ, symbol of changes; DBP, diastolic blood pressure; eGFR, estimated glomerular filtration rate; GCW, global constructive work; GWE, global work efficiency; GWI, global work index; GWW, global wasted work; IVSd, diameter of inter ventricular septum; LAVI, left atrium volume index; LVEDd, LV diameter at the end of diastolic phase; LVEF, LV ejection fraction; LVESd, LV diameter at the end of systolic phase; LVMi, the index of LV mass; LVPWd, diameter of LV post wall; NT‐pro‐BNP, N‐terminal pro‐B type natriuretic peptide; SBP, systolic diastolic blood pressure.
Transplant recipients were on standard immunosuppression with tacrolimus and mycophenolate mofetil. After KTx, favorable alternations in SBP, NT‐pro‐BNP, LVMi, GWE (1.76% vs. −.56%) and GWW (−70.2 mmHg% vs. 3.06 mmHg%) were present in recipients with LVH than non‐LVH group (p < .05), while no significant difference in DBP, glucose, creatinine, eGFR, LVEF, GLS, GWI, and GCW was shown.
3.2.3. Correlation between changes of LV MW parameters and clinical data (Figure 3)
FIGURE 3.
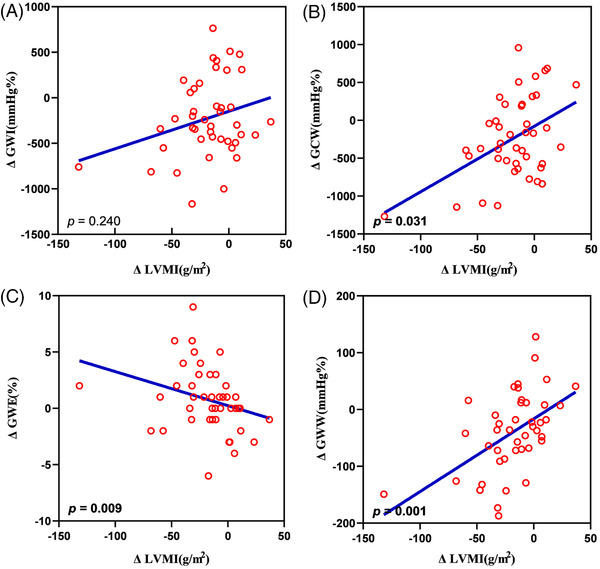
Satter diagram showing correlation between the changes of LVMi and LV MW parameters, global work index (A), global constructive work (B), global work efficiency (C), and global wasted work (D). LVMi, the index of LV mass; GWI, global work index; GCW, global constructive work' GWE, global work efficiency; GWW, global wasted work
The results of correlation analysis show that the changes of GWE (p = .009) was negatively correlated with the changes of LVMi, but GWW (p = .001) and GCW (p = .031) were positively correlated with the changes of LVMi. There was no significantly correlation with the changes of LVMi and the changes of GWI. In addition, no significantly correlation was found between the changes of MW parameters and the changes of LVEF or GLS.
3.3. Regression analysis between changes of LV MW parameters and clinical data
Multiple regression analysis was showed that the ratio of dialysis duration to CKD course, changes of eGFR and DBP were negatively and independently correlated with changes of GWE (p < .01). Meanwhile, the ratio of dialysis duration to CKD course and changes of SBP and glucose were negatively correlated with changes of GCW and GWI (p < .01). Only change of SBP was positively and independently correlated with alternation of GWW (p = .030) (Table 5).
TABLE 5.
Univariate and multiple liner regression analysis of changes of LV MW
| ΔGWE | ΔGWW | ΔGCW | ΔGWI | |||||
|---|---|---|---|---|---|---|---|---|
| Univariate | R | p | R | p | R | p | R | p |
| Ratio of dialysis duration to CKD course | .427 | .004 | .288 | .061 | .140 | .370 | .161 | .303 |
| Δ SBP (mmHg) | .419 | .005 | .691 | <.001 | .755 | <.001 | .679 | <.001 |
| Δ DBP (mmHg) | .495 | .001 | .632 | <.001 | .526 | <.001 | .449 | .003 |
| Δ eGFR (ml/min/1.72 m2) | .289 | .060 | .222 | .152 | .010 | .949 | .056 | .719 |
| Δ NT‐pro‐BNP(pg/ml) | .096 | .579 | .447 | .006 | .450 | .006 | .337 | .044 |
| Δ Hemoglobin (g/L) | .062 | .693 | .175 | .263 | .384 | .011 | .263 | .088 |
| Δ Glucose(mmol/L) | .157 | .314 | .038 | .808 | .317 | .038 | .337 | .027 |
| Multiple | β | p | β | p | β | p | β | p |
|---|---|---|---|---|---|---|---|---|
| Ratio of dialysis duration to CKD course | −.362 | .004 | .214 | .087 | −.261 | .010 | −.292 | .007 |
| Δ SBP (mmHg) | −.072 | .706 | .465 | .030 | .820 | < .001 | .880 | < .001 |
| Δ DBP (mmHg) | −.398 | .044 | .191 | .324 | −.106 | .507 | −.203 | .240 |
| Δ eGFR (ml/min/1.72 m2) | −.284 | .022 | – | – | – | – | – | – |
| Δ NT‐pro‐BNP (pg/ml) | – | – | .144 | .309 | −.018 | .886 | −.138 | .305 |
| Δ Hemoglobin (g/L) | – | – | – | – | −.113 | .346 | −.100 | .439 |
| Δ Glucose(mmol/L) | – | – | – | – | −.246 | .024 | −.324 | .007 |
Abbreviations: Δ, symbol of changes; DBP, diastolic blood pressure; eGFR, estimated glomerular filtration rate; GCW, global constructive work; GWE, global work efficiency; GWI, global work index; GWW, global wasted work; NT‐pro‐BNP, N‐terminal pro‐B type natriuretic peptide; SBP, systolic diastolic blood pressure.
3.4. Observer variability
Intra‐observer variability for GCW, GWI, GWW, and GWE by inter‐class correlation were .984 (p < .001), .896 (p < .001), .984 (p < .001) and .896 (p < .001), respectively. Inter‐observer variability for GCW, GWI, GWW, and GWE by inter‐class correlation were .884 (p < .001), .931 (p < .001), .835 (p < .001), and .795 (p = .001), respectively.
4. DISCUSSION
In this study, we examined the changes in pediatric cardiac structure and function before and after KTx within 3 months. The main findings of this study were as follows: (1) After KTx, the LVMi, LVEF, part of LV MW parameters (GWI, GCW, and GWW) improved in children with CKD stage 5, while LV diastolic function, GLS and GWE were not obviously improvement. (2) GCW and GWI had recovered to normal level after KTx, while GWW and GWE had not restored. (3) GWE and GWW were worser in LVH group than non‐LVH group, but they were significantly improved after KTx in LVH group. (4) The ratio of dialysis duration to CKD course and BP were independently correlated with changes of LV MW parameters. To the best of our knowledge, the present study is the first study to demonstrate the changes of LV MW in children with CKD stage 5 after KTx.
KTx is the treatment choice for children with kidney failure, which bring highly benefits to them, but pediatric KTx recipients remain at risk of cardiovascular events due to the complex mechanisms, such as hypertension, consequences of immunosuppressive therapy, and so on. 23 , 24 In this study, children with CKD stage 5 had significantly higher LVMi compared to healthy controls, and more than 70% of patients had hypertensive. Hypertension was one of the most important independent risk factors for the development of LVH and other risk factors including chronic volume overload, anemia, proteinuria, uremia, and so on. 25 In our study, LV dimension and LVMi had significantly improved in patients after KTx, in accordance to the improvement of BP, anemia, and allograft kidney function, symbolized by eGFR, creatinine, and cystatin C, which was in line with previous studies. 4 , 6
In this study, impaired diastolic function (lower mitral E/A ratio and higher E/e’ average) were found in patients before and after KTx rather than control group which was in line with previous study that demonstrated that impaired diastolic function was persist during dialysis and after transplantation in childhood. 26 Possible explanations for this finding are cyclosporine use, hypertension, and myocardial fibrosis. 27 Meanwhile, preserved LVEF was found in pediatric patients before KTx and had no statistical difference with healthy children, but it had significantly improved in them after KTx, while GLS was significantly declined in patients before KTx comparing healthy individuals, and not improvement after KTx. Due to LVEF represents late LV dysfunction 28 and GLS is considered for early detection of subclinical LV dysfunction, 29 even LVEF had improved significantly after KTx, subclinical systolic dysfunction still existed after KTx within 3 months, which is manifested by abnormal of GLS and LV MW, indicating that only LVEF can not meet the clinical needs and the risk of cardiovascular events remained higher in them. Similarly, in the pediatric patients with CKD stage 5, previous studies by Gong et al. and Bárczi et al. illustrated that decreasing GLS was observed after KTx with preserved LVEF. 10 , 12 As a result, further exploration about performance of LV function recovery in children after KTx are needed.
MW analysis is an emerging practice used for advanced assessment of LV function and become more common in evaluating LV systolic function because both cardiac afterload and deformation are taken into account. 13 This study showed increased GWI, GCW, and GWW, as well as declined GWE in patients before KTx comparing with control group. This finding was consistent with the recent study by Akshar et al. showed that GWI, GCW, and GWW were increased and GWE was decreased in stage 1 and 2 hypertension patients with GLS decreased and LVEF preserved. 14 After KTx, GWI, and GCW returned to normal level, while GWE was elevated and GWW was declined after KTx, but they did not recovery. Thuy et al. had studied the normal value of LV MW in health children, 30 where the mean values of GWI and GCW were slightly higher than that of control group in our study. However, the average SBP in that study was 103 versus 96 mmHg in current study, and the minimum age was 6 versus 3 years, respectively, which were possible reasons for different mean values of GWI and GCW in healthy children. Meanwhile, the median values of GWW and GWE were parallelism between the two studies. As a result, the evaluation of LV MW in this study was reliable.
We analyzed clinical and echocardiographic characteristics between LVH group and non‐LVH group before KTX, and investigated the effects of LVH on inconformity of improvement of LV MW after KTx. In our study, LVMi and GWW were higher and GWE was lower in LVH patients than non‐LVH group before KTx. Cardiac remodeling and decreased LV systolic function were showed in children with LVH, partially explained by anemia, volume overload and hypertension, as evidenced by decreased hemoglobin, LVEF, GLS, elevated serum NT‐Pro‐BNP and BP in patients with LVH before KTx. After KTx, the changes of LVMi, GWE, and GWW were significant in LVH patients than non‐LVH patients. Similarly, a previous study by Toshiki et al demonstrated that children with CKD stage 5 who had LVH before KTx showed significant improvements in the LVMi and LVEF after KTx. 7 In this study, there was no difference with GCW in both LVH and non‐LVH group, while GWW was higher in LVH group than non‐LVH group before KTx. As a result, changes of GWW and GWE were higher in LVH group than non‐LVH group after KTx with positively modifies of volume and pressure overload. Changes of LVMi correlated with changes of GWW and GWE were also found in this study. Taken together, GWE and GWW in patients did not return to normal after KTx partially because LVH showed in most children with CKD stage 5 before KTx. Possible explanations might be that LV MW of patients would increase to overcome the elevation of afterload with increasing BP, since that most children with CKD stage 5 suffered from hypertension.
In this study, ratio of dialysis duration to CKD course were independently negative correlated with changes of GWE, GCW, and GWI. More than 80% of children with CKD stage 5 received dialysis before KTx. Previous studies illustrated that increased incidence of cardiac function damage and graft kidney failure after KTx were found in patients undergoing chronic dialysis before KTx. 31 , 32 In addition, the BP had significance improvement after KTx and the decrease of BP was an independent factor to identified the improvement of LV MW parameters, which meant LV MW parameters take into account cardiac loading conditions and was consisted with the reported that GWI and GCW were significantly increased in the hypertensive patients, and independently associated with SBP in multivariable analysis. 33 Also changes of eGFR was negatively correlated with changes of GWE in this study. As a result, ratio of dialysis duration to CKD course and recovery of renal function and BP potentially provided predictors for LV MW. As for those receiving dialysis for a relatively long time, eGFR and BP without obviously improvement, it is particularly important to closely monitor the cardiac function and adjust medication timely to avoid serious and irreversible myocardial injury after KTx.
Nevertheless, there were a few limitations. On one hand, this was a single‐center study, and the sample size of the study was moderate. Thus, these findings need to be verified in a larger population with longer follow‐up period. On the other hand, we found that GCW and GWI returned to normal level, while GWE and GWW did not recovery after KTx, which may due to chronic dialysis before KTx and LV remodeling, however, the potential mechanism is needed to be further explored.
5. CONCLUSION
This study implied that with the restoration of renal function, a portion of LV MW parameters, including LV GCW, GWI, and GWW, were obviously improved in pediatric patients with CKD stage 5, with corresponding improvement in LVEF and LV structure. However, LV systolic dysfunction existed constantly and the risk of cardiovascular events was still higher than healthy children. As the MW parameters is more sensitive than LVEF and GLS, the children with insignificant MW improvement should be closely monitored, and adjusted the treatment strategies timely to avoid serious and irreversible myocardial injury after KTx.
CONFLICT OF INTEREST
The authors report no conflicts of interest in this work.
ACKNOWLEDGMENT
This study was supported by the Kelin Outstanding Young Scientist of the First Affiliated Hospital of Sun Yat‐Sen University (No. R08029). The sponsors had no role in the study design, data collection, interpretation, or fulfillment of this manuscript.
Xiao F, Fan R, Zhang J, et al. Changes in myocardial work associated with pediatric kidney transplantation: A pilot study of short‐term postoperative effect. J Clin Hypertens. 2022;24:1547–1557. 10.1111/jch.14595
Fei Xiao and Rui Fan have contributed equally to this work.
Contributor Information
Hong Lin, Email: linh@mail.sysu.edu.cn.
Cuiling Li, Email: lcling@mail.sysu.edu.cn.
REFERENCES
- 1. Wilson AC, Mitsnefes MM. Cardiovascular disease in CKD in children: update on risk factors, risk assessment, and management. Am J Kidney Dis. 2009;54(2):345‐360. [DOI] [PMC free article] [PubMed] [Google Scholar]
- 2. Mitsnefes MM. Cardiovascular disease in children with chronic kidney disease. J Am Soc Nephrol. 2012;23(4):578‐585. [DOI] [PMC free article] [PubMed] [Google Scholar]
- 3. Lal AK, de Biasi AR, Alexander S, Rosenthal DN, Sutherland SM. End‐stage renal disease and cardiomyopathy in children: cardiac effects of renal transplantation. Transplantation. 2012;93(2):182‐187. [DOI] [PubMed] [Google Scholar]
- 4. Hawwa N, Shrestha K, Hammadah M, Yeo PSD, Fatica R, Tang WHW. Reverse remodeling and prognosis following kidney transplantation in contemporary patients with cardiac dysfunction. J Am Coll Cardiol. 2015;66(16):1779‐1787. [DOI] [PMC free article] [PubMed] [Google Scholar]
- 5. Lim K, Ting SMS, Hamborg T, et al. Cardiovascular functional reserve before and after kidney transplant. JAMA Cardiol. 2020;5(4):420‐429. [DOI] [PMC free article] [PubMed] [Google Scholar]
- 6. Shimony S, Green H, Stein GY, Grossman A, Rahamimov R, Fuchs S. Structural and functional echocardiographic changes following kidney transplantation: the role of allograft function. Isr Med Assoc J. 2019;21(4):246‐250. [PubMed] [Google Scholar]
- 7. Masuda T, Hamasaki Y, Kubota M, et al. Changes in cardiac function after renal transplantation in children: significance of pre‐transplantation left ventricular hypertrophy. Pediatr Transplant. 2019;23(7):e13558. [DOI] [PubMed] [Google Scholar]
- 8. Kalam K, Otahal P, Marwick TH. Prognostic implications of global LV dysfunction: a systematic review and meta‐analysis of global longitudinal strain and ejection fraction. Heart. 2014;100(21):1673‐1680. [DOI] [PubMed] [Google Scholar]
- 9. Hamidi S, Kojuri J, Attar A, Roozbeh J, Moaref A, Nikoo MH. The effect of kidney transplantation on speckled tracking echocardiography findings in patients on hemodialysis. J Cardiovasc Thorac Res. 2018;10(2):90‐94. [DOI] [PMC free article] [PubMed] [Google Scholar]
- 10. Gong IY, Al‐Amro B, Prasad GVR, et al. Cardiovascular magnetic resonance left ventricular strain in end‐stage renal disease patients after kidney transplantation. J Cardiovasc Magn Reson. 2018;20(1):83. [DOI] [PMC free article] [PubMed] [Google Scholar]
- 11. Ravera M, Rosa GM, Fontanive P, et al. Impaired left ventricular global longitudinal strain among patients with chronic kidney disease and end‐stage renal disease and renal transplant recipients. Cardiorenal Med. 2019;9(1):61‐68. [DOI] [PubMed] [Google Scholar]
- 12. Barczi A, Lakatos BK, Szilagyi M, et al. Subclinical cardiac dysfunction in pediatric kidney transplant recipients identified by speckle‐tracking echocardiography. Pediatr Nephrol. 2022;37(10):2489‐2501. 10.1007/s00467-022-05422-7 [DOI] [PMC free article] [PubMed] [Google Scholar]
- 13. Manganaro R, Marchetta S, Dulgheru R, et al. Echocardiographic reference ranges for normal non‐invasive myocardial work indices: results from the EACVI NORRE study. Eur Heart J Cardiovasc Imaging. 2019;20(5):582‐590. [DOI] [PubMed] [Google Scholar]
- 14. Jaglan A, Roemer S, Perez Moreno AC, Khandheria BK. Myocardial work in stage 1 and 2 hypertensive patients. Eur Heart J Cardiovasc Imaging. 2021;22(7):744‐750. [DOI] [PubMed] [Google Scholar]
- 15. Liu C, Feng YP, Yan ZN, Fan L, Rui YF, Cui L. Value of quantitative analysis of left ventricular systolic function in patients on maintenance hemodialysis based on myocardial work technique. BMC Cardiovasc Disord. 2021;21(1):76. [DOI] [PMC free article] [PubMed] [Google Scholar]
- 16. Giblin GT, Cuddy SAM, Gonzalez‐Lopez E, et al. Effect of tafamidis on global longitudinal strain and myocardial work in transthyretin cardiac amyloidosis. Eur Heart J Cardiovasc Imaging. 2022;23(8):1029‐1039. [DOI] [PMC free article] [PubMed] [Google Scholar]
- 17. Du Bois D, Du Bois EF. A formula to estimate the approximate surface area if height and weight be known 1916. Nutrition. 1989;5(5):303‐313. [PubMed] [Google Scholar]
- 18. Levey AS, Coresh J, Greene T, et al. Using standardized serum creatinine values in the modification of diet in renal disease study equation for estimating glomerular filtration rate. Ann Intern Med. 2006;145(4):247‐254. [DOI] [PubMed] [Google Scholar]
- 19. Lang RM, Badano LP, Mor‐Avi V, et al. Recommendations for cardiac chamber quantification by echocardiography in adults: an update from the American Society of Echocardiography and the European Association of Cardiovascular Imaging. Eur Heart J Cardiovasc Imaging. 2015;28(1):1‐39. [DOI] [PubMed] [Google Scholar]
- 20. Devereux RB, Reichek N. Echocardiographic determination of left ventricular mass in man. Anatomic validation of the method. Circulation. 1977;55(4):613‐618. [DOI] [PubMed] [Google Scholar]
- 21. Diaz A, Zocalo Y, Bia D. Reference intervals and percentile curves of echocardiographic left ventricular mass, relative wall thickness and ejection fraction in healthy children and adolescents. Pediatr Cardiol. 2019;40(2):283‐301. [DOI] [PubMed] [Google Scholar]
- 22. Russell K, Eriksen M, Aaberge L, et al. Assessment of wasted myocardial work: a novel method to quantify energy loss due to uncoordinated left ventricular contractions. Am J Physiol Heart Circ Physiol. 2013;305(7):H996‐1003. [DOI] [PubMed] [Google Scholar]
- 23. Serrano OK, Bangdiwala AS, Vock DM, et al. Incidence and magnitude of post‐transplant cardiovascular disease after pediatric kidney transplantation: risk factor analysis of 1058 pediatric kidney transplants at the university of Minnesota. Pediatr Transplant. 2018;22(7):e13283. [DOI] [PubMed] [Google Scholar]
- 24.Al Nasser Y, Moura MC, Mertens L, et al. Subclinical cardiovascular changes in pediatric solid organ transplant recipients: a systematic review and meta‐analysis. Pediatr Transplant. 2016;20(4):530‐539. [DOI] [PubMed] [Google Scholar]
- 25. Yildiz M, Oktay AA, Stewart MH, Milani RV, Ventura HO, Lavie CJ. Left ventricular hypertrophy and hypertension. Prog Cardiovasc Dis. 2020;63(1):10‐21. [DOI] [PubMed] [Google Scholar]
- 26. Rumman RK, Ramroop R, Chanchlani R, et al. Longitudinal assessment of myocardial function in childhood chronic kidney disease, during dialysis, and following kidney transplantation. Pediatr Nephrol. 2017;32(8):1401‐1410. [DOI] [PubMed] [Google Scholar]
- 27. Hamidi S, Kojuri J, Attar A, Roozbeh J, Moaref A, Nikoo MH. The effect of kidney transplantation on speckled tracking echocardiography findings in patients on hemodialysis. J Cardiovasc Thorac Res. 2018;10(2):90‐94. [DOI] [PMC free article] [PubMed] [Google Scholar]
- 28. Hensen LCR, Goossens K, Delgado V, et al. Prevalence of left ventricular systolic dysfunction in pre‐dialysis and dialysis patients with preserved left ventricular ejection fraction. Eur J Heart Fail. 2018;20(3):560‐568. [DOI] [PubMed] [Google Scholar]
- 29. Plana JC, Galderisi M, Barac A, et al. Expert consensus for multimodality imaging evaluation of adult patients during and after cancer therapy: a report from the American Society of Echocardiography and the European Association of Cardiovascular Imaging. Eur Heart J Cardiovasc Imaging. 2014;27(9):911‐939. [DOI] [PubMed] [Google Scholar]
- 30. Pham TTM, Truong VT, Vu PN, et al. Echocardiographic reference ranges of non‐invasive myocardial work indices in children. Pediatr Cardiol. 2022;43(1):82‐91. [DOI] [PubMed] [Google Scholar]
- 31. Meier‐Kriesche HU, Kaplan B. Waiting time on dialysis as the strongest modifiable risk factor for renal transplant outcomes: a paired donor kidney analysis. Transplantation. 2002;74(10):1377‐1381. [DOI] [PubMed] [Google Scholar]
- 32. Obremska M, Kaminska D, Krawczyk M, Krajewska M, Kosmala W. Impact of different approaches to kidney transplant with and without chronic hemodialysis on cardiac function and morphology: a case‐control study. J Clin Med. 2021;10(17):3913. [DOI] [PMC free article] [PubMed] [Google Scholar]
- 33. Zhan J, Van den Eynde J, Ozdemir E, et al. Left ventricular myocardial work indices in pediatric hypertension: correlations with conventional echocardiographic assessment and subphenotyping. Eur J Pediatr. 2022;181(7):2643‐2654. [DOI] [PubMed] [Google Scholar]