Abstract
Objective
Imaging measurements allow assessment of the mechanical alignment before and after total knee arthroplasty (TKA). The changes in radiographic parameters in each period of time within 1 year after TKA has been poorly understood. The purpose of this study was to examine the timing and causes of imaging changes in lower extremity force lines after total knee arthroplasty with mechanical alignment.
Methods
A total of 93 mechanically‐aligned TKA were radiographically examined before, 3 days, 3 months, and 1 year after surgery. Radiographic parameters included hip‐knee angle (HKA), lateral distal femoral angle (LDFA), medial proximal tibial angle (MPTA), knee joint line orientation (KJLO), ankle joint line orientation (AJLO), the knee joint line relative to ankle joint line angle (KJLTA) and midpoints of the ankle distance (MAD). Paired t‐test were used to analyze the changes of these imaging parameters, By establishing a simple tibial model, the time points of changes in the imaging parameters after TKA was determined, with an attempt to understand the post‐TKA changes in these imaging parameters.
Results
Statistically significant differences were found between the preoperative data and the data measured 3 days after surgery in HKA, LDFA, MPTA, MAD, KJLTA, AJLO (P < 0.05) while KJLO exhibited no significant difference (P = 0.089). There existed significant differences between the data measured 3 days and the measurements taken 3 months after operation in HKA, MPTA, KJLTA, KJLO, AJLO (P < 0.05), whereas LDFA and MAD showed no significant difference (P > 0.05). Significant differences were revealed between the data measured 3 months and those collected 1 year after surgery in LDFA, MPTA, AJLO, KJLTA (P < 0.05) but HKA, KJLO, AJLO showed no significant differences (P > 0.05). The tibial model was made to look into the changes in postoperative imaging parameters. ΔMAD and postoperative AJLO were calculated to verify the model and hypothesis.
Conclusions
Postoperative changes in radiographic parameters and tibial models showed that the lower extremities were in an unnatural state within 1 year after TKA. The changes in the lower extremities force line were the results of the gradual adaptation of the lower extremities to TKA and the lateral swing of the extremities (3°) after surgery. Imaging data 1 year after surgery should be taken into account in the explanation of post‐TKA changes in lower limb force lines.
Keywords: Lower extremities force line, Mechanical alignment, Radiographic parameters, Tibial model, Total knee arthroplasty
The tibia is simplified as a two‐dimensional graph, The lower extremities were in an unnatural state within one year after TKA. The changes of the lower extremities force line were actually the common results of the gradual adaptation of the lower extremities to TKA and the lateral swing of the extremities 3° after surgery.
Introduction
Total knee arthroplasty (TKA) is the only effective treatment for end‐stage knee osteoarthritis. While many surgeons follow Install and Ranawat's mechanical alignment principle (IRMP) 1 to achieve a durable and successful TKA 2 , 3 , 20% of patients are not satisfied with their results. 4 , 5
The IRMP refers to two lines on the coronal plane of the lower limb: the vertical force line (referring to making osteotomies of the distal femur and proximal tibia) and the joint line (a line at the keen joint level perpendicular to the vertical force line obtained after the prosthesis has been implanted). 6 Multiple studies showed that a significantly improved service life of prostheses could be accomplished if the joint line is perpendicular to the vertical force line because the shear stress load on the joint surface and stress concentration are reduced. 7 , 8 However, in a biomechanical study, Beek et al. 9 found that there was an angle between the gravity line and the body's barycenter line during natural standing. As a result, the knee joint line is not perpendicular to the body's barycenter line (that is, the knee joint line is not completely parallel to the ground), which affects the ankle joint line orientation. 10 , 11 Currently, it is believed that the change in lower limb force line may be culpable for patients' postoperative dissatisfaction and the limited service life of the prosthesis. Therefore, understanding of the change in lower limb force line after TKA is crucial for improving patients' satisfaction and the service life of the prosthesis. Recently, Zahn et al. examined the mechanical axis of the lower limb and limb loads 10 days and 3 months after TKA. 12 Matsumoto et al. studied the single‐leg and double‐leg standing long legs 1 year after TKA. 13 However, the changes in radiographic parameters in each period of time within 1 year after TKA remain poorly understood. Zahn et al. recognized this gap and conducted a radiographic study on standing long‐leg to determine the mechanical axis of the lower limb at 7 days, 3 months, and 12 months after TKA. 14 But the study involved only a few imaging parameters. The changes in radiographic parameters in each period of time within 1 year after TKA is not really explained in these studies.
This study aimed to: (i) evaluate the changes in imaging parameters at different time points after TKA by using standardized full‐length lower extremity radiographs and to make recommendations for a reasonable study time; (ii) to study the correlation among various radiological parameters; and (iii) to understand the changes in these post‐TKA imaging parameters by establishing a simple tibial model.
Materials and Methods
Patients
From January 2020 to January 2021, 156 patients who had undergone TKA were selected from the joint registry database of our department. The inclusion criteria were patients undergoing TKA due to primary osteoarthritis of the knee. The exclusion criteria included: (i) patients diagnosed with non‐primary osteoarthritis such as rheumatoid arthritis, traumatic arthritis, and ankylosing spondylitis; (ii) genu valgus deformity; (iii) incomplete clinical or imaging records; (iv) an early fracture of either lower limb; (v) a previous TKA on either lower limb; and (vi) condylar restricted prosthesis or hinged prosthesis used.
Finally, 93 patients were enrolled and analyzed before, 3 days, 3 months, and 1 year after surgery. Among them, 21 were male and 72 were female with a mean age at surgery of 65 years (range, 53–83 years). The mean body mass index (BMI) was 27.1 kg/m2. Against the Ranawat classification, 75 patients with varus knee deformities were rated grade I, 43 grade II and three radii. Smith & Nephew (London, England) cruciate‐retaining and posterior‐stabilized prostheses were employed in all patients. The same senior orthopedic surgeon (DRN) performed all the operations, including 65 unilateral TKAs and 28 bilateral TKAs. The study protocol was approved by the ethics committee of Chinese PLA General Hospital (No. S2021‐094‐01) and informed consents were obtained from all patients.
Surgery
The operation was performed under general anesthesia and with tourniquet control. We took a standard medial Para patellar approach. The guide was aligned with the anatomical tibial axis (the line from the center of the proximal tibia to the center of talus).The proximal tibial osteotomy was done on the sagittal plane (a 3° posterior inclination for a posterior‐stabilized prosthesis and a 5°–7° of posterior inclination for a cruciate‐retaining prosthesis). The thickness of the cut was 8 or 10 mm from the lateral condyle, depending on the wear of the medial condyle. The valgus angle was a preoperatively measured by using a template.
We performed a rotational osteotomy of the femur using the hybrid navigation technique with reference to the posterior condyle line, epicondylar line, and Whiteside line. Adequate soft tissue balance was attained by subperiosteal release and the pie‐crust technique. 15 The tibial and femoral components were cemented. On the first postoperative day, the patient was allowed to walk with the aid of a walker. The patients started rehabilitation under the supervision of a physical therapist.
Radiographic Analysis
Preoperative and postoperative X‐ray films were taken by using the same machine in our hospital. Radiographs were used to examine the full length of the lower limb from the hip joint to the ankle while ensuring that the patella faces forward. The imaging images were digitized and uploaded to the PACS system (EBM Technologies, Taipei, Taiwan), allowing calibration of radiographic measurements with an accuracy of 1 × 10⁻² mm and 1 × 10⁻²°.
All patients received standard full‐length lower limb radiography (from the hip joint to the ankle with the patella facing forward 16 ) preoperatively and on the third postoperative day. The radio graphical parameters were assessed using Hagstedts’ method. 17 The hip‐knee‐ankle angle (HKA)was measured between the mechanical axis of the femur and mechanical axis of the tibia. The lateral distal femoral angle (LDFA) was measured between the mechanical axis of the femur and the tangent line of the distal lateral condyle of the femur. The medial proximal tibial angle (MPTA) was defined as the angle between the tangent line of tibial plateau and tibial mechanical axis. Knee joint line orientation (KJLO) was the angle between the knee joint line and the horizontal line. The knee joint line relative to ankle joint line angle (KJLTA) was taken as the angle between the knee joint line and ankle joint line (Fig. 1). Ankle joint line orientation (AJLO) was the angle between the ankle joint line and the horizontal line. The midpoints of the ankle distance (MAD) was measured as the spacing between midpoints of ankle joints of both lower limbs 9 , 18 (Fig. 2). All parameters were measured twice at a 2‐week interval by two orthopedic surgeons who were blind to the study. The interclass correlation of each imaging parameter calculated by product difference method was good (≥0.875), and the intraclass correlation of each observer was also good (>0.9).
Fig 1.
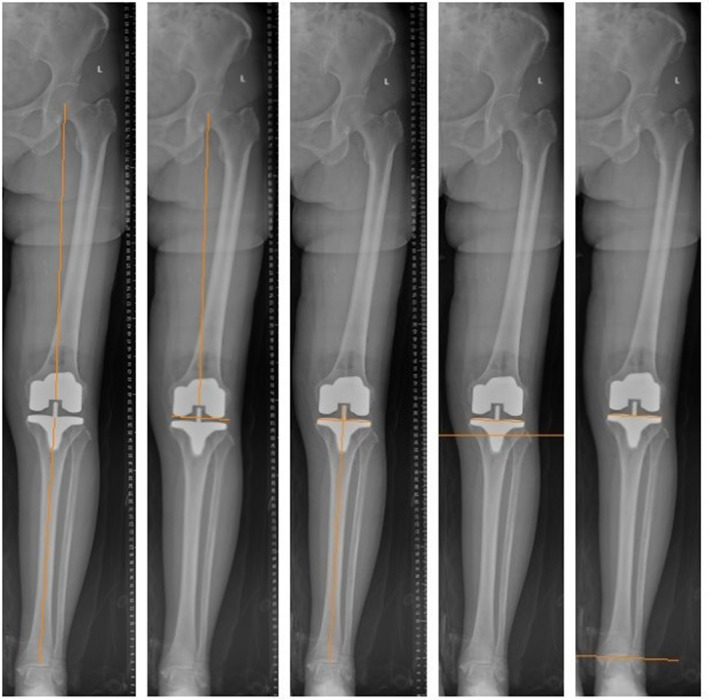
(A) Hip‐knee‐ankle angle (HKA), (B) Lateral distal femoral angle (LDFA), (C) Medial proximal tibial angle (MPTA), (D) Knee joint line orientation (KJLO), (E) the knee joint line relative to ankle joint line angle (KJLTA)
Fig 2.
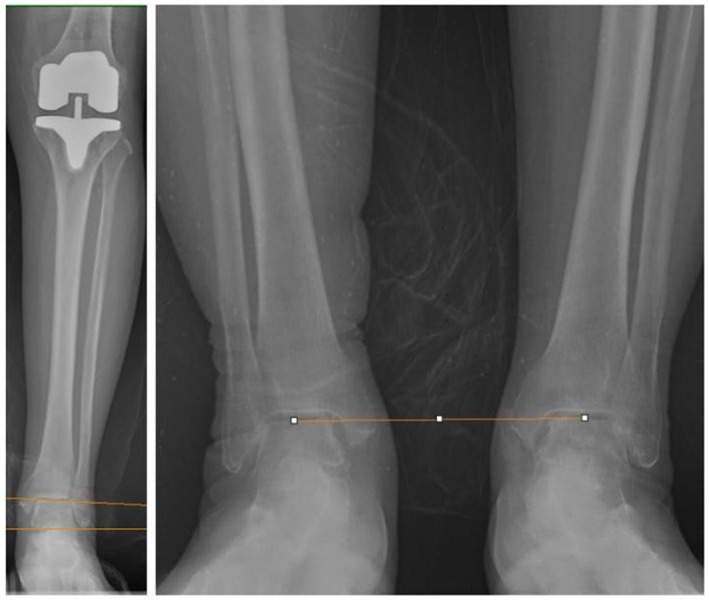
(A) Ankle joint line orientation (AJLO), (B) Midpoints of the ankle distance (MAD)
Statistical Analysis
All analyses were conducted using SPSS 22.0 software package (SPSS, Chicago, IL, USA). Statistical significance was set as P < 0.05. Imaging parameters (HKA, KJLO, MPTA, LDFA, KJLTA, AJLO and MAD) were presented as mean and standard deviation and significance of differences between preoperative and postoperative imaging parameters was assessed by using the paired t‐test (for normally distributed parameters) or Wilcoxon signed rank test (for non‐normally distributed parameter).
Results
Postoperative Changes in Imaging Parameters
The change trends of imaging parameters after surgery were analyzed (Fig. 3). The varus of HKA gradually decreased from 9.17° ± 5.12° before operation to 2.36° ± 1.60° 3 months after operation, and there was no significant difference between the changes in HKA 3 months after surgery and those 1 year after surgery (P = 0.157), showing that HKA did not experience any change 3 months after surgery (Fig. 4).
Fig. 3.
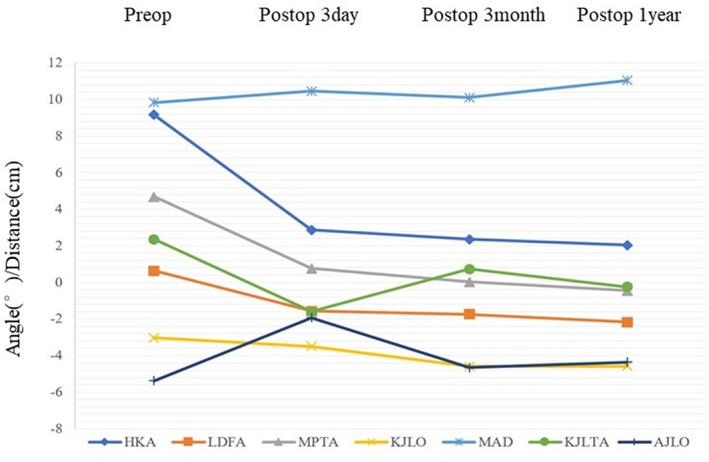
Changes of imaging parameters (HKA, LDFA, MPTA, KJLO, KJLTA, AJLO, MAD) before, 3 days after, 3 months after and 1 year after surgery
Fig. 4.
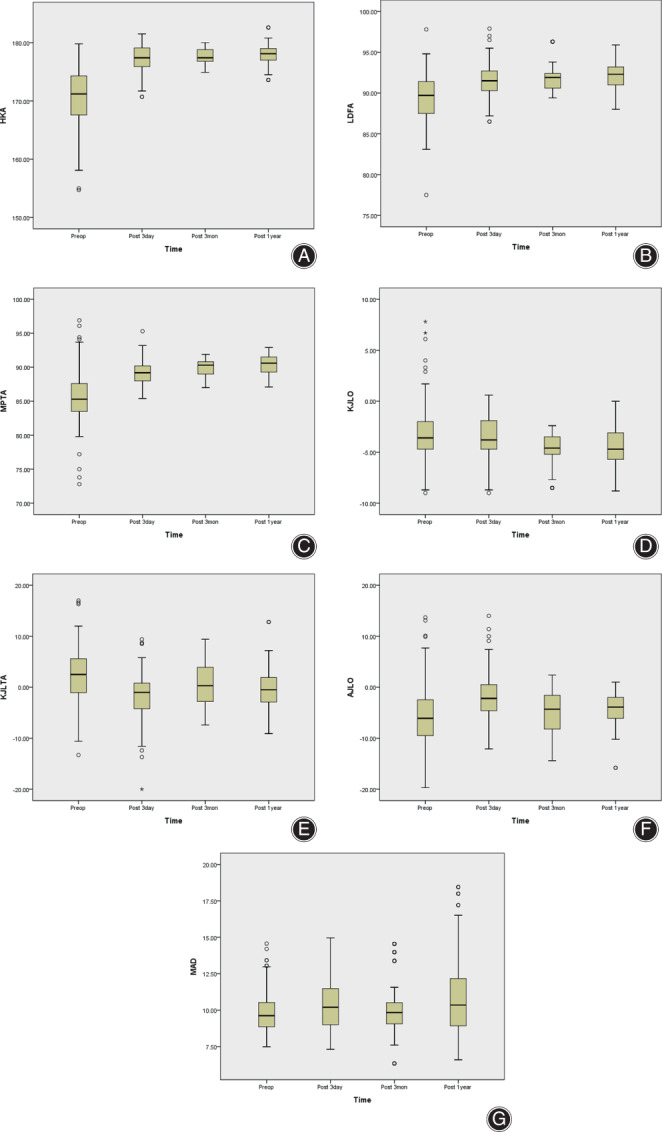
(A) Changes of HKA before, 3 days after, 3 months after and 1 year after surgery. (B) Changes of LDFA before, 3 days after, 3 months after and 1 year after surgery. (C) Changes of MPTA before, 3 days after, 3 months after and 1 year after surgery. (D) Changes of KJLO before, 3 days after, 3 months after and 1 year after surgery. (E) Changes of KJLTA before, 3 days after, 3 months after and 1 year after surgery. (F) Changes of AJLO before, 3 days after, 3 months after and 1 year after surgery. (G) Changes of MAD before, 3 days after, 3 months after and 1 year after surgery
LDFA changed from preoperative varus (0.64° ± 2.96°) to postoperative valgus (−2.18° ± 1.53°), and no significant difference was found in LDFA changes between 3 days after surgery and 3 months after surgery (P = 0.457). Therefore, LDFA changed from preoperative time to the day 3 day after surgery, and from postoperative 3 months to postoperative 1 year (Fig. 4B).
MPTA changed from varus (4.68° ± 3.77°) before surgery to valgus (−0.45° ± 1.45°) after surgery, and there were significant differences in MPTA within 1 year after surgery (P < 0.05), showing that MPTA underwent change during the first postoperative year (Fig. 4C).
No significant difference was revealed in the changes of KJLO from pre‐operative time to day 3 after surgery (P = 0.089) and preoperative 3 months postoperative 1 year (P = 0.957). The valgus angle increased from 3 days (−3.50° ± 1.93°) to 3 months after surgery (−4.59° ± 1.54°), suggesting that KJLO did not go through any change 3 months after surgery (Fig. 4D).
KJLTA changed from varus before surgery (2.36° ± 5.19°) to valgus 1 year after surgery (−0.24° ± 3.77°), and gradually approached 0°. There was no significant difference in KJLTA changes between 3 months after surgery and 1 year after surgery (P = 0.076), suggesting that KJLTA did not undergo substantial change 3 months after surgery (Fig. 4E).
The angle of AJLO decreased gradually after surgery (−5.38°± 6.35° to −4.36° ± 3.17°), and there was no significant difference in AJLO changes between 3 months after surgery and 1 year after surgery (P = 0.551), indicating that AJLO did not change after 3 months after surgery (Fig. 4F).
MAD incrementally increased after surgery (9.83 ± 1.44 cm to 11.04 ± 2.88 cm), and there was no significant difference in MAD changes between 3 days after surgery and 3 months after surgery (P = 0.124). Therefore, MAD underwent constant change from preoperative time to postoperative 3 days and from postoperative 3 months to postoperative 1 year (Fig. 4G).
To sum up, to understand the changes in imaging parameters of lower limbs after surgery, the data of postoperative 1 year should be integrated into the comparison with preoperative data (Table 1).
TABLE 1.
Preoperative and postoperative radiographic data (Mean ± SD)
| Radiographic parameters | Postop 1 year (N = 121) | Postop 3 month (N = 121) | Postop 3 day (N = 121) | Preop (N = 121) | t a | P value a | t b | P value b | t c | P value c |
|---|---|---|---|---|---|---|---|---|---|---|
| HKA, deg | 2.04 ± 1.81 | 2.36 ± 1.60 | 2.87 ± 2.26 | 9.17 ± 5.12 | 1.423 | 0.157 | 1.996 | 0.048 | 14.908 | 0.000 |
| LDFA, deg | −2.18 ± 1.53 | −1.74 ± 1.45 | −1.57 ± 2.03 | 0.64 ± 2.96 | 2.191 | 0.030 | 0.746 | 0.457 | 9.100 | 0.000 |
| MPTA, deg | −0.45 ± 1.45 | 0.03 ± 1.26 | 0.76 ± 1.75 | 4.68 ± 3.77 | 2.840 | 0.005 | 3.532 | 0.001 | 11.538 | 0.000 |
| KJLO, deg | −4.58 ± 1.85 | −4.59 ± 1.54 | −3.50 ± 1.93 | −3.03 ± 2.83 | −0.054 | 0.957 | 4.913 | 0.000 | 1.716 | 0.089 |
| MAD, cm | 11.04 ± 2.88 | 10.10 ± 2.03 | 10.46 ± 1.85 | 9.83 ± 1.44 | −2.711 | 0.004 | 1.548 | 0.124 | −3.168 | 0.002 |
| KJLTA, deg | −0.24 ± 3.77 | 0.72 ± 4.55 | −1.60 ± 4.36 | 2.36 ± 5.19 | 1.792 | 0.076 | −4.136 | 0.000 | 10.417 | 0.000 |
| AJLO, deg | −4.36 ± 3.17 | −4.67 ± 4.81 | −1.93 ± 4.55 | −5.38 ± 6.35 | 0.082 | 0.551 | 3.592 | 0.000 | −6.747 | 0.000 |
Abbreviations: AJLO, Ankle joint line orientation; HKA, Hip‐knee‐ankle angle; KJLO, Knee joint line orientation; KJLTA, the knee joint line relative to ankle joint line angle; LDFA, Lateral distal femoral angle; MAD, Midpoints of the ankle distance; MPTA, Medial proximal tibial angle.
Postop 1 year vs Postop 3 month.
Postop 3 month vs Postop 3 day.
Postop 3 day vs Preop.
Preoperative vs Postoperative 1 Year
Δ was used to represent the changes in radiographic parameters of the postoperative lower limb radiographs. The changes in imaging parameters 1 year after surgery were compared with those before surgery, and the differences of each parameter were found to be statistically significant (P < 0.05) (Table 2).
TABLE 2.
Mean and standard deviation postop 1 year vs preop changes of radiographic parameters
| Changes of parameters (N = 121) | Mean ± SD | t | P value |
|---|---|---|---|
| ΔHKA, deg | 7.13 ± 5.35 | 14.655 | 0.000 |
| ΔLDFA, deg | 2.83 ± 3.54 | 8.771 | 0.000 |
| ΔMPTA, deg | 5.13 ± 4.17 | 13.545 | 0.000 |
| ΔKJLO, deg | 1.55 ± 3.33 | 5.135 | 0.000 |
| ΔMAD, cm | 1.21 ± 3.26 | −3.942 | 0.000 |
| ΔKJLTA, deg | 2.59 ± 6.18 | 4.620 | 0.000 |
| ΔAJLO, deg | 1.01 ± 6.94 | −1.616 | 0.019 |
Correlation between Δ KJLO and Other Radiological Parameters
The correlation between postoperative changes in KJLO and other radiological parameters was analyzed, It is found that ΔKJLO bore a weak negative correlation with ΔHKA and ΔLDFA, and a weak positive correlation with ΔMAD and ΔAJLO (P < 0.05). No significant difference was found between ΔMPTA and ΔKJLTA (P > 0.05) (Table 3).
TABLE 3.
Correlation coefficients and P values of ΔKJLO and other radiographic parameters
| Correlation between | ΔHKA | ΔLDFA | ΔMPTA | ΔMAD | ΔKJLR‐A | ΔAJLO |
|---|---|---|---|---|---|---|
| Spearman's correlation coefficient (r) | −0.311 | −0.505 | 0.157 | 0.421 | 0.011 | 0.421 |
| P value | 0.001 | 0.000 | 0.085 | 0.000 | 0.906 | 0.000 |
Discussion
Overall, this study confirmed that radiographic parameters of full‐length lower extremities experienced changes within 1 year after TKA with MA. Imaging parameters underwent changed 1 year after surgery as compared with those before surgery and the differences were statistically significant. Different from the study of Zahn et al., 14 our analysis found significant differences in LDFA, MPTA and MAD even 1 year after surgery when compared with the data 3 months after surgery. We believe that the lower limbs are in an unnatural state within 1 year after TKA, and this unnatural state might be ascribed to soft tissue contracture and other factors. Therefore, imaging data beyond 1 year after surgery should be included in the study of changes of lower limb force lines after TKA.
Changes in Radiological Parameters
The data of KJLO showed that when the mechanical axis of the lower limb was varus, the knee line was not parallel to the horizontal line, 19 which was consistent with the results by Ji et al. 20 ΔMPTA and ΔLDFA can well explain the changes of ΔHKA. However, ΔMPTA is 5.13° and ΔKJLO is 1.55°, which is less than half of ΔMPTA. 21 KJLTA showed that the preoperative angle of the knee line relative to the ankle line was varus, while the postoperative angle of the knee line relative to the ankle line changed to valgus and was close to 0°. AJLO was −5.38° before surgery; AJLO was −4.36° 1 year after surgery; ΔAJLO was 1.01°, indicating that the angle of the ankle joint line relative to the horizontal line was both valgus before and after surgery, and TKA reduced AJLO while correcting the lower limb force line. 22
Correlation among Radiological Parameters
In this study, it has a weak negative correlation with ΔHKA and ΔLDFA, and a weak positive correlation with ΔMAD and ΔAJLO. There was no significant difference between ΔMPTA and ΔKJLR‐A. In summary, this study suggested that the tibial side overall shifted to the lateral limb after TKA, resulting in in post‐TKA changes in the lower limb force line.
Establishment of Tibial Model
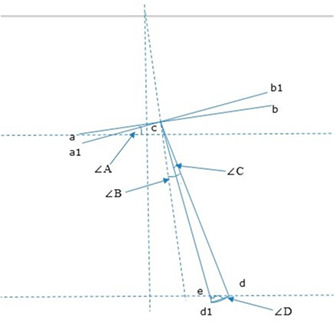
On the basis of this assumption, a simple tibial model was established (Fig. 5), taking into account the changes of imaging parameters of the full length of the lower limbs. We assumed that the tibia swung from cd to cd1. Given possible angle measurement error, we assumed that the postoperative MPTA was 90°, so ΔMPTA = 4.68°and the angle of the swing was ∠C = ΔMPTA‐ΔKJLO≈3°. Through this model, we calculated the lateral movement distance of the midpoint of the ankle joint and the postoperative AJLO compared with the measured value to verify the model. Tibial length L = cd; According to the tibia height calculation formula: female Y = 4.61L + 5; Male Y = 4.53L + 5, Y = 121 the average height of patients was 160 cm, L = 33.6 ~ 34.2 was calculated, since the patients included both males and females, the length of tibia L = 34cm; according to the imaging data of preoperative and postoperative full‐length x‐ray films of lower limbs, dd1 is the chord length of ∠C = 2*L*sin(∠C/2) = 1.78°, ∠D = ∠A + ∠B‐∠C/2 = 6.18°. By using the Pythagorean theorem, the distance of the midpoint of the ankle of the operative limb moving to the lateral of the limb after TKA could be determined: the horizontal movement distance L1 = L*cos(∠D) = 1.76cm;The vertical movement distance L2 = L* sin(∠D) = 0.19 cm. In this study, ΔMAD after TKA was 1.21 cm, which was roughly identical to L1 of the horizontal movement distance of the midpoint of the ankle joint as calculated by the model, considering flexion contracture and measurement error of the affected limb before surgery. The vertical upward movement distance of the midpoint of the tibia plateau, as represented by L2 is virtually marginal and could be ignored, which may explain why post‐TKA patients do not feel the length discrepancy of the limb on the operative side. 23 , 24 , 25 According to this model, AJLO = ∠B‐∠A‐∠C = ‐4.68° after operation could be calculated, which was roughly equivalent to AJLO = −4.36° after operation. Thus, it was verified that the angle of swing angle ∠C = ΔMPTA‐ΔKJLO≈3°. At this time, this model could explain the situation where ΔKJLO was much less than ΔMPTA after TKA, and the situation in which AJLO changed, from −5.38° before TKA to −4.36° after TKA, with ankle joint experiencing no changes. Thus, the hypothesis that the whole tibia moving to the lateral limb after TKA results in the change of the lower limb force line after TKA was verified.
Fig. 5.
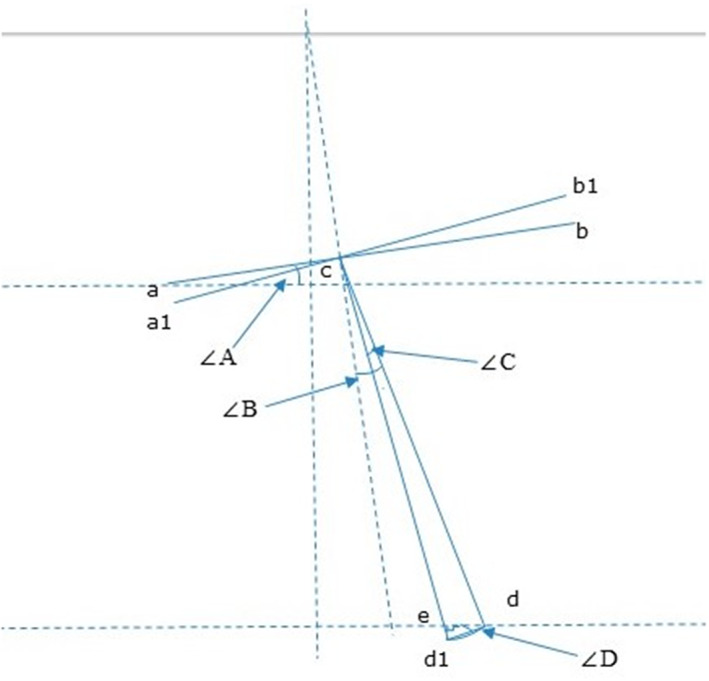
The tibia is simplified as a two‐dimensional graph, where ab is the extension line of the tibial plateau after TKA, c is the midpoint of the tibial plateau, d is the midpoint of the ankle point before TKA, d1 is the assumed midpoint of the postoperative ankle point, e is the intersection point of the horizontal line between the tibial plateau and the original midpoint of the ankle joint after TKA, a1b1 is the extension line of the tibial plateau after TKA, and tibial length L = cd = cd1. ∠A is the preoperative KJLO, ∠B is the preoperative MPTA, ∠C is the angle of lower limb swing, and ∠D = edd1
Strengths and Limitations
Strengths of this study included: first, postoperative and postoperative x‐ray films were taken by the same machine in our hospital and the imaging images were digitized and uploaded to the PACS system. These methods greatly reduce the observation error. Second, the changes in imaging parameters before, 3 days, 3 months and 1 year after TKA were systematically observed and analyzed. Third, the post‐TKA changes in imaging parameter were further confirmed by a tibia model.
Some limitations of this study need to be mentioned. First, all full‐length lower limb radiographs were taken at once by a radiographer blinded to the study, which rendered it impossible to control for operation errors. Preoperative full‐length radiographs of the lower extremity might be affected by knee flexion contracture. The second limitation is whether the imaging parameters of full‐length lower extremity radiographs including ankle and knee positions change after postoperative 1 year. 26 In this study, only the full‐length radiographs of lower limbs within 1 year after surgery were compared with those before surgery, and it remains unclear whether these imaging parameters continued to change 1 year after surgery. 27 The third limitation is that this imaging study is of a static nature and only reflects the lower limb force lines of patients in the static standing position after TKA. The results of this study provide a reasonable explanation for the KJLO changes after TKA. However, some studies suggest that the tibial plateau is parallel to the horizontal line during walking after TKA. 19 , 28 , 29 The static nature of the study might have a great impact on imaging parameters due to an unnatural state of ankle and knee within 1 year after TKA. Therefore, we believe that it is necessary to conduct further dynamic studies through gait analysis, to verify the conclusions of this study by examining the changes in the relative positions of ankle and knee joints, and to accurately study the changes in lower limb force lines. 30 , 31
Conclusion
After total knee arthroplasty with mechanical alignment, the lower extremities may be in an unnatural state within 1 year after surgery due to soft tissue contracture. Therefore, imaging data of more than 1 year after surgery should be integrated into the study on the changes of lower limb force lines after TKA. Tibial model showed that the postoperative changes in the lower extremity force line were actually the results of the gradual adaptation of the lower extremities to TKA and the postoperative limb swing to the lateral 3°. However, the changes of lower limb force lines after TKA warrant further dynamic studies involving gait analysis.
Author Contribution
Conception and design: Long Cheng, Peng Ren, Qingyuan Zheng and Guo‐Qiang Zhang. Analysis and interpretation of the data: Long Cheng, Peng Ren, Qingyuan Zheng, Yi‐Ming Wang, Ming Ni, Lei Geng and Guo‐Qiang Zhang. Drafting of the article: Long Cheng, Peng Ren and Qingyuan Zheng. Critical revision of the article for important intellectual content: Long Cheng, Peng Ren, Ming Ni and Guo‐Qiang Zhang. Final approval of the article: Long Cheng, Peng Ren, Qingyuan Zheng and Guo‐Qiang Zhang. The work was performed at the Chinese PLA General Hospital.
Ethics Statement
The study protocol was approved by the ethics committee of Chinese PLA General Hospital (No. S2021‐094‐01) and informed consents were obtained from all patients.
The first three authors contributed equally to this work and are considered co‐first authors.
References
- 1. Dossett H, Swartz G, Estrada N, LeFevre G, Kwasman B. Kinematically versus mechanically aligned total knee arthroplasty. Orthopedics. 2012;35:e160–9. [DOI] [PubMed] [Google Scholar]
- 2. Sezer HB, Bohu Y, Hardy A, Lefevre N. Knee prosthesis in the computer era. Orthop Surg. 2021;13:395–401. [DOI] [PMC free article] [PubMed] [Google Scholar]
- 3. Rodricks DJ, Patil S, Pulido P, Colwell CW Jr. Press‐fit condylar design total knee arthroplasty. Fourteen to seventeen‐year follow‐up. J Bone Joint Surg Am. 2007;89:89–95. [DOI] [PubMed] [Google Scholar]
- 4. Bourne RB, Chesworth BM, Davis AM, Mahomed NN, Charron KD. Patient satisfaction after total knee arthroplasty: who is satisfied and who is not? Clin Orthop Relat Res. 2010;468:57–63. [DOI] [PMC free article] [PubMed] [Google Scholar]
- 5. Kahlenberg CA, Nwachukwu BU, McLawhorn AS, Cross MB, Cornell CN, Padgett DE. Patient satisfaction after total knee replacement: a systematic review. HSS J. 2018;14:192–201. [DOI] [PMC free article] [PubMed] [Google Scholar]
- 6. Takahashi T, Ansari J, Pandit HG. Kinematically aligned total knee arthroplasty or mechanically aligned total knee arthroplasty. J Knee Surg. 2018;31:999–1006. [DOI] [PubMed] [Google Scholar]
- 7. Argenson JN, Boisgard S, Parratte S, Descamps S, Bercovy M, Bonnevialle P, Briard JL, Brilhault J, Chouteau J, Nizard R, Saragaglia D, Servien E et al. Survival analysis of total knee arthroplasty at a minimum 10 years' follow‐up: a multicenter French nationwide study including 846 cases. Orthop Traumatol Surg Res 2013;99:385–390. [DOI] [PubMed] [Google Scholar]
- 8. Gill GS, Joshi AB, Mills DM. Total condylar knee arthroplasty. 16‐ to 21‐year results. Clin Orthop Relat Res. 1999;367:210–5. [PubMed] [Google Scholar]
- 9. Bartholomeeusen S, Van den Bempt M, van Beek N, Claes T, Claes S. Changes in knee joint line orientation after high tibial osteotomy are the result of adaptation of the lower limb to the new alignment. Knee. 2020;27:777–86. [DOI] [PubMed] [Google Scholar]
- 10. Kim JT, Han J, Lim S, Shen QH, Won YY. Kinematically aligned TKA aligns the ankle joint line closer to those of the native ankle than mechanically aligned TKA in bipedal stance. J Knee Surg. 2019;32:1033–8. [DOI] [PubMed] [Google Scholar]
- 11. Cho W, Cho H, Byun S. Changes in hindfoot alignment after total knee arthroplasty in knee osteoarthritic patients with varus deformity. Knee Surg Sports Traumatol Arthrosc. 2017;25:3596–604. [DOI] [PubMed] [Google Scholar]
- 12. Zahn RK, Renner L, Perka C, Hommel H. Weight‐bearing radiography depends on limb loading. Knee Surg Sports Traumatol Arthrosc. 2019;27:1470–6. [DOI] [PubMed] [Google Scholar]
- 13. Matsumoto T, Takayama K, Ishida K, Hayashi S, Hashimoto S, Kuroda R. Radiological and clinical comparison of kinematically versus mechanically aligned total knee arthroplasty. Bone Joint J. 2017;99‐B:640–6. [DOI] [PubMed] [Google Scholar]
- 14. Zahn RK, Fussi J, von Roth P, Perka CF, Hommel H. Postoperative increased loading leads to an alteration in the radiological mechanical axis after total knee arthroplasty. J Arthroplast. 2016;31:1803–7. [DOI] [PubMed] [Google Scholar]
- 15. Rossi R, Cottino U, Bruzzone M, Dettoni F, Bonasia DE, Rosso F. Total knee arthroplasty in the varus knee: tips and tricks. Int Orthop. 2019;43:151–8. [DOI] [PubMed] [Google Scholar]
- 16. Wu JY, Zuo JL, Liu T, Gao ZL. Measurements and analyses of full length weight bearing X ray radiographs of bilateral lower extremities in patients with knee osteoarthritis. Zhongguo Gu Shang. 2016;29:791–4. [DOI] [PubMed] [Google Scholar]
- 17. Tjörnstrand B, Egund N, Hagstedt B, Lindstrand A. Tibial osteotomy in medial gonarthrosis. The importance of over‐correction of varus deformity. Arch Orthop Trauma Surg. 1981;99:83–9. [DOI] [PubMed] [Google Scholar]
- 18. Malavolta M, Compagnoni R, Mezzari S, Calanna F, Pastrone A, Randelli P. Good clinical results using a modified kinematic alignment technique with a cruciate sacrificing medially stabilised total knee arthroplasty. Knee Surg Sports Traumatol Arthrosc. 2020;30:500–6. [DOI] [PubMed] [Google Scholar]
- 19. Victor JM, Bassens D, Bellemans J, Gürsu S, Dhollander AA, Verdonk PC. Constitutional varus does not affect joint line orientation in the coronal plane. Clin Orthop Relat Res. 2014;472:98–104. [DOI] [PMC free article] [PubMed] [Google Scholar]
- 20. Ji HM, Han J, Jin DS, Seo H, Won YY. Kinematically aligned TKA can align knee joint line to horizontal. Knee Surg Sports Traumatol Arthrosc. 2016;24:2436–41. [DOI] [PubMed] [Google Scholar]
- 21. Hutt J, Massé V, Lavigne M, Vendittoli PA. Functional joint line obliquity after kinematic total knee arthroplasty. Int Orthop. 2016;40:29–34. [DOI] [PubMed] [Google Scholar]
- 22. Lee JH, Jeong BO. Radiologic changes of ankle joint after total knee arthroplasty. Foot Ankle Int. 2012;33:1087–92. [DOI] [PubMed] [Google Scholar]
- 23. Vaidya SV, Patel MR, Panghate AN, Rathod PA. Total knee arthroplasty: limb length discrepancy and functional outcome. Indian J Orthop. 2010;44:300–7. [DOI] [PMC free article] [PubMed] [Google Scholar]
- 24. Bhave A, Mont M, Tennis S, Nickey M, Starr R, Etienne G. Functional problems and treatment solutions after total hip and knee joint arthroplasty. J Bone Joint Surg Am. 2005;87(2):9–21. [DOI] [PubMed] [Google Scholar]
- 25. Chinnappa J, Chen DB, Harris IA, MacDessi SJ. Predictors and functional implications of change in leg length after Total knee arthroplasty. J Arthroplast. 2017;32:2725–2729.e1. [DOI] [PubMed] [Google Scholar]
- 26. Lee NK, Kim TW, Lee S, Choi YS, Kang SB, Chang CB. Effect of distance between the feet on knee joint line orientation after total knee arthroplasty in standing full‐limb radiographs. Knee Surg Sports Traumatol Arthrosc. 2022;30(9):3032–3040. [DOI] [PubMed] [Google Scholar]
- 27. Parisi TJ, Levy DL, Dennis DA, Harscher CA, Kim RH, Jennings JM. Radiographic changes in nonoperative contralateral knee after unilateral total knee arthroplasty. J Arthroplast. 2018;33:s116–20. [DOI] [PubMed] [Google Scholar]
- 28. Chao EY, Neluheni EV, Hsu RW, Paley D. Biomechanics of malalignment. Orthop Clin North Am. 1994;25:379–86. [PubMed] [Google Scholar]
- 29. Paley D, Herzenberg JE, Tetsworth K, McKie J, Bhave A. Deformity planning for frontal and sagittal plane corrective osteotomies. Orthop Clin North Am. 1994;25:425–65. [PubMed] [Google Scholar]
- 30. Fujimoto E, Sasashige Y, Tomita T, Kashiwagi K, Inoue A, Sawa M, Ota Y et al. Different femorotibial contact on the weight‐bearing: midflexion between normal and varus aligned knees after total knee arthroplasty. Knee Surg Sports Traumatol Arthrosc 2015;23:1720–1728. [DOI] [PubMed] [Google Scholar]
- 31. Miller EJ, Pagnano MW, Kaufman KR. Tibiofemoral alignment in posterior stabilized total knee arthroplasty: static alignment does not predict dynamic tibial plateau loading. J Orthop Res. 2014;32:1068–74. [DOI] [PubMed] [Google Scholar]


