Abstract
Gait analysis can identify injury-risk markers indiscernible to the naked eye. Inertial measurement unit (IMU)-based motion capture circumvents optokinetic motion capture (OMC) clinical implementation barriers with its portability, increased affordability, and decreased computational burden. We compared an IMU system to a robust OMC marker set for gait analysis. 10 healthy adults walked at self-selected speeds equipped with Noraxon MyoMotion IMUs and a 24-marker, 5-cluster marker-set in view of 14 OMC cameras. A single calibration was applied. IMU system and OMC calculated joint angles were compared. A single calibration performed similarly to previously reported repeated calibration. IMU and OMC agreement was best in the sagittal plane with IMU axis-mixing affecting off-sagittal plane agreement. System differences were greater than 5° for most motions. Measurement system bias showed at the ankle and knee, however differences varied across participants. IMU kinematics should be interpreted with caution; consistency and accuracy must improve before IMUs can replace OMC.
Keywords: Inertial measurement unit (IMU), Wearable sensors, Gait analysis, Accuracy, Motion capture
1. Introduction
Gait analysis is an important screening and assessment tool. Clinically, gait analysis is utilized by rehabilitation specialists to quickly identify strength, balance, and motor control deficits in need of further follow-up [1]. For example, gait analysis has shown useful in identifying factors related to sports and running injury progression [2–4]. However, by the time gait deviations are easily identifiable to the naked eye, the injury process is often already underway. Therefore, biomechanical gait analysis using specialized equipment and software can be used to pick up on more subtle deficits and direct earlier intervention prior to the development of injury [5–7].
Optokinetic motion capture (OMC) is the current gold standard for biomechanical analysis. OMC uses a series of infrared cameras to track the 3-D location of retroreflective markers placed on anatomical landmarks. The location of these anatomical landmarks is then used to mathematically create a digital model of the skeleton and calculate joint angles. Unfortunately, optokinetic motion capture systems are expensive, can only be used in fixed environments, and the analyses are computationally intensive.
Wearable sensors are a rapidly growing field for movement assessment due to their increased affordability and portability compared to traditional OMC systems [8–12]. Inertial measurement unit (IMU) based wearable sensors utilize miniaturized accelerometers, gyroscopes, and magnetometers to assess linear acceleration, angular velocity, and orientation relative to Earth’s magnetic poles, respectively, in three orthogonal planes. When placed on rigid body segments, the information from these nine sensors on each IMU can be used to determine orientation relative to a neighboring body segment and, therefore, joint angles between segments. One such system which uses this method is the Noraxon MyoMotion System (Noraxon USA Inc., Scottsdale, AZ, USA). Proprietary software takes raw data from seven IMUs and outputs anatomical lower-extremity joint angles during activities in natural and laboratory environments.
How the portable Noraxon system performs compared with the gold standard motion capture system for assessing kinematics during gait is not well described. Berner et al. [13] assessed the similarity, in lower extremity joint angles during gait, between a Noraxon system and OMC with a basic plug-in gait marker set, performing the calibration pose prior to every gait trial [13]. They found clinically significant differences, defined as greater than 5°, between the outputs from the two systems, but agreement improved if the difference between the IMU and OMC models during calibration were subtracted from all subsequent IMU data [13]. This technique is impractical for implementation in clinical settings where OMC data are not obtainable. Further, re-calibration prior to every trial (a 20–30 s process) adds excessive time burden to both the clinician and patients looking to utilize the IMU-based Noraxon system for clinical biomechanics assessments. In addition, different OMC marker sets have been shown to produce different kinematics, especially in the frontal plane [14]. In a 2015 conference proceeding, Seidel et al. presented preliminary work demonstrating a 22 marker and 4 cluster marker set produced correlated, but significantly different kinematic outputs, compared with Noraxon, urging further follow-up to corroborate these findings [15].
The goal of this study is to understand how lower extremity kinematic outputs from the IMU-based Noraxon system compare with the existing gold-standard OMC technology for assessing gait when utilizing a robust 24-marker and 5-cluster marker set with a single calibration file applied to all trials [16]. The results of this study will improve the understanding of how a clinically accessible, IMU-based motion capture system (Noraxon) compares with more-precisely measured OMC kinematics with a clinically implementable protocol. An improved understanding of how to interpret and implement kinematic outputs from IMU-based motion capture systems will improve the clinical accessibility of biomechanical gait analyses, aid earlier identification of mobility deficits, and promote early intervention to prevent or delay injury development.
2. Methods
2.1. Study population
Ten healthy young adults (eight female, two male) consented to participate in the study. Participants were overall healthy with a mean (SD) age of 23.0 (1.6) years, height of 167.3 (11.1) cm, mass of 65.8 (15.6) kg, and body mass index (BMI) of 23.1 (3.1) kg/m2. Participants were included in the study if they had a BMI below 30, had no orthopedic injuries in the last three years, had no balance, dizziness, or neurological problems, and were not taking medications with balance side effects. Participants completed a single 1-h testing session at the University of Pittsburgh’s Human Movement and Balance Laboratory. The study protocol was approved by University of Pittsburgh’s Institutional Review Board.
2.2. Procedure and data acquisition
Participants were equipped with the Noraxon MyoMotion IMU lower extremity set (Noraxon USA, Scottsdale, AZ, USA) on the pelvis, thighs, shanks, and feet, and a robust set of optokinetic markers on bony landmarks as has been described previously (Fig. 1) [16]. After a single static calibration with the Noraxon system, hereinafter referred to as “IMU”, participants walked at their self-selected comfortable gait speed, group mean ± standard deviation: 1.41 ± 0.14 m/s, across a tile floor while in the view of 14 Vicon motion capture cameras (Vicon Motion Systems Ltd., Centennial, CO, USA), OMC. The original calibration file was reapplied to the system before the start of each walking trial to correct for drift which may have occurred. IMU and OMC data were collected at 100 and 120 Hz respectively.
Fig. 1.
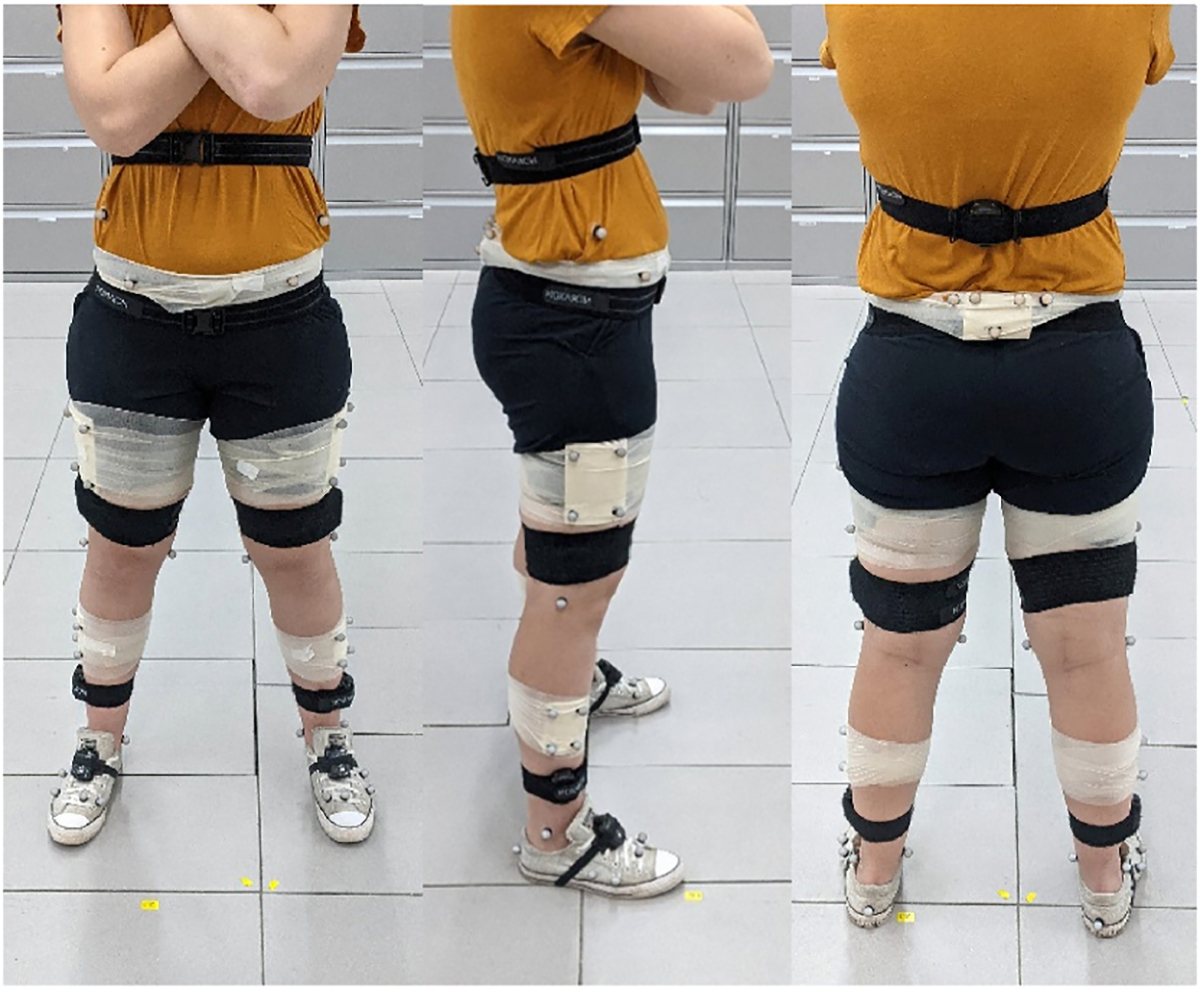
Participant equipped with optokinetic markers and IMUs.
2.3. Data analysis
A custom MATLAB code (Version R2018a, MathWorks Inc., Natick, MA, USA) used IMU’s vertical foot accelerometer data and OMC heel marker vertical position data to identify heel strikes and extract temporal features of gait [17]. Kinematic outputs from the IMU system were automatically calculated with the company’s proprietary software. This software calculates hip and ankle angles about the medial-lateral, anterior-posterior, and longitudinal axes, and sagittal plane knee angles. These seven kinematic outputs were calculated from the OMC data using the International Society of Biomechanics (ISB) convention for joint coordinate system analysis [18,19]. OMC data were filtered with a 4th order 10 Hz low-pass Butterworth filter prior to analysis [20]. Trials were then parsed into gait cycles using heel strike timings and resampled to 100 data points per gait cycle. Fifteen gait cycles from the dominant leg for each participant were included in the final analysis for a total of 150 gait cycles analysed.
2.4. Statistical analysis
2.4.1. Participant summary
A participant summary curve was calculated within each participant as the average of all gait cycles for that participant. Standard deviation of the data across all gait cycles within each participant was also computed. A single coefficient of multiple correlation (CMC) (A [21]. value was estimated for each motion, ankle dorsiflexion, ankle abduction, ankle rotation, hip flexion, hip abduction, hip rotation, knee flexion, across all gait cycles within each participant to describe the agreement of OMC and IMU outputs within each participant. Consistent with Ferrari et al. CMC values between 0.75 and 0.84 were interpreted as good, 0.85–0.94 as very good, and 0.95–1.00 as excellent (A [21]. If variability of kinematic signals between measurement systems exceeded variability from the overall range of motion, this resulted in taking the square root of a negative number; consistent with previous work, these complex CMC values are presented as “nan” (A. [21,22], indicating a complex number interpreted as 0 or negligible.
2.4.2. System summary
A system summary curve was calculated for each motion across all participants as the average of all gait cycle curves for a given motion for that motion capture system. Standard deviation across all cycles within each motion was computed to summarize the overall variability between the systems.
2.4.3. System differences
Within each gait cycle OMC and IMU data were subtracted from one another. Then the average of all 150 gait cycles difference curves for each motion was computed. Standard deviation of differences were calculated across all gait cycles then averaged within each motion.
Interclass correlation coefficients were computed to assess relationships between sagittal kinematics simultaneously measured by both systems at two prespecified time points of interest: at heel strike and at maximum flexion or extension, which occurs at around 55% of the gait cycle at the hip, 75% of the gait cycle at the knee, and 66% of the gait cycle at the ankle. Kinematics at these time points during gait have been shown to differentiate healthy from disordered gait [23,24]. Correlations were obtained from variance-covariance matrices of bivariate mixed-effects models using the theory described in Shan et al. [25] and the computational methods detailed in Hamlett et al. [26]. This model-derived measure of interclass correlation was chosen over the traditional Pearson product-moment correlation coefficient due to the presence of repeated measures; naïve use of the Pearson correlation would ignore the complex, multilevel structure of the data, leading to biased results. Statistical significance was determined with an alpha set at 0.05, and analyses were performed in SAS Version 9.4 (SAS Institute Inc., Cary, NC, USA).
2.4.4. Clinical relevance
Usefulness of the IMU-based system as a replacement of the OMC system was assessed as has been done previously [27,28] by evaluating the bias between the two systems and the acceptability of the measurements relative to one another. Bland-Altman plots [29] were created for each motion using the differences between OMC and IMU data on the y-axis and the averaged value of these two measurements on the x-axis, averaged across all gait cycles within each motion. Systematic bias between the OMC and IMU systems for each motion was assessed by comparing the line of equality, average of the differences, to zero [30]. Acceptability of the agreement was assessed using limits set at ± 2.5° from the line of equality indicating OMC and IMU data were within 5° overall of each other [31]. This threshold of 5° was used throughout the analysis as a clinically meaningful difference.
3. Results
3.1. Participant summary
CMC values for all participants can be found in Table 1. Greatest agreement for participants was observed in the sagittal plane. All ten participants had good agreement or better between systems at knee flexion, nine had good agreement or better for hip flexion, and seven had good agreement or better for ankle dorsiflexion. Ankle abduction and rotation had poor agreement for all participants. Hip abduction had poor agreement for all but one participant and hip rotation had poor agreement for all but two participants. Participant summary kinematic curves for a typical participant with good agreement between the two systems are shown in Fig. 2 and for a typical participant with poor agreement is shown in Fig. 3. As seen visually and by the larger CMC values (Table 1), agreement in the sagittal plane at all lower extremity joints of interest was greater than in the frontal or transverse planes for nearly all participants. Agreement between OMC and IMU, as indicated by large CMC values, was greatest for Participant 10 (Fig. 2) with knee flexion, closely followed by ankle dorsiflexion, hip flexion, hip external rotation, and then hip abduction. Participant 7 (Fig. 3) also had the best agreement between OMC and IMU with knee flexion and showed excelled agreement for hip flexion, however large disagreements were observed for the other kinematic values. Visually, axis mixing in the IMU signal for non-sagittal plane movements can be observed as evidenced by the visible peaks in the ankle abduction and rotation data at similar times in the gait cycle as when dorsiflexion reaches its maximums. No consistent systematic offset pointing to a different 0 reference was observed between the data for the two systems for all participants. It should be noted that an offset was found for hip abduction in half of the participants (ranging from −20° to +5° offset), knee flexion in four of the ten participants (ranging from +5° to +13° offset), and hip flexion in three of the ten participants (ranging from −11° to +20° offset).
Table 1.
Estimated coefficients of multiple correlation (CMC) values for all motions within each participant.
| Ankle Dorsiflexion | Ankle Abduction | Ankle Rotation | Hip Flexion | Hip Abduction | Hip Rotation | Knee Flexion | |
|---|---|---|---|---|---|---|---|
|
| |||||||
| Subject 1 | 0.74 | nanc | nanc | 0.90 | nanc | 0.86 | 0.95 |
| Subject 2 | 0.94 | 0.48 | nanc | 0.95 | nanc | nanc | 0.92 |
| Subject 3 | 0.80 | 0.12 | nanc | 0.98 | 0.62 | 0.52 | 0.95 |
| Subject 4 | 0.85 | nanc | nanc | 0.72 | 0.63 | nanc | 0.84 |
| Subject 5 | 0.62 | 0.66 | nanc | 0.94 | 0.59 | 0.16 | 0.96 |
| Subject 6 | 0.99 | nanc | nanc | 0.99 | 0.70 | 0.19 | 0.99 |
| Subject 7 b | 0.73 | 0.27 | nanc | 0.92 | nanc | nanc | 0.93 |
| Subject 8 | 0.89 | nanc | nanc | 0.99 | 0.27 | 0.63 | 0.95 |
| Subject 9 | 0.95 | nanc | nanc | 0.99 | 0.73 | 0.55 | 0.91 |
| Subject 10 a | 0.93 | nanc | nanc | 0.87 | 0.82 | 0.87 | 0.99 |
Fig. 2.
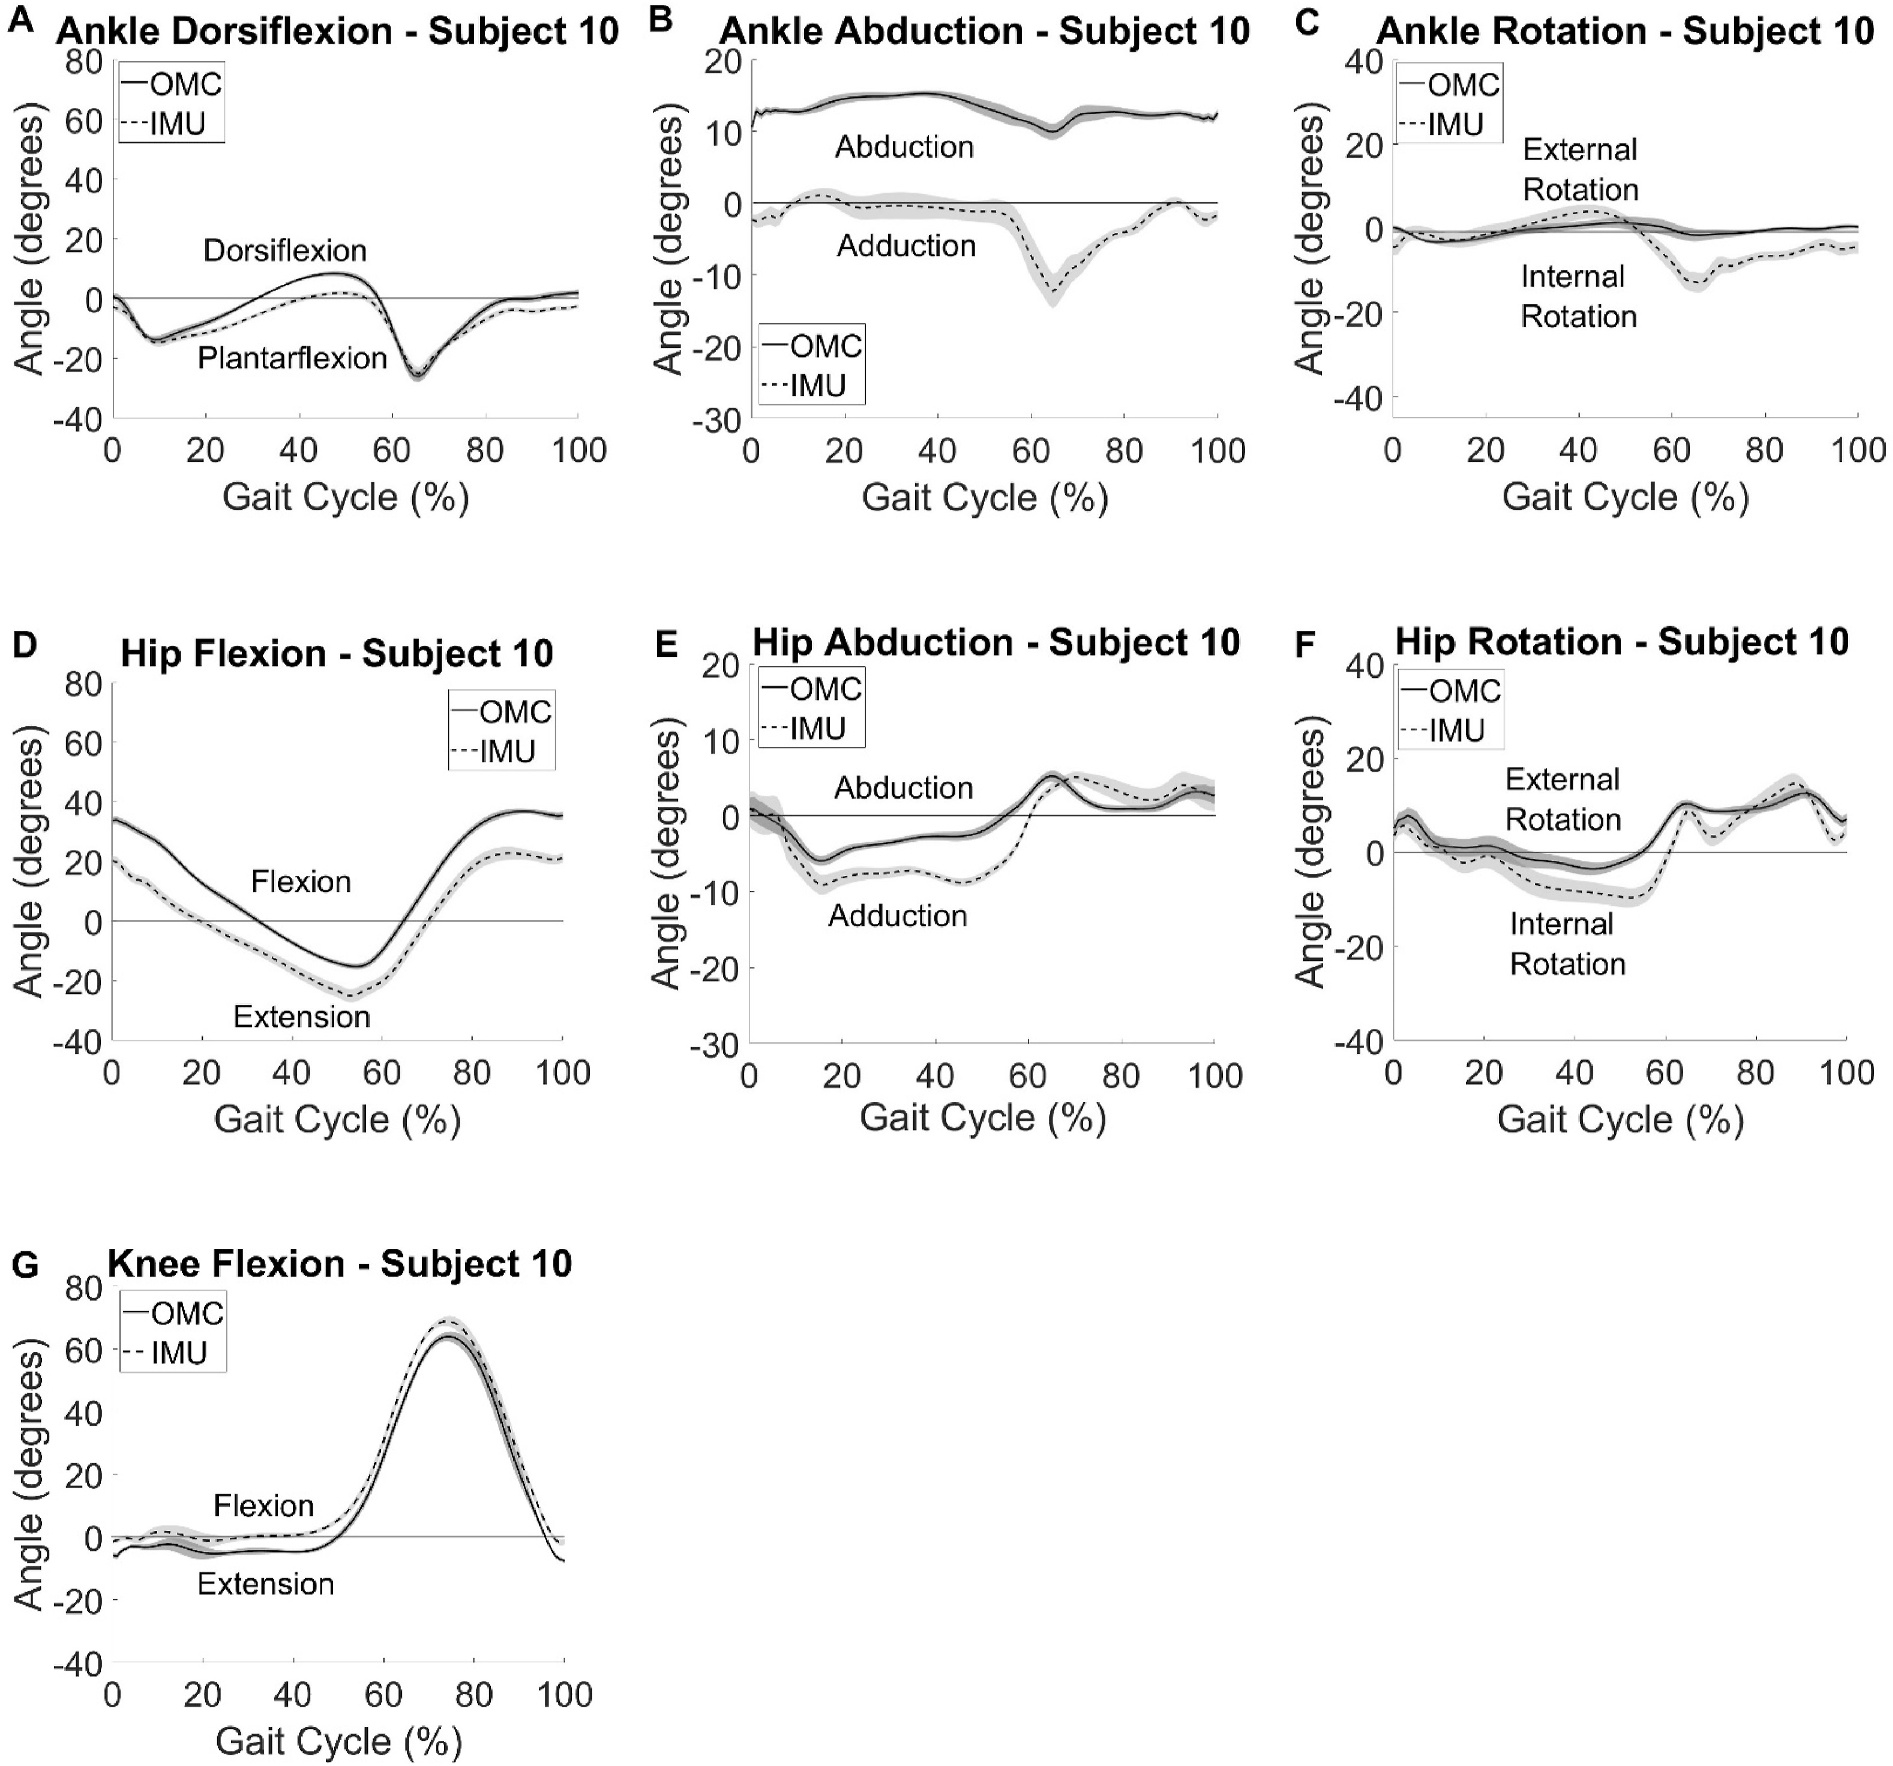
Participant summary curves for IMU (dashed) kinematic outputs compared with the gold standard OMC (solid) vs % gait cycle. A typical participant with good agreement between the two systems is provided. Curves represent average kinematics across 15 gait cycles and shaded areas are ± one standard deviation.
Fig. 3.
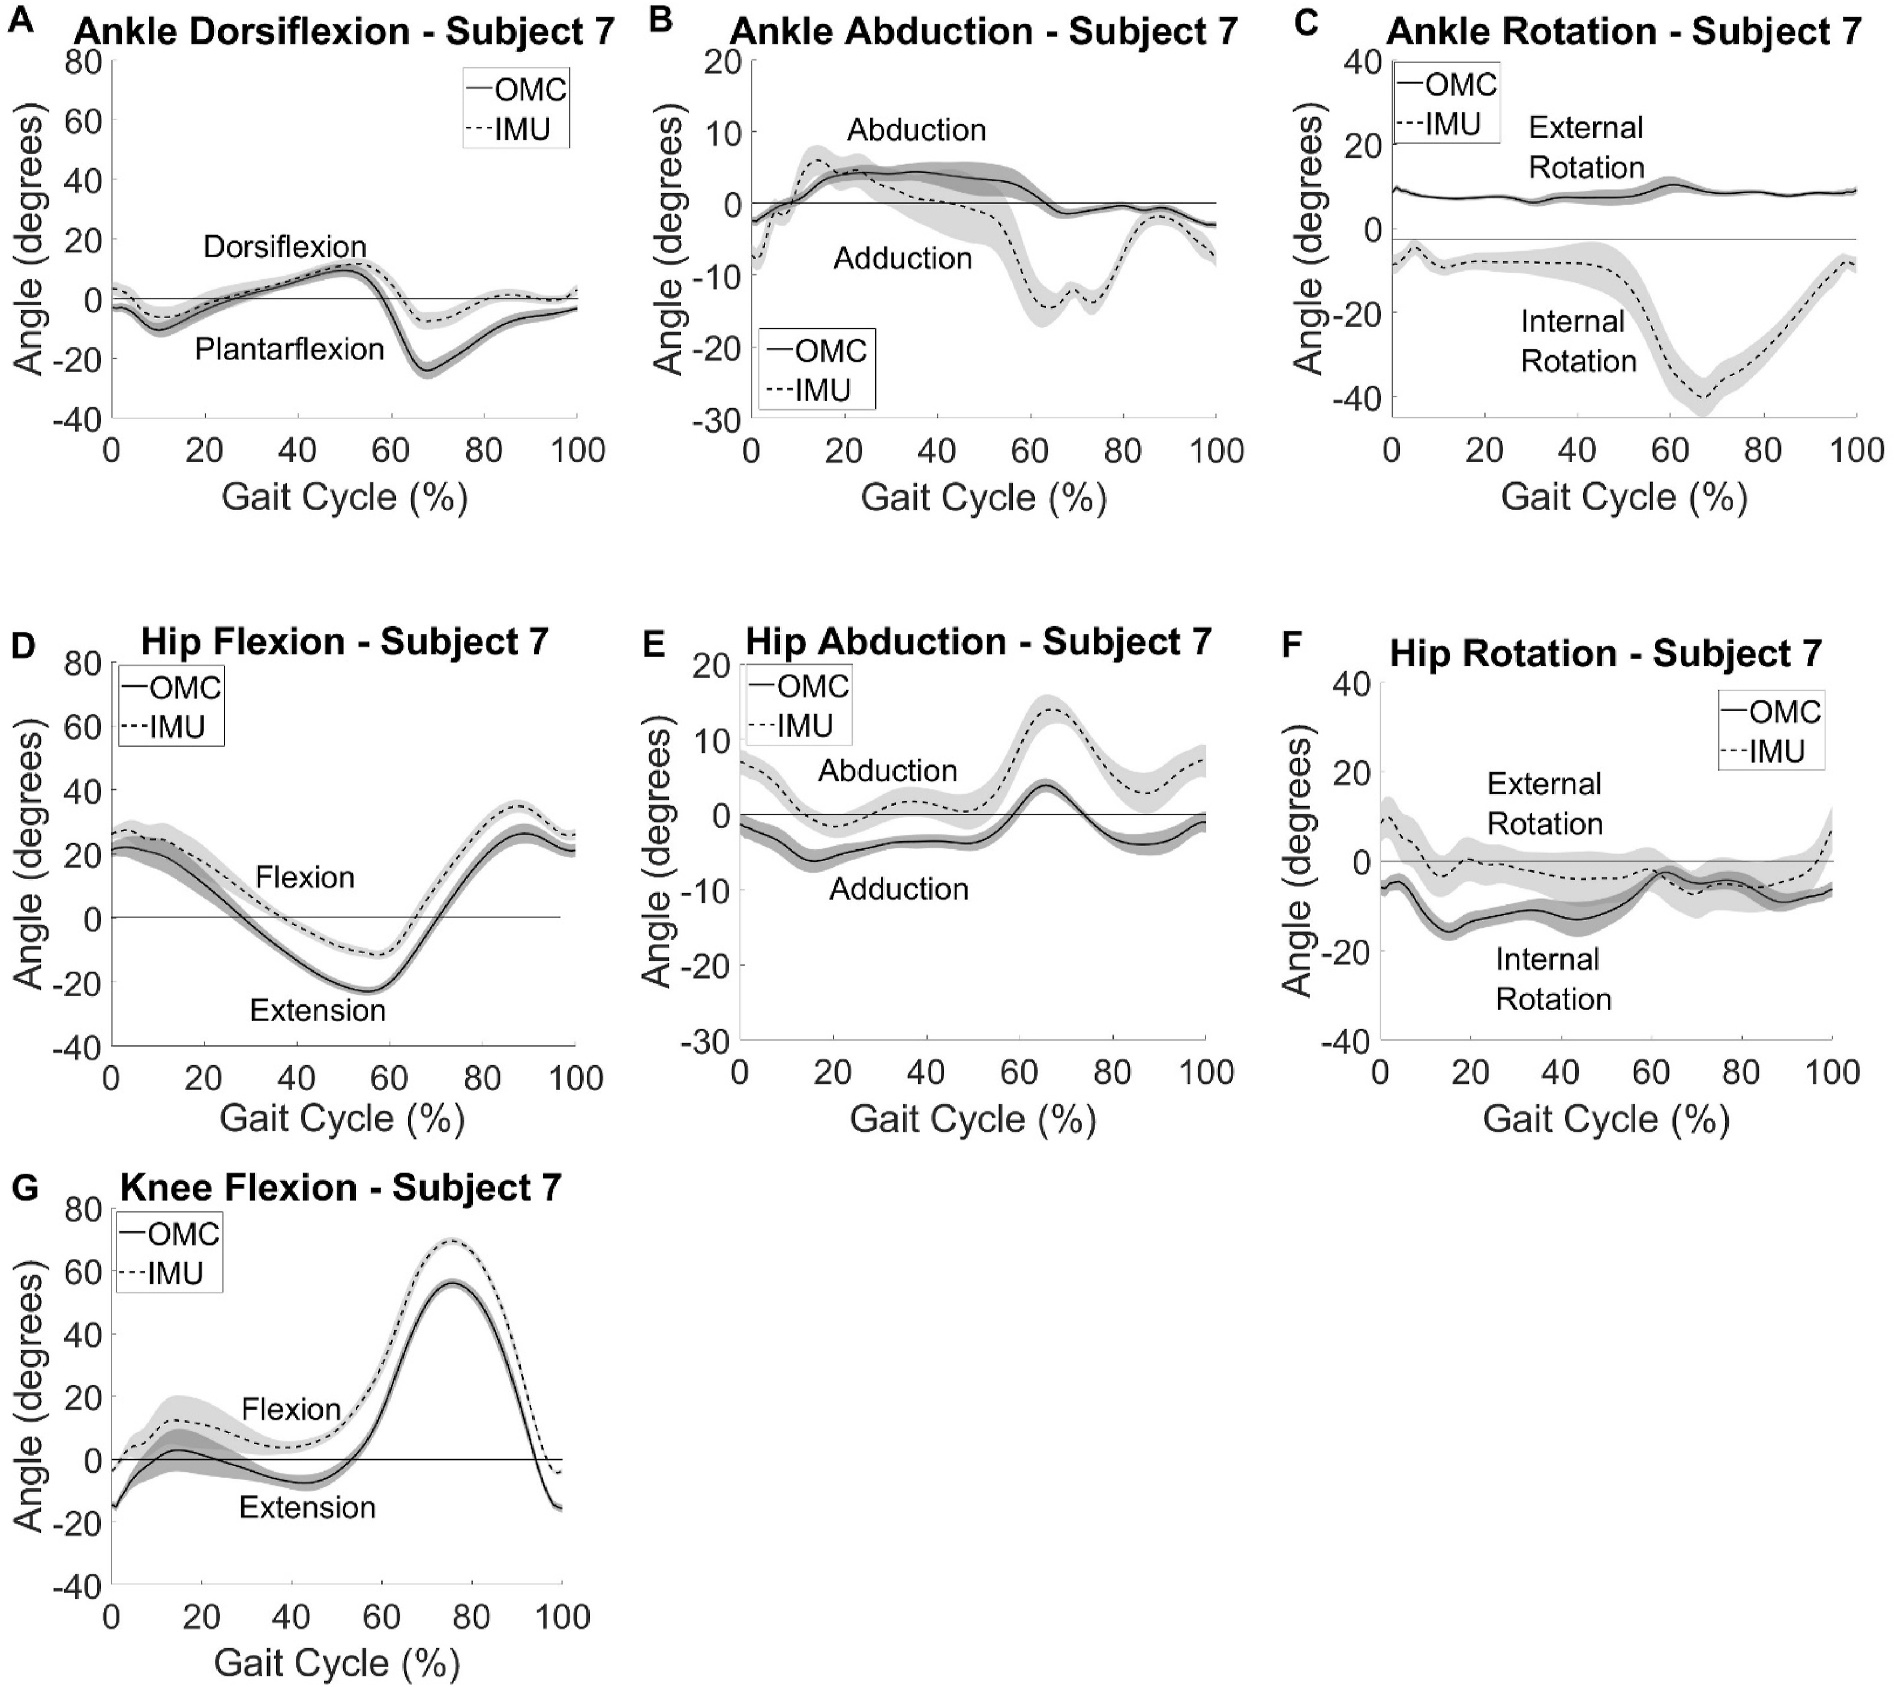
Participant summary curves for IMU (dashed) kinematic outputs compared with the gold standard OMC (solid) vs % gait cycle. A typical participant with poor agreement between the two systems is provided. Curves represent average kinematics across 15 gait cycles and shaded areas are ± one standard deviation.
3.2. System summary
System summary kinematics averaged across all participants and gait cycles for both systems is shown in Fig. 4. Consistent with what was seen at the individual level, agreement between systems is greatest in the sagittal plane, indicated by similar curve shapes and minimal offset. Again, axis mixing in IMU kinematics was observed for the ankle as was seen in the participant plots. Differences in spread of the data, as measured with standard deviations, were also seen. These differences varied in magnitude depending on the angle measured, the time point in the gait cycle, and the system used. Of note, no direct increase in data variability was observed with larger angle magnitude. IMU data had wider spread and larger variances than OMC data across all outcomes calculated as can be seen by the wider shaded areas on Fig. 4.
Fig. 4.
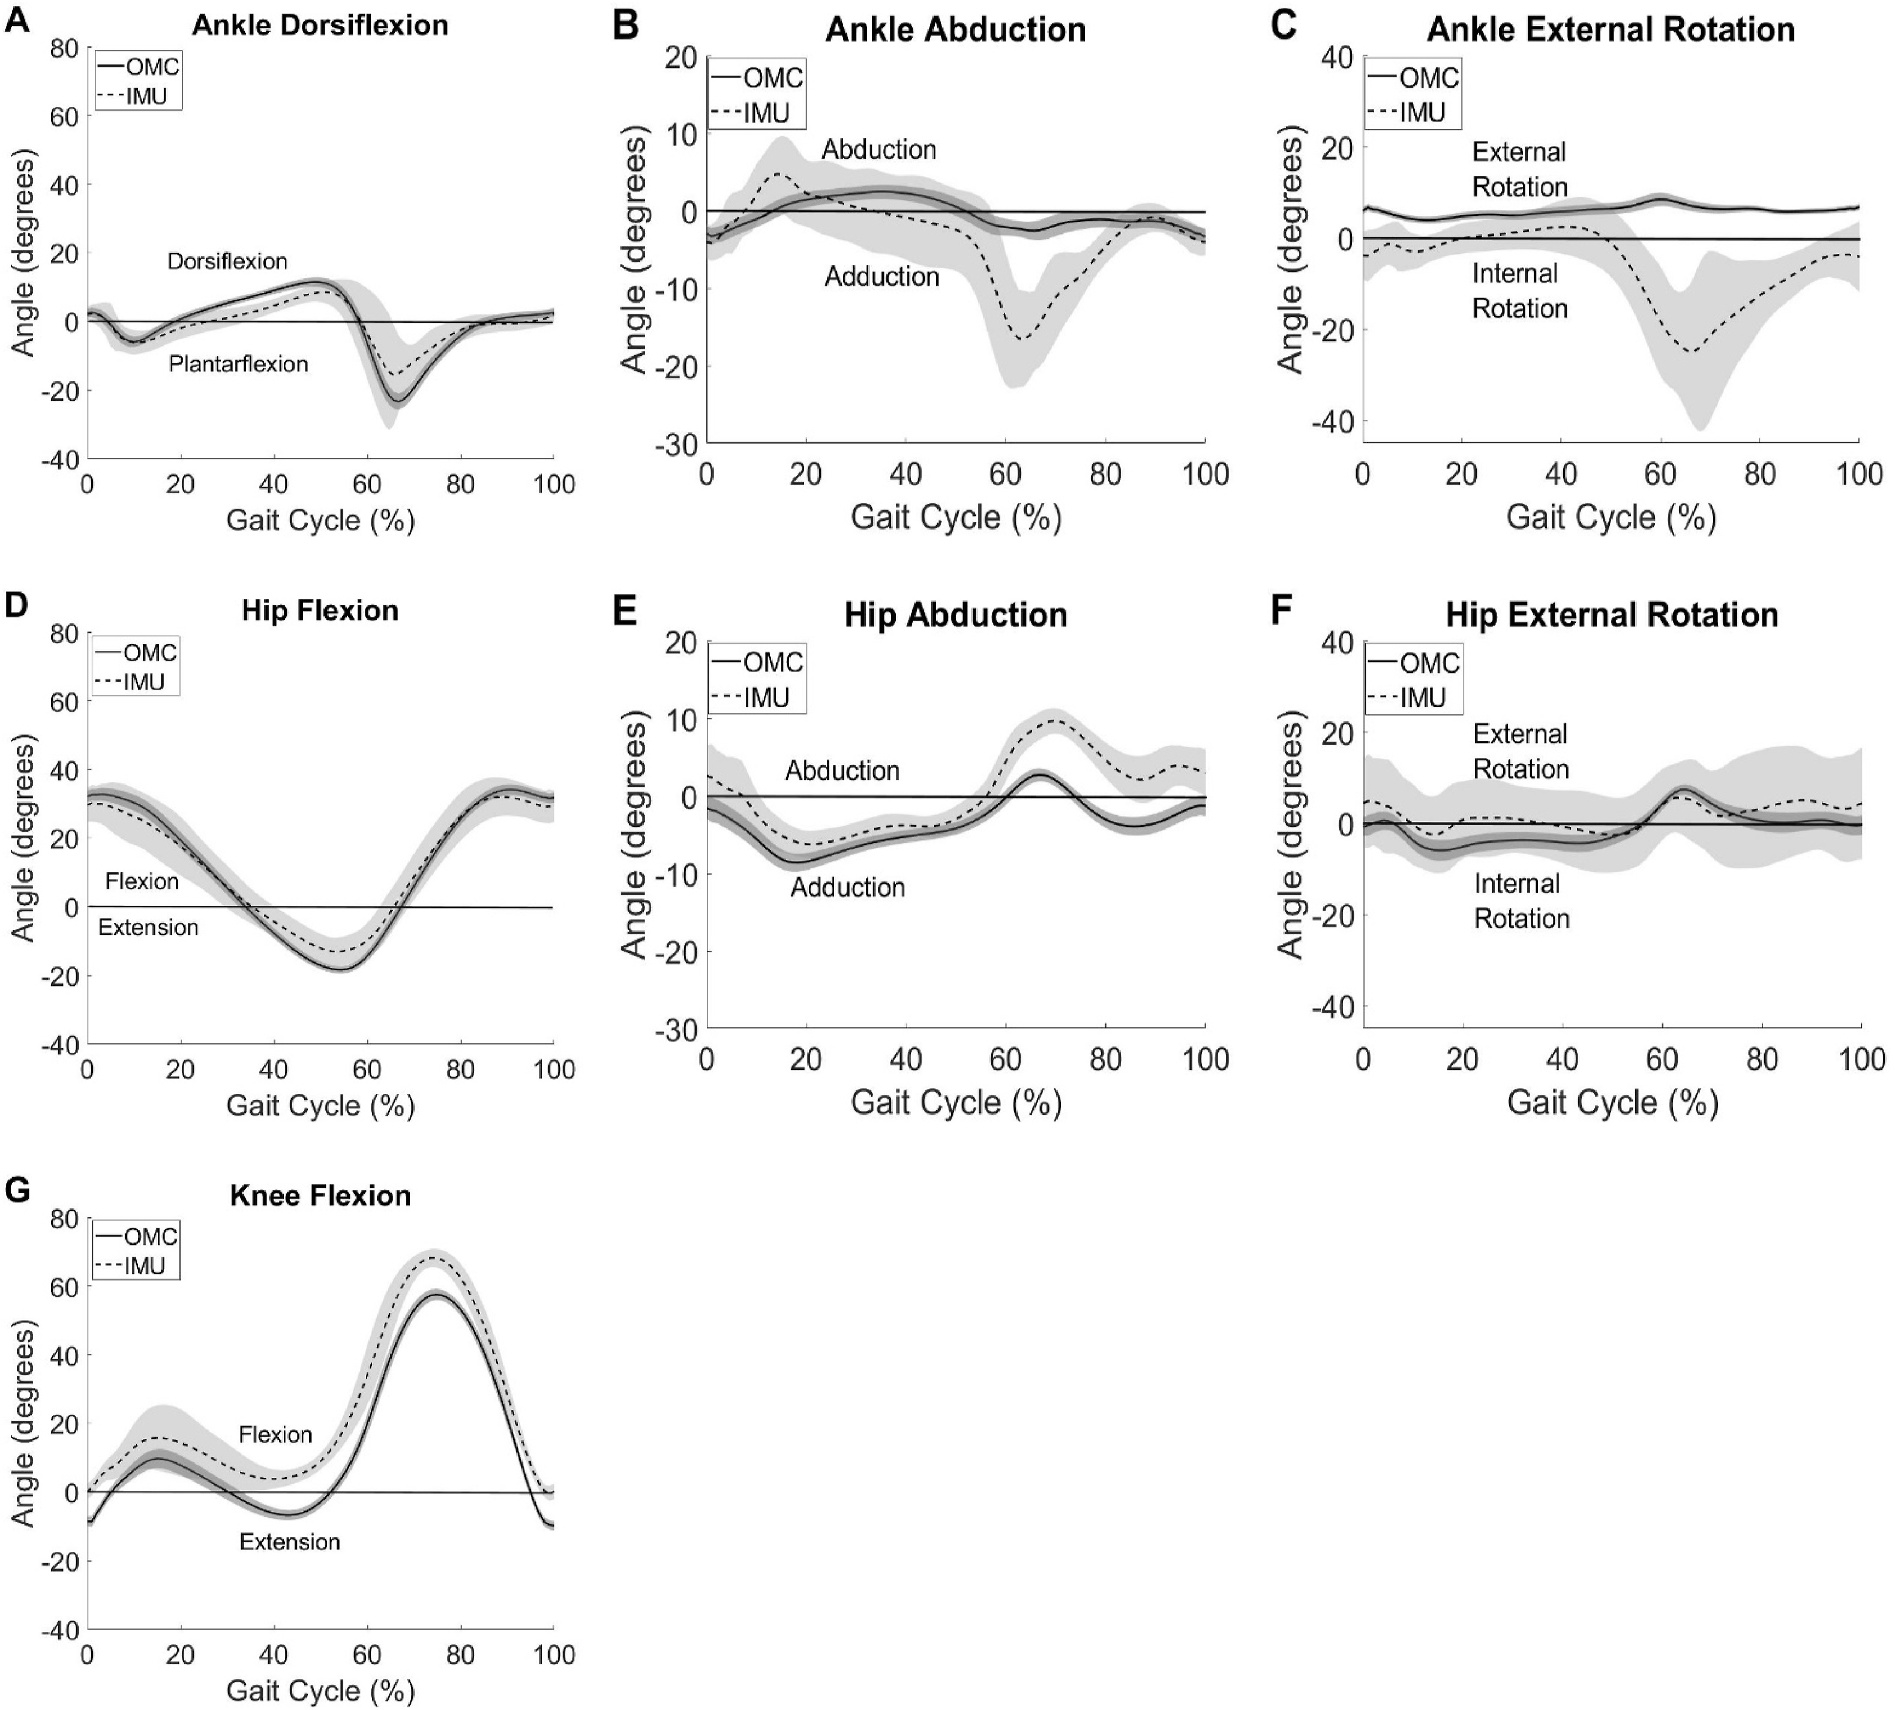
Group summary kinematics for ankle dorsiflexion (A), abduction (B), and external rotation (C), hip flexion (D), abduction (E), and external rotation (F), and knee flexion (G) for IMU (dashed) and OMC (solid) with ± 1 standard deviation in the shaded area.
3.3. System differences
Averaged differences across all participants for the seven kinematic outcomes can be seen in Fig. 5. Sagittal plane angles consistently had the greatest similarities in kinematics when compared to the other planes (Table 1, Figs. 2–4) and agreement between OMC and IMU is generally good in the sagittal plane over most intervals of the gait cycle (Figs. 4 and 5). However, the interclass correlations between measurements from the two systems at clinically meaningful, pre-specified time points in the gait cycle (Table 2) revealed that associations were mostly trivial in strength (ρ < 0.15) or even negative. Furthermore, correlations were only modest at best at the maximum ankle dorsiflexion and knee flexion angles (ρ = 0.417 and 0.509, respectively). Such lack of consistency at clinically critical time points casts doubt on the potential exchangeability of the systems. Additionally, visual inspection of Fig. 5 reveals that the axis mixing in the signal appears to dominate the error observed in the frontal and transverse planes at the ankle. Otherwise, the ensemble differences are at or near zero degrees with some variation in the differences throughout the gait cycle.
Fig. 5.
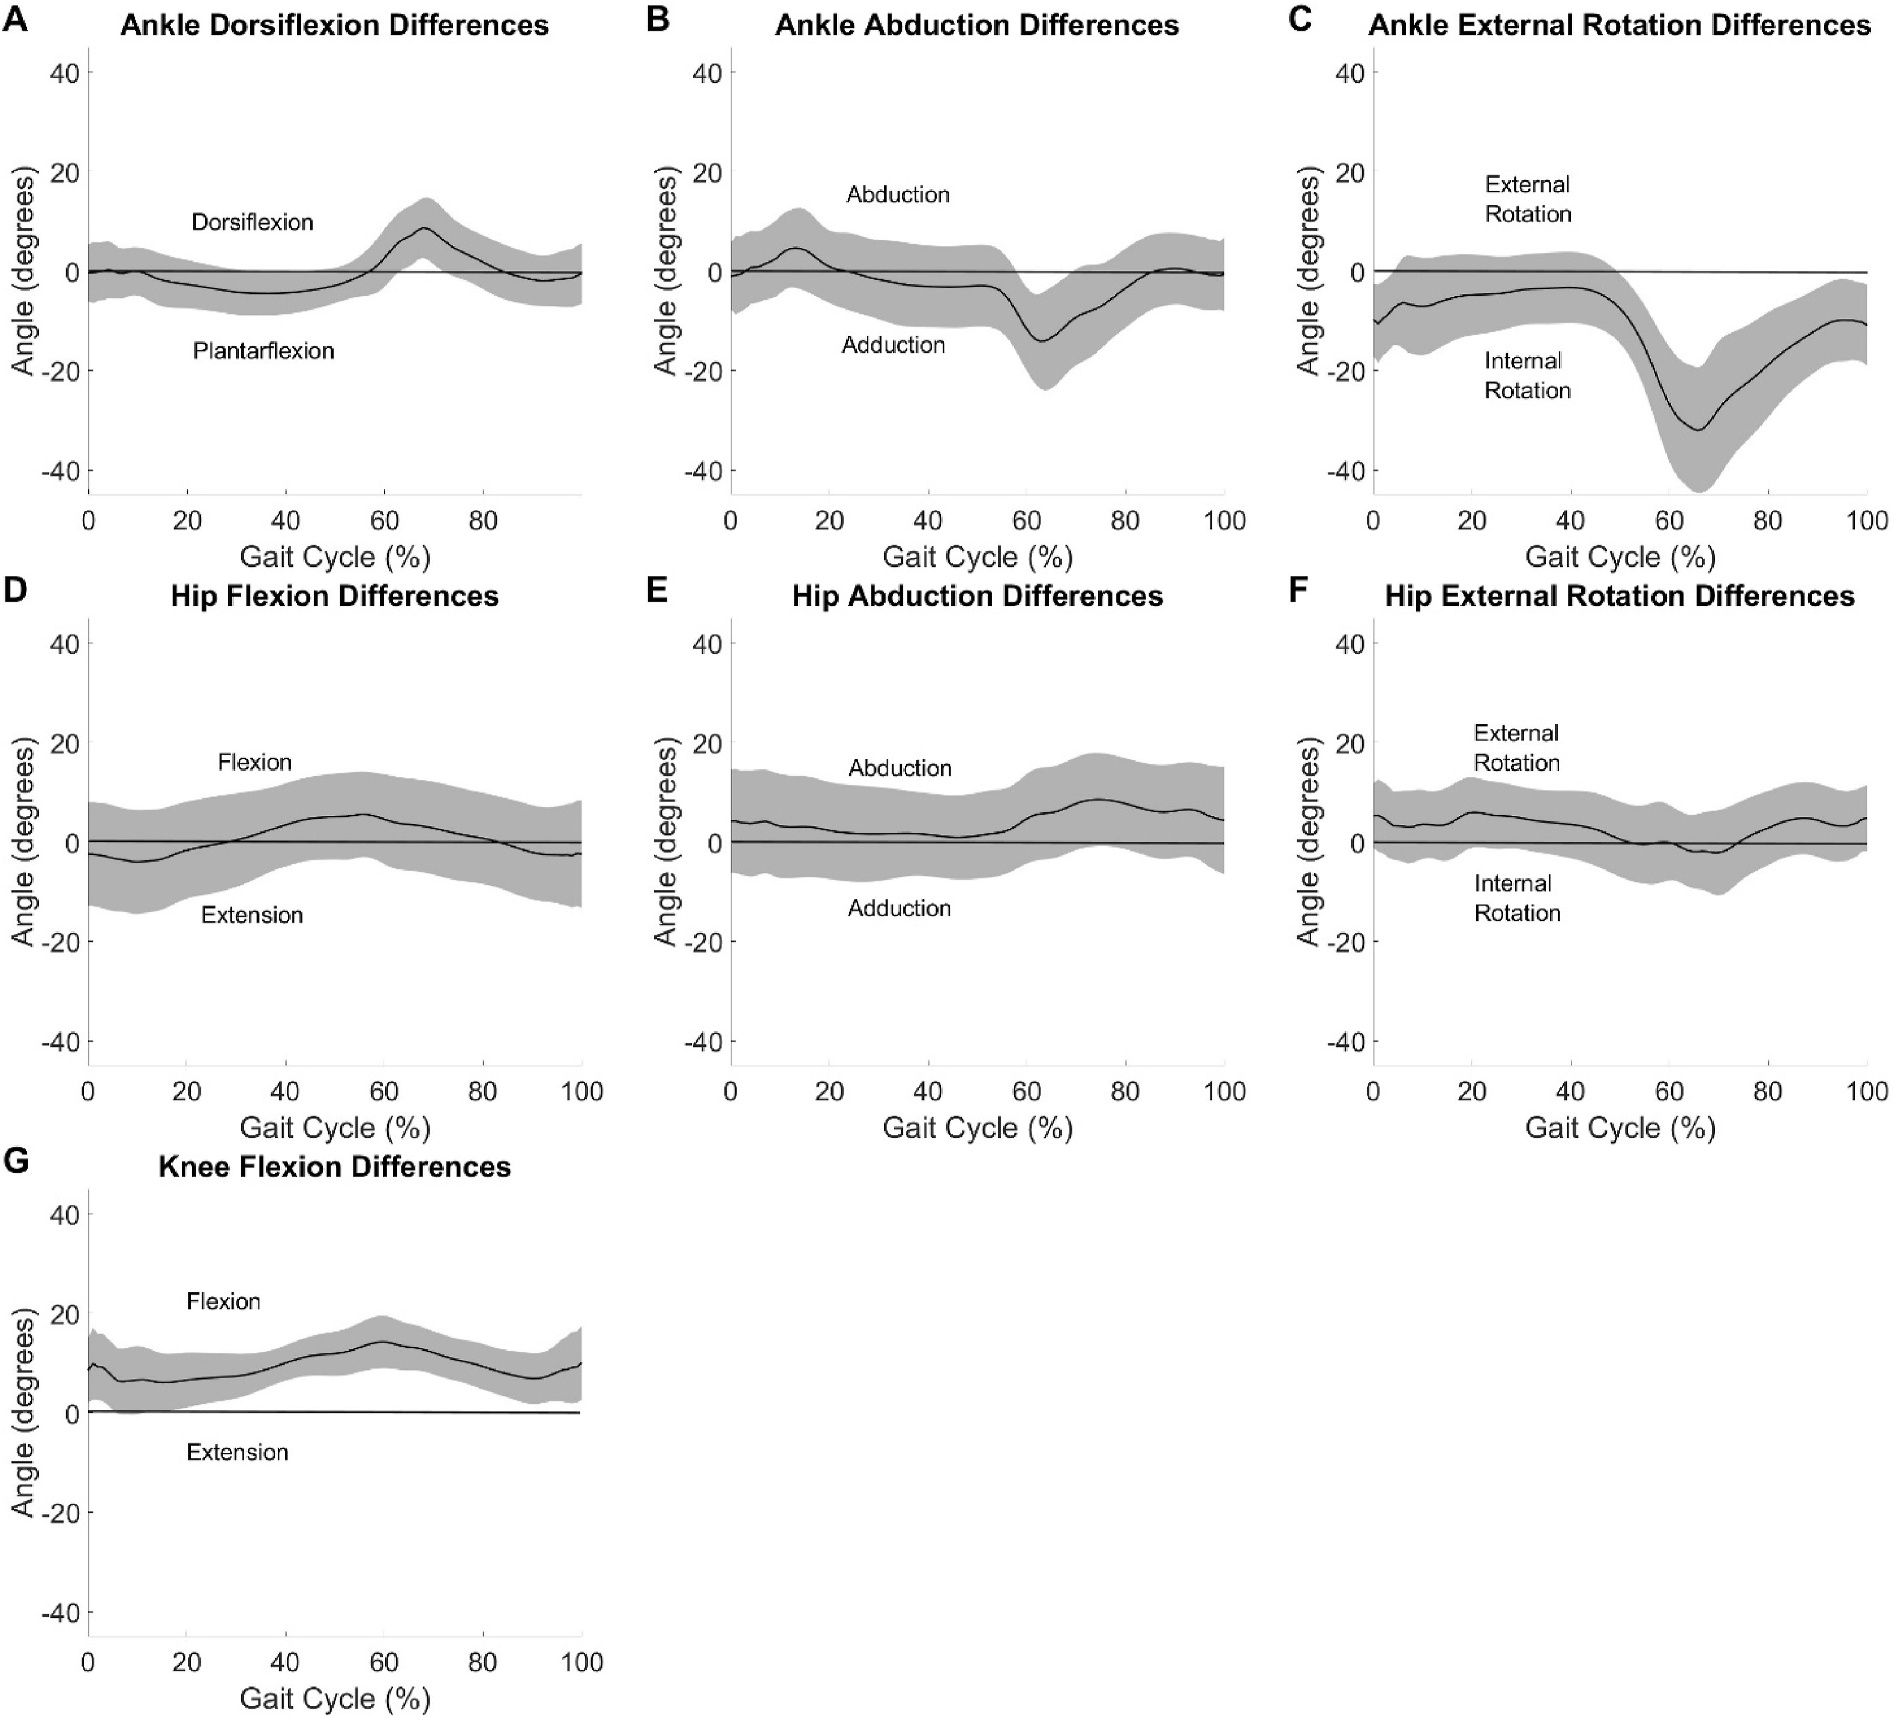
System differences between IMU and OMC averaged all participants with ± 1 standard deviation in the shaded area displayed.
Table 2.
Interclass correlation coefficients (ρ) between OMC and IMU sagittal plane angles at time points of interest in the gait cycle.
| Timepoint |
|||
|---|---|---|---|
| Heel Strike | Maximum/Minimum | ||
|
| |||
| Motion | Ankle Dorsiflexion | 0.106 | 0.417 |
| Hip Flexion | −0.132 | 0.097 | |
| Knee Flexion | 0.143 | 0.509 | |
3.4. Clinical relevance
Bland Altman plots can be seen in Fig. 6 displaying differences between the two systems as a function of the average of the angles at each timepoint in the gait cycles. The line of equality is also displayed on the plots in Fig. 6 with a banded area representing a 5° window around this value. The line of equality was near zero for ankle dorsiflexion, hip flexion, hip rotation, ankle abduction, and hip abduction with values of −0.55°, 0.60°, 2.62°, −2.78°, 3.99° respectively. The line of equality, average of differences between systems, was farther from zero, indicating a possible bias in how the IMU system measured joint angles compared to OMC, for knee flexion, 9.35°, and ankle rotation, −12.12°. Relative to this potential bias, all data can be seen to fall outside the 5° window for at least some average angle values.
Fig. 6.
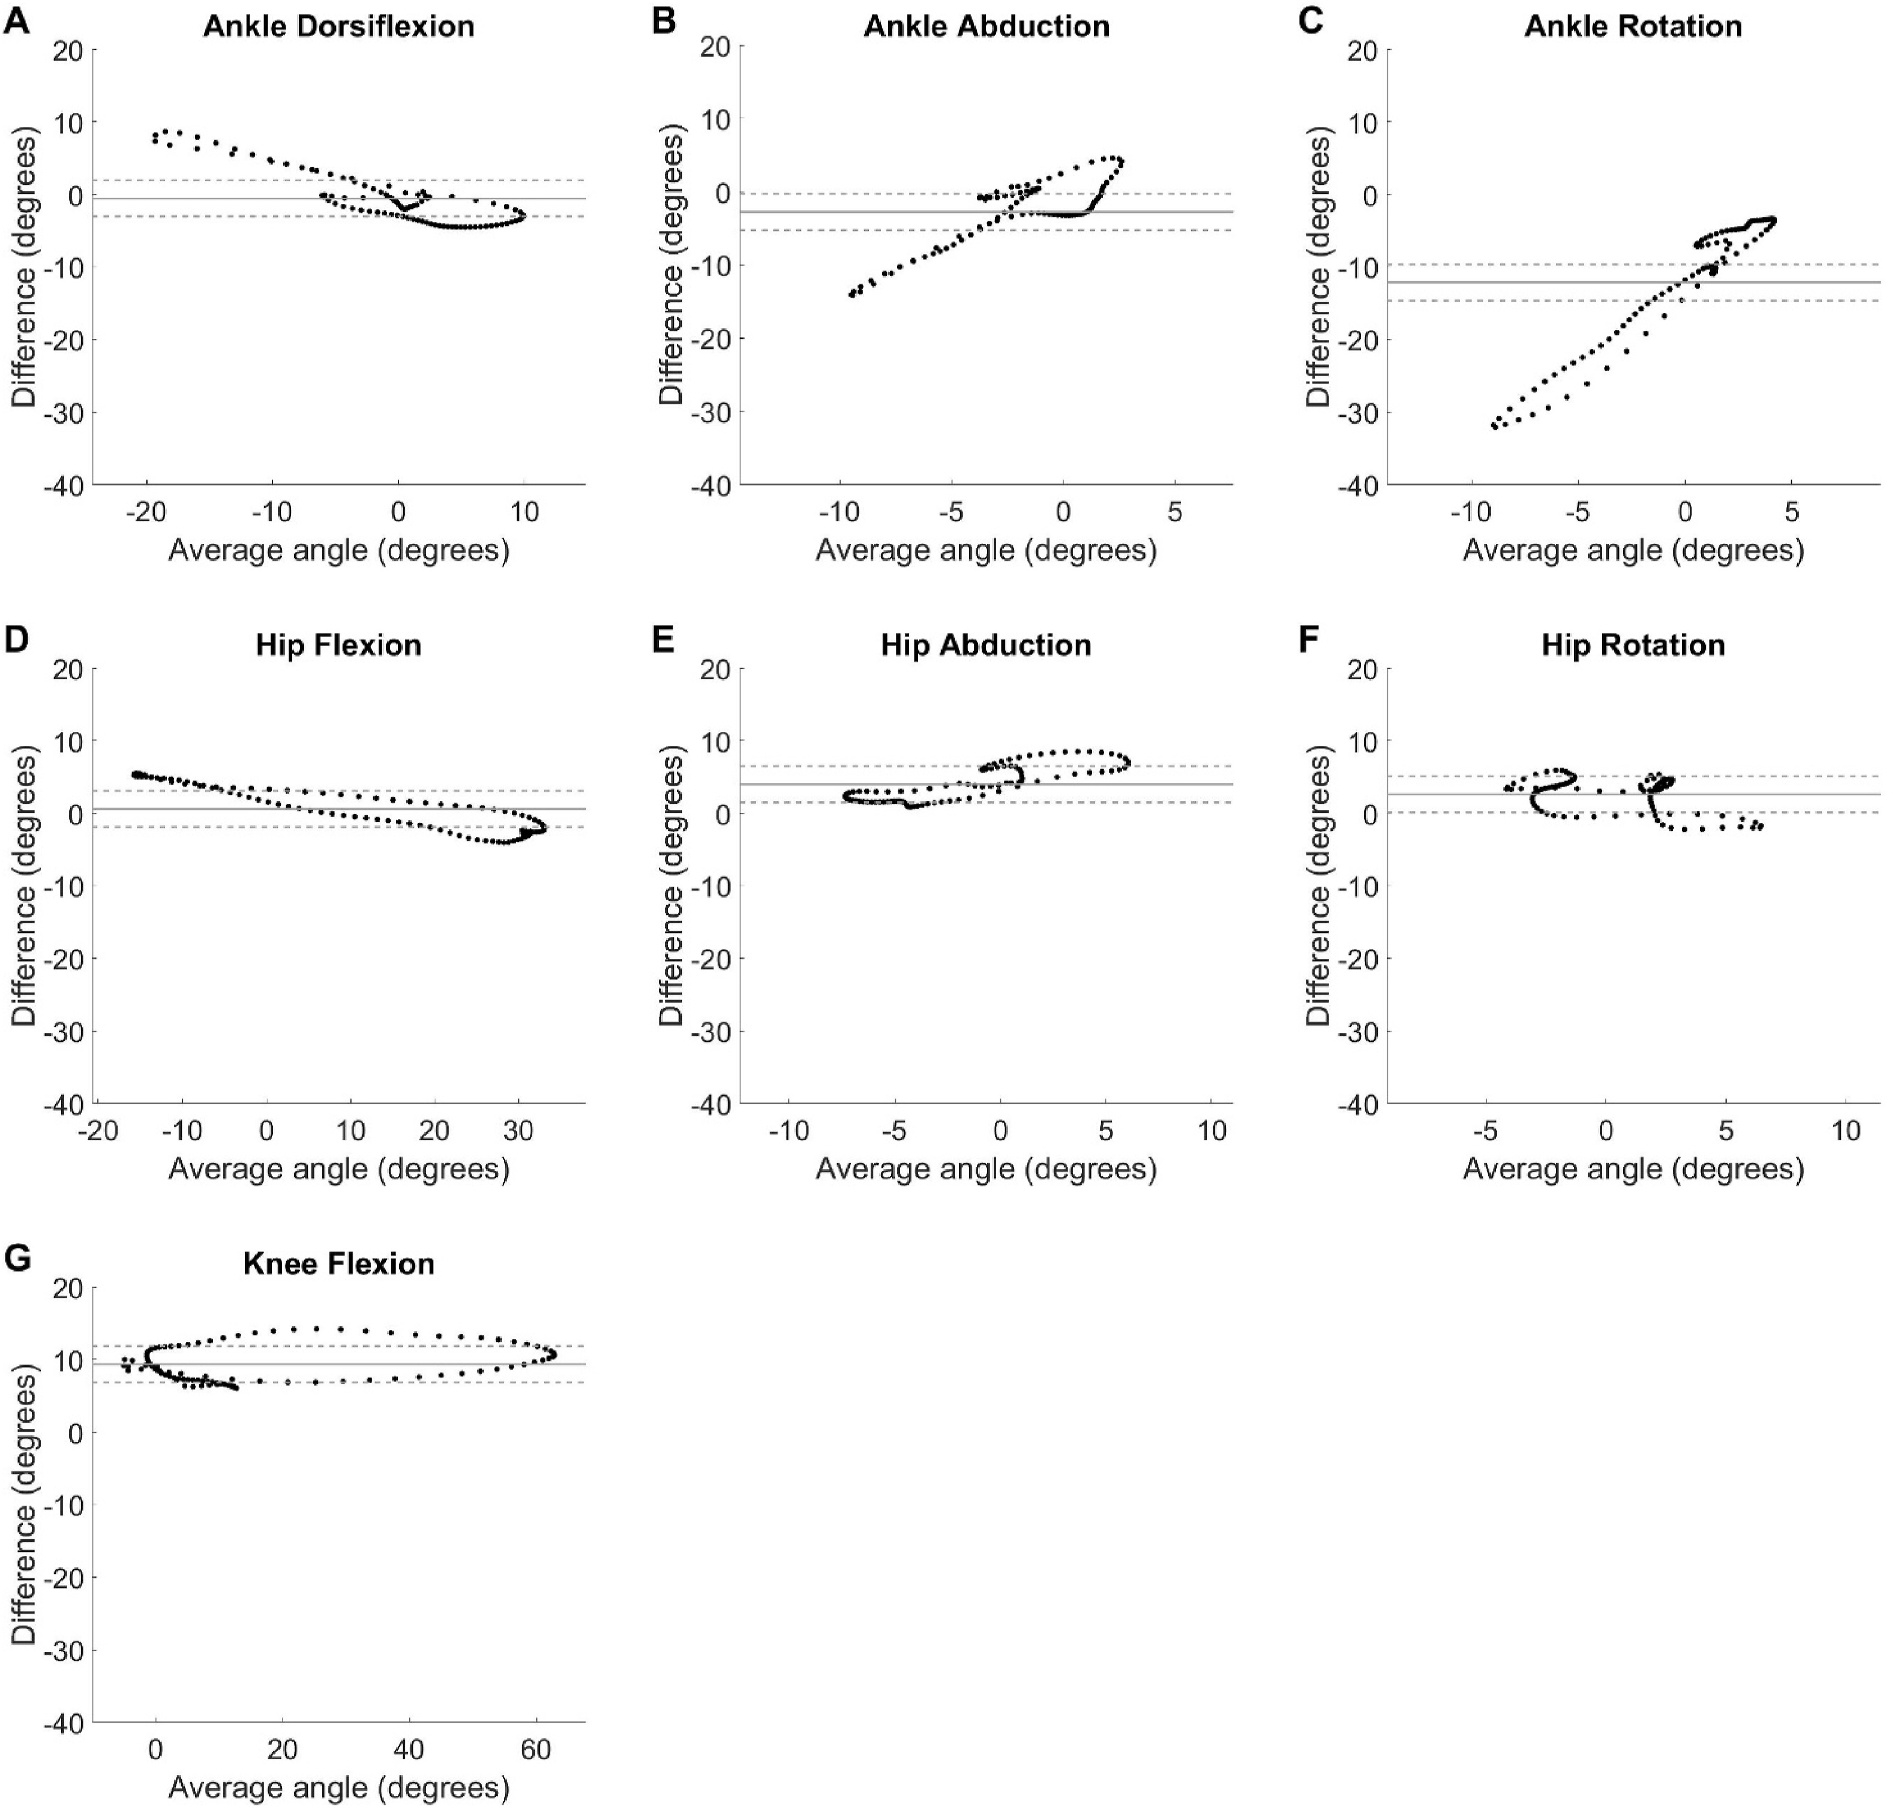
Bland Altman plots with average angle between the IMU and OMC systems on the x-axis and difference between the angles calculated by each system on the y-axis for each timepoint in the gait cycle, averaged across all participants for ankle dorsiflexion (A), abduction (B), and external rotation (C), hip flexion (D), abduction (E), and external rotation (F), and knee flexion (G). Agreement between the two systems was assessed by comparing the line of equality, represented with a solid horizontal line, to 0°. The measurements were considered acceptable if the differences fell within a 5° window, represented by dashed lines, around the line of equality for each motion measured.
4. Discussion
The primary goal of this analysis was to evaluate agreement, bias, and acceptability of lower-extremity joint angles calculated with the IMU-based Noraxon system compared with Vicon OMC when using a single calibration file applied to all IMU trials. Agreement between the kinematic outputs from the IMU system and the gold standard OMC was better for some participants than for others but was consistently the highest in the sagittal plane. The variability in agreement between systems across participants raises a concern for how reliably the Noraxon IMU system can be used across participants and visits.
Across all participants, agreement was generally good between motion capture systems in the sagittal plane and system summary measurements showed better agreement at the hip than at the knee or ankle. However, substantial differences between systems were observed at critical time points in the gait cycle, as evinced by their low interclass correlation coefficients. The difference in kinematic outputs at these clinically important timepoints in the gait cycle [23,24] raise concern for the usefulness of the IMU motion capture system for identifying pathological gait and/or predicting injury risk. There is some evidence of a systematic offset between the measurement systems for hip flexion, though the greatest bias was present at ankle rotation, approximately 12°, followed by knee flexion, approximately 10°. In contrast, Berner et al. [13] found a small bias in knee flexion, 3°, measurements between the IMU and OMC systems, but larger systematic biases in hip flexion, −7.9°, and ankle dorsiflexion, −5.8°. The same group did not analyze ankle rotation because of the unreliability of motion in these planes given the complex non-primary axis motion that occurs at the foot and ankle [13,32]. The results of the current study support this decision. Kinematic profiles in the frontal and transverse planes indicate axis mixing and in the off-sagittal-plane motions may be contributing to the poorer agreement in these planes. A possible explanation for why this axis mixing occurred in the IMU signal at the ankle is related to the complexity of defining the anatomical and functional axes of the ankle joint [33,34]. Static foot and shank posture, which was used as the zero-reference angle during IMU calibration, varies across individuals [35]. Assignment of the ankle axes of motion relative to this calibration may have been partially in the plane of the primary (sagittal) plane axis resulting in mixing of true off-sagittal motion with sagittal plane kinematics. Due to the nature of the hip joint as a simple ball-and-socket joint, this complexity of axis definitions would not have played a part in off-sagittal plane axis mixing. Although the IMU-based kinematics systems may be promising clinical tools because of their affordability, portability, and ease of use for calculating movement biomechanics, the results of this study and those from previous work indicate this technology in its current state should not be used as a direct substitute for OMC motion capture without considering the issues discussed.
Biomechanical outputs from IMU-based kinematic systems should be interpreted with caution. Bland Altman analyses showed differences between systems varied by greater than 5° for at least some angles measured, limiting the usefulness of comparing IMU-calculated kinematics to OMC-based information in the literature. However, certain ranges of angles, especially in the sagittal plane, primarily stayed within the 5° agreement window and may therefore be clinically useful with additional exploration of IMU systems, hip flexion angle 0° to 10°, knee flexion angle <10° or >60°, ankle dorsiflexion angle −5° to 5°. At the systems level, the differences observed may be due to different model assumptions for calculating kinematics from raw position or orientation data. IMU-based kinematics systems use a calibration pose to determine the zero-reference frame for all motions measured afterwards. Other groups have found that a comparison of kinematic outputs is improved when subtracting the joint angles measured with OMC during the calibration pose from the IMU model [13]. This could explain the systematic bias observed in some joints. While it is not feasible to make this correction when utilizing just the IMU based system clinically, mean-centering outputs could reduce this effect and should be explored in future work. The current analysis builds upon the results of Berner et al. with the use of a more robust marker set which improves the accuracy of reference-standard kinematics [36].
Features which can improve the establishment of the reference frame like a functional calibration should be explored to evaluate their effect on reducing bias and disagreement between measurement systems. Acceptability of the measurements for this work, that applied a single calibration file to each trial, was similar to reported data that recalibrated prior to each trial as demonstrated by reported Bland Altman plots [13]. The results of this study indicate a single calibration file can be used without meaningfully impacting the results. However, data fell outside of a 5° window from the line of equality in both analyses, requiring caution to be used when comparing kinematics measured with the IMU system to those published in the literature captured with OMC.
While this project used the ISB convention for calculating joint angles [18,19], the results of this study could have been impacted by this decision. There are many ways to calculate joint angles and estimate joint centers, some of which are more appropriate and/or accurate in different populations. For example, estimating joint centers with a functional calibration or use of an external alignment device have been shown to improve the accuracy of these estimates [37,38]. However, these methods were not used in this analysis. The population of healthy young adults in this study did not have excess adipose tissue causing motion artifacts or inaccurate marker placement and the authors therefore do not expect this was a concern for the present analysis.
A benefit of the IMU-based kinematic system is that it is fairly “plug and play”. The authors completed online trainings and corresponded with the manufacturers to ensure IMU placements were being done as intended. However, it is possible that a more rigorous protocol is needed to standardize the IMU placement and improve consistency across participants. A rigorous protocol for IMU placement and these adjustments for improved accuracy or interpretability of results should be established prior to implementation of this technology into a clinical setting. Future work should explore how the results of this study are impacted when IMU-based systems are used in other populations with different body habitus, such as pregnant women or adults with obesity, and with other functional movements, such as landing from a jump or negotiating stairs.
5. Conclusions
This study sought to understand how lower extremity kinematic outputs from the IMU-based Noraxon system compare with existing gold-standard OMC technology for assessing gait when utilizing a single calibration file applied to all trials. This work found a single calibration performed comparably to repeated calibrations reported in the literature. The authors recommend future work employ just a single calibration file due to the decreased time and effort associated with this. However, accuracy of the IMU system did depend on time in the gait cycle and a subjects’ effect was observed. Kinematics in the sagittal plane performed better than in the frontal and transverse planes, thus future efforts should focus on IMU-based kinematic analysis in this sagittal plane. Transverse plane motion at the ankle was particularly unreliable and can be excluded from future IMU motion capture analyses until their quality is improved. More work must be done to improve the accuracy and consistency of kinematic outputs with the IMU-based motion capture system before they can be responsibly implemented in lieu of OMC technology.
Acknowledgements
The authors would like to thank Brandon Betts for his assistance with data collection.
Funding
This work was supported by the University of Pittsburgh Healthy Lifestyle Institute (Pilot and Feasibility Grant); the University of Pittsburgh Clinical and Translational Science Institue [TL1 Fellowship TR001858].
Abbreviations:
- IMU
Inertial measurement unit
- OMC
Optokinetic motion capture
- BMI
Body mass index
- ISB
International Society of Biomechanics
Footnotes
Declaration of competing interest
The authors declare that they have no known competing financial interests or personal relationships that could have appeared to influence the work reported in this paper.
CRediT authorship contribution statement
Julie Rekant: Conceptualization, Data curation, Formal analysis, Funding acquisition, Investigation, Methodology, Project administration, Visualization, Writing – original draft, Writing – review & editing. Scott Rothenberger: Data curation, Formal analysis, Methodology, Writing – review & editing. April Chambers: Conceptualization, Funding acquisition, Methodology, Supervision, Writing – review & editing.
Data statement
Available upon request.
References
- [1].Cimolin V, Galli M, Summary measures for clinical gait analysis: a literature review, Gait Posture 39 (4) (2014) 1005–1010, 10.1016/j.gaitpost.2014.02.001. [DOI] [PubMed] [Google Scholar]
- [2].Becker J, Nakajima M, Wu WFW, Factors contributing to medial tibial stress syndrome in runners: a prospective study, Med. Sci. Sports Exerc. 50 (10) (2018) 2092–2100, 10.1249/mss.0000000000001674. [DOI] [PubMed] [Google Scholar]
- [3].Kuo AD, Donelan JM, Dynamic principles of gait and their clinical implications, Phys. Ther. 90 (2) (2010) 157–174, 10.2522/ptj.20090125. [DOI] [PMC free article] [PubMed] [Google Scholar]
- [4].Luc-Harkey BA, Harkey MS, Stanley LE, Blackburn JT, Padua DA, Pietrosimone B, Sagittal plane kinematics predict kinetics during walking gait in individuals with anterior cruciate ligament reconstruction, Clin. Biomech. 39 (2016) 9–13, 10.1016/j.clinbiomech.2016.08.011. [DOI] [PubMed] [Google Scholar]
- [5].Fried LP, Bandeen-Roche K, Chaves PH, Johnson BA, Preclinical mobility disability predicts incident mobility disability in older women, J Gerontol A Biol Sci Med Sci 55 (1) (2000) M43–M52, 10.1093/gerona/55.1.m43. [DOI] [PubMed] [Google Scholar]
- [6].Weiss CO, Hoenig HM, Fried LP, Compensatory strategies used by older adults facing mobility disability, Arch. Phys. Med. Rehabil. 88 (9) (2007) 1217–1220, 10.1016/j.apmr.2007.07.007. [DOI] [PubMed] [Google Scholar]
- [7].Weiss CO, Wolff JL, Egleston B, Seplaki CL, Fried LP, Incident preclinical mobility disability (PCMD) increases future risk of new difficulty walking and reduction in walking activity, Arch. Gerontol. Geriatr. 54 (3) (2012) e329–333, 10.1016/j.archger.2011.08.018. [DOI] [PMC free article] [PubMed] [Google Scholar]
- [8].Chen S, Lach J, Lo B, Yang G, Toward pervasive gait analysis with wearable sensors: a systematic review, IEEE J. Biomed. Health Informat. 20 (6) (2016) 1521–1537, 10.1109/JBHI.2016.2608720. [DOI] [PubMed] [Google Scholar]
- [9].Cuesta-Vargas AI, Galán-Mercant A, Williams JM, The use of inertial sensors system for human motion analysis, Phys. Ther. Rev. 15 (6) (2010) 462–473, 10.1179/1743288X11Y.0000000006. [DOI] [PMC free article] [PubMed] [Google Scholar]
- [10].de Bruin ED, Hartmann A, Uebelhart D, Murer K, Zijlstra W, Wearable systems for monitoring mobility-related activities in older people: a systematic review, Clin. Rehabil. 22 (10–11) (2008) 878–895, 10.1177/0269215508090675. [DOI] [PubMed] [Google Scholar]
- [11].Fong DT-P, Chan Y-Y, The use of wearable inertial motion sensors in human lower limb biomechanics studies: a systematic review, Sensors 10 (12) (2010) 11556–11565. Retrieved from, https://www.mdpi.com/1424-8220/10/12/11556. [DOI] [PMC free article] [PubMed] [Google Scholar]
- [12].Tao W, Liu T, Zheng R, Feng H, Gait analysis using wearable sensors, Sensors 12 (2) (2012) 2255–2283. Retrieved from, https://www.mdpi.com/1424-8220/12/2/2255. [DOI] [PMC free article] [PubMed] [Google Scholar]
- [13].Berner K, Cockcroft J, Morris LD, Louw Q, Concurrent validity and within-session reliability of gait kinematics measured using an inertial motion capture system with repeated calibration, J. Bodyw. Mov. Ther. 24 (4) (2020) 251–260, 10.1016/j.jbmt.2020.06.008. [DOI] [PubMed] [Google Scholar]
- [14].Ferrari A, Benedetti MG, Pavan E, Frigo C, Bettinelli D, Rabuffetti M, Leardini A, Quantitative comparison of five current protocols in gait analysis, Gait Posture 28 (2) (2008) 207–216, 10.1016/j.gaitpost.2007.11.009. [DOI] [PubMed] [Google Scholar]
- [15].Seidel DH, D’Souza SF, Alt WW, Wachowsky M, Comparison of an inertial sensor based motion measurement system with a 3D-reflex marker based motion capture system, Gait Posture 42 (2015) S75, 10.1016/j.gaitpost.2015.06.139. [DOI] [Google Scholar]
- [16].Lerner ZF, Board WJ, Browning RC, Effects of an obesity-specific marker set on estimated muscle and joint forces in walking, Med. Sci. Sports Exerc. 46 (6) (2014) 1261–1267, 10.1249/mss.0000000000000218. [DOI] [PubMed] [Google Scholar]
- [17].Jasiewicz JM, Allum JH, Middleton JW, Barriskill A, Condie P, Purcell B, Li RC, Gait event detection using linear accelerometers or angular velocity transducers in able-bodied and spinal-cord injured individuals, Gait Posture 24 (4) (2006) 502–509, 10.1016/j.gaitpost.2005.12.017. [DOI] [PubMed] [Google Scholar]
- [18].Grood ES, Suntay WJ, A joint coordinate system for the clinical description of three-dimensional motions: application to the knee, J. Biomech. Eng. 105 (2) (1983) 136–144, 10.1115/1.3138397. [DOI] [PubMed] [Google Scholar]
- [19].Wu G, Siegler S, Allard P, Kirtley C, Leardini A, Rosenbaum D, Stokes I, ISB recommendation on definitions of joint coordinate system of various joints for the reporting of human joint motion-part I: ankle, hip, and spine. International Society of Biomechanics, J. Biomech. 35 (4) (2002) 543–548, 10.1016/s0021-9290(01)00222-6. [DOI] [PubMed] [Google Scholar]
- [20].Fettrow T, DiBianca S, Vanderlinde dos Santos F, Reimann H, Jeka J, Flexible recruitment of balance mechanisms to environmental constraints during walking, Front Virt Real 1 (5) (2020), 10.3389/frvir.2020.00005. [DOI] [Google Scholar]
- [21].Ferrari A, Cutti AG, Cappello A, A new formulation of the coefficient of multiple correlation to assess the similarity of waveforms measured synchronously by different motion analysis protocols, Gait Posture 31 (4) (2010) 540–542, 10.1016/j.gaitpost.2010.02.009. [DOI] [PubMed] [Google Scholar]
- [22].Pagnon D, Domalain M, Reveret L, Pose2Sim: an end-to-end workflow for 3D markerless sports kinematics-Part 2: accuracy, Sensors 22 (7) (2022) 2712, 10.3390/s22072712. [DOI] [PMC free article] [PubMed] [Google Scholar]
- [23].Ginis P, Pirani R, Basaia S, Ferrari A, Chiari L, Heremans E, Nieuwboer A, Focusing on heel strike improves toe clearance in people with Parkinson’s disease: an observational pilot study, Physiotherapy 103 (4) (2017) 485–490, 10.1016/j.physio.2017.05.001. [DOI] [PubMed] [Google Scholar]
- [24].Kaufman KR, Hughes C, Morrey BF, Morrey M, An KN, Gait characteristics of patients with knee osteoarthritis, J. Biomech. 34 (7) (2001) 907–915, 10.1016/s0021-9290(01)00036-7. [DOI] [PubMed] [Google Scholar]
- [25].Shan G, Zhang H, Jiang T, Correlation coefficients for a study with repeated measures, Comput. Math. Methods Med. 2020 (2020). [DOI] [PMC free article] [PubMed] [Google Scholar]
- [26].Hamlett A, Ryan L, Wolfinger R, On the use of PROC MIXED to estimate correlation in the presence of repeated measures. SAS Users Group International, in: Proceedings of the Statistics and Data Analysis Section, 2004, pp. 1–7. [Google Scholar]
- [27].Morrow MMB, Lowndes B, Fortune E, Kaufman KR, Hallbeck MS, Validation of inertial measurement units for upper body kinematics, J. Appl. Biomech. 33 (3) (2017) 227–232, 10.1123/jab.2016-0120. [DOI] [PMC free article] [PubMed] [Google Scholar]
- [28].Teufl W, Miezal M, Taetz B, Fröhlich M, Bleser G, Validity of inertial sensor based 3D joint kinematics of static and dynamic sport and physiotherapy specific movements, PLoS One 14 (2) (2019), e0213064, 10.1371/journal.pone.0213064e0213064. [DOI] [PMC free article] [PubMed] [Google Scholar]
- [29].Altman DG, Bland JM, Measurement in medicine: the analysis of method comparison studies, J. R. Stat. Soc. - Ser. D Statistician 32 (3) (1983) 307–317, 10.2307/2987937. [DOI] [Google Scholar]
- [30].Giavarina D, Understanding Bland altman analysis, Biochem. Med. 25 (2) (2015) 141–151, 10.11613/BM.2015.015. [DOI] [PMC free article] [PubMed] [Google Scholar]
- [31].McGinley JL, Baker R, Wolfe R, Morris ME, The reliability of three-dimensional kinematic gait measurements: a systematic review, Gait Posture 29 (3) (2009) 360–369, 10.1016/j.gaitpost.2008.09.003. [DOI] [PubMed] [Google Scholar]
- [32].Della Croce U, Leardini A, Chiari L, Cappozzo A, Human movement analysis using stereophotogrammetry. Part 4: assessment of anatomical landmark misplacement and its effects on joint kinematics, Gait Posture 21 (2) (2005) 226–237, 10.1016/j.gaitpost.2004.05.003. [DOI] [PubMed] [Google Scholar]
- [33].Lenz AL, Strobel MA, Anderson AM, Fial AV, MacWilliams BA, Krzak JJ, Kruger KM, Assignment of local coordinate systems and methods to calculate tibiotalar and subtalar kinematics: a systematic review, J. Biomech. 120 (2021), 110344, 10.1016/j.jbiomech.2021.110344. [DOI] [PubMed] [Google Scholar]
- [34].Montefiori E, Fiifi Hayford C, Mazzà C, Variations of lower-limb joint kinematics associated with the use of different ankle joint models, J. Biomech. 136 (2022), 111072, 10.1016/j.jbiomech.2022.111072. [DOI] [PubMed] [Google Scholar]
- [35].Oatis CA, Biomechanics of the foot and ankle under static conditions, Phys. Ther. 68 (12) (1988) 1815–1821, 10.1093/ptj/68.12.1815. [DOI] [PubMed] [Google Scholar]
- [36].Szczerbik E, Kalinowska M, The influence of knee marker placement error on evaluation of gait kinematic parameters, Acta Bioeng. Biomech. 13 (3) (2011) 43–46. [PubMed] [Google Scholar]
- [37].Besier TF, Sturnieks DL, Alderson JA, Lloyd DG, Repeatability of gait data using a functional hip joint centre and a mean helical knee axis, J. Biomech. 36 (8) (2003) 1159–1168, 10.1016/s0021-9290(03)00087-3. [DOI] [PubMed] [Google Scholar]
- [38].Schache AG, Baker R, Lamoreux LW, Defining the knee joint flexion-extension axis for purposes of quantitative gait analysis: an evaluation of methods, Gait Posture 24 (1) (2006) 100–109, 10.1016/j.gaitpost.2005.08.002. [DOI] [PubMed] [Google Scholar]
Associated Data
This section collects any data citations, data availability statements, or supplementary materials included in this article.
Data Availability Statement
Available upon request.


